Abstract
Hydraulic fracturing is a key stimulation technique for enhancing the productivity of tight sandstone reservoirs, with the conductivity of propped fractures serving as a critical parameter for evaluating stimulation effectiveness. This study investigated the conductivity behavior of propped fractures through laboratory experiments using commonly used oilfield proppants. The effects of proppant size, type, concentration, and proppant combination on fracture conductivity were systematically evaluated. Results show that at low closure stress, conductivity differences among various proppant types are negligible. However, under high closure stress, proppants with lower compressive strength exhibit significantly higher crushing rates, resulting in reduced conductivity compared to high-strength proppants. In mixtures of silica sand and ceramic proppant proppants, increasing the ceramic content lowers the overall crushing rate and mitigates conductivity degradation. Additionally, blending proppants of different sizes under high stress reduces breakage, with finer particles contributing to this effect. Higher proppant concentrations also lead to lower crushing rates and improved fracture conductivity. This work provides valuable insights into optimizing proppant selection and design for reservoir stimulation and oil and gas recovery.
1. Introduction
In recent years, the depletion of recoverable reserves in conventional oil and gas fields has prompted a global shift toward the exploration and exploitation of unconventional reservoirs. Among these, tight sandstone formations have attracted significant interest due to their considerable resource potential. Assorted laboratory studies and field tests have been conducted to enhance the hydrocarbon production from tight formations [1,2,3]. Nevertheless, the commercial development of tight sandstone reservoirs presents substantial technical challenges, primarily due to their inherently low permeability, small pore-throat radii, and limited natural productivity [4,5]. To address these limitations, hydraulic fracturing has become an indispensable technology for enhancing reservoir performance. This stimulation method improves hydrocarbon mobility by generating artificial fractures and introducing proppant-laden fluids to maintain fracture openness and ensure sustained conductivity [6,7]. The effect of reservoir stimulation can be evaluated by the conductivity of the propped fracture [8,9]. The degree of conductivity improvement is directly correlated with stimulation success, which in turn governs hydrocarbon recovery and economic returns. Numerous factors influence fracture conductivity, among which proppant characteristics are particularly decisive for maintaining long-term fracture integrity [10,11,12,13,14,15]. Therefore, in-depth investigation on the performance of proppants under closure stress is crucial to the optimization of hydraulic fracturing design and enhance production efficiency. Silica sand is considered as the most commonly used proppant, which has relatively lower cost but suffers from low compressive strength, rendering it susceptible to mechanical failure under reservoir stress conditions [16,17,18]. In contrast, ceramic proppants that are synthesized through high-temperature sintering of alumina demonstrate superior mechanical strength and conductivity retention under elevated stress [16,18,19,20,21]. Resin-coated proppants has relatively high chemical and thermal resistance as well as crush resistance [18,22,23,24].
The key challenge on the performance of proppants crushing under closure stress, manifesting as particle breakage and fines generation posing a critical threat to fracture conductivity by blocking flow pathways [25,26,27]. Previous studies have examined the impact of proppant crushing on the conductivity. Gidley et al. [28] reported that in situ stress conditions can cause significant proppant crushing, resulting in substantial conductivity reduction. Similarly, Palisch et al. [29] identified a strong negative correlation between proppant crushing rates and fracture conductivity. Chen et al. [30] emphasized that proppant crushing could modify the fracture aperture and interparticle pore space, thereby affecting fluid transport dynamics. Bandara et al. [31] provided a detailed assessment of proppant crushing mechanisms, offering theoretical insights into breakage control strategies for unconventional reservoirs. Han et al. [32] has employed finite element analysis and recommended the deployment of high-strength proppants in near-wellbore zones to minimize mechanical degradation and maintain conductivity. Han et al. [33] also identified proppant failure as a significant contributor to the decline in hydraulic fracture conductivity. Proppant deformation and breakage can reduce fracture aperture and consequently conductivity. Their study demonstrated that geomechanical modeling can effectively capture the deformation and breakage behavior of proppants, while fluid flow modeling enabled the assessment of the associated impact on hydrocarbon production. Man et al. [34] conducted a comprehensive investigation into the compressive and crushing characteristics of ceramic and silica sand proppants. They employed displacement-controlled diameter compression tests, incremental creep tests on individual particles, and one-dimensional compression tests on particle assemblies to quantify the time-dependent mechanical behavior of proppants under stress. Zheng et al. [35] employed a discrete element method and examined the variation in hydraulic conductivity under different scenarios and found that proppant crushing significantly impairs conductivity. Their results further revealed that the influence of crushing is more pronounced with increasing closure stress and decreasing particle size due to the size-dependent strength of the particles.
Previous work has demonstrated the critical impact of proppant crushing on the propped fracture conductivity. The characteristic of proppant crushing could be influenced by multiple factors. Mittal et al. conducted a series of experiments to investigate the influence of various parameters including proppant particle size, fracturing fluid pH, proppant migration, and crushing on the fracture conductivity under different conditions. They also demonstrated that proppant placement techniques, sand concentration, and particle fragmentation are interrelated, collectively influencing the conductivity of propped fractures [36]. Previous studies have explored the effects of individual proppant types and sizes on crushing resistance and fracture conductivity under various closure pressures. Ceramic proppants typically demonstrate superior crush resistance compared to silica sand, albeit at a higher cost. Consequently, achieving an optimal balance between performance and cost is crucial. The mixture of proppants with different types and mesh size could be applied to reduce the expense while preserving the necessary strength and fracture conductivity. Wei et al. [37] examined long-term fracture conductivity using silica sand of different mesh sizes. Fan et al. [12] conducted experiments and simulations to assess the performance of silica and ceramic proppants at various mixing ratios. Simulation studies have also been performed to examine the performance of proppant mixture on the conductivity [38,39]. A systematic and comprehensive experimental investigation of proppant mixture crushing behavior and its impact on conductivity is essential for optimizing hydraulic fracturing design. However, research on the effects of proppant type, particle size, proppant mixtures, and concentration on fracture conductivity under varying closure stress conditions remains insufficient.
Therefore, in this study a comprehensive investigation was conducted into the mechanisms by which proppant crushing influences the flow capacity of propped fractures in tight sandstone formations under varying conditions. By systematically analyzing the features of proppant-induced conductivity degradation across different influencing factors, the research elucidates the underlying mechanisms governing the relationship between proppant crushing and fracture conductivity. This study contributes to a more comprehensive understanding of the evolution of fracture conductivity and offers theoretical guidance for optimizing hydraulic fracturing designs in field applications. The findings aim to enhance the effectiveness of reservoir stimulation in tight sandstone formations and support the sustainable and efficient development of unconventional oil and gas resources.
2. Materials and Methods
2.1. Measurement of the Physical Properties of Proppants
2.1.1. Measurement of the Average Diameter
A sieve shaker was used to measure the average diameter of silica sand proppant with mesh size of 30/50, 40/70, 70/140, and 100/200, ceramic proppant of 30/50 mesh size, and 30/50 mesh coated ceramic proppant. The average diameter was calculated using the following equation.
where dav is the average diameter, μm; n is the frequency; d is the diameter, μm.
2.1.2. Measurement of the Bulk Density
A brass cylinder with internal diameter of 38.9 mm, height of 88.9 ± 0.4 mm, and capacity of 100 cm3 was used to measure bulk density. The volume of the brass cylinder Vcyl can be calculated using Equation (2).
where Vcyl is the volume of cylinder, cm3; mw is the mass of water, g; mf+gp is the mass of empty cylinder, g; mf+gp+1 is the mass of cylinder with water inside, g; 0.9971 is water density, g/cm3. The bulk density ρbulk is calculated using the following equation.
2.1.3. Measurement of the Crushing Rate
Crushing experiments were conducted on silica sand (30/50, 40/70, 70/140, 100/200), ceramic proppant (30/50), and coated ceramic proppant (30/50), respectively. The proppant used in the experiments was the proppant sample that had been screened, ensuring that their grain sizes were all within the specified range. The crushing rate was measured using a hydraulic press. The dimensions of the crushing chamber were as follows: a wall diameter of 50.8 mm, a piston length of 88.9 mm, and a Rockwell hardness of 43 HRC or higher. The crushing chamber was inserted into the center of the hydraulic press, which was then controlled to pressurize the chamber at a constant rate. The pressure was set to the desired closure stress magnitude, after which the process was maintained for two minutes. The closure pressure ranges from 5 to 30 MPa. The pressure was then unloaded, and the crushing chamber was removed. According to ASTM E11-24 standard [40], the proppant was poured into a standard sieve vibrating for 10 min. The crushed proppant was weighed and recorded as m. The crushing rate of the proppant at different closure stress, denoted by ω, was calculated according to the following equation.
where ω is the crushing rate, %; m is the mass of the crushed proppant, g; mp is the total mass of the proppant, g.
2.1.4. Measurement of the Roundness and Sphericity
Optical microscope (BDS400) was used to evaluate proppant roundness and sphericity based on the Krumbien/Sloss template [41].
2.2. Conductivity Test of the Propped Fracture
To eliminate the influence of proppant embedment on conductivity measurements, steel plates were employed as boundary. Silica sand was selected as the test proppant due to its relatively low compressive strength and its pronounced sensitivity to varying stress conditions, which results in significant variability in its crushing rate. Experiments were conducted across a closure stress range of 5 MPa to 30 MPa. Distilled water was used as the working fluid and injected at a constant flow rate of 3 mL/min. The proppant pack thickness ranged from 0.25 cm to 1.27 cm, with the testing apparatus having a maximum load capacity of 1000 kN and an effective test area of 64.5 cm2. The mass of the effluent was recorded in real time using balance. The experimental procedure for evaluating inflow capacity was as follows:
- (1)
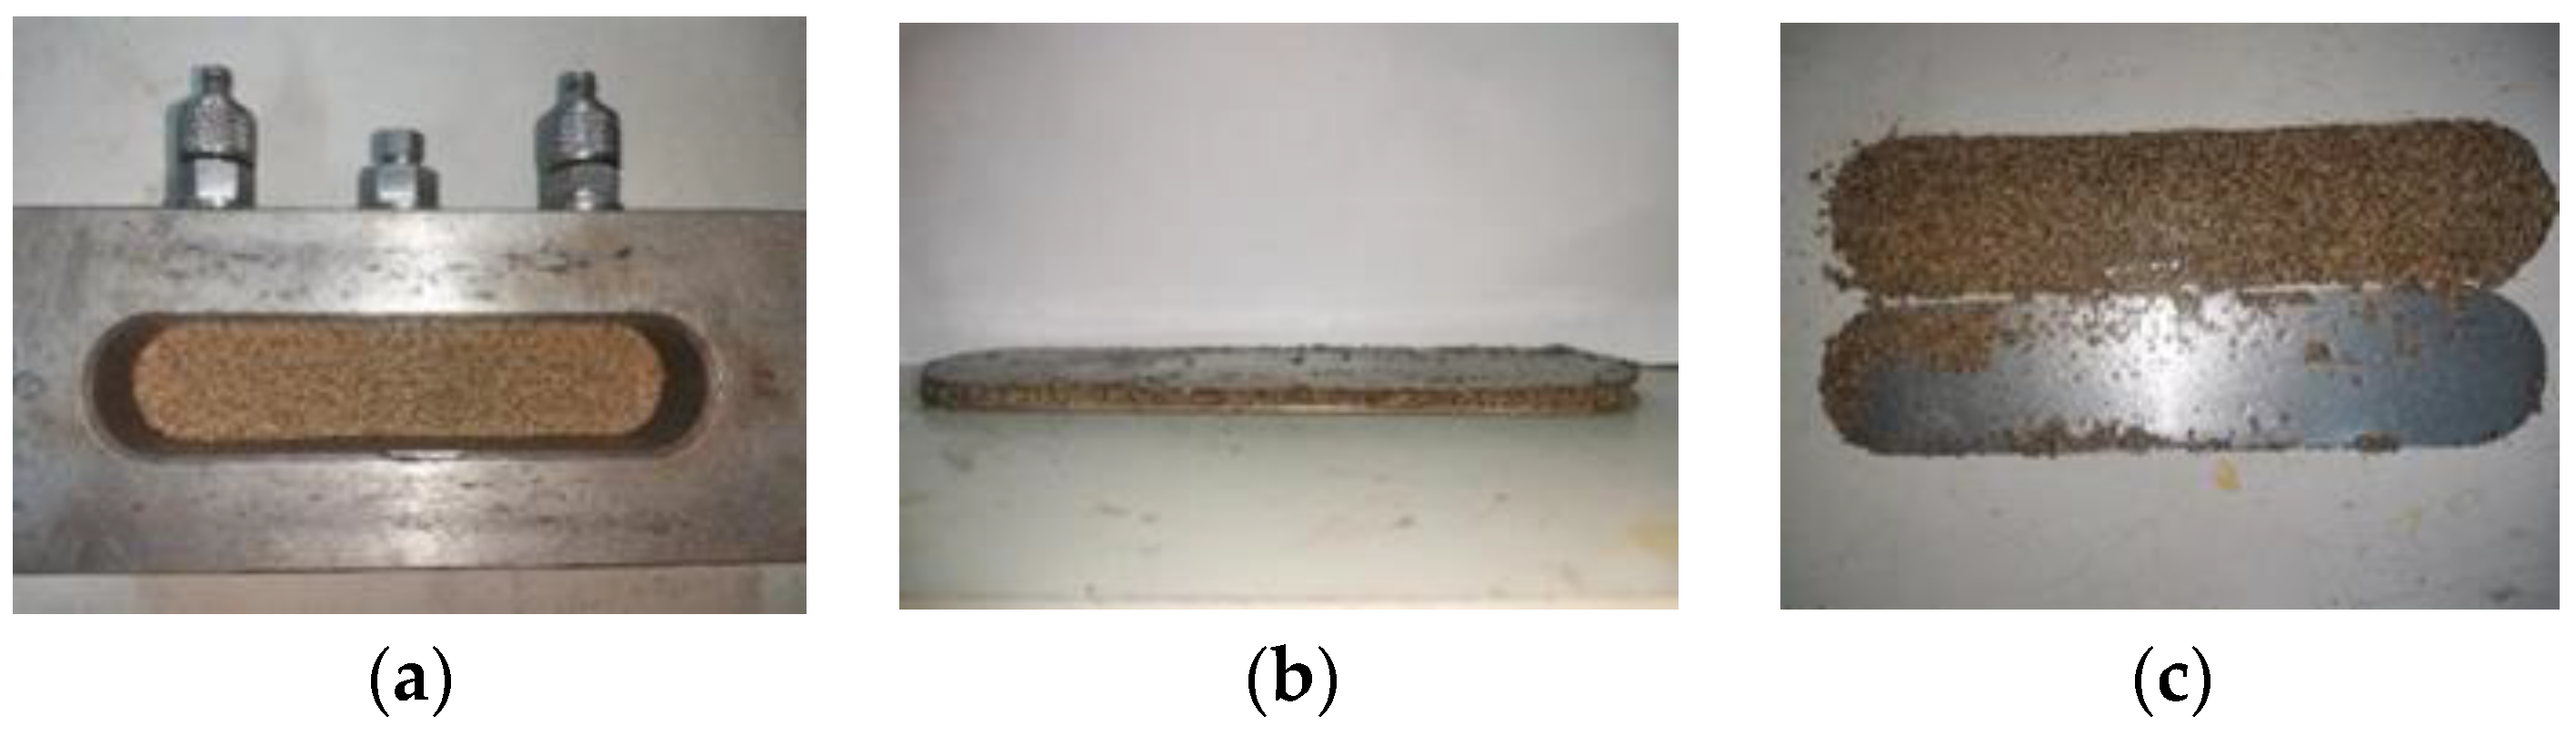
- A metal plate was placed at the base of the testing chamber. The proppant was uniformly poured into the chamber and leveled, after which a second plate was carefully placed over the proppant layer (Figure 1).
- (2)
- The assembled chamber was then positioned between the platens of a hydraulic press. The pressure was gradually increased using an oil pump to a value just below the target closure stress, preventing overshoot that could affect the test results. The oil pump was then deactivated, and a compensation pump was engaged to precisely adjust the pressure to the predetermined value. Once the desired closure stress was reached, the system maintained a stable load throughout the experiment.
- (3)
- The inlet valve and advection pump were activated while the outlet valve remained closed to fill the chamber with distilled water. Once the differential pressure sensor indicated a value of 1, the outlet valve was opened. This saturation process was repeated three times to ensure full saturation of the proppant pack.
- (4)
- After ensuring the system reached steady-state conditions, flow testing was conducted for a continuous period of 30 min. The average flow rate over this period was recorded as the inflow capacity corresponding to the specific pressure condition.
- (5)
- Upon completion of the flow test, all proppant material was removed from the chamber and dried in an oven at 105 °C for 24 h to ensure complete removal of moisture.
- (6)
- The dried proppant was then subjected to a standard sieve analysis. After sufficient vibration, the mass of crushed proppant retained in the collection pan was measured, and the proppant crushing rate was calculated accordingly. These steps were repeated to evaluate conductivity under varying parameters.
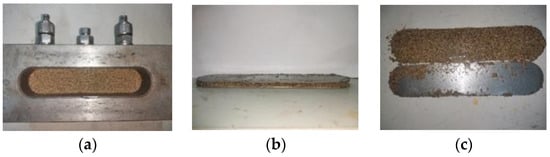
Figure 1.
Demonstration on the experimental process of the conductivity measurement of 30/50 Mesh coated ceramic proppant. (a) Top view of the conductivity chamber; (b) width of the proppant pack; (c) proppant after the conductivity measurement.
Figure 1.
Demonstration on the experimental process of the conductivity measurement of 30/50 Mesh coated ceramic proppant. (a) Top view of the conductivity chamber; (b) width of the proppant pack; (c) proppant after the conductivity measurement.
3. Results
3.1. Physical Properties of the Proppants
The average values of bulk density, crushing rate, roundness, and sphericity of the proppants were obtained from the basic physical property tests described in the previous section. Table 1 presents the average particle diameters and bulk densities for silica sand, ceramic proppants, and resin-coated ceramic proppants across various mesh sizes. The results indicate that, for silica sand, bulk density increases with particle size. Additionally, for the same particle sizes, resin-coated ceramic proppants exhibit lower bulk densities compared to uncoated ceramic proppants. This difference is attributed to the significantly lower density of the resin coating relative to the ceramic core material, which results in an overall reduction in bulk density for the coated proppants despite the same particle size.

Table 1.
Screening analysis of the proppants.
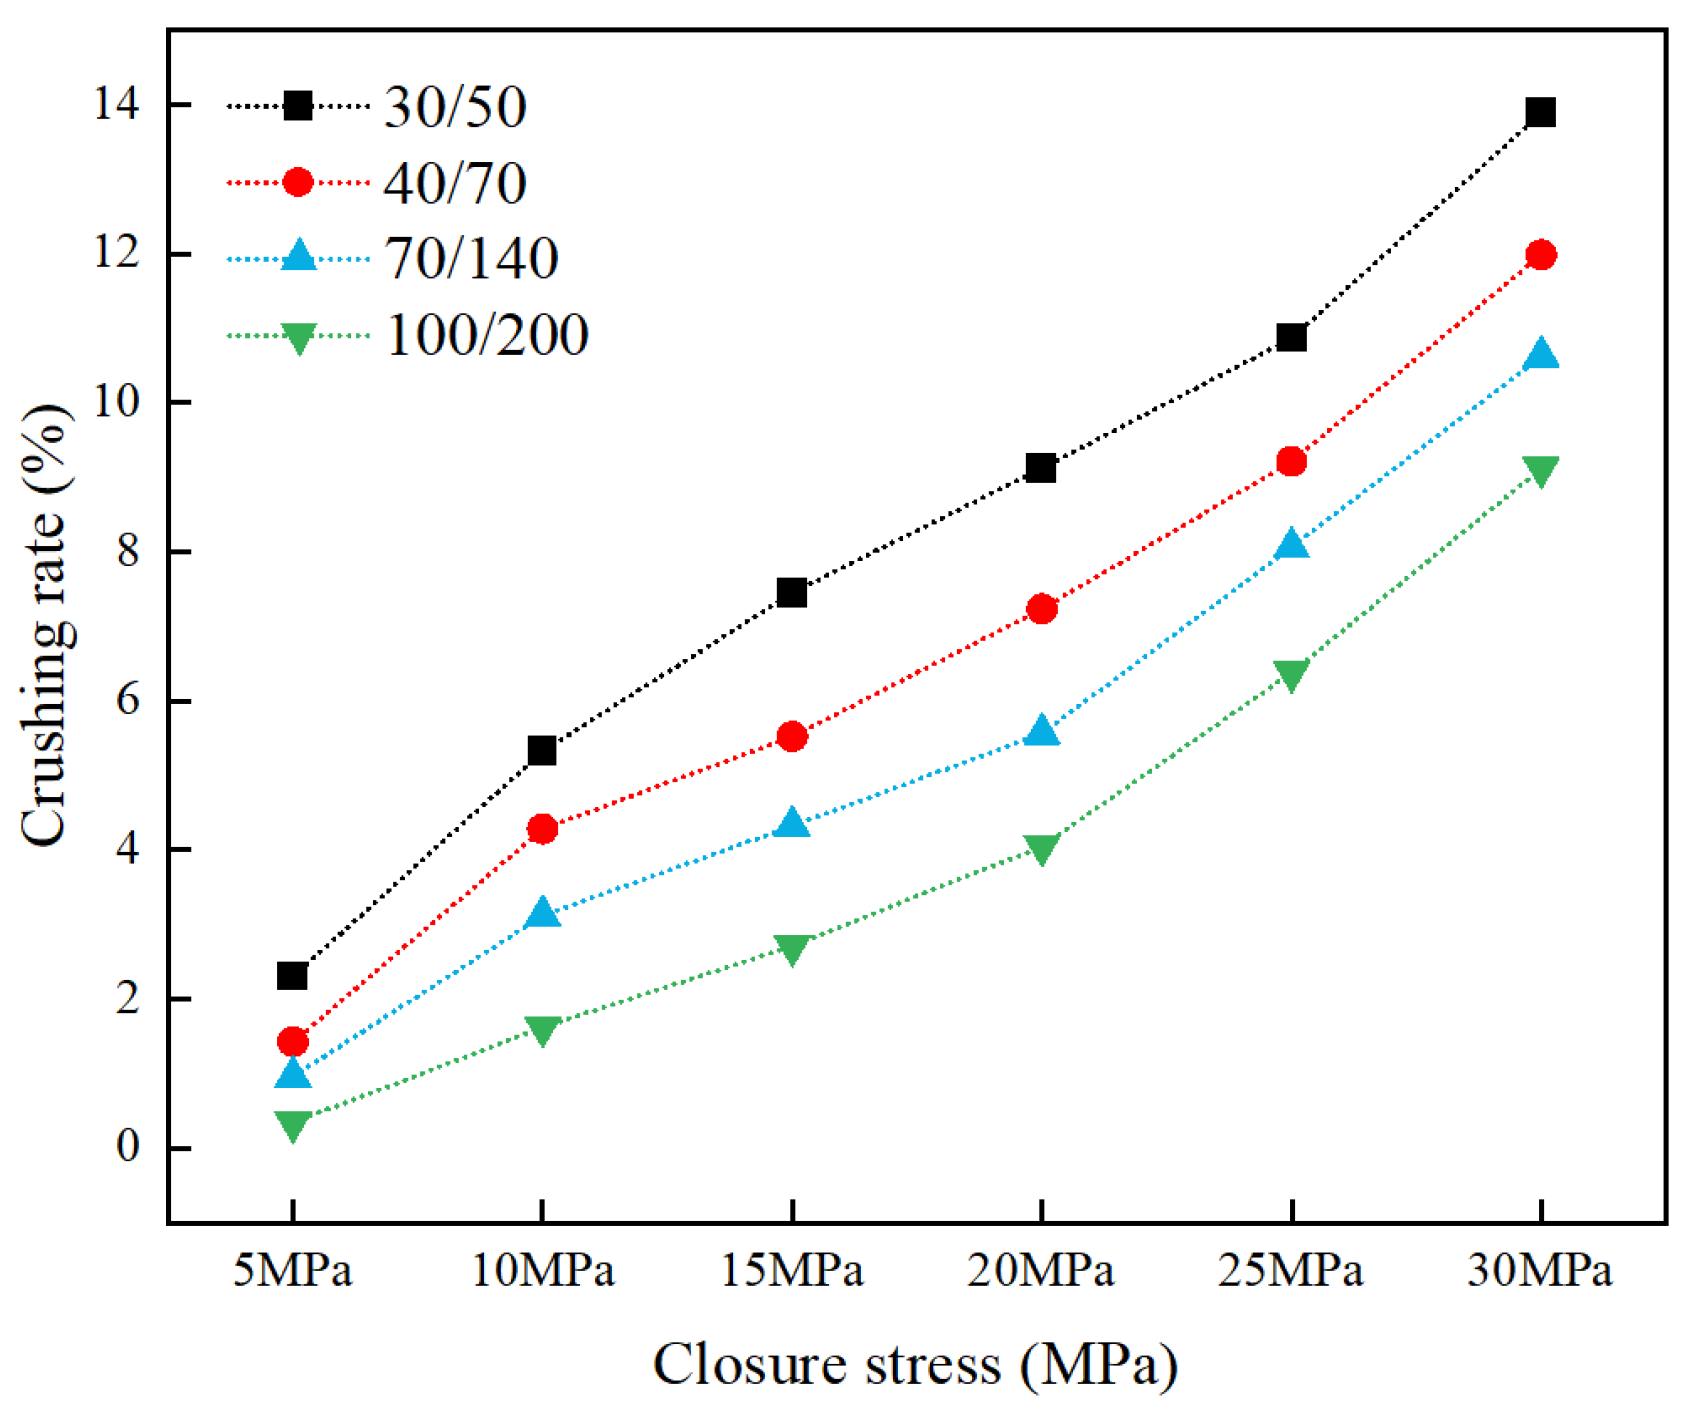
The proppant crushing rate was obtained by vibrating, sieving, weighing and calculating the proppant in the crushing chamber under pressure, and the curves of the crushing rate of silica sand of different grain sizes with the pressure are shown in Figure 2, and the curves of the crushing rate of the same grain size and different types of proppant with the pressure are shown in Figure 3.
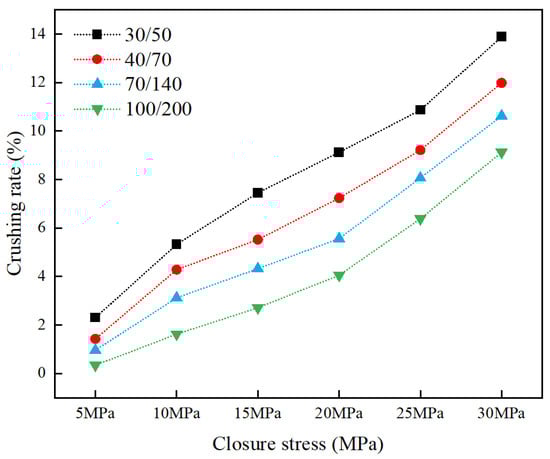
Figure 2.
Crushing rate of the silica sand with varying mesh size under different pressure.
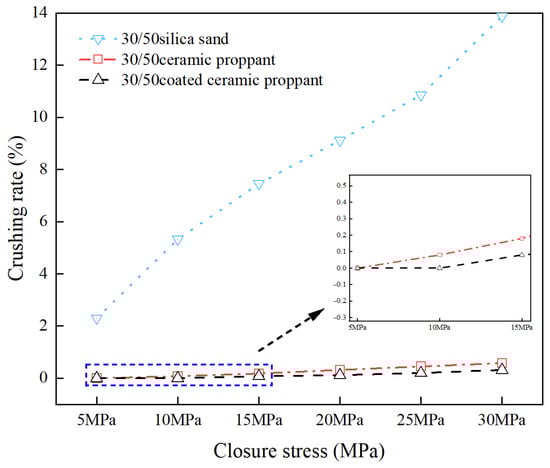
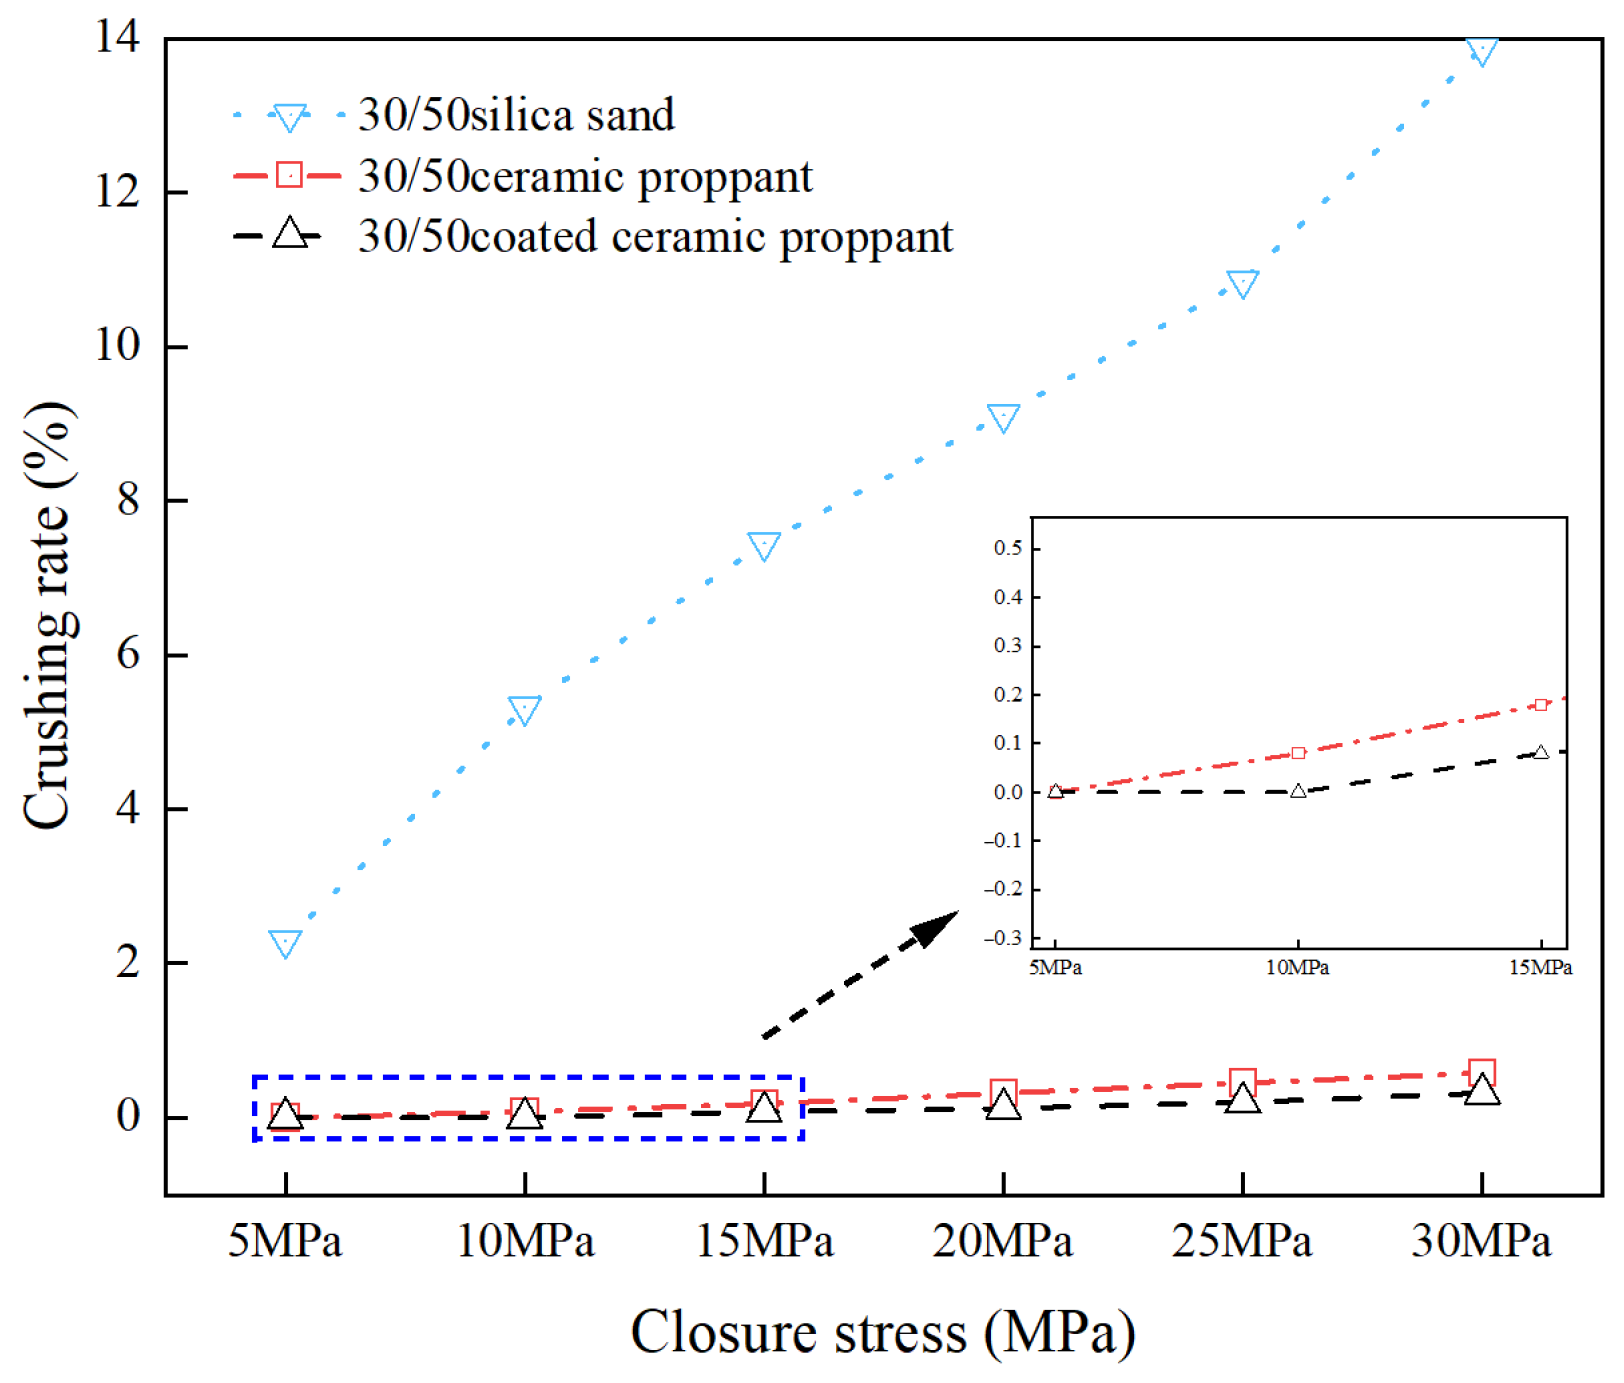
Figure 3.
Crushing rate of different proppants under varying pressure.
As shown in Figure 2, silica sand with four mesh sized began to break at 5 MPa; during the gradual increase in the closure stress, the various grain sizes of silica sand showed an increasing trend in the crushing rate. Specifically, when the closure stress is raised from 5 MPa to 30 MPa, the crushing rate of 30/50 mesh silica sand increases by 10.96%, the crushing rate of 40/70 mesh silica sand increases by 10.07%, the crushing rate of 70/140 mesh silica sand rises by 9.27%, and the crushing rate of 100/200 mesh silica sand increases by 8.43%. The above results show that with the increase in closure stress, the crushing rate of silica sand of different grain sizes increased. The change trend and the size of the grain size is correlated, that is, the increase in the crushing rate of the silica sand with small grain size is smaller than that of the silica sand with large grain size. Under the same pressure, the crushing rate of the silica sand with large grain size is higher than that of the silica sand with small grain size.
As illustrated in Figure 3, silica sand exhibits a significantly higher crushing rate compared to ceramic and resin-coated ceramic proppants of the same particle size, reflecting its relatively low compressive strength and reduced mechanical stability within fractures. Specifically, 30/50 mesh ceramic proppants begin to exhibit measurable crushing at a closure stress of 15 MPa, while 30/50 mesh resin-coated ceramic proppants maintain a crushing rate of 0% up to 20 MPa. This suggests that the organic resin coating substantially enhances the mechanical integrity of ceramic proppants. The coating modifies the interparticle contact geometry from discrete point contacts to broader contact areas, thereby distributing the stress more evenly and improving the overall compressive strength of the proppant.
With increasing closure stress from 15 MPa to 30 MPa, the crushing rates of both ceramic and resin-coated ceramic proppants increase; however, the difference in crushing performance between the two proppants also widens. At a closure stress of 30 MPa, the crushing rate for 30/50 mesh ceramic proppants remains below 0.5%, while that of the resin-coated ceramic proppants is as low as 0.1%. These results confirm that both ceramic and resin-coated ceramic proppants can maintain high mechanical integrity under elevated closure stress and are capable of sustaining high fracture conductivity in deep, high-pressure formations.
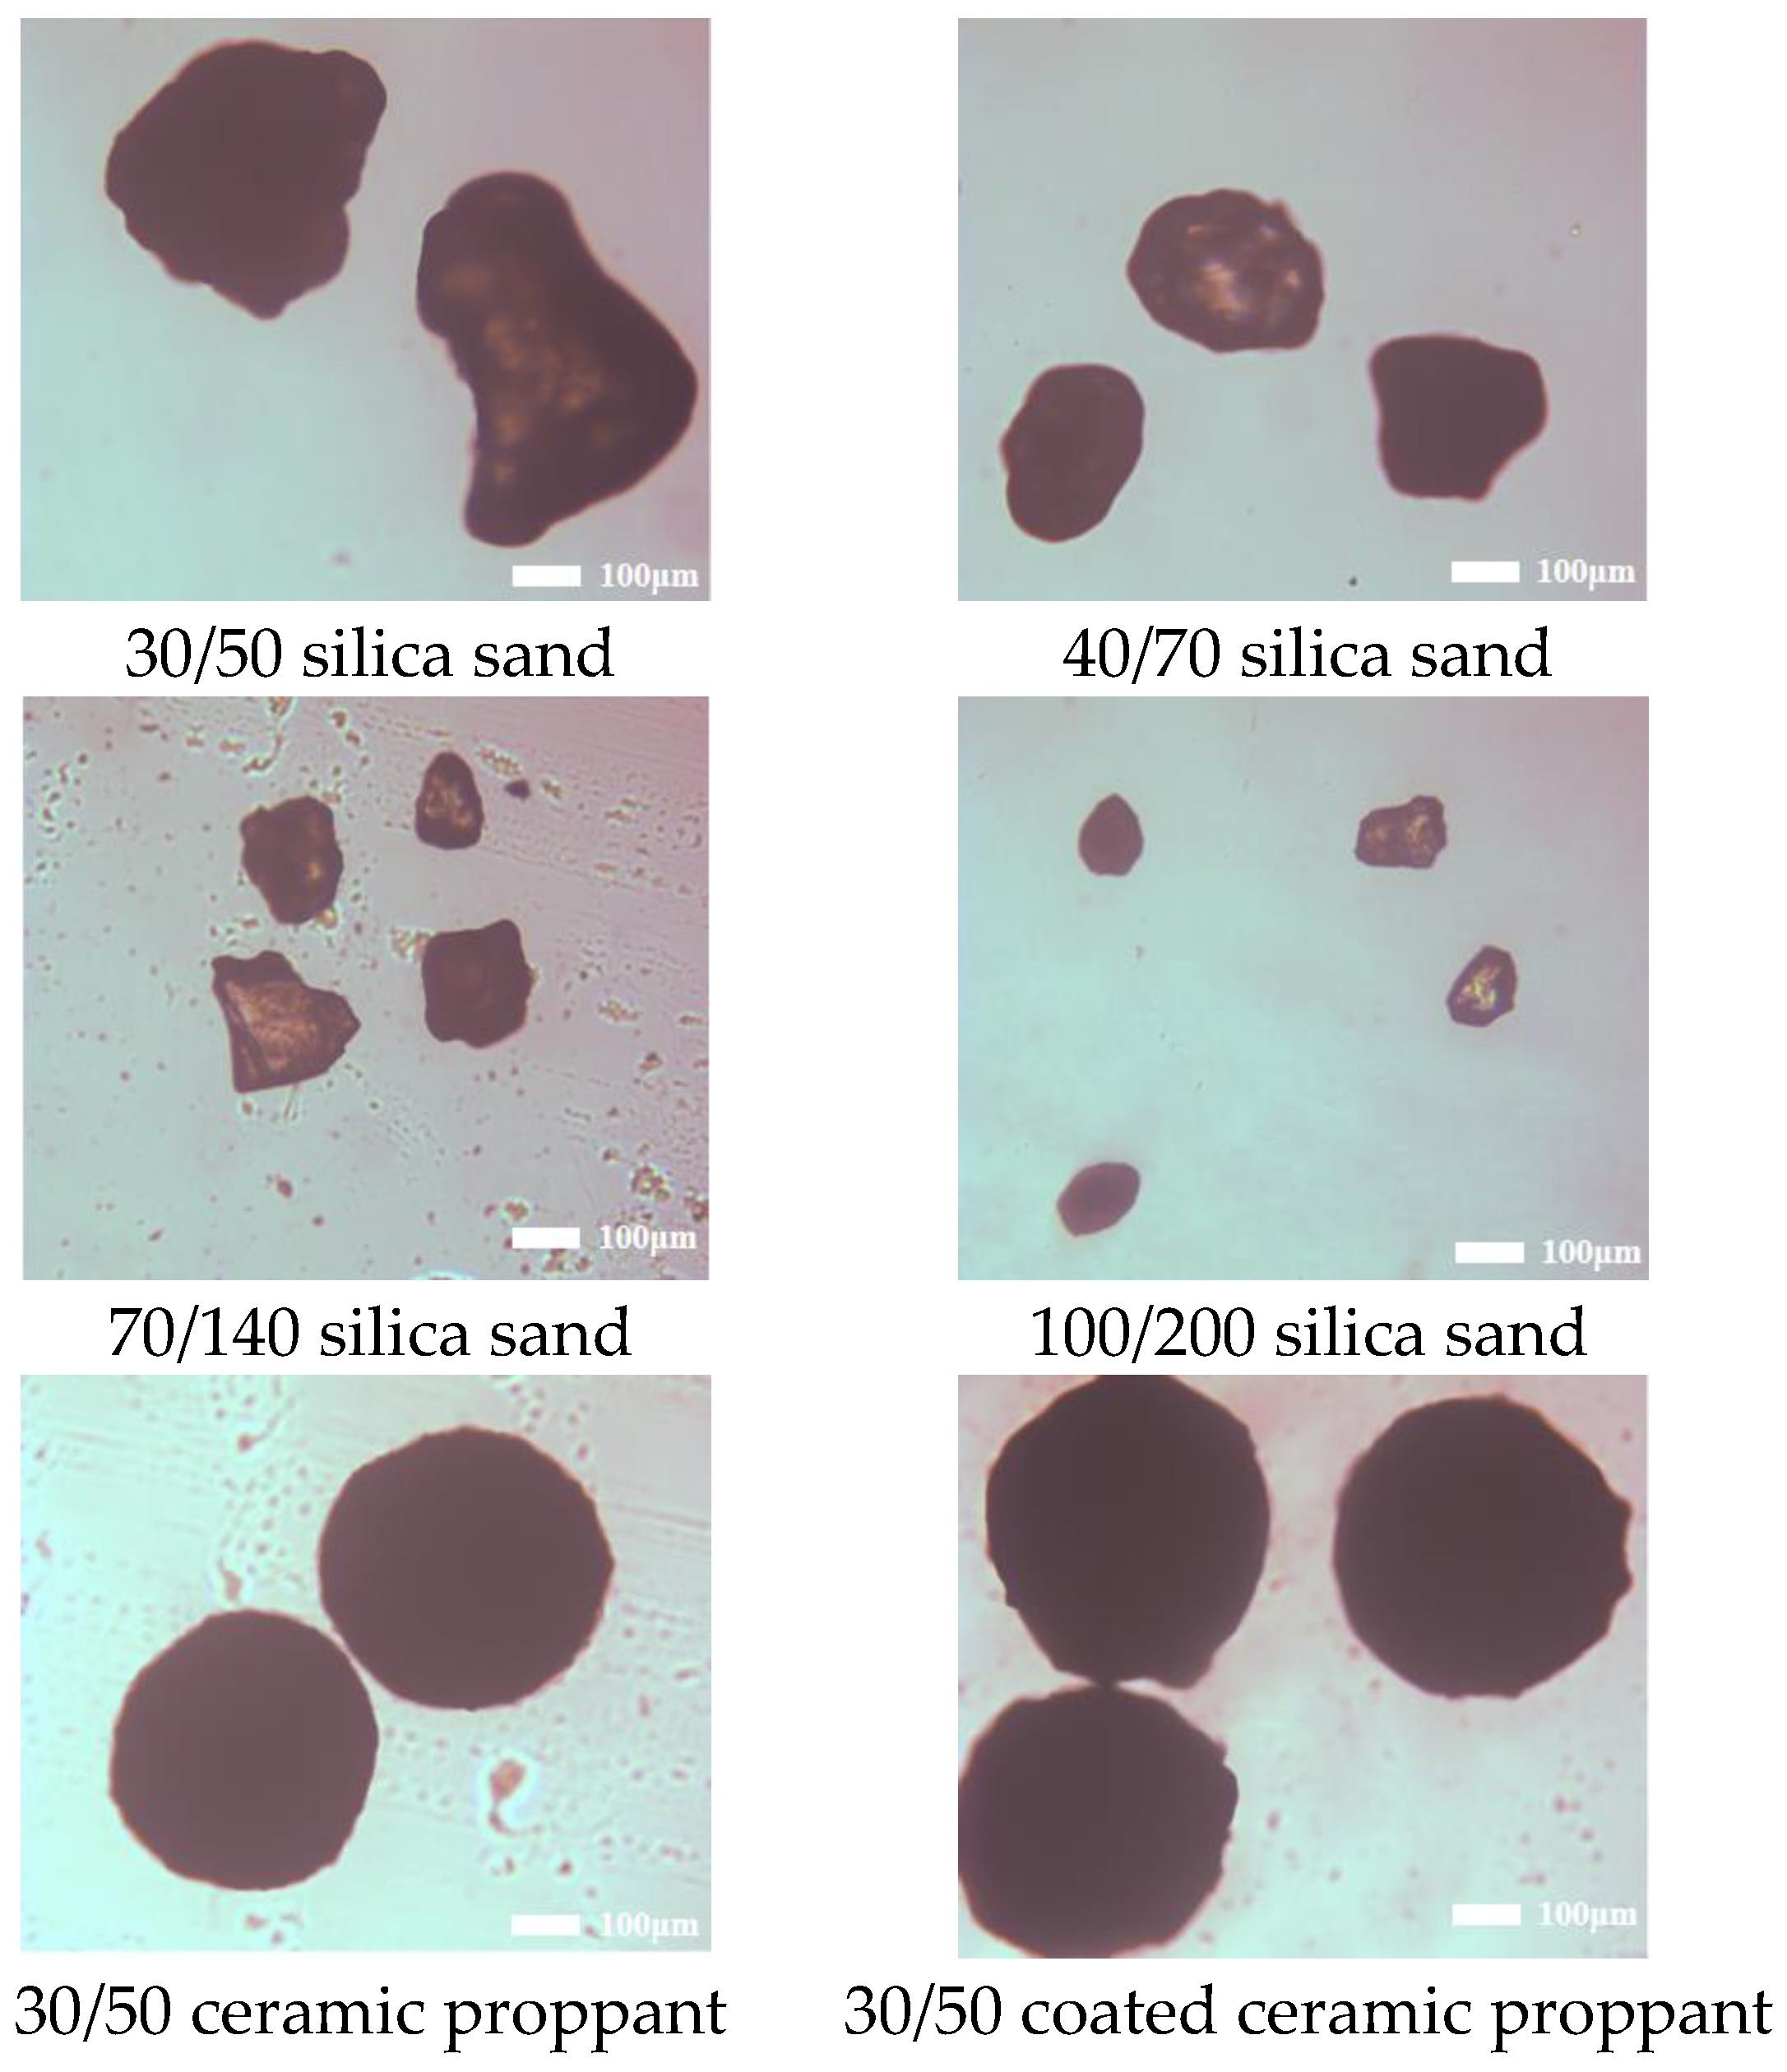
The shape of the proppant particles under the microscope is shown in Figure 4. From the shape of proppant particles of four different grain sizes, it can be observed that as the mesh size increases, the particles deviated from the standard spheres. The silica sand with the same grain size has less rounded particles compared to ceramic and coated ceramic grains. The roundness and sphericity of the proppant particle are shown in Table 2.

Figure 4.
Images of different proppant particles under microscope.
Table 2.
Roundness and sphericity of the proppant particle.
As can be seen from the above table, the roundness and sphericity of 30/50 mesh ceramic grains and coated ceramic grains are 0.9, which is already closer to the standard sphere and better than the roundness and sphericity of silica sand of the same mesh.
3.2. Conductivity of the Propped Fracture
The conductivity of the fracture is determined by the fracture permeability and fracture width. Fracture permeability can be calculated using the following equation.
where k is the fracture permeability, μm2; μ is the viscosity of the fluid, mPa·s; Q is the flow rate, cm3/s; Wf is the width the proppant, cm; Δp is the pressure difference, kPa.
The conductivity of the propped fracture can be calculated using Equation (7) by rearranging Equation (6):
where kWf is the conductivity of the propped fracture, μm2·cm.
3.2.1. Influence of Closure Stress on the Propped Fracture Conductivity
The changes in the conductivity of the three types of proppant at different pressures are shown in Figure 5, and the changes in the conductivity when the closure stress increasing from 5 to 30 MPa are shown in Figure 6.
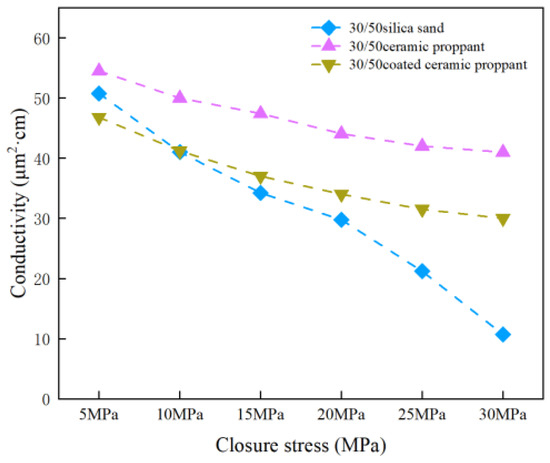
Figure 5.
Conductivity of different proppants with same mesh size under varying pressure.
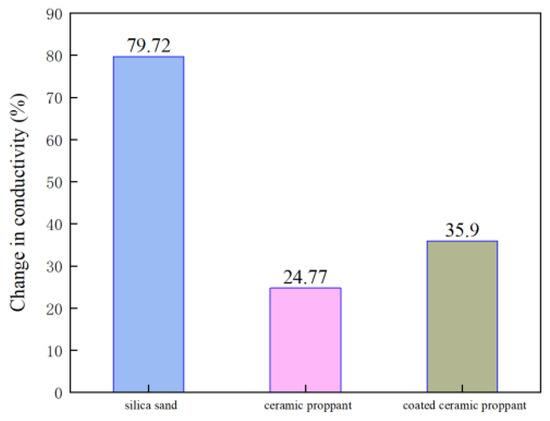
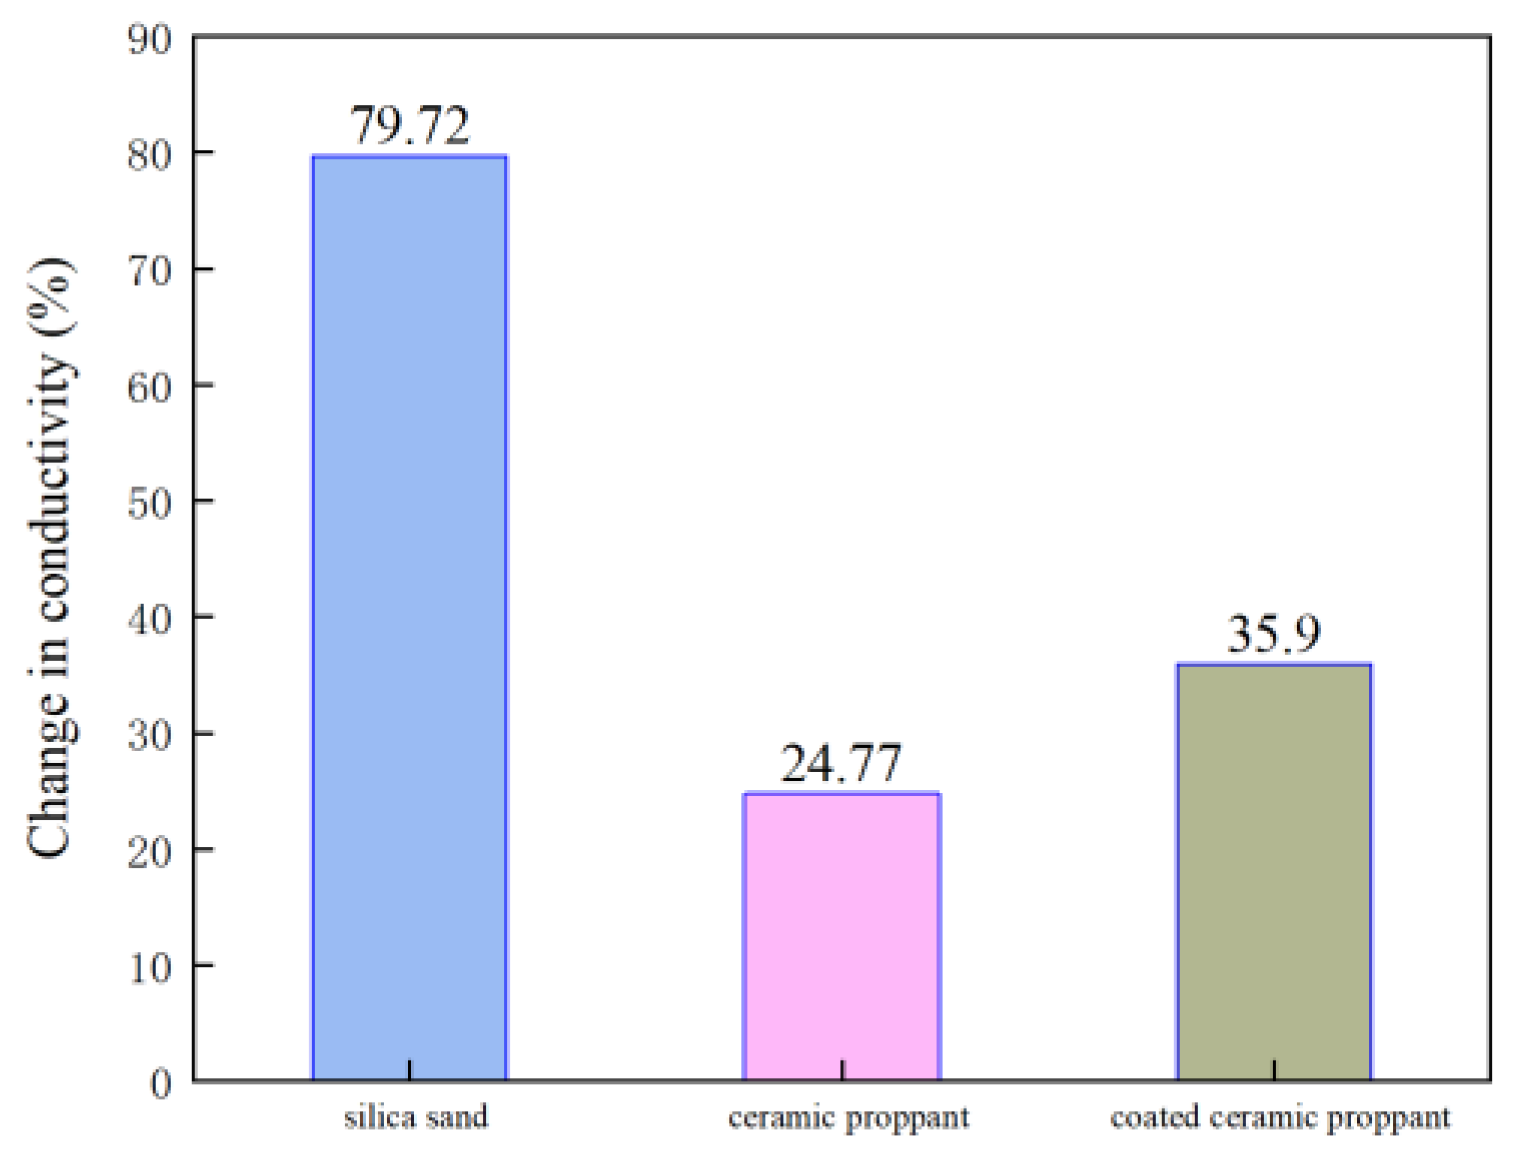
Figure 6.
Change in conductivity of different proppants with same mesh size.
As illustrated in Figure 5 and Figure 6, under a low closure stress of 5 MPa, the crushing rate of silica sand remains relatively low. Consequently, the conductivity of silica sand is comparable to that of ceramic and resin-coated ceramic proppants under these conditions. This similarity arises from the minimal generation of fines at low stress, which results in limited blocking within the proppant pack. Furthermore, at equivalent particle sizes, the pore structures formed between proppant grains are relatively similar, contributing to negligible differences in flow conductivity.
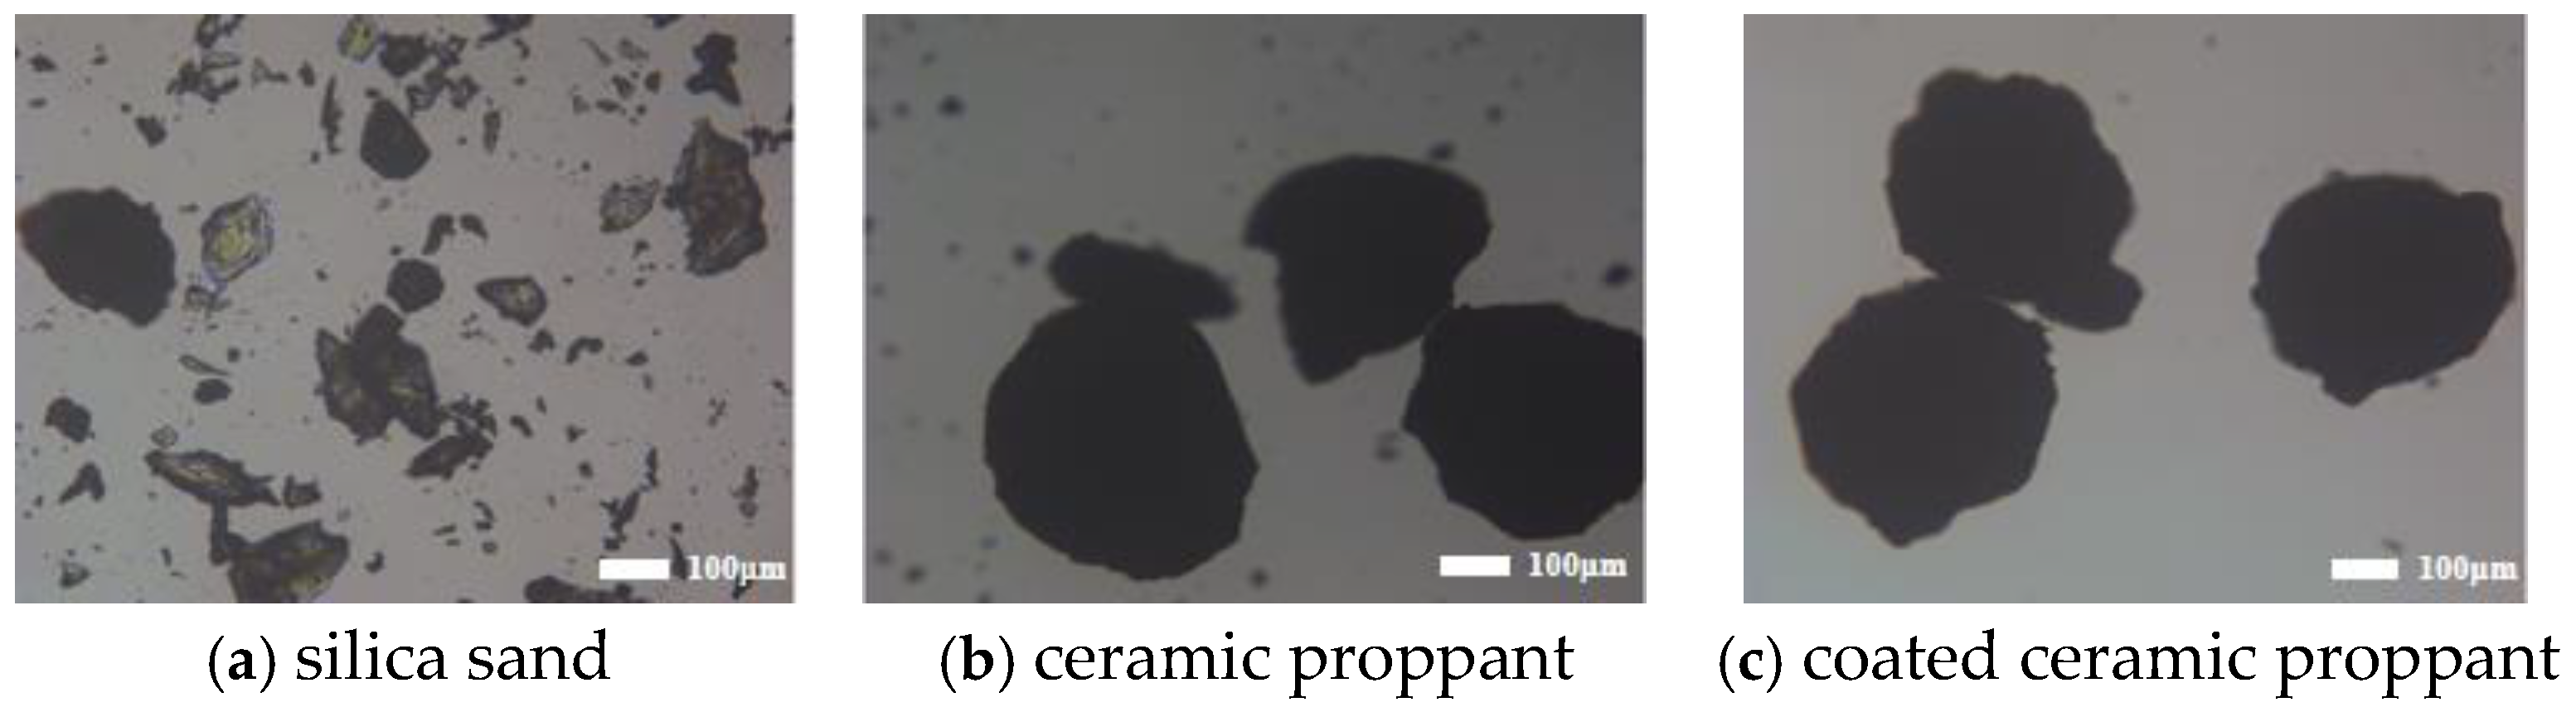
As closure stress increases, the crushing rate of all three proppant types increases, accompanied by a corresponding reduction in fracture conductivity. As shown in Figure 7a, small and irregularly shaped particles were observed after the crushing test at 30 MPa. When closure stress exceeds 20 MPa, the crushing rate of silica sand increases significantly, leading to a sharp decline in its conductivity, which is in line with the observation shown in Figure 7. In contrast, both ceramic and resin-coated ceramic proppants exhibit substantially lower crushing rates under the same conditions owing to their higher compressive strengths. Proppant breakage increases only marginally with increasing closure stress, resulting in a more gradual decrease in flow conductivity. Moreover, less fines were observed after the crushing test of coated ceramic proppants than that of regular ceramic proppants, which could be a result of the exterior resin coating that keeps the fines inside.
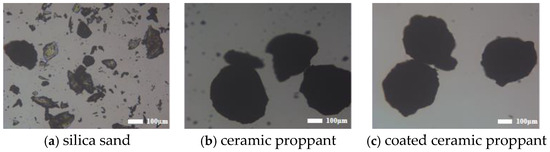
Figure 7.
Images of 30/50 mesh proppants after crushing test at 30 MPa closure stress.
Across the range of tested closure stress (5–30 MPa), silica sand demonstrates much higher fracture conductivity decrease compared to ceramic-based proppants. As closure stress increases, the disparity in crushing rates between silica sand and the ceramic proppants becomes more pronounced, which in turn exacerbates the difference in their respective conductivities.
3.2.2. Influence of Different Proppant Combination on the Propped Fracture Conductivity
Experimental results presented previously demonstrate that the difference in crushing rates between silica sand and ceramic proppants increases progressively with rising closure stress, significantly affecting fracture conductivity. The price and characteristics of different proppants are demonstrated in Table 3. In practical fracturing operations, the exclusive use of either silica sand or ceramic proppants may not simultaneously satisfy both cost-effectiveness and mechanical integrity requirements. Therefore, blending silica sand with ceramic proppants in specific proportions offers a viable strategy to balance performance and economic considerations by leveraging the advantages of both materials.
Table 3.
The main differences between different types of proppants.
Although resin-coated ceramic proppants exhibit lower measured crushing rates than uncoated ceramic proppants, the resin layer may encapsulate a portion of the fractured particles, potentially underrepresenting the actual extent of proppant degradation. Furthermore, the higher production cost of resin-coated proppants may limit their widespread use. Consequently, this section focuses on investigating the fracture conductivity and crushing behavior of silica sand–ceramic proppant mixtures across various blending ratios, thereby providing theoretical support for optimizing proppant selection in field-scale hydraulic fracturing designs.
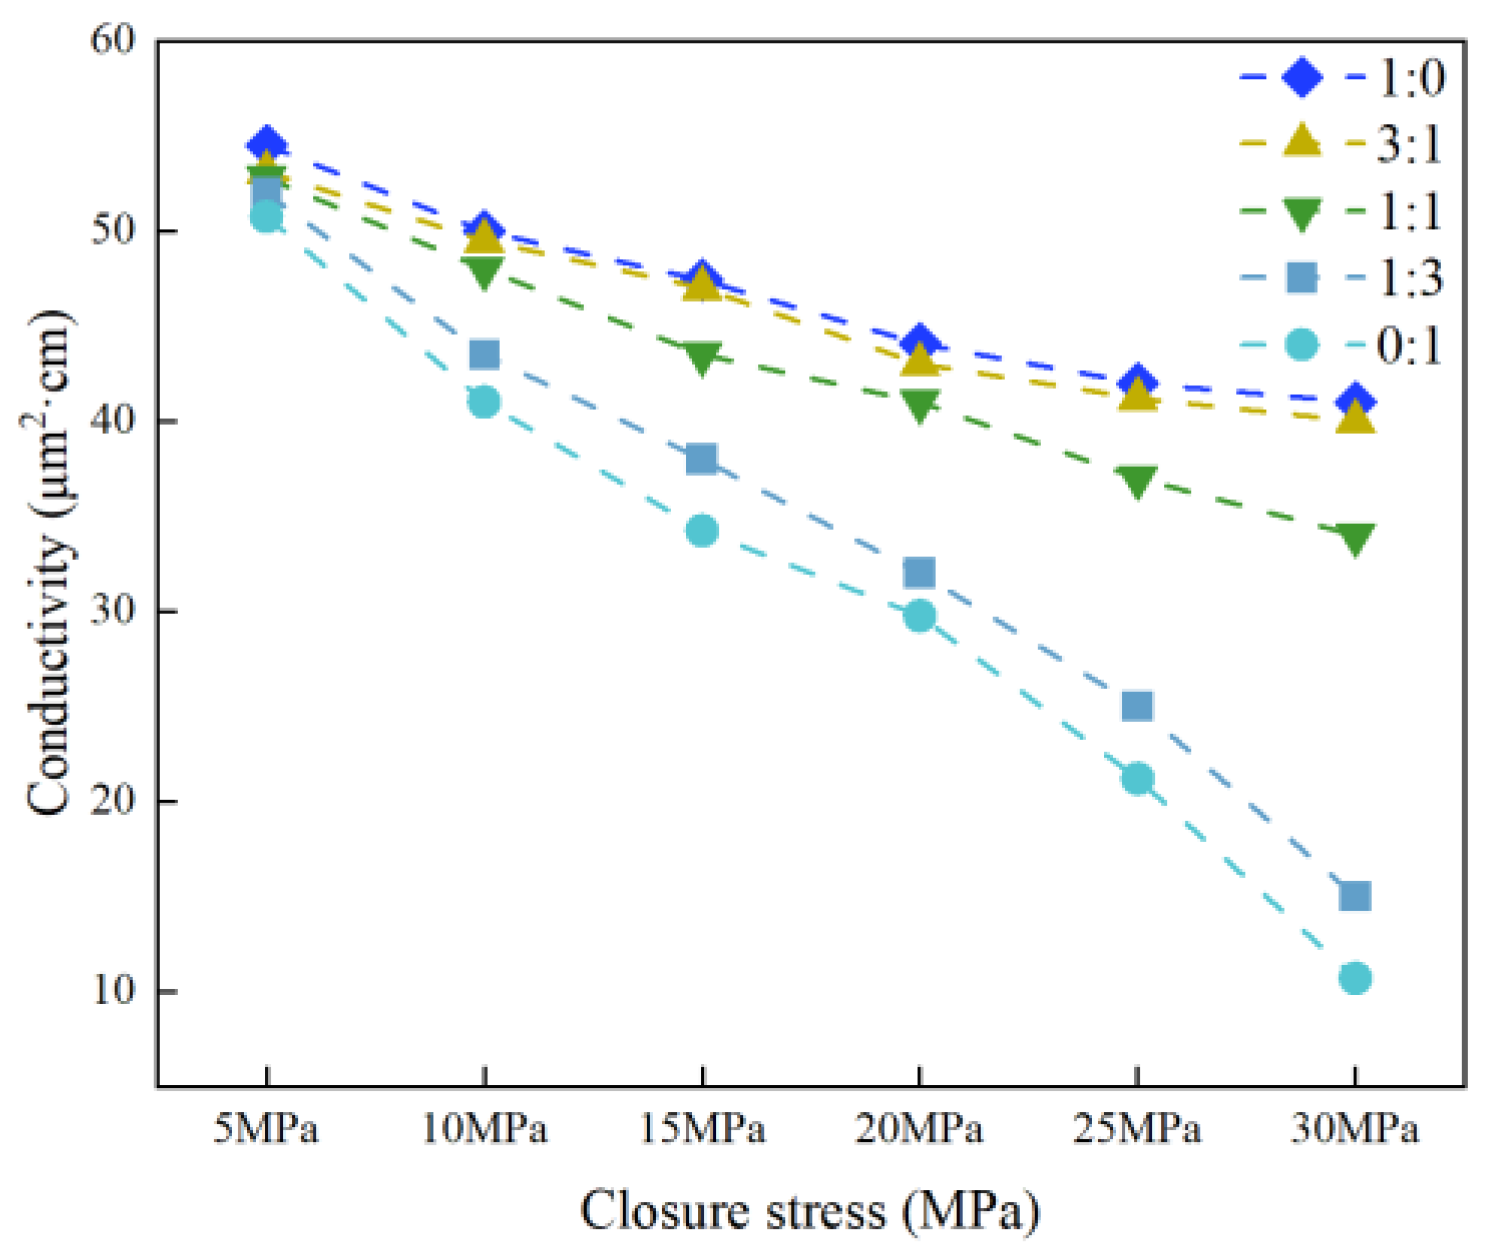
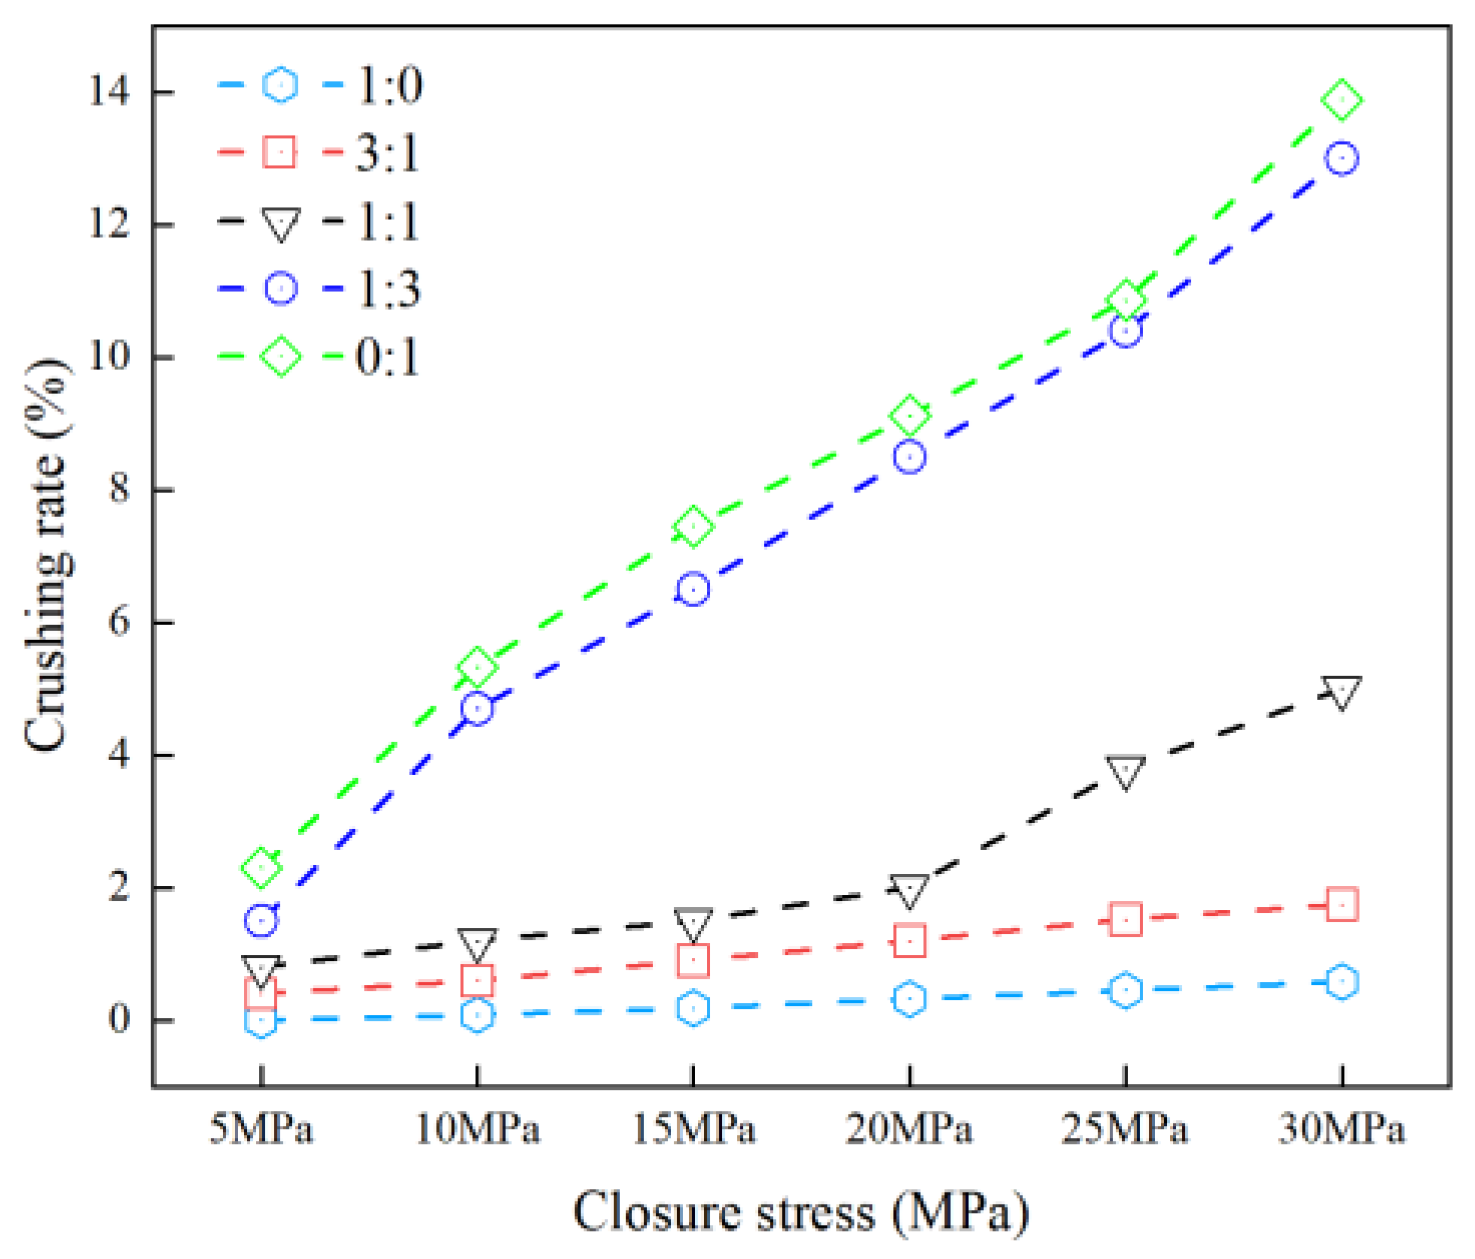
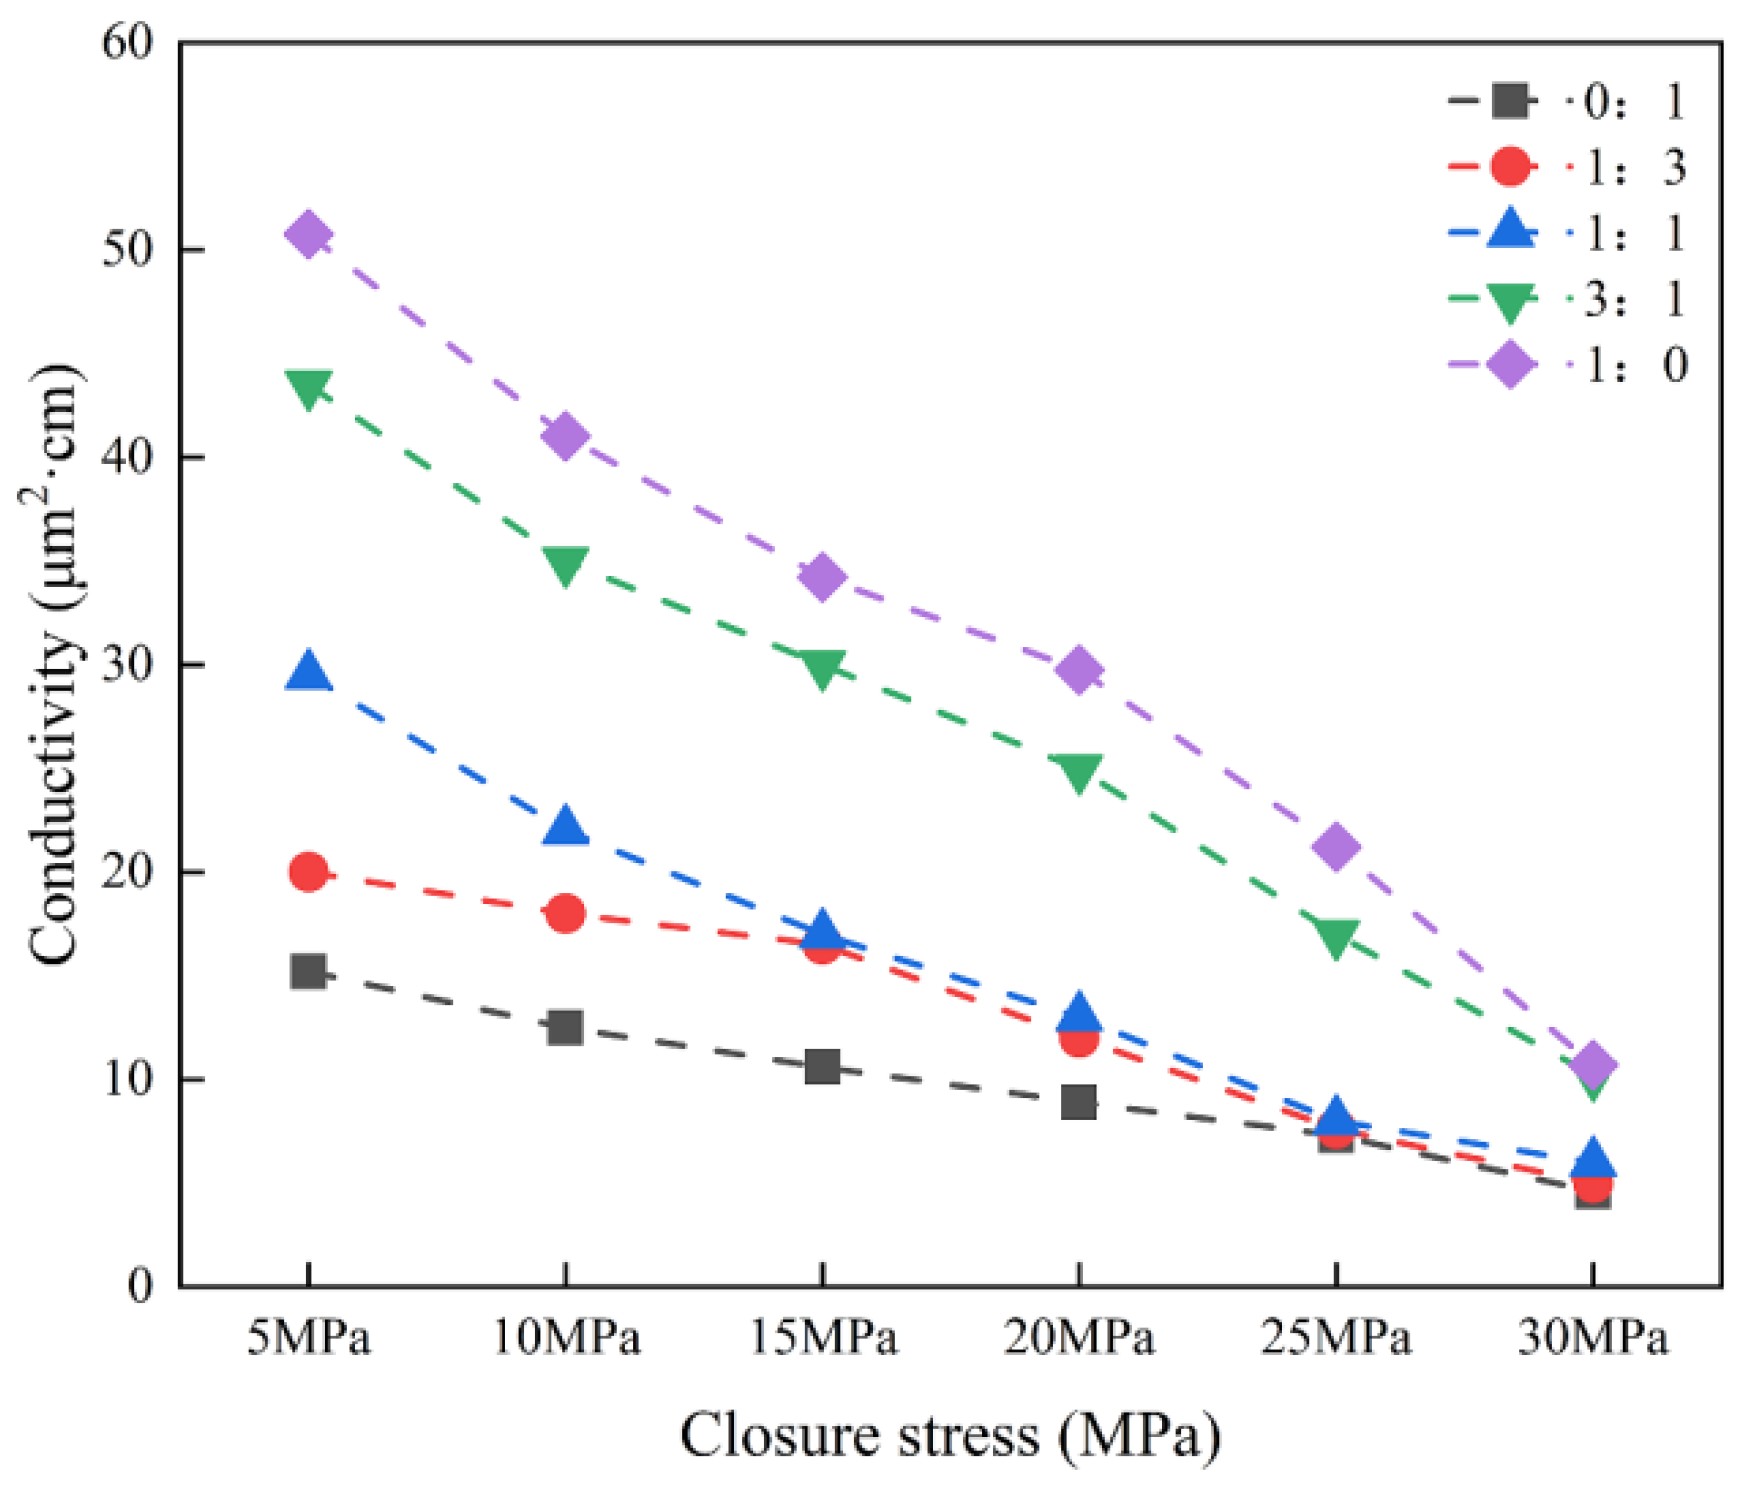
For this purpose, 30/50 mesh ceramic proppants and silica sand were combined in mass ratios of 1:0, 3:1, 1:1, 1:3, and 0:1. The blended samples were subjected to fracture conductivity and crushing rate tests under controlled conditions. The corresponding results are presented in Figure 8 and Figure 9. Changes in the conductivity when the closure stress is 5 and 30 MPa for the mixtures are shown in Figure 10.

Figure 8.
Conductivity of ceramic proppant and silica sand combination.
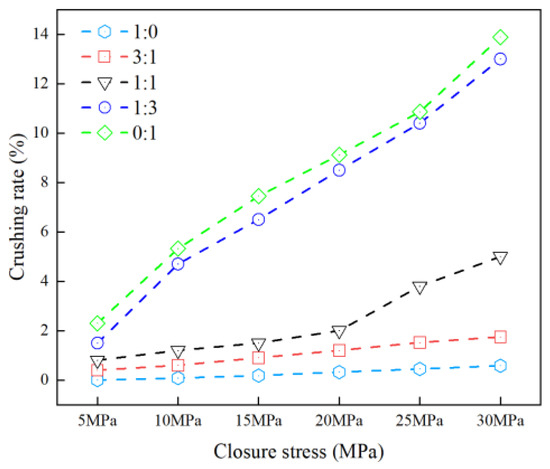
Figure 9.
Crushing rate of ceramic proppant and silica sand combination.
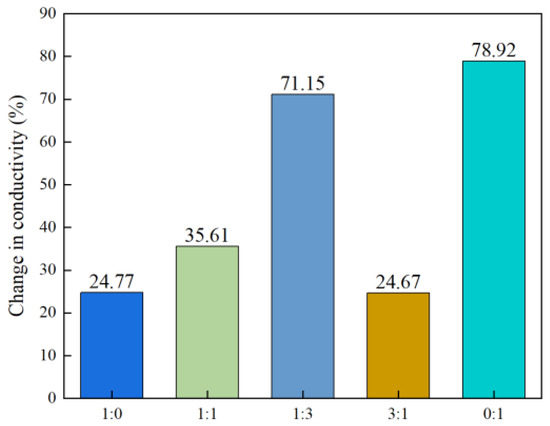
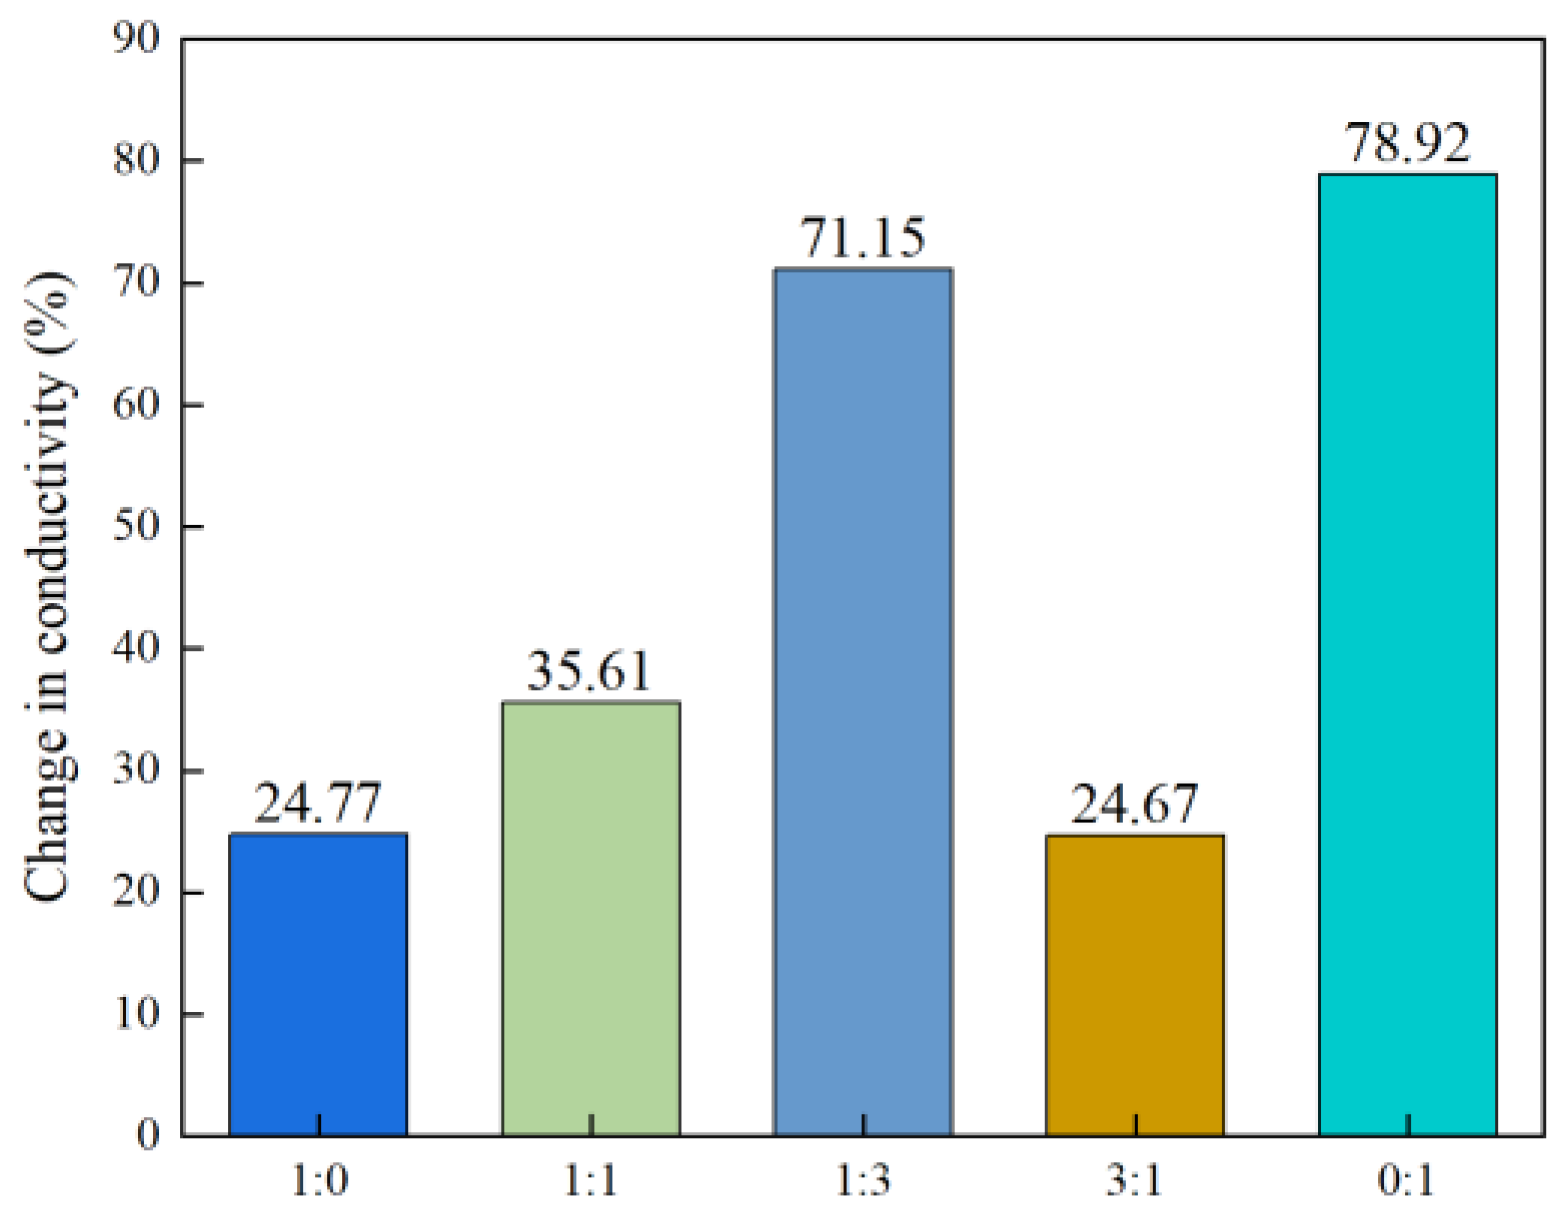
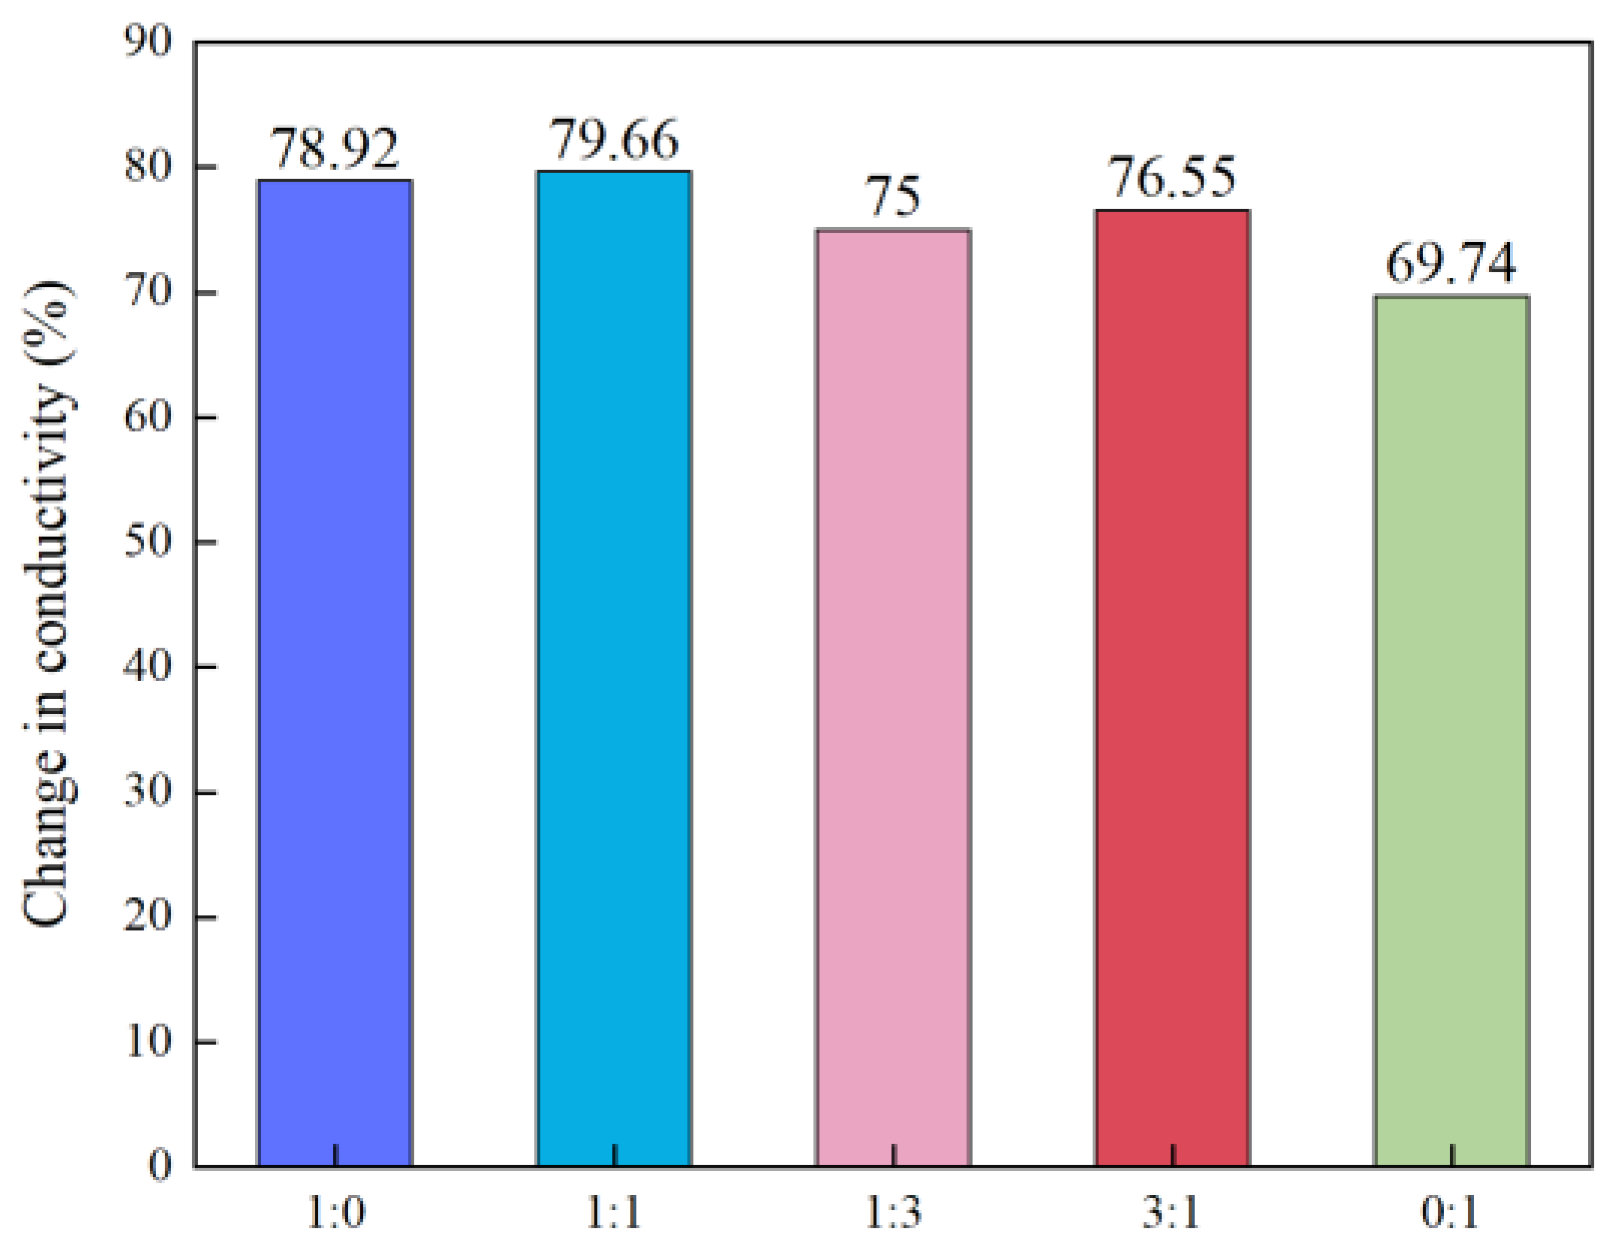
Figure 10.
Change in conductivity of 30/50 ceramic proppants and silica sand mixture with varying ratios.
The experimental results indicate that at a closure stress of 5 MPa, the fracture conductivity values for all five proppant mixture ratios are relatively similar. This is attributed to the low crushing rates observed at this pressure, which results in minimal obstruction of flow pathways, and the similar pore structures formed by proppants of the same particle size. However, as closure stress increases, particularly beyond 20 MPa, the difference in crushing rates between silica sand and ceramic proppants becomes more pronounced, leading to increasingly divergent fracture conductivities. Notably, at a closure stress of 30 MPa, the fracture conductivity of the 30/50 mesh ceramic proppant is nearly four times greater than that of silica sand of the same size.
Comparative analysis further reveals that under identical closure stress, the conductivity of ceramic proppant–silica sand mixtures with the ratios of 1:0 and 3:1 are similar. This is likely due to the dominance of ceramic particles in the 3:1 mixture, which retain their structural integrity under stress, resulting in fewer crushed particles and minimal conductivity loss. In contrast, mixtures with higher proportions of silica sand exhibit a clear reduction in the conductivity particularly under high closure stress. This trend is attributed to the lower compressive strength of silica sand, which leads to greater particle damage, thereby generating fines that block flow paths.
At closure stress of 20 MPa and above, the flow conductivities of the 1:1 and 1:3 mixtures are significantly reduced compared to those of the 1:0 and 3:1 mixture as shown in Figure 10. This decline results from both increased damage of silica sand and the beginning of crushing in some ceramic particles, leading to the accumulation of fines that impair the proppant pack’s permeability. The experimental data confirm that increasing the proportion of ceramic proppant in the mixture enhances fracture conductivity, particularly under elevated stress conditions.
Therefore, the proportion of ceramic proppant should be adjusted based on reservoir conditions. In low permeability formations, where proppant conductivity is critical, higher ceramic content is recommended. Conversely, in more permeable reservoirs, a 3:1 ceramic-to-silica ratio offers a cost-effective balance between conductivity and cost. If reservoir permeability is poor and cost constraints are less stringent, a higher proportion of silica sand (e.g., 1:1 or 1:3) may be considered, though this will entail reduced conductivity.
3.2.3. Influence of Proppant Size on the Propped Fracture Conductivity
During hydraulic fracturing, proppants with larger particle sizes can maintain high fracture conductivity due to the formation of larger pore spaces within the proppant pack. However, under high closure stress, these larger particles are more susceptible to crushing resulting in a significant decline in fracture conductivity. Conversely, smaller particle size proppants exhibit lower crushing rates under identical conditions and demonstrate more stable performance at elevated closure stress, although their initial conductivity is relatively lower. Given the different characteristics of proppants, the relationship between particle size, crushing rate, and fracture conductivity across various proppant sizes was examined in this section.
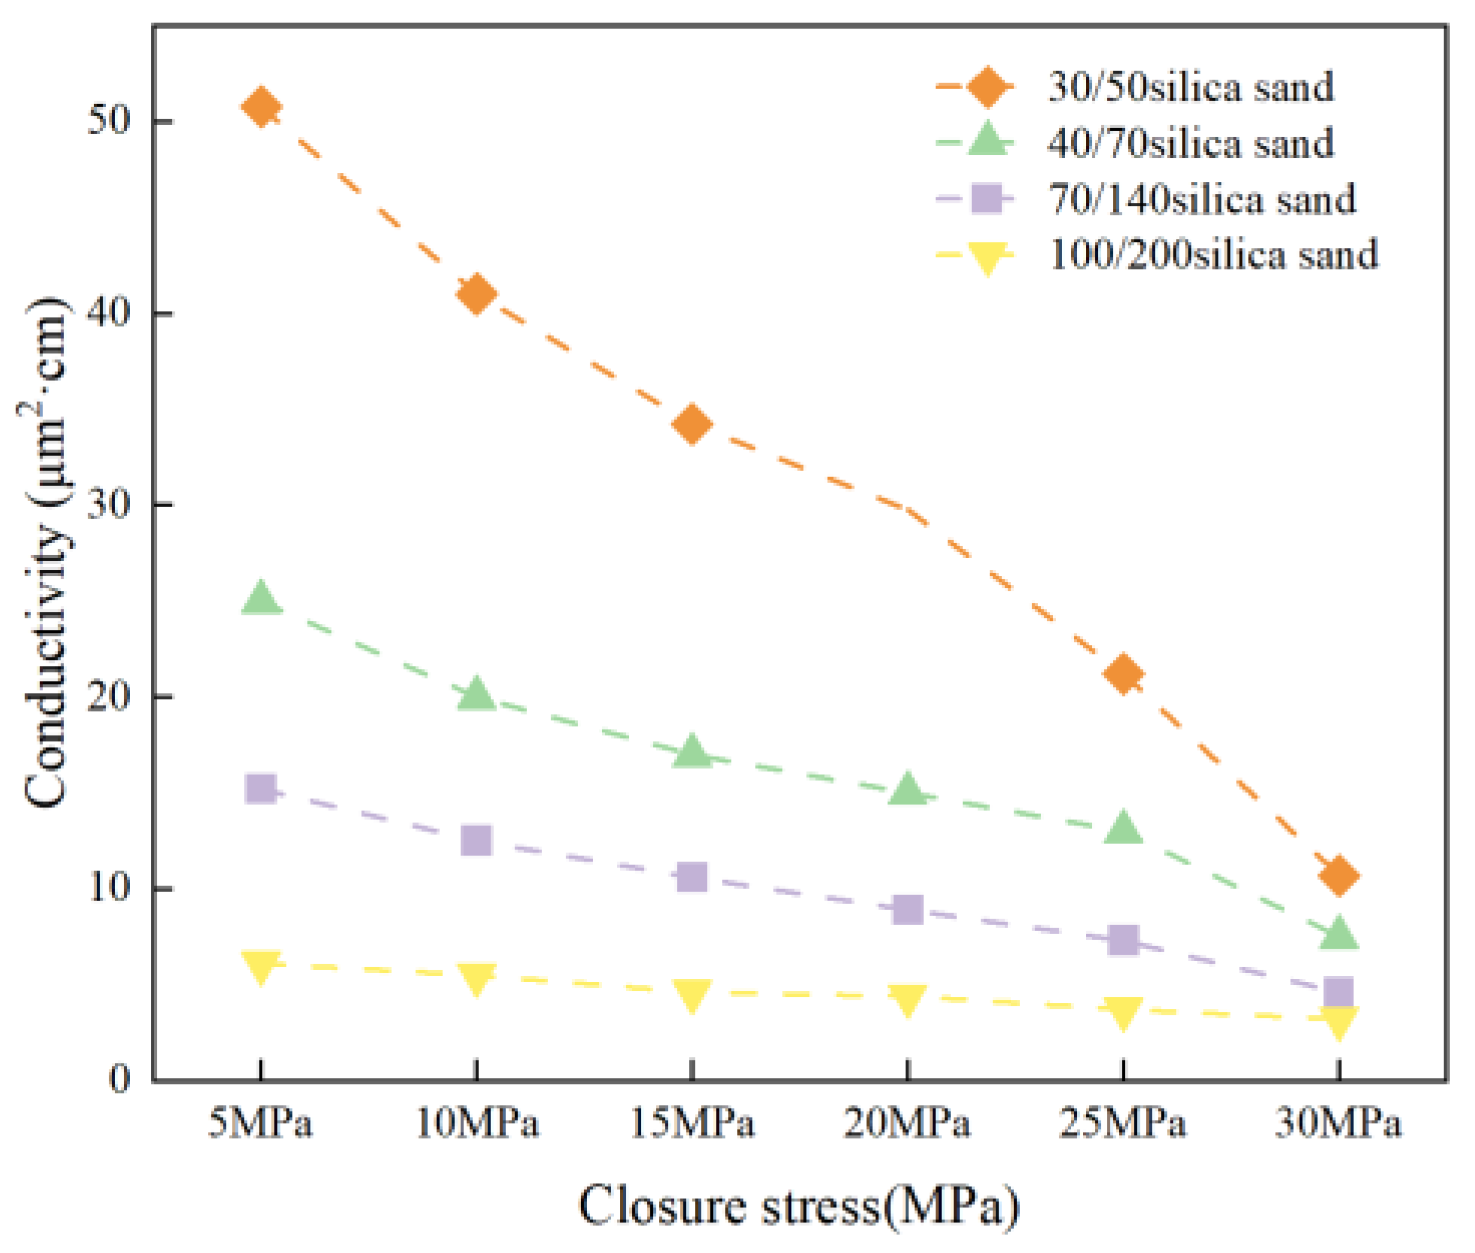
Silica sand proppants of four different mesh sizes (30/50, 40/70, 70/140, and 100/200) were evaluated under closure stress ranging from 5 MPa to 30 MPa. A uniform proppant pack concentration of 6 kg/m2 was used in all tests. The corresponding experimental results are presented in Figure 11. Changes in the conductivity when the closure stress is 5 and 30 MPa for the mixtures are also shown in Figure 12.
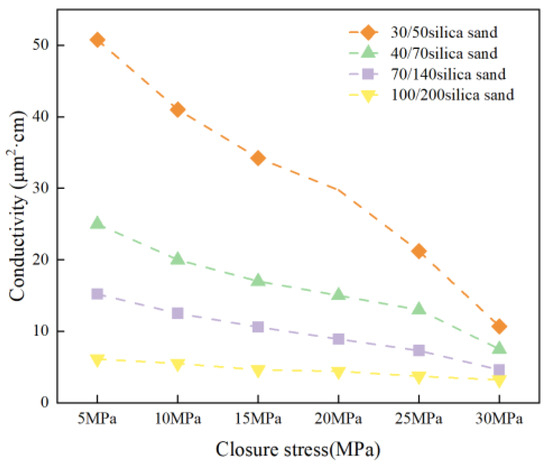
Figure 11.
Conductivity of silica sand with different mesh size.
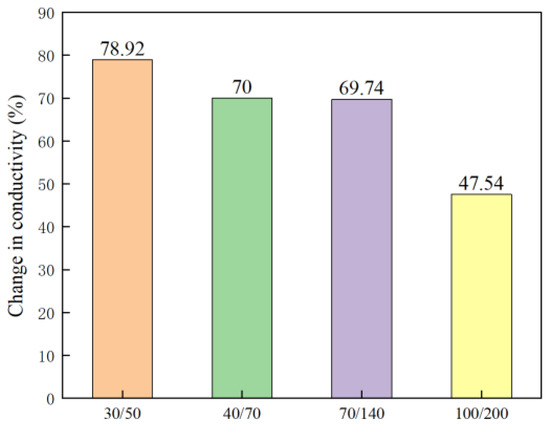
Figure 12.
Change in conductivity of silica sand with varying mesh size.
At all tested closure stress, the 30/50 mesh silica sand exhibited higher flow conductivity than the finer 100/200 mesh sand. In general, fracture conductivity increased with particle size. However, as closure stress increased, the rate of conductivity decline for the coarser proppants was significantly higher than that observed for the finer proppants as shown in Figure 12. This phenomenon can be attributed to the structural configuration of the proppant pack. Larger particles usually form larger pore spaces and offer higher initial permeability under low closure stress. However, due to the smaller contact area between particles, each contact point bears a higher localized stress, increasing the likelihood of particle failure. Consequently, larger particles experience a higher crushing rate under elevated pressures, which accelerates the loss of fracture conductivity. Under a closure stress of 30 MPa, the differences in conductivity among the four silica sand sizes become minimal due to the increased damage of the larger particles.
3.2.4. Influence of Proppant Combination Varying Mesh Size on the Propped Fracture Conductivity
The results regarding the crushing rate and fracture conductivity of proppants with varying particle sizes presented in the previous section imply that the exclusive use of large-particle proppants yields higher conductivity under low closure stress. However, the difference in fracture conductivity between different particle sizes diminishes at higher closure stress. This trend is attributed to the increased susceptibility of larger proppants to breakage under high stress, with the resulting fines blocking the previously formed fluid pathways and causing a rapid decline in fracture conductivity.
While smaller-particle proppants exhibit greater mechanical stability and resistance to high closure stress, their limited pore-forming capacity leads to lower fracture conductivity, which may be insufficient to achieve the objectives of hydraulic fracturing. Therefore, it is necessary to investigate whether blending proppants of different particle sizes can optimize both crushing resistance and flow conductivity. The goal is to assess whether such combinations can mitigate the adverse effects of particle breakage while satisfying the flow performance requirements of fracturing design, thereby providing a theoretical foundation for proppant optimization in field applications.
To examine the influence of particle size combinations on fracture conductivity, experiments were conducted using silica sand of 30/50 and 70/140 mesh sizes with mass ratios of 0:1, 1:3, 1:1, 3:1, and 1:0. Due to the limitations of the sieve analysis method, it is not feasible to accurately determine the crushing rate of mixed-size proppant systems. Specifically, using the sieve corresponding to the lower size limit may fail to differentiate between crushed large particles and intact smaller particles, potentially leading to an overestimation of the crushing rate. As a result, this section does not directly measure the crushing rate of the blended samples. Instead, the analysis relies on the previously established fragmentation behavior of single-size silica sand, in combination with the flow conductivity results from the mixed-size proppant experiments, to infer the general trend in crushing behavior presented in Figure 13. The change in the conductivity when the closure stress increased from 5 to 30 MPa was shown in Figure 14.
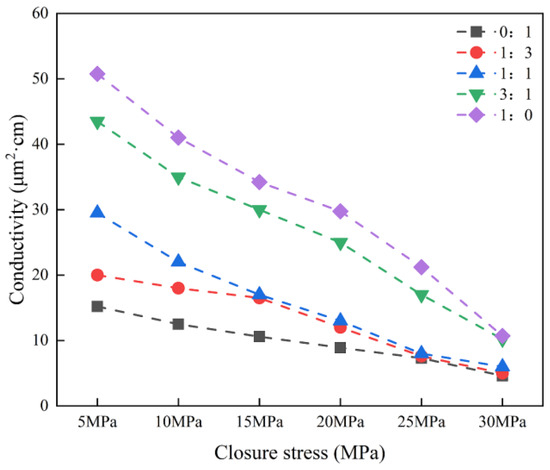
Figure 13.
Conductivity of silica sand combination with different mesh size.

Figure 14.
Change in conductivity of 30/50 and 70/140 silica sand with varying ratios.
As illustrated in the figure above, the flow conductivity of the combined silica sand samples composed of two distinct particle sizes exceeds that of the fine-grained (70/140 mesh) silica sand alone, due to the contribution of the coarser (30/50 mesh) particles that inherently provide greater pore space and, thus, higher flow capacity. However, the conductivity of the combined system remains lower than that of the coarse-grained silica sand alone, as the finer particles partially occupy the pore spaces created by the larger particles, thereby reducing overall permeability.
The difference in flow conductivity among the various combinations is more pronounced under low closure stress. When the closure stress reaches 30 MPa, the flow conductivity values of the 1:0 and 3:1 mixtures of 30/50 mesh to 70/140 mesh silica sand converge, indicating a diminishing influence of particle size on conductivity at higher stress levels. This can be attributed to the increased breakage of larger particles under high closure stress, which compromises the integrity of the proppant pack and reduces flow pathways. The change in the conductivity is similar for the tested mixtures.
Under low closure stress, the 30/50 mesh silica sand forms larger inter granular pore spaces and yields a proppant pack with higher permeability compared to the 70/140 mesh sand. However, under elevated closure stress, the larger particles are more susceptible to crushing, leading to a more significant reduction in conductivity. Introducing a greater proportion of fine particles enhances the contact area between particles, thereby improving the mechanical stability and compressive strength of the proppant mixture. Consequently, the rate of conductivity decline is mitigated.
These findings suggest that combining proppants of different particle sizes in appropriate proportions can offer enhanced crushing resistance while maintaining moderate conductivity. Based on the experimental results, a 3:1 mixture of 30/50 mesh to 70/140 mesh silica sand is recommended in field where moderate flow conductivity is sufficient, providing a cost-effective and mechanically robust proppant solution under varying formation conditions.
3.2.5. Influence of Proppant Pack Concentration on the Propped Fracture Conductivity
Proppant pack concentration refers to the mass of proppant per unit area within the propped fracture. The conductivity of a fracture is largely dependent on its width; therefore, increasing the sand concentration contributes to the widening of the fracture, thereby enhancing its flow capacity. However, higher sand concentrations require the injection of greater quantities of proppant, which not only increases operational costs but also raises the complexity and difficulty of the fracturing process. Consequently, it is essential to investigate the relationship between proppant pack concentration, proppant crushing rate, and flow conductivity, in order to determine an optimal concentration that balances conductivity performance with economic and operational feasibility.
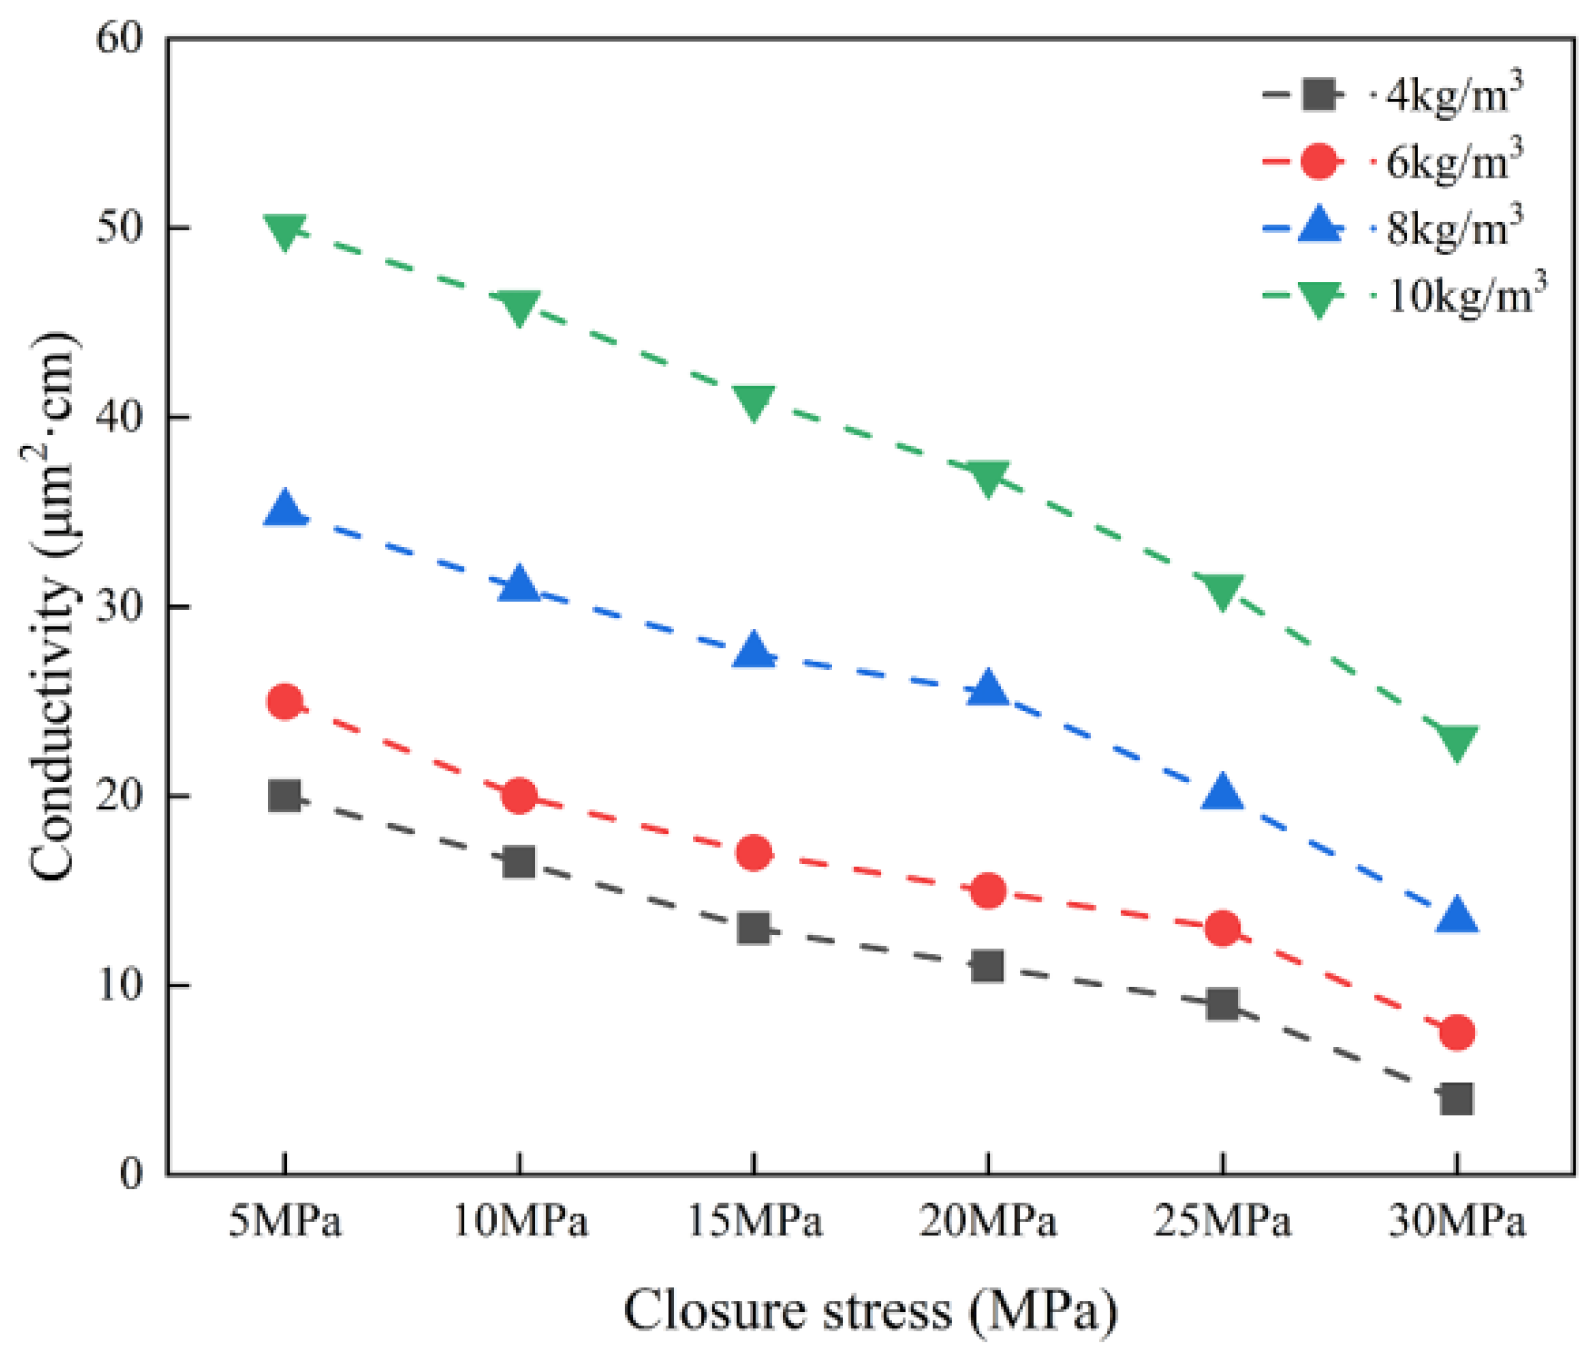
In this study, 40/70 mesh silica sand was employed as the proppant, with the proppant pack concentrations set at 4, 6, 8, and 10 kg/m2. The experimental results of proppant performance under varying closure stress are presented in Figure 15 and Figure 16. Change in the conductivity when the closure stress increasing from 5 to 30 MPa is shown in Figure 17.
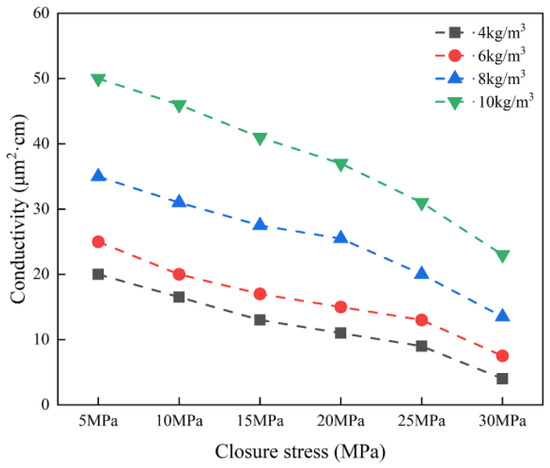
Figure 15.
Conductivity of 40/70 mesh silica sand with different proppant pack concentration.
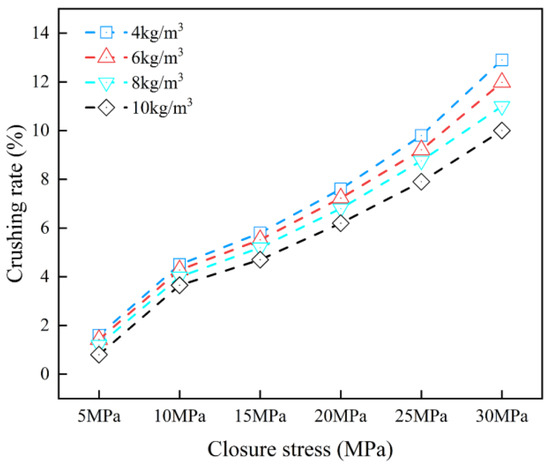
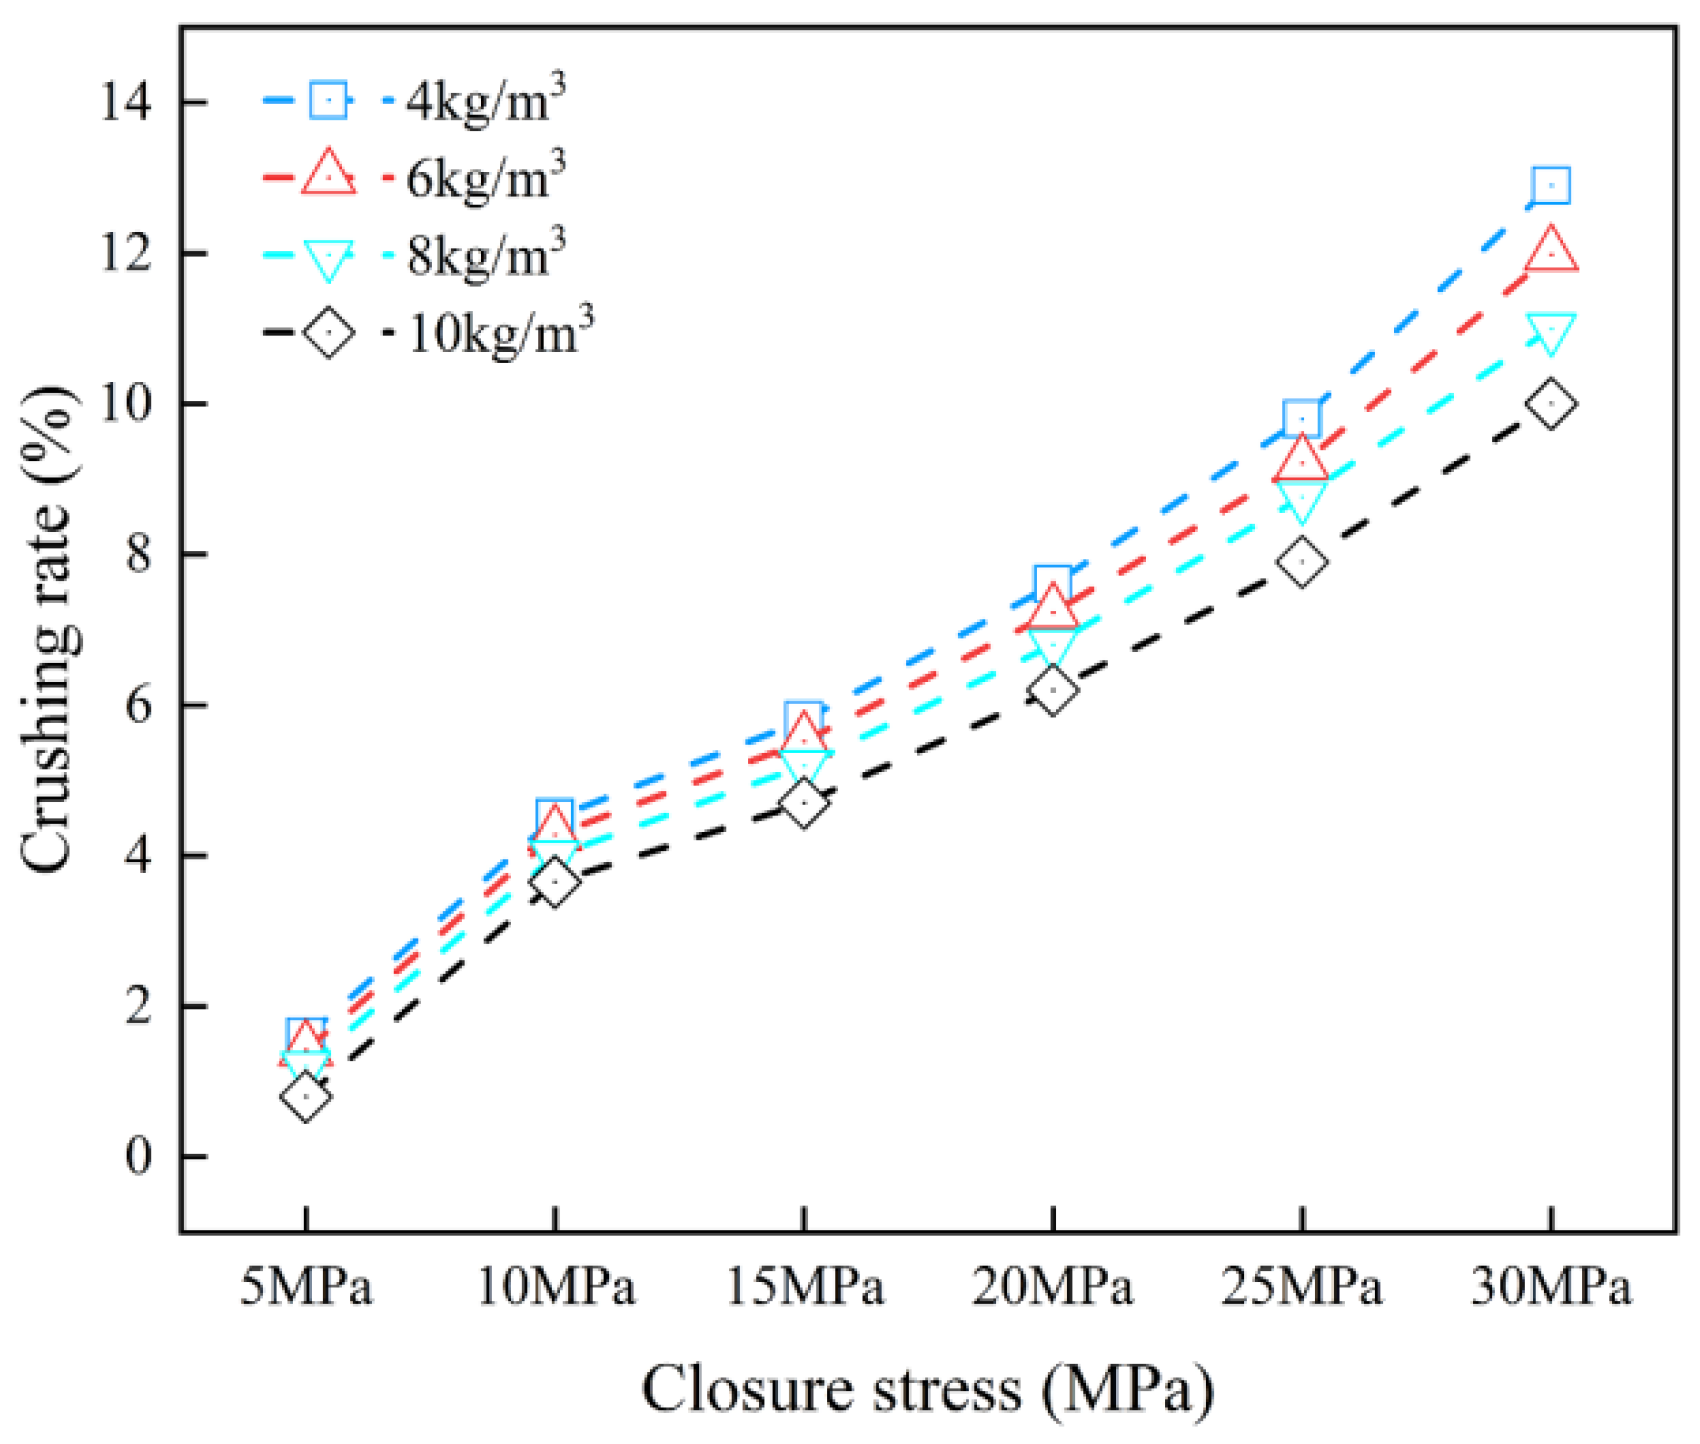
Figure 16.
Crushing rate of 40/70 mesh silica sand with different proppant pack concentration.
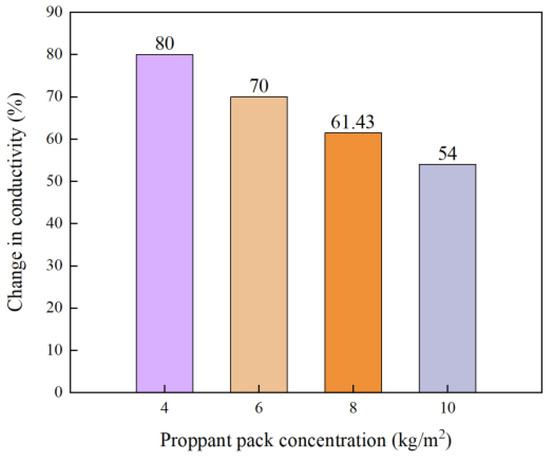
Figure 17.
Change in conductivity of 40/70 silica sand with pack concentrations.
The experimental results reveal that under constant proppant particle size, an increase in sand concentration results in a wider propped fracture, which subsequently enhances flow conductivity. The reduction in conductivity is also decreased as the proppant pack concentration increasing as shown in Figure 17. Within the fracture, the proppant can be broadly divided into two regions: the central zone and the marginal zone in contact with the fracture walls. In the central region, proppant particles are surrounded by neighboring grains, forming multiple contact points that promote a more uniform distribution of stress. In contrast, particles located near the fracture walls have fewer contact points and are subject to higher localized stress concentrations, making them more susceptible to crushing.
At lower sand concentrations, a greater proportion of the proppant resides in this marginal region, leading to an elevated crushing rate. Proppant breakage not only reduces the effective fracture width but also generates fines that can block the pore spaces and flow channels within the proppant pack, thereby further diminishing fracture conductivity. These findings underscore the importance of selecting an appropriate sand concentration that mitigates particle crushing while maximizing flow capacity.
The results indicate that the proppant crushing rate exerts a dominant influence on propped fracture conductivity. Specifically, combinations of ceramic and silica sand, silica sand with varying mesh sizes, and higher proppant pack concentrations can enhance conductivity. Additionally, distilled water was utilized in the conductivity measurements in this study. However, the choice of fluid, which can vary significantly in physical and chemical properties, also has a substantial impact on conductivity. Given the diverse fracturing fluids used in field applications, future research should examine the combined effects of fluid properties and proppant selection to provide a comprehensive understanding of the relationship between proppant, fracturing fluid, and propped fracture conductivity.
4. Conclusions
This study presents a comprehensive experimental investigation into the influence of proppant crushing on the propped fractures conductivity under varying experimental conditions. The results showed that the crushing rate of silica sand is much higher than that of ceramic proppants and it is positively correlated with particle size. The differences in flow conductivity among 30/50 mesh silica sand, ceramic proppants, and coated ceramic proppants are relatively minor when the closure stress is lower. However, as the closure stress increases to 25 MPa, the conductivity of silica sand declines significantly, while that of ceramic and coated ceramic proppants remains relatively stable. This disparity is attributed to the rapid increase in the crushing rate of silica sand under elevated closure stress, whereas the ceramic and coated ceramic proppants exhibit relatively minor increases in the crushing rate, thus preserving their structural integrity and conductivity.
For the combination of silica sand and ceramic proppants, an increased proportion of ceramic material results in a lower overall crushing rate and enhanced flow conductivity. This effect becomes especially pronounced under high closure stress. Large-grained silica sand demonstrates superior flow conductivity compared to smaller grains under low closure stress; however, this advantage diminishes as closure stress increases. The combination of large and small particle-size proppants can enhance the compressive strength of the proppant pack while maintaining adequate flow capacity. These findings are in line with the case study reported previously [42]. Moreover, increasing the proppant pack concentration under identical experimental conditions leads to a reduction in the crushing rate and a corresponding improvement in flow conductivity. These findings offer a theoretical foundation and practical guidance for improving the flow conductivity of propped fractures in tight sandstone reservoirs and for the selection and optimization of proppant types and configurations in hydraulic fracturing operations.
Author Contributions
Conceptualization, W.W., D.Z.; methodology, W.W., T.G.; formal analysis, W.W.; investigation, Y.Y., X.Y., S.X.; resources, T.G.; writing—original draft preparation, W.W.; writing—review and editing, D.Z.; visualization, S.X.; supervision, D.Z.; funding acquisition, D.Z. All authors have read and agreed to the published version of the manuscript.
Funding
This work is supported by the National Natural Science Foundation of China (U23B2089) and the Major Scientific and Technological Project of Liaohe Oilfield (2024KJZX-05-04).
Data Availability Statement
The authors confirm that the data is provided within the article.
Conflicts of Interest
Authors Wen Wang, Tuan Gu, Yanhua Yan and Xin Yang were employed by the PetroChina Liaohe Oilfield Company. Author Shucan Xu was employed by the PetroChina Tarim Oilfield Company. The remaining authors declare that the research was conducted in the absence of any commercial or financial relationships that could be constructed as a potential conflict of interest. The companies had no role in the design of the study; in the collection, analyses, or interpretation of data; in the writing of the manuscript, or in the decision to publish the results.
References
- Peng, X.; Wang, X.; Zhang, Y.; Huang, X.; Zeng, F. Experimental study of strong imbibition in microcapillaries representing pore/throat characteristics of tight rocks. Fuel 2023, 342, 127775. [Google Scholar] [CrossRef]
- Gu, X.; Yan, D.; Zhang, Z.; Liu, Z.; Jing, C.; Meng, X.; Liu, Y. Study on the Wettability Alteration of Tight Sandstone by Low-Frequency Vibration and Nanofluid. ACS Omega 2024, 9, 5705–5714. [Google Scholar] [CrossRef] [PubMed]
- Ahmadi, Y.; Malekpour, M.; Kikhavani, T.; Bayati, B. The study of the spontaneous oil imbibition in the presence of new polymer-coated nanocomposites compatible with reservoir conditions. Pet. Sci. Technol. 2024, 42, 974–992. [Google Scholar] [CrossRef]
- Zou, C.; Zhu, R.; Liu, K.; Su, L.; Bai, B.; Zhang, X.; Yuan, X.; Wang, J. Tight gas sandstone reservoirs in China: Characteristics and recognition criteria. J. Pet. Sci. Eng. 2012, 88, 82–91. [Google Scholar] [CrossRef]
- Lai, J.; Wang, G.; Wang, Z.; Chen, J.; Pang, X.; Wang, S.; Zhou, Z.; He, Z.; Qin, Z.; Fan, X. A review on pore structure characterization in tight sandstones. Earth-Sci. Rev. 2018, 177, 436–457. [Google Scholar] [CrossRef]
- Reinicke, A.; Rybacki, E.; Stanchits, S.; Huenges, E.; Dresen, G. Hydraulic fracturing stimulation techniques and formation damage mechanisms—Implications from laboratory testing of tight sandstone–proppant systems. Geochemistry 2010, 70, 107–117. [Google Scholar] [CrossRef]
- Guo, J.; Lu, Q.; Liu, Z.; Zeng, F.; Guo, T.; Liu, Y.; Liu, L.; Qiu, L. Concept and key technology of “multi-scale high-density” fracturing technology: A case study of tight sandstone gas reservoirs in the western Sichuan Basin. Nat. Gas Ind. B 2023, 10, 283–292. [Google Scholar] [CrossRef]
- Gillard, M.; Medvedev, O.; Peña, A.; Medvedev, A.; Penacorada, F.; d’Huteau, E. A new approach to generating fracture conductivity. In Proceedings of the SPE Annual Technical Conference and Exhibition, Florence, Italy, 19–22 September 2010; p. SPE–135034–MS. [Google Scholar]
- Elsarawy, A.M.; Nasr-El-Din, H.A. Propped fracture conductivity in shale reservoirs: A review of its importance and roles in fracturing fluid engineering. In Proceedings of the SPE Kingdom of Saudi Arabia Annual Technical Symposium and Exhibition, Dammam, Saudi Arabia, 23–26 April 2018; p. SPE–192451–MS. [Google Scholar]
- Mack, M.G.; Coker, C.E. Proppant selection for shale reservoirs: Optimizing conductivity, proppant transport and cost. In Proceedings of the SPE Unconventional Resources Conference, Calgary, Alberta, Canada, 5-7 November 2013; p. SPE–167221–MS. [Google Scholar]
- Wang, J.; Elsworth, D. Role of proppant distribution on the evolution of hydraulic fracture conductivity. J. Pet. Sci. Eng. 2018, 166, 249–262. [Google Scholar] [CrossRef]
- Fan, M.; Han, Y.; Gu, M.; McClure, J.; Ripepi, N.; Westman, E.; Chen, C. Investigation of the conductivity of a proppant mixture using an experiment/simulation-integrated approach. J. Nat. Gas Sci. Eng. 2020, 78, 103234. [Google Scholar] [CrossRef]
- Ramlan, A.S.; Zin, R.M.; Bakar, N.F.A.; Othman, N.H. Recent progress on proppant laboratory testing method: Characterisation, conductivity, transportation, and erosivity. J. Pet. Sci. Eng. 2021, 205, 108871. [Google Scholar] [CrossRef]
- Hari, S.; Krishna, S.; Gurrala, L.N.; Singh, S.; Ranjan, N.; Vij, R.K.; Shah, S.N. Impact of reservoir, fracturing fluid and proppant characteristics on proppant crushing and embedment in sandstone formations. J. Nat. Gas Sci. Eng. 2021, 95, 104187. [Google Scholar] [CrossRef]
- Tian, F.; Jia, Y.; Yang, L.; Liu, X.; Guo, X.; Martyushev, D.A. Experimental study on factors affecting fracture conductivity. Processes 2024, 12, 1465. [Google Scholar] [CrossRef]
- Liang, F.; Sayed, M.; Al-Muntasheri, G.; Chang, F.F. Overview of existing proppant technologies and challenges. In Proceedings of the SPE Middle East Oil & Gas Show and Conference, Manama, Bahrain, 8–11 March 2015; p. SPE–172763–MS. [Google Scholar]
- Kamel, A.; Salem, Z.; Chemini, R.; Khodja, M.; Allia, K. Characterization of natural sand proppant used in hydraulic fracturing fluids. Part. Sci. Technol. 2019, 37, 716–724. [Google Scholar] [CrossRef]
- Shafiq, M.U.; Alajmei, S.; Aljawad, M.S.; Wang, L.; Bahri, A. A Comprehensive Review of Proppant Selection in Unconventional Reservoirs. ACS Omega 2025, 10, 13046–13059. [Google Scholar] [CrossRef]
- Zhao, J.; Liu, Z.; Li, Y. Preparation and characterization of low-density mullite-based ceramic proppant by a dynamic sintering method. Mater. Lett. 2015, 152, 72–75. [Google Scholar] [CrossRef]
- Ma, X.; Tian, Y.; Zhou, Y.; Wang, K.; Chai, Y.; Li, Z. Sintering temperature dependence of low-cost, low-density ceramic proppant with high breakage resistance. Mater. Lett. 2016, 180, 127–129. [Google Scholar] [CrossRef]
- Ding, D.; Fang, Y.; Xiao, G.; Zhu, X.; Fu, P.; Chong, X. Effects of sintering temperature on microstructure and properties of low-grade bauxite-based ceramic proppant. Int. J. Appl. Ceram. Technol. 2021, 18, 1832–1844. [Google Scholar] [CrossRef]
- Xie, X.; Niu, S.; Miao, Y.; Gao, X.; Cheng, L.; Gao, F. Preparation and properties of resin coated ceramic proppants with ultra light weight and high strength from coal-series kaolin. Appl. Clay Sci. 2019, 183, 105364. [Google Scholar] [CrossRef]
- Fan, F.; Li, F.-X.; Tian, S.-C.; Sheng, M.; Khan, W.; Shi, A.-P.; Zhou, Y.; Xu, Q. Hydrophobic epoxy resin coated proppants with ultra-high self-suspension ability and enhanced liquid conductivity. Pet. Sci. 2021, 18, 1753–1759. [Google Scholar] [CrossRef]
- Liu, P.; Huang, Q.; Li, J.; Du, J.; Lu, X.; Liu, J.; Liu, C.; Lan, X. Review and perspectives of coated proppant technology. Energy Fuels 2023, 37, 3355–3370. [Google Scholar] [CrossRef]
- Zheng, W.; Silva, S.C.; Tannant, D.D. Crushing characteristics of four different proppants and implications for fracture conductivity. J. Nat. Gas Sci. Eng. 2018, 53, 125–138. [Google Scholar] [CrossRef]
- Dilireba, T.; Wang, J. Effect of Proppant Damages on Fracture Conductivity and Long-Term Recovery in Shale Gas Reservoirs. Energy Fuels 2024, 38, 11695–11705. [Google Scholar] [CrossRef]
- Yin, B.; Zhang, Y.; Lou, Y.; Liu, S. Damage mechanism of proppant and conductivity reduction post fracturing in unconventional reservoirs. FUEL 2025, 380, 133086. [Google Scholar] [CrossRef]
- Gidley, J.L.; Penny, G.S.; McDaniel, R.R. Effect of proppant failure and fines migration on conductivity of propped fractures. SPE Prod. Facil. 1995, 10, 20–25. [Google Scholar] [CrossRef]
- Palisch, T.; Duenckel, R.; Chapman, M.; Woolfolk, S.; Vincent, M.C. How to use and misuse proppant crush tests–exposing the top 10 myths. In Proceedings of the SPE Hydraulic Fracturing Technology Conference, The Woodlands, TX, USA, 19–21 January 2009; p. SPE–119242–MS. [Google Scholar]
- Chen, S.; Wang, J.; Yang, Y. Numerical simulation of oil-water two-phase conductivity in hydraulic fracturing considering proppant crushing. J. Phys. Conf. Ser. 2023, 2503, 012026. [Google Scholar] [CrossRef]
- Bandara, K.; Ranjith, P.G.; Rathnaweera, T.D. Proppant crushing mechanisms under reservoir conditions: Insights into long-term integrity of unconventional energy production. Nat. Resour. Res. 2019, 28, 1139–1161. [Google Scholar] [CrossRef]
- Han, J.; Wang, J.Y. Fracture conductivity decrease due to proppant deformation and crushing, a parametrical study. In Proceedings of the SPE Eastern Regional Meeting, Charleston, WV, USA, 21–23 October 2014; p. SPE–171019–MS. [Google Scholar]
- Han, J.; Wang, J.Y.; Puri, V. A fully coupled geomechanics and fluid flow model for proppant pack failure and fracture conductivity damage analysis. In Proceedings of the SPE Hydraulic Fracturing Technology Conference, The Woodlands, TX, USA, 4–6 February 2014; p. SPE–168617–MS. [Google Scholar]
- Man, S.; Wong, R.C.-K. Compression and crushing behavior of ceramic proppants and sand under high stresses. J. Pet. Sci. Eng. 2017, 158, 268–283. [Google Scholar] [CrossRef]
- Zheng, W.; Tannant, D.D. Influence of proppant fragmentation on fracture conductivity-insights from three-dimensional discrete element modeling. J. Pet. Sci. Eng. 2019, 177, 1010–1023. [Google Scholar] [CrossRef]
- Mittal, A.; Rai, C.S.; Sondergeld, C.H. Proppant-conductivity testing under simulated reservoir conditions: Impact of crushing, embedment, and diagenesis on long-term production in shales. SPE J. 2018, 23, 1304–1315. [Google Scholar] [CrossRef]
- Jianguang, W.; Xiaofeng, Z.; Xiaofei, F.; Yinghe, C.; Fan, B. Experimental investigation of long-term fracture conductivity filled with quartz sand: Mixing proppants and closing pressure. Int. J. Hydrogen Energy 2021, 46, 32394–32402. [Google Scholar] [CrossRef]
- Guo, Z.; Chen, D.; Chen, Y. Numerical Calculation and Application for Crushing Rate and Fracture Conductivity of Combined Proppants. Energies 2024, 17, 3868. [Google Scholar] [CrossRef]
- Vega, F.G.; Carlevaro, C.M.; Baldini, M.; Madrid, M.A.; Pugnaloni, L.A. Simulation of proppant conductivity test: Effect of particle size dispersion. Pet. Sci. Technol. 2025, 43, 1010–1028. [Google Scholar] [CrossRef]
- ASTM, E. Standard specification for woven wire test sieve cloth and test sieves. In ASTM International; American Society for Testing and Materials: Conshohocken, PA, USA, 2017. [Google Scholar]
- Yang, H.; Liu, Y.-L.; Bai, G.-L.; Feng, Z.; Zhang, Y.; Xia, S.-B. Solidification and utilization of water-based drill cuttings to prepare ceramsite proppant with low-density and high performance. Pet. Sci. 2022, 19, 2314–2325. [Google Scholar] [CrossRef]
- Hu, K.; Sun, J.; Wong, J.; Hall, B. Proppants selection based on field case studies of well production performance in the Bakken shale play. In Proceedings of the SPE Western North American and Rocky Mountain Joint Meeting, Denver, CO, USA, 15–18 April 2014; p. SPE-169566-MS. [Google Scholar]


Disclaimer/Publisher’s Note: The statements, opinions and data contained in all publications are solely those of the individual author(s) and contributor(s) and not of MDPI and/or the editor(s). MDPI and/or the editor(s) disclaim responsibility for any injury to people or property resulting from any ideas, methods, instructions or products referred to in the content. |
© 2025 by the authors. Licensee MDPI, Basel, Switzerland. This article is an open access article distributed under the terms and conditions of the Creative Commons Attribution (CC BY) license (https://creativecommons.org/licenses/by/4.0/).