Article

Effect of Additives on Properties of Phase-Change Solidified Plugging Materials

1
North China Petroleum Bureau, SINOPEC, Zhengzhou 450000, China
2
Key Laboratory of Deep CBM Exploration and Production Technology, SINOPEC, Zhengzhou 450000, China
3
National Key Laboratory of Oil & Gas Reservoir Geology and Exploitation, Southwest Petroleum University, Chengdu 610500, China
4
College of Energy, Chengdu University of Technology, Chengdu 610059, China
*
Author to whom correspondence should be addressed.
Processes 2025, 13(7), 2160; https://doi.org/10.3390/pr13072160
Submission received: 26 May 2025 / Revised: 28 June 2025 / Accepted: 1 July 2025 / Published: 7 July 2025
(This article belongs to the Section Materials Processes)

Abstract

The phase-change solidification plugging material (PSPM), a novel type of plugging material for severe fluid loss in demanding formations, necessitates performance enhancement and deeper insight into its hydration mechanism. In this paper, with a foundational formula comprising a nucleating agent (S1), activator (M1), and deionized water, a comprehensive investigation was conducted. This involved basic performance testing, including fluidity, setting or thickening time, hydration heat analysis, SEM and XRD for hydration products, and conduction of kinetics model. The focus was on analyzing the effects of three additives on system properties, hydration process, and hydration products, leading to the inference of the hydration mechanism of PSPM. It was found that the structure additives (SA) and flow pattern regulator (6301) did not partake in the hydration reaction, focusing instead on enhancing structure strength and maintaining slurry stability, respectively. Conversely, the phase regulator (BA) actively engaged in the hydration process, transitioning the system from the KG-N-D to the KG-D model, thereby extending the thickening time without altering the final hydration products. The morphology and composition of the products confirmed that SI and M1 dissolve in the aqueous solution and progressively form Mg(OH)2 and MgSO4·zMg(OH)2·xH2O. The slurry gradually solidifies, ultimately resulting in the formation of a high-strength consolidated body, thereby achieving the objective of lost circulation control.

1. Introduction

As exploration and development progress into deep and ultra-deep formations, fluid loss in fractured formations has emerged as a prominent issue [1,2,3]. Presently, three main challenges confront the control of leakages. Firstly, improperly handled frequent leakages can escalate to irreversible losses and well-controlled incidents like instability, collapse, or blowouts [4]. Secondly, high temperatures and pressures may prematurely degrade lost circulation materials, causing recurring leaks [5,6]. Lastly, inadequate fracture width determination results in low plugging efficacy and replication difficulties [7,8]. Hence, controlling malignant well leakages in fractured formations is paramount for advancing oil and gas exploration.
Compared to traditional lost circulation materials, solidified plugging materials offer the advantage of independent fracture width recognition, the capability to seal extensive leakage pathways, and higher plug strength, with the added benefit of post-application acid dissolution for restoring flow in reservoir sections, showcasing immense application potential [9,10,11]. Innovations in this field include Sentinel CemTM from Halliburton, MAGNE-SET solidified plugging materials from Baker Hughes, and domestically developed materials such as high-strength high-temperature chemical consolidation plugging materials (HDL-1), downhole crosslinked gel material (SF-1), acid-soluble cured plugging materials, and high-water-loss cured materials [12,13,14,15,16,17,18,19,20]. However, there are problems such as large material quantity (water + 150~230% HDL-1), high cost (MAGNE-SET solidified plugging materials).
In response, a novel phase-changing solidified plugging material (PSPM) was developed, comprising a base formulation (S1, M1, and deionized water) augmented with three additional additives. Through intricate hydration reactions among the components, the slurry thickens and solidifies, forming a high-strength consolidated mass that efficiently seals fractures [21,22,23]. The hydration reaction, crucial to the performance of acid-soluble cured sealants, is governed by the type, proportion, and microstructure of the hydration products, which constitute a complex, yet not fully elucidated, reaction process. Han [24] and He [25] analyzed the heat release characteristics of material hydration using isothermal calorimetry, while Dai [26] divided the hydration stage using the conductivity method. However, when the composition of the cured material changes, the hydration process also changes, and the previous studies have low guidance [27] for new materials.
This study centers on the phase-changing cured plugging material, utilizing flow tests, initial and final setting time tests, thickening time tests, and uniaxial compressive strength tests to evaluate the impact of the three additives on system performance. Building upon hydration heat experiments and applying the Krstulovic–Dabic theory [28,29,30], a kinetic model of the hydration reaction for the phase-changing cured plugging material is constructed to illuminate its hydration dynamics. SEM and XRD analyses delve into the microstructural and compositional characteristics of the hydration products, unraveling the underlying mechanism of the hydration reaction of this material. The research findings significantly contribute to enhancing the efficacy and application of phase-changing cured plugging materials in leak control.

2. Materials and Methods

2.1. Materials

Nucleating agent, the main component is MgO, called S1. Activator, the main component is magnesium, called M1. Structure additives are common calcareous minerals (main component of dolomite), called SAs. The flow pattern regulator is a kind of high polymer, called 6301. For the phase regulator, the main component is boric acid, called BA. The above materials were purchased by Xianfeng Xin Chemical Co., Ltd., Meishan, China. The dry material pictures are shown in Figure 1.

2.2. Methods

Initially, a 0.6% 6301 glue solution was prepared as the base. It was stirred at 1500 r/min for 2 h to fully dissolve the 6301. Next, the dry ingredients (S1 + M1 + SA) were mixed in a set ratio (around approximately 40~70% + 30~40% + 10~15% by weight of water) and added to the base liquid. Stir again for 5 min at the same speed to form a slurry. Thereafter, the slurry was heated in an 85 °C water bath for 24 h, producing a consolidated body. The group served as the experimental control, designated as Group A. Following the plan in Table 1, changes were made to include different amounts of 6301, SA, and BA, creating Groups B, C, and D. Using the same method as Group A, slurries and consolidated bodies were produced for these new groups. The experimental design of the hydration experiment is shown in Table 1. All the tests were repeated 2 to 3 times, the figures were plotted based on the average results, and the absolute error was guaranteed to be below 5%.

2.2.1. Slurry Fluidity Test

The fluidity test for the slurry was conducted in accordance with the GB/T 8077-2000 standard [31]. After the prepared slurry had been standing for 5 min, it was filled with a round mold, leveled, and lifted upright as a timer started. When flow on the glass exceeded 30 s, perpendicular diameters were measured and averaged for the slurry’s flowability.

2.2.2. Setting Time

The setting time of the PSPM specimens was tested using a Vicat device following GB/T 1346-2011 standards. The initial set occurred when the test needle, after easy insertion, sank to 4 ± 1 mm below the glass plate [32]. Post-initial set, the mold was promptly removed, flipped, and put in an oven. Final set checks were carried out every 30 min until the needle ring left no trace on the PSPM, after the initial setup and mold reorientation.

2.2.3. Thickening Time

The thickening time test is conducted in accordance with API Spec 10A [33]. The specific steps are as follows. The slurry was added to the autoclave of the thickening device, the experiment was initiated. The initial viscosity of the slurry was documented, followed by viscosity checks every 5 min until reaching or exceeding 40 Bc, with the thickening time noted accordingly. Throughout, the slurry was heated at a stable 85 °C in a water bath.

2.2.4. Compressive Strength

The PSPM slurry was poured into a standard cubic mold (508 mm × 508 mm × 508 mm) and subsequently subjected to a curing period of 24 h within a thermostatically controlled oven set at 85 °C. In compliance with the guidelines outlined in GB/T 19139-2012, the uniaxial compressive strength of the consolidated body was tested [34].

2.2.5. Characterizations

The microstructural characteristics of the hydration products were analyzed using Scanning Electron Microscopy (SEM), while their phase composition features were analyzed by X-ray diffraction (XRD, Rigaku Ultima IV model X-ray diffractometer). The scanning range of XRD was set to 50–90°, with a scanning speed maintained at 2° per minute. All the samples were PSPM cured at 85 °C for 24 h.

2.2.6. Heat of Hydration Test

The early hydration heat-releasing rate of the PSPM with different additive contents was measured using the Isothermal Calorimetry analyzer following the GB/T 12959-2008 standards [35].

2.2.7. Krstulovic–Dabic Model Construct

The Krstulovic–Dabic model, esteemed for its broad recognition and extensive application in the study of composite gelation systems, effectively mirrored the systemic reaction course and facilitated the derivation of hydration reaction mechanisms [28,29,30].
To establish the Krstulovic–Dabic model, accurate reaction progress (α) was first computed at time t via Equation (1). Since Qmax, the total hydration heat, could not be directly measured experimentally, Equation (2) (Knudsen extrapolation equation) was used to ascertain it. With Qmax known, it was fed into Equations (1) and (3) to derive the crucial parameters: hydration degree (α) and the reaction rate (/dt) for the model.
α ( t ) = Q ( t ) Q max
I Q ( t ) = 1 Q max + t 50 Q max ( t t 0 )
d a d t = d Q d t 1 Q max
In which α is the hydration degree, t is the reaction time, t0 is the start time of the acceleration period, and t50 is the time required for the heat release to reach 50% of the total heat release. Qmax is the total hydration heat, and /dt is the reaction rate.
Based on the Krstulovic–Dabic model, the hydration reaction process of the PSPM was divided into three basic processes according to the Krstulovic–Dabic model, namely nucleation and crystal growth (NG), phase boundary reaction (I), and diffusion (D). These may occur simultaneously, but the overall hydration rate was governed by the slowest of these reactions, implying that the stage with the lowest reactivity determined the reaction rate and mechanism governing that particular stage of the process. Krstulovic supplied the integral and differential expressions of the three processes to express the kinetic equation between the hydration process and reaction time, that is,
Nucleation and crystal growth (NG):
[ ln ( α ) ] 1 / n = K 1 ( t t 0 ) = K 1 ( t t 0 ) ,   0 t
Phase boundary reaction (I):
1 ( 1 α ) 1 / 3 = K 2 r 1 ( t t 0 ) = K 2 ( t t 0 ) ,   0 t
Diffusion (D):
[ 1 ( 1 α ) 1 / 3 ] 2 = K 3 r 2 ( t t 0 ) = K 3 ( t t 0 ) ,   0 t
In which n is the reaction order, K1, K2, and K3 are the reaction rate constants for three stages. K1′, K2′, and K3′ are the reaction rate constants considering the particle radius. r is the diameter of the reacted particle. Here, the particle diameter was not considered.
Differentiation of Equations (4)–(6) was performed to derive the corresponding kinetic equations, thereby expressing the hydration rates of three processes as follows (Equations (7)–(9)).
Nucleation and crystal growth (NG):
d α d t = F N G ( α ) = K 1 n ( 1 α ) [ ln ( 1 α ) ] n 1 / n
Phase boundary reaction (I):
d α d t = F I ( α ) = K 2 × 3 ( 1 α ) 2 / 3
Diffusion (D):
d α d t = F D ( α ) = K 3 × 3 ( 1 α ) 2 / 3 / [ 2 2 ( 1 α ) 1 / 3 ]
In which FNG(α), FI(α), and FD(α) are the respective reaction functions for the three stages.

3. Results and Discussions

3.1. Effects of Additives on Engineering Properties of PSPM

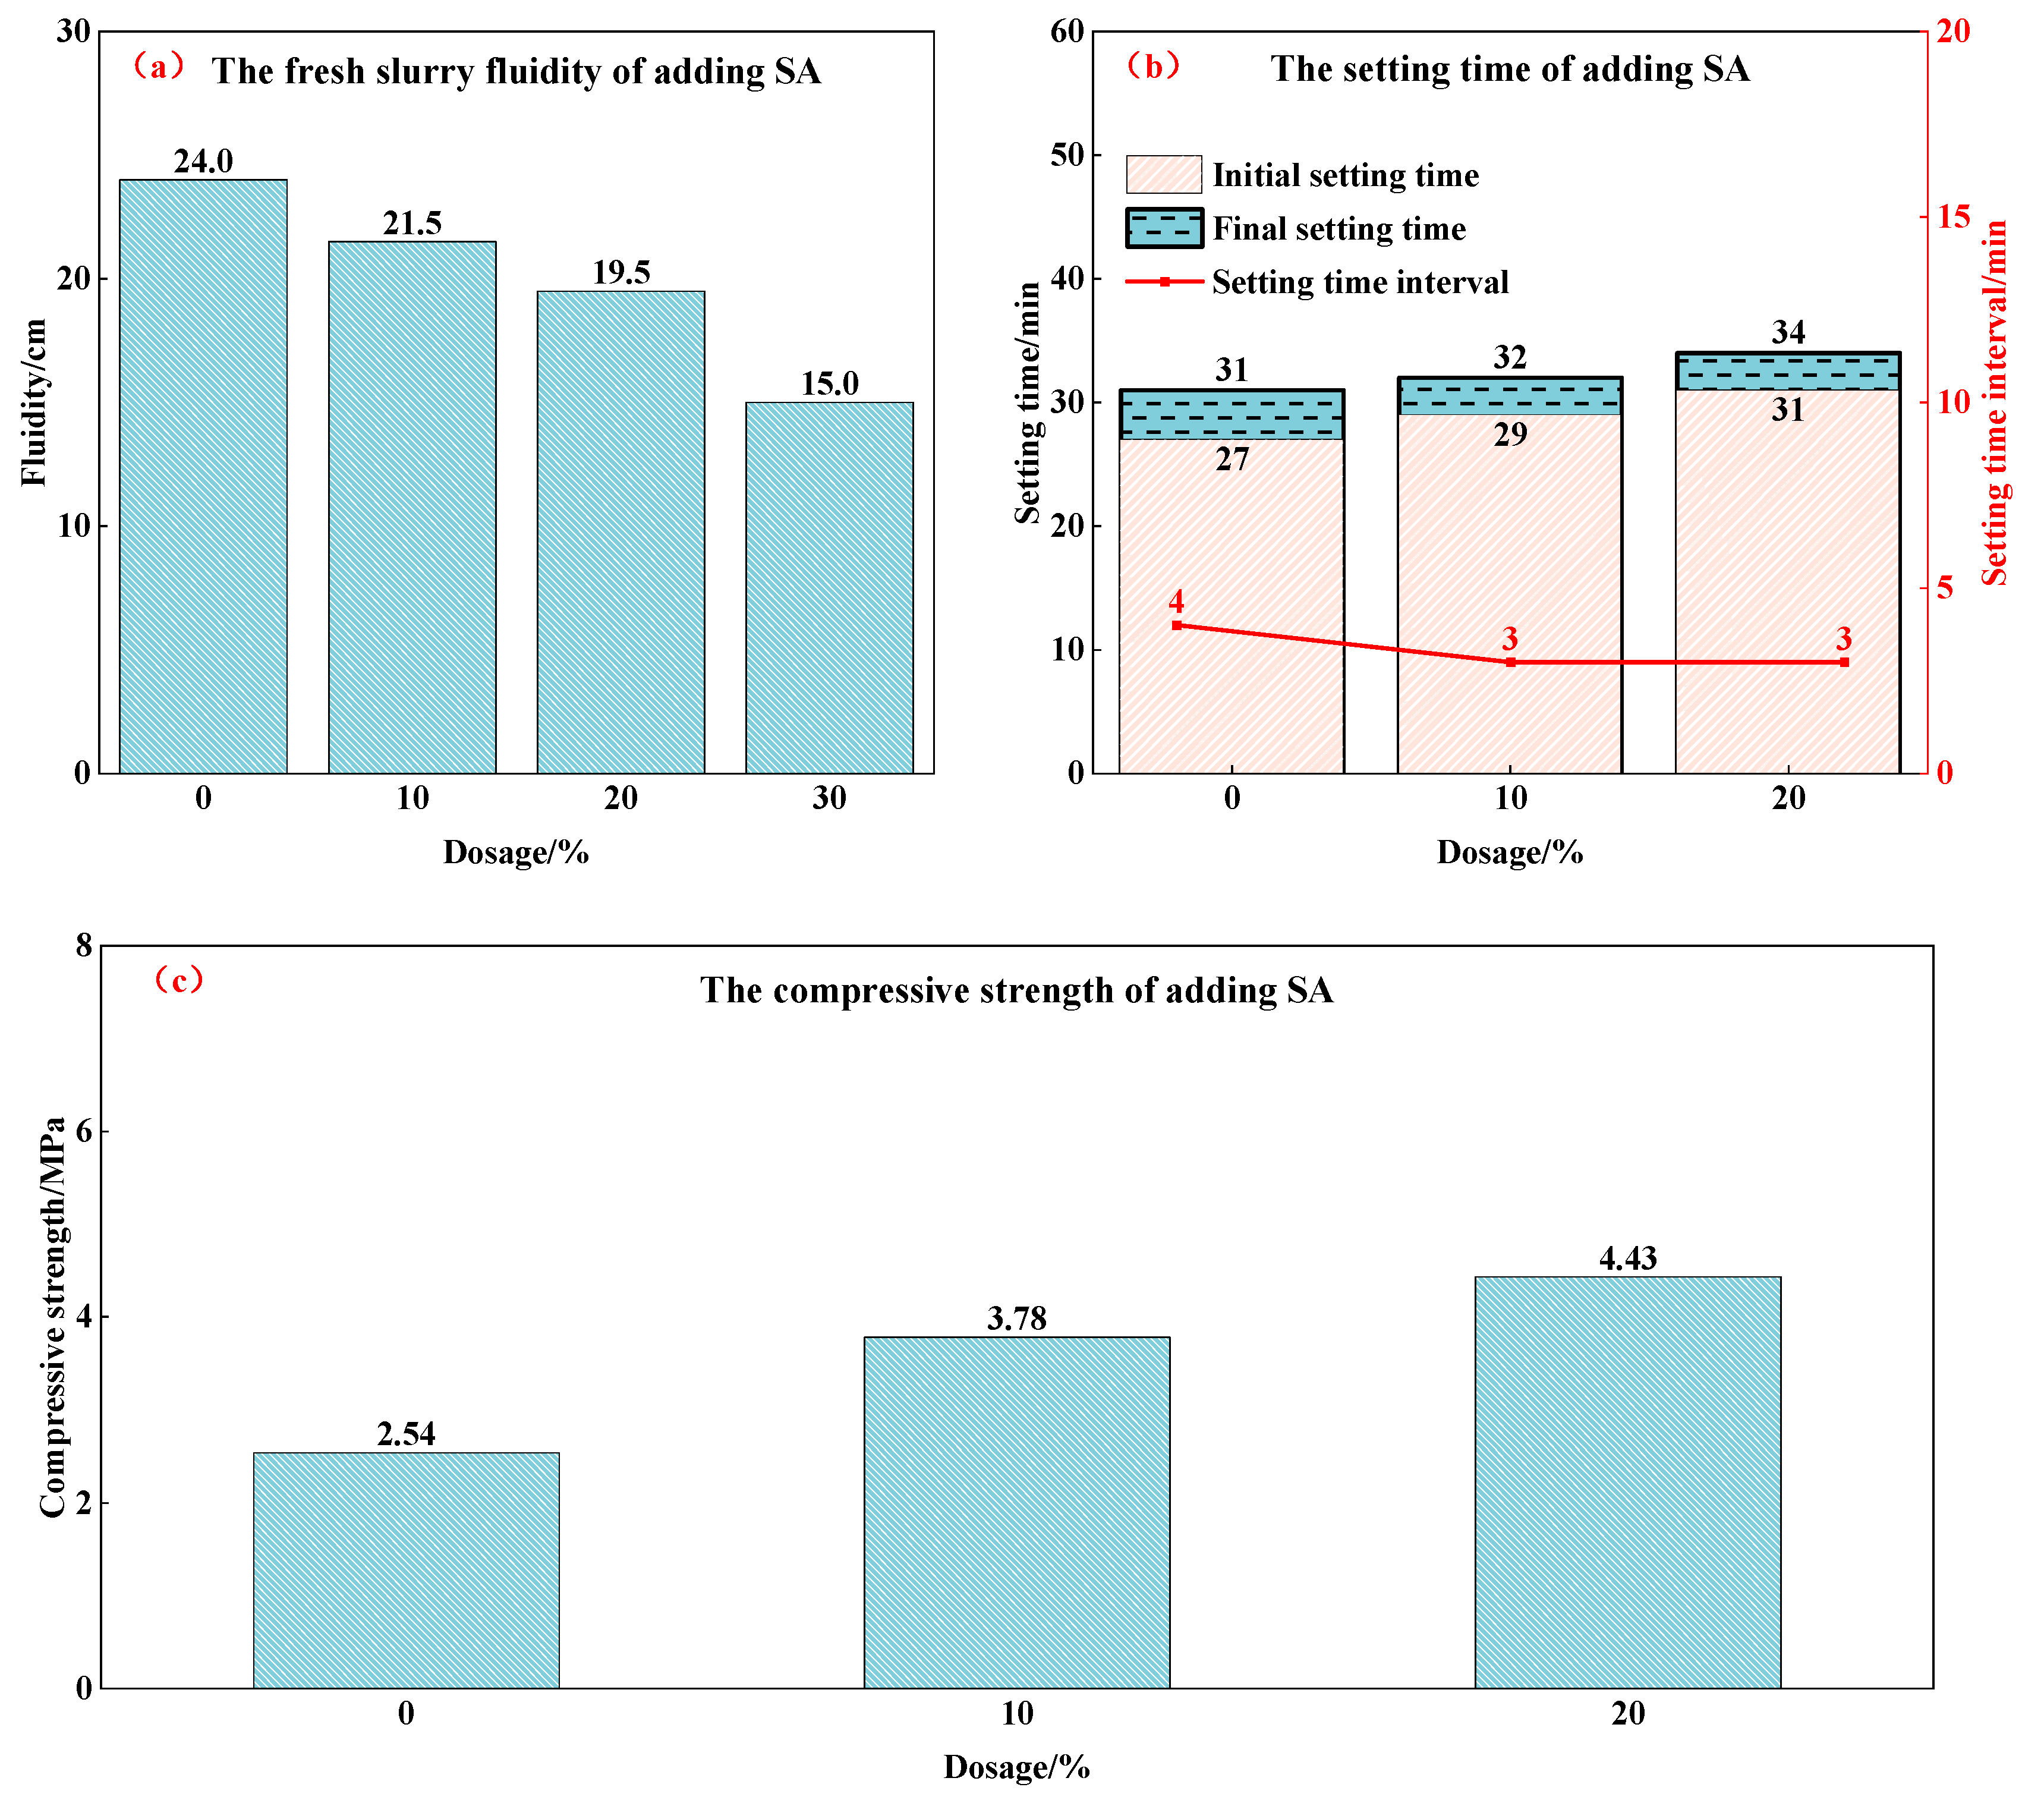
3.1.1. Effects of Structure Additives on Properties of PSPM

The impacts of SA on the initial slurry state, the liquid–solid transition stage, and the consolidated formation stage of the PSPM were analyzed. Fluidity is one of the key parameters of PSPM, and its diffusion diameter reflects the fresh slurry fluidity. The effect of SA on the fluidity of the PSPM is presented in Figure 2a, where it was found that the slurry fluidity is 24 cm without adding SA. Upon introducing SA at dosages of 10%, 20%, and 30% into the system, a decrease in slurry fluidity was observed. Notably, when the addition of SA reached 30%, the slurry fluidity dropped below 17 cm, failing to satisfy the required construction specifications. Therefore, to ensure compliance with construction standards, it was advisable to limit the incorporation of SA to be controlled within 20%.
As shown in Figure 2b, the incorporation of SA has no effect on the setting time of PSPM during the phase transition process. When SA is added at quantities of 10% and 20%, the initial and final setting time interval of PSPM remains within 15 min. Therefore, it could be concluded that SA does not interfere with the liquid–solid transition process of PSPM.
The influence of SA on the compressive strength of the consolidated body was analyzed. As shown in Figure 2c, the addition of SA can significantly improve the compressive strength of the consolidated body. When the dosage of SA was 20%, the compressive strength could be increased to 4.43 MPa.
In conclusion, within the 0–20% range of SA incorporation, it exerted minimal influence on the fluidity and setting time of the slurry mixture, yet it significantly improved the compressive strength of the consolidated body.

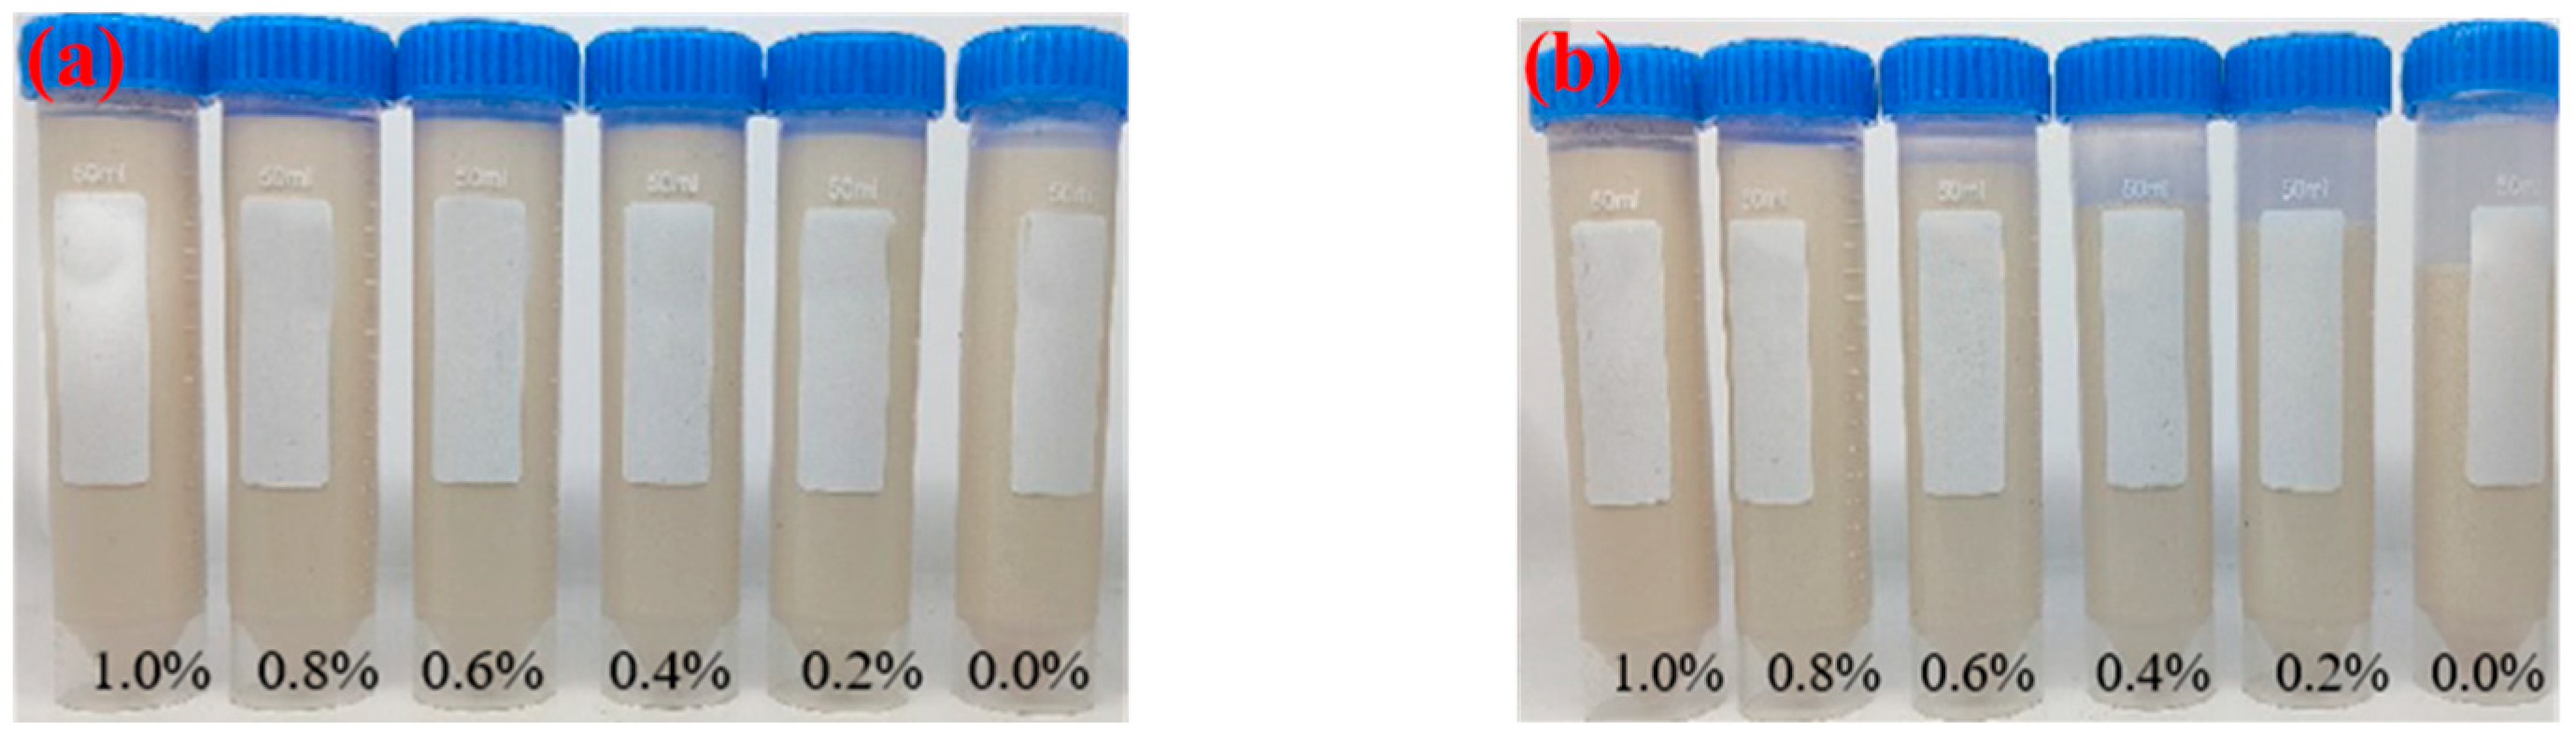
3.1.2. Effects of Flow Pattern Regulator on Properties of PSPM

The stability of the slurry test results of the PSPM is shown in Figure 3. Upon configuration, the constituents blend uniformly, rendering a consistent color throughout. After standing for 30 min, stratification occurred. Before the addition of 6301, the slurry was seriously stratified, and the supernatant volume accumulated 12 mL; therefore, the stability of the slurry was poor (Table 2). After the addition of 6301, the rate of layer separation diminished, and the supernatant liquid accumulation was reduced. When the dosage of 6301 was more than 0.6%, the supernatant volume was less than 1 mL.
Therefore, the addition of 6301 maintained the suspension stability of the slurry, ensuring the slurry neither settled nor precipitated during the pumping operation. Once the slurry reaches the crack channels, its thixotropic properties allow it to remain suspended in the crack space, thereby providing the necessary conditions for solidification and effectively sealing off the crack voids.
Figure 4a shows the effect of 6301 on the fluidity of fresh slurry. It demonstrates that the fluidity decreased progressively as the concentration of 6301 increased, signifying a gradual thickening of the slurry. When the concentration of 6301 was greater than 0.6%, the slurry fluidity fell below 17 cm, which failed to meet the stipulated construction requirements. Hence, the subsequent analyses focused solely on examining the influence of 6301 concentrations not exceeding 0.6% on the setting time and compressive strength of the PSPM.
As shown in Figure 4b, when the concentration of 6301 was maintained within the range of 0–0.6%, it exerted a negligible influence on the initial and final setting time of the slurry. The initial setting time remained consistently stable at 30–33 min, whereas the final setting time was steady at 33–34 min, and the setting interval time was consistently less than 15 min, which indicated that the incorporation of 6301 did not affect the liquid-to-solid transformation process of PSPM. Subsequently, when the PSPM formed the consolidated body, the compressive strength was tested. The experimental results are shown in Figure 4c. The compressive strength of the consolidated body ranged from 4.43 MPa to 4.82 MPa, indicating that after adding the 6301, the consolidated body retained an appreciable level of compressive resistance.
In conclusion, the addition of 0.6% of 6301 was found to maintain the stability of the slurry without significantly affecting the slurry fluidity or the initial and final setting times. Furthermore, it had a negligible influence on the compressive strength of the resulting consolidated body, leaving other properties of the PSPM essentially unaltered.

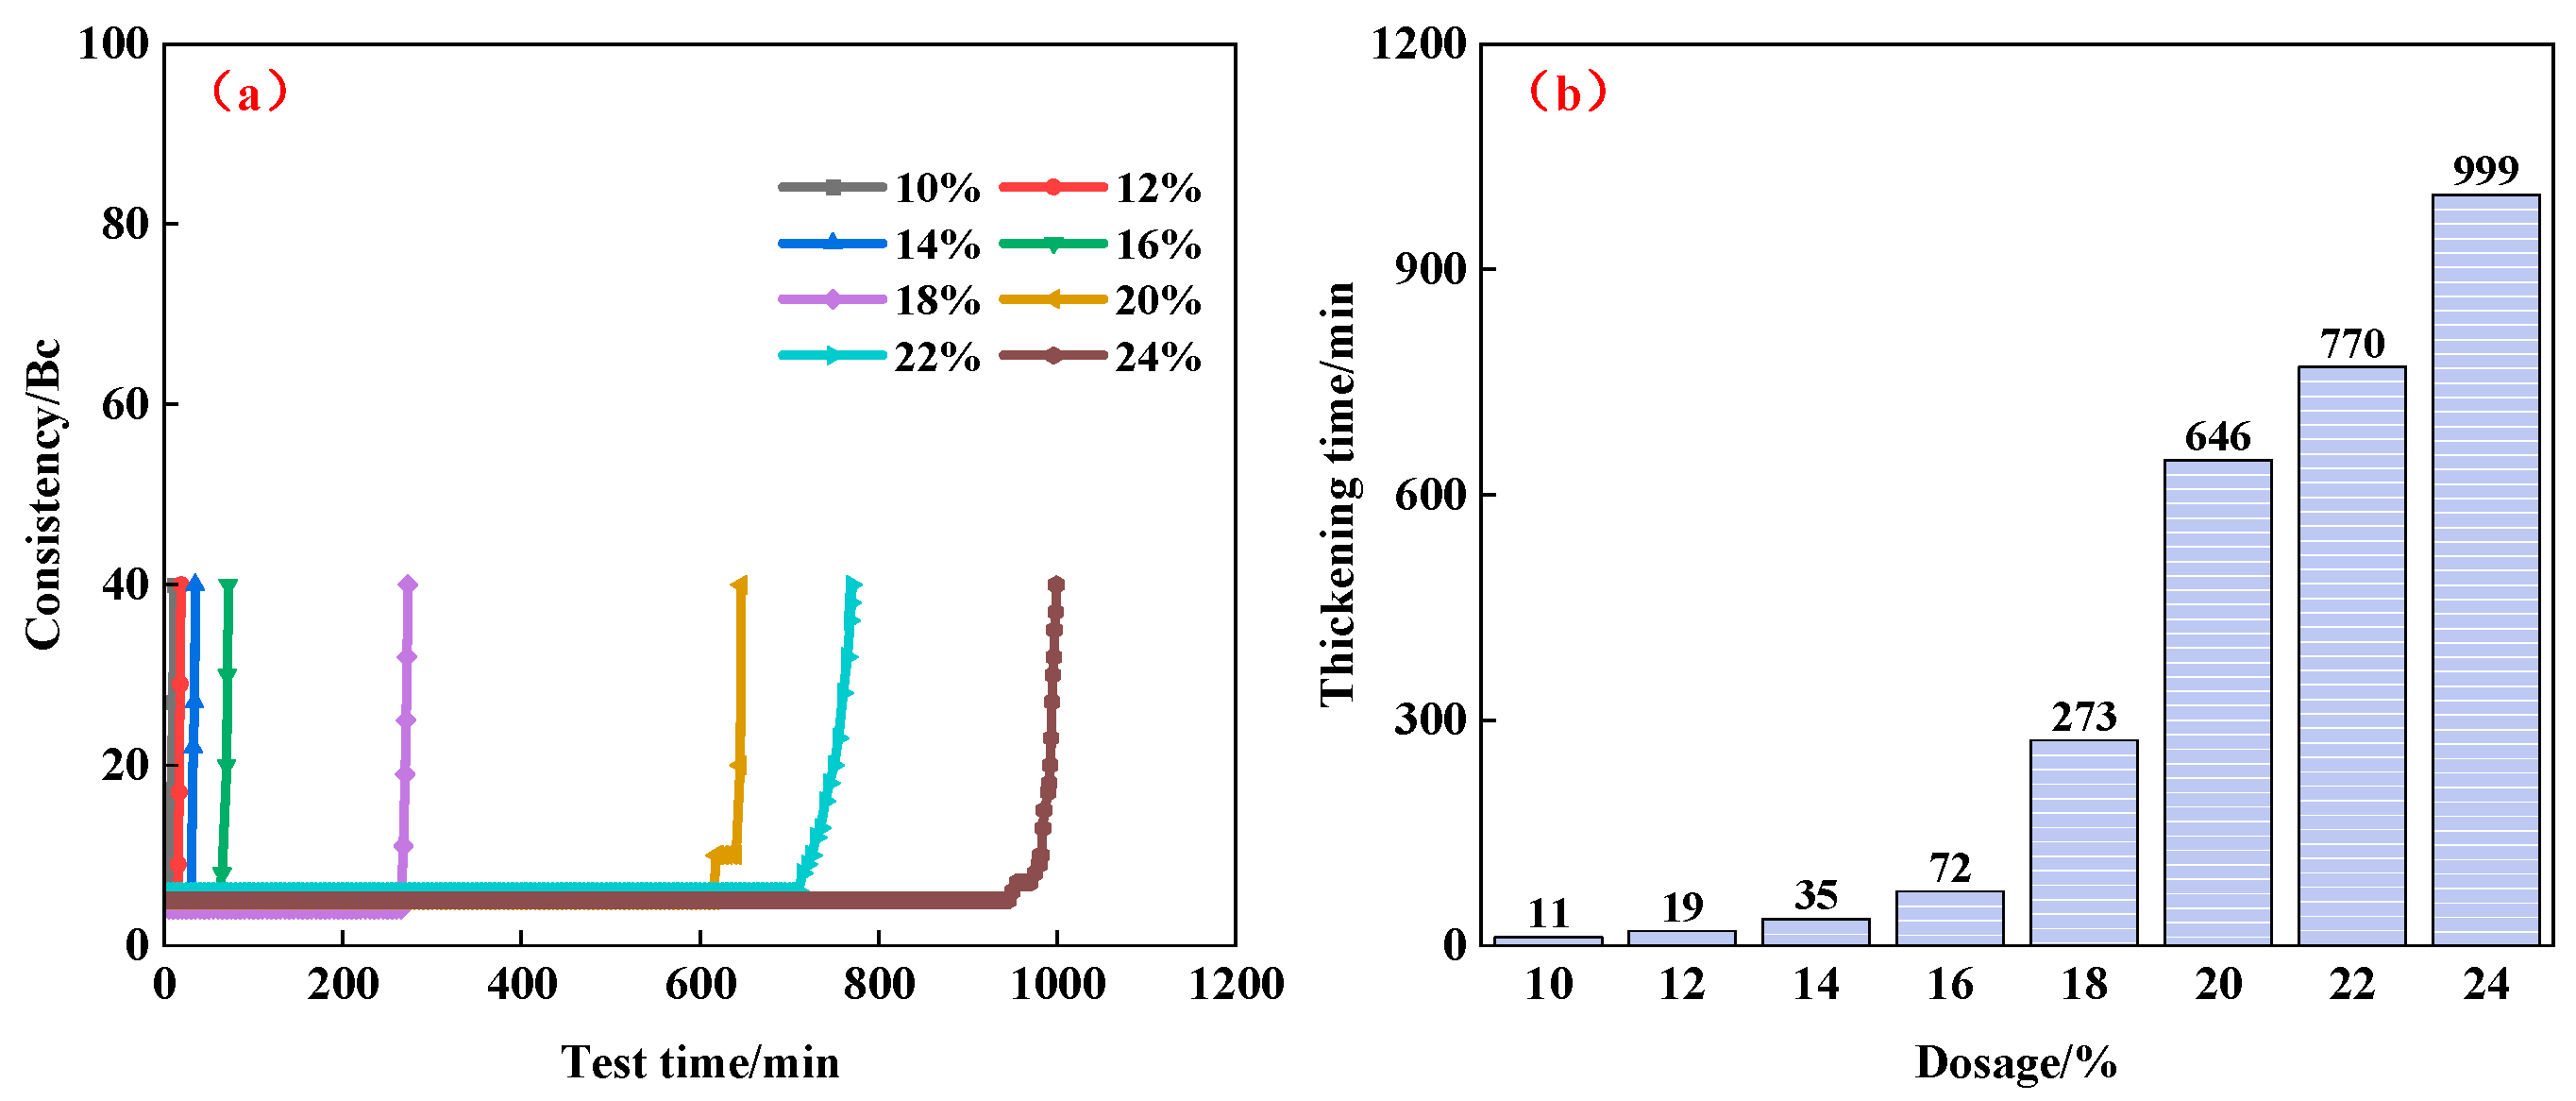
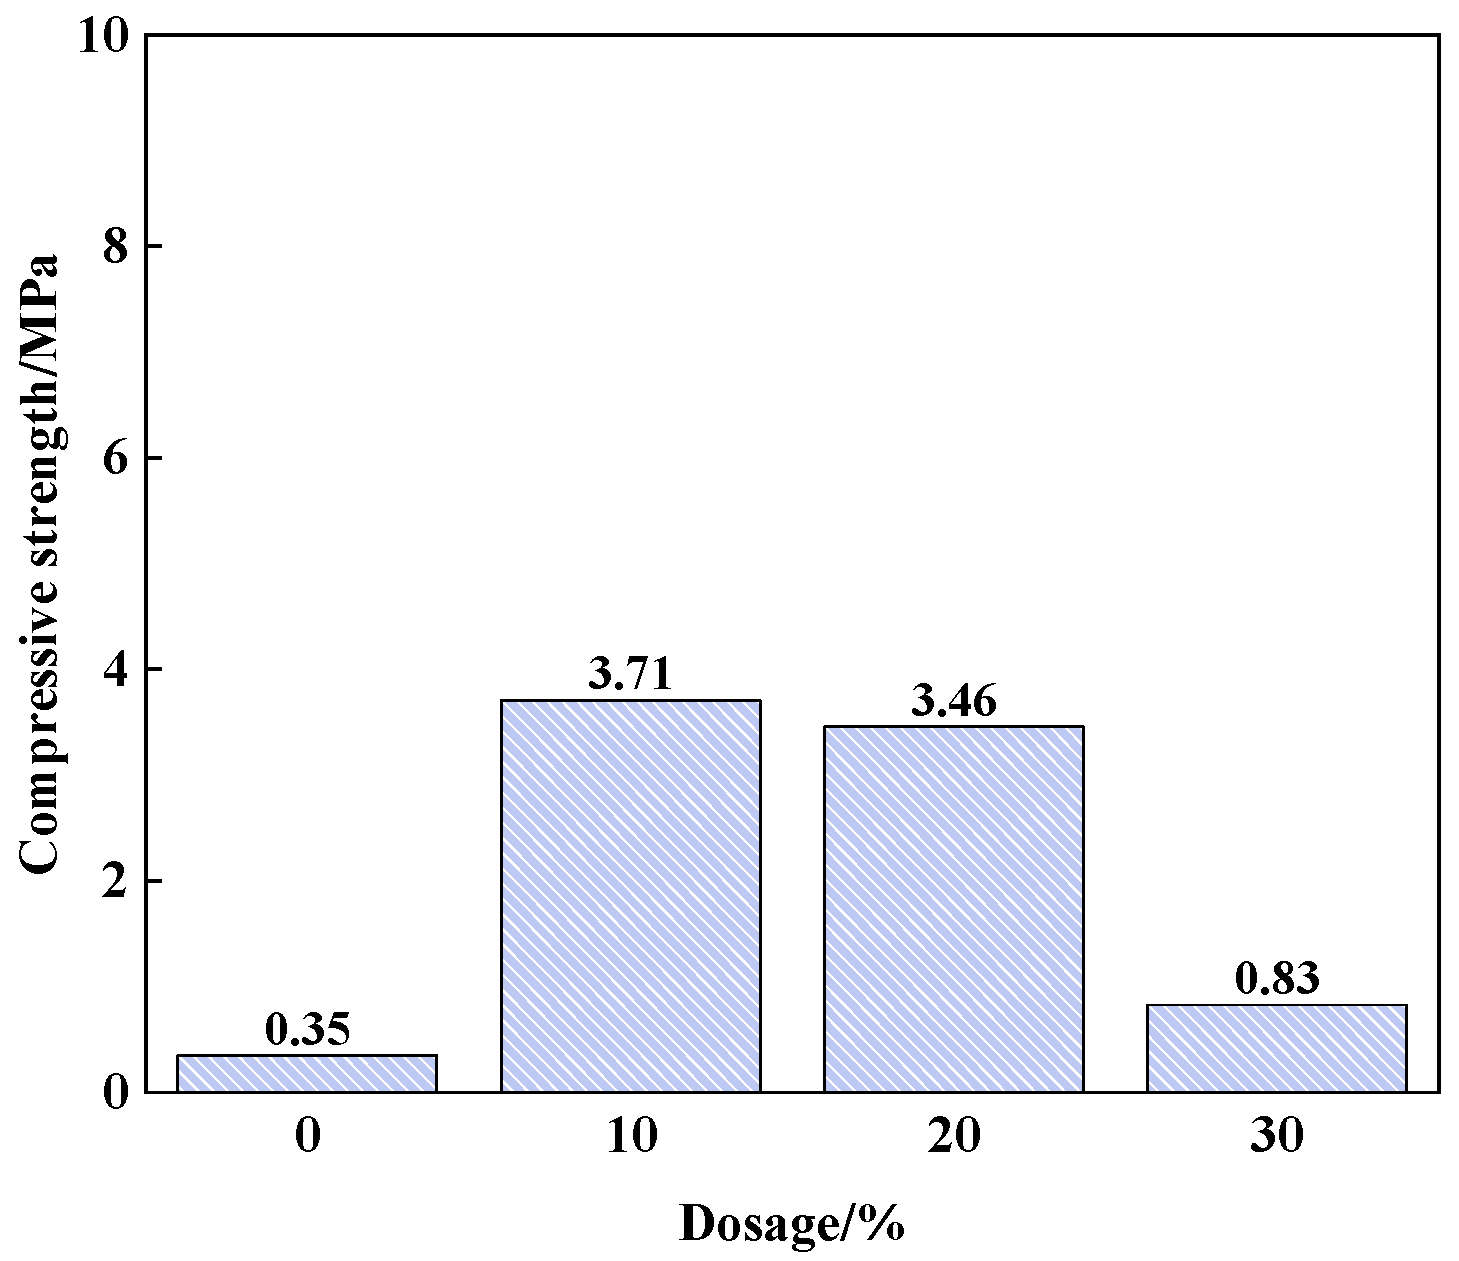
3.1.3. Effects of Phase Regulator on Properties of PSPM

Figure 5 shows the test results of the setting time and interval of the PSPM with varying concentrations of BA. Adding BA was found to significantly prolong the initial setting time of the slurry, with the retardation function becoming increasingly pronounced as the addition of BA was augmented. Specifically, when the addition of BA reached 6%, the initial setting time of the slurry was successfully extended from 38 min to a prolonged duration of 98 min. Moreover, the addition of BA was also observed to appreciably abbreviate the initial and final setting intervals of the slurry. When the BA content was 6%, the strength development of the slurry accelerated dramatically, enabling the formation of a structurally consolidated body within an astonishingly brief span of just 5 min.
Figure 6a describes the normal pressure thickening curve of the slurry following the addition of BA. After the BA was added in different dosages, the initial consistency of the slurry ranged from 4 Bc to 6 Bc, all of which were lower than the initial consistency values prior to the addition, indicating that the slurry became thinner after the BA was added, and the normal pressure thickening curve of the slurry after the BA was added exhibited obvious “right-angle” thickening characteristics. The consistency value of the slurry remained stable at a low level, at which point the slurry remained in a liquid state. Subsequently, after the failure of the retarding effect, the slurry escalated rapidly to 40 Bc within a few minutes, transitioning the slurry into a thickened state.
Figure 6b elucidates the relationship between BA content and the slurry normal pressure thickening time. With an increase in the BA content, the slurry atmospheric pressure thickening time was observed to be longer, indicating that the addition of BA can significantly delay the slurry thickening rate. For instance, when the BA content increased from 16% to 18%, the slurry thickening time was prolonged from 72 min to 273 min. Furthermore, when the BA content reached 24%, the slurry thickening time could be extended to 999 min. It follows that if the BA dosage were to be further increased, the retarding effect on the slurry would be more significant.
In summary, the addition of BA had a weak effect on the fluidity of the fresh slurry, but it significantly influenced the phase transition and hardening stages of PSPM, that was, the addition of BA led to a delayed setting time and thickening time for the PSPM and it also improved the compressive strength of the consolidated body (Figure 7).

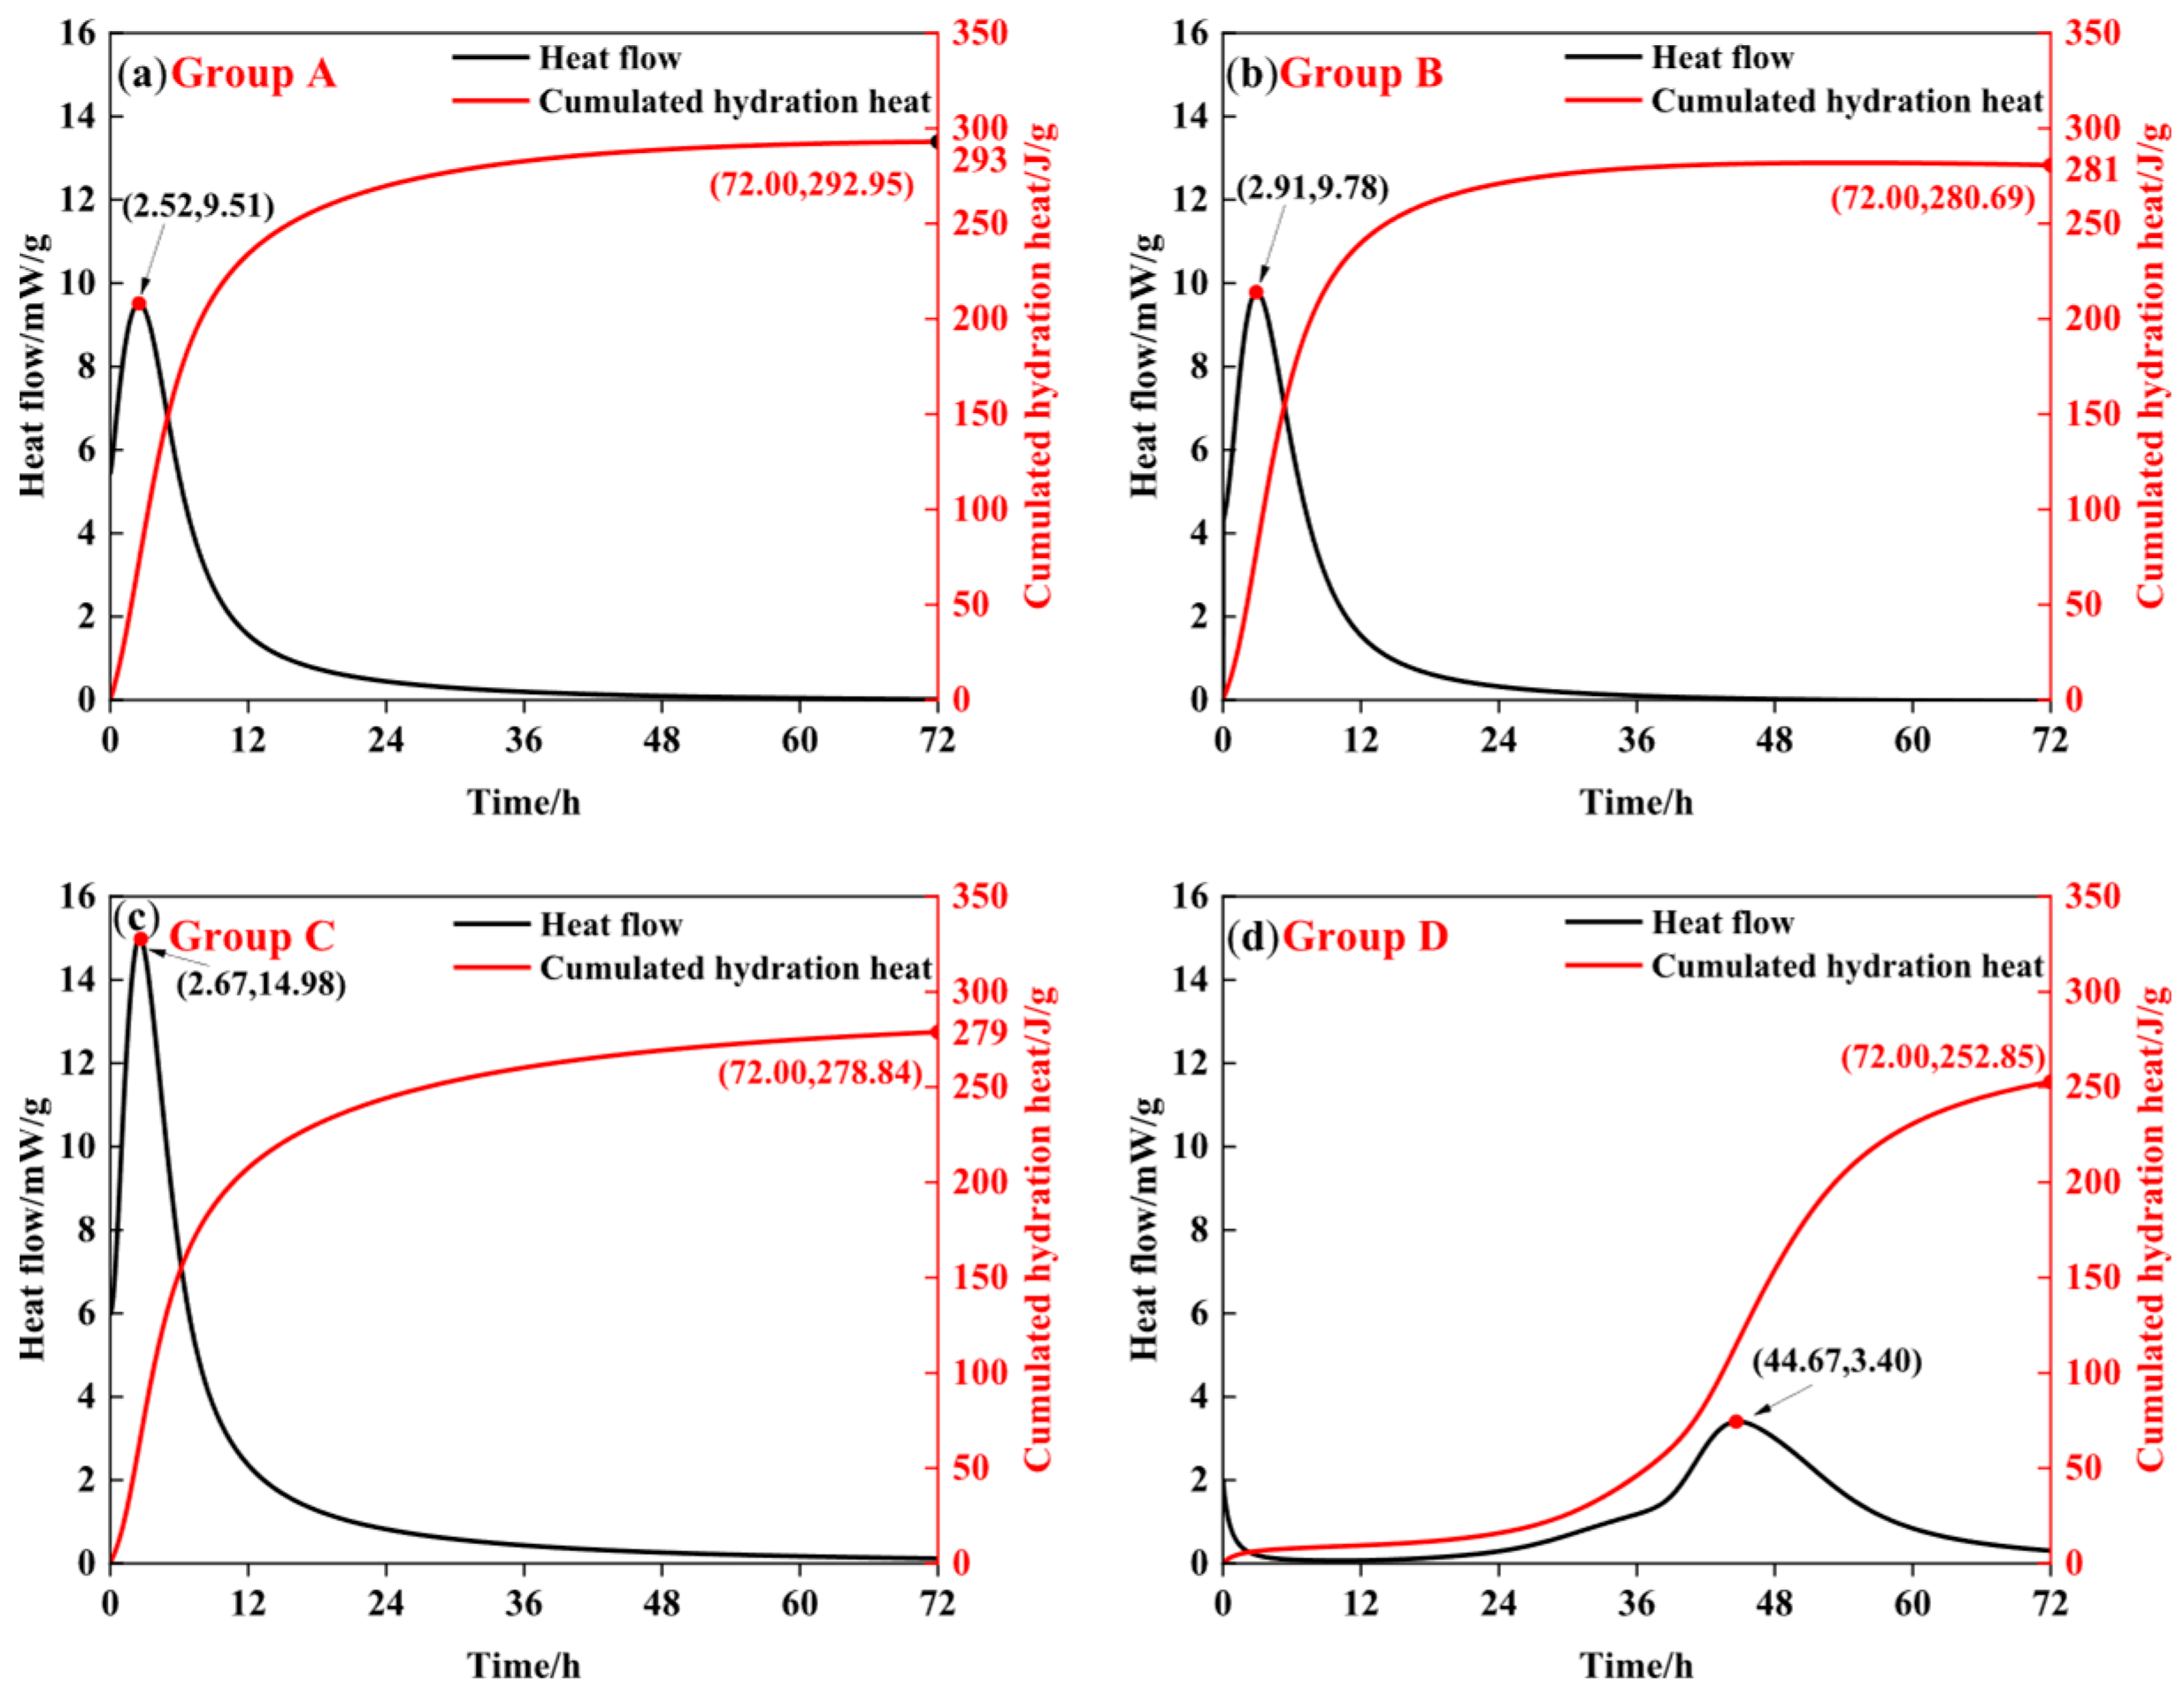
3.2. Effects of Additives on the Hydration Reaction Process of PSPM

Figure 8 documents the thermal release dynamics during the hydration process of PSPM, contrasting samples both with and without additives. When the hydration reaction continued for 72 h, the cumulated hydration heat was quantitatively assessed as follows: Group A, acting as the baseline control, yielded the utmost cumulated hydration heat at 292.95 J/g. Group B discharged 280.69 J/g, Group C emitted 278.84 J/g, and Group D, which incorporated BA, recorded the least heat output at 252.85 J/g. Knudsen’s extrapolation equation was used to calculate the total heat release of different groups of hydration reactions. It showed the same trend, that is, the final heat release of Group A was the largest and Group D was the smallest (Table 3). That finding underscores that the integration of a phase change modifier considerably attenuated the vigor of the hydration reaction in the solidified plug matrix.
In terms of peak heat flow, Group A attained its pinnacle at 9.21 mW/g, succeeded by Group B peaking at 9.79 mW/g, and Group C, notably, surged to 15.12 mW/g. Conversely, Group D registered the nadir at 3.72 mW/g. Strikingly, Group C, devoid of the SA, manifested a substantial escalation in the pace of heat flow during hydration. This accentuated that the introduction of the SA drastically mitigated the thermal evolution intensity of the PSPM hydration process without deferring the hydration reaction’s onset. Conversely, the discernible diminution in hydration reaction vigor upon the advent of the BA not only curtailed the terminal heat discharge but also protracted the hydration commencement timeframe from 2.5 h to an extended 44.8 h. This attested to the proficiency of BA in tempering the hydration reaction’s intensity, consequently yielding a net reduction in overall heat discharge.
The calculated results with the kinetic parameters of the hydration reaction in different groups are depicted in Table 4, unveiling a narrow disparity in the hydration reaction order, denoted by n, which ranged from 1.3688 to 1.4516 across different material ratios. Groups A, B, and C, representing formulations devoid of the BA, exhibited comparable reaction rate constants throughout successive stages, measuring approximately 0.035, 0.006, and 0.0020, respectively. Upon the introduction of the BA, a modification in the rate constant trend was observed. Specifically, during the crystallization, nucleation and crystal growth (NG) and transition to phase boundary reaction (I) stages, the rate constants K1′ and K2′ were reduced, whereas in the final diffusion (D), K3′ witnessed an increment. This alteration signified that the BA exerted an inhibitory effect on crystal nucleation, crystal growth, and the transition to phase boundary reactions within the PSPM, concurrently facilitating the final diffusion stage. Consequently, the progression of the hydration process and the pattern of heat release were influenced, thereby testifying to the modulatory role of the BA on the thermodynamics of the hydration reaction.
Figure 9 illustrates the hydration rate curves for various groups. For Groups A, B, and C, which lacked the BA, their hydration kinetics followed a progression from the crystallization nucleation and crystal growth (NG) to transition to phase boundary reaction (I), culminating in the final diffusion stage (D), conforming to a classical NG-I-D hydration model. Conversely, upon the introduction of the BA, the hydration kinetics model of the PSPM was simplified to NG-D. This simplification was largely attributed to the fact that, in the early stages of the reaction, the unmodified recipes displayed NG and I stage hydration rate constants 1.7 to 1.8 times and 3.0 to 3.1 times higher, respectively, compared to their modified counterparts. Notably, during the diffusion stage (D), the hydration rate constants for the modified formulations were found to be 4.9 to 5.0 times higher than those without the modifier, highlighting a substantial acceleration of the hydration reaction in this phase. This is evidence that the inclusion of the BA transformed the hydration kinetics of PSPM into a dual-stage dominated process, where the NG stage transitioned directly to the D stage, establishing a unique NG-D kinetic model. This transformation underscored the pivotal role of BA in orchestrating the hydration progression of PSPM.
As illustrated in Figure 9d, the addition of BA significantly impacts the reaction kinetics. Specifically, during the phase boundary reaction stage, the reaction rate was notably increased. Conversely, the nucleation stage experienced a decrease in reaction rate. Alternatively, throughout the entire hydration process, the nucleation rate remained relatively constant (with a slight initial increase), suggesting that the formation of magnesium oxide crystal nuclei was highly challenging during hydration.
Furthermore, in prior research [36], XPS was employed to analyze both the curing agent and the agent post-borate treatment. The analysis revealed that the adsorption thickness of borate on the curing agent’s surface measures 2.66 nm. It can be inferred that BA formed a complex with magnesium, which restricted the release of MgO into the solution. Consequently, only a minimal amount of MgO was available to form Mg(OH)2 during the NG stage. The exceedingly low concentration of magnesium ions inhibited the formation of a substantial number of crystals, preventing magnesium hydroxide crystals from reacting en masse (I stage). As the reaction progresses, the concentration of magnesium ions in the system further diminishes. At this point, crystal clusters begin to interact more with each other, effectively replacing the outward diffusion of individual clusters (D stage).
In conclusion, adding 6301 did not change the heat flow, cumulative hydration heat, or the hydration rate of the PSPM, showing that using water or 6301 glue solution as the base liquid did not affect the hydration reaction process of the PSPM. The addition of SA led to a reduction in the heat flow of PSPM without delaying the onset of the hydration reaction or modifying the hydration kinetic model of PSPM, proving that SA did not impact PSPM hydration. Conversely, the introduction of BA notably reduced the heat flow, and cumulative hydration heat, and markedly postponed the initiation of the acceleration period, shifting PSPM’s model from NG-I-D to NG-D, illustrating a pronounced retarding effect of BA on the hydration reaction of PSPM. This conclusion elucidated the mechanism behind BA’s ability to prolong both the setting and thickening times of PSPM.

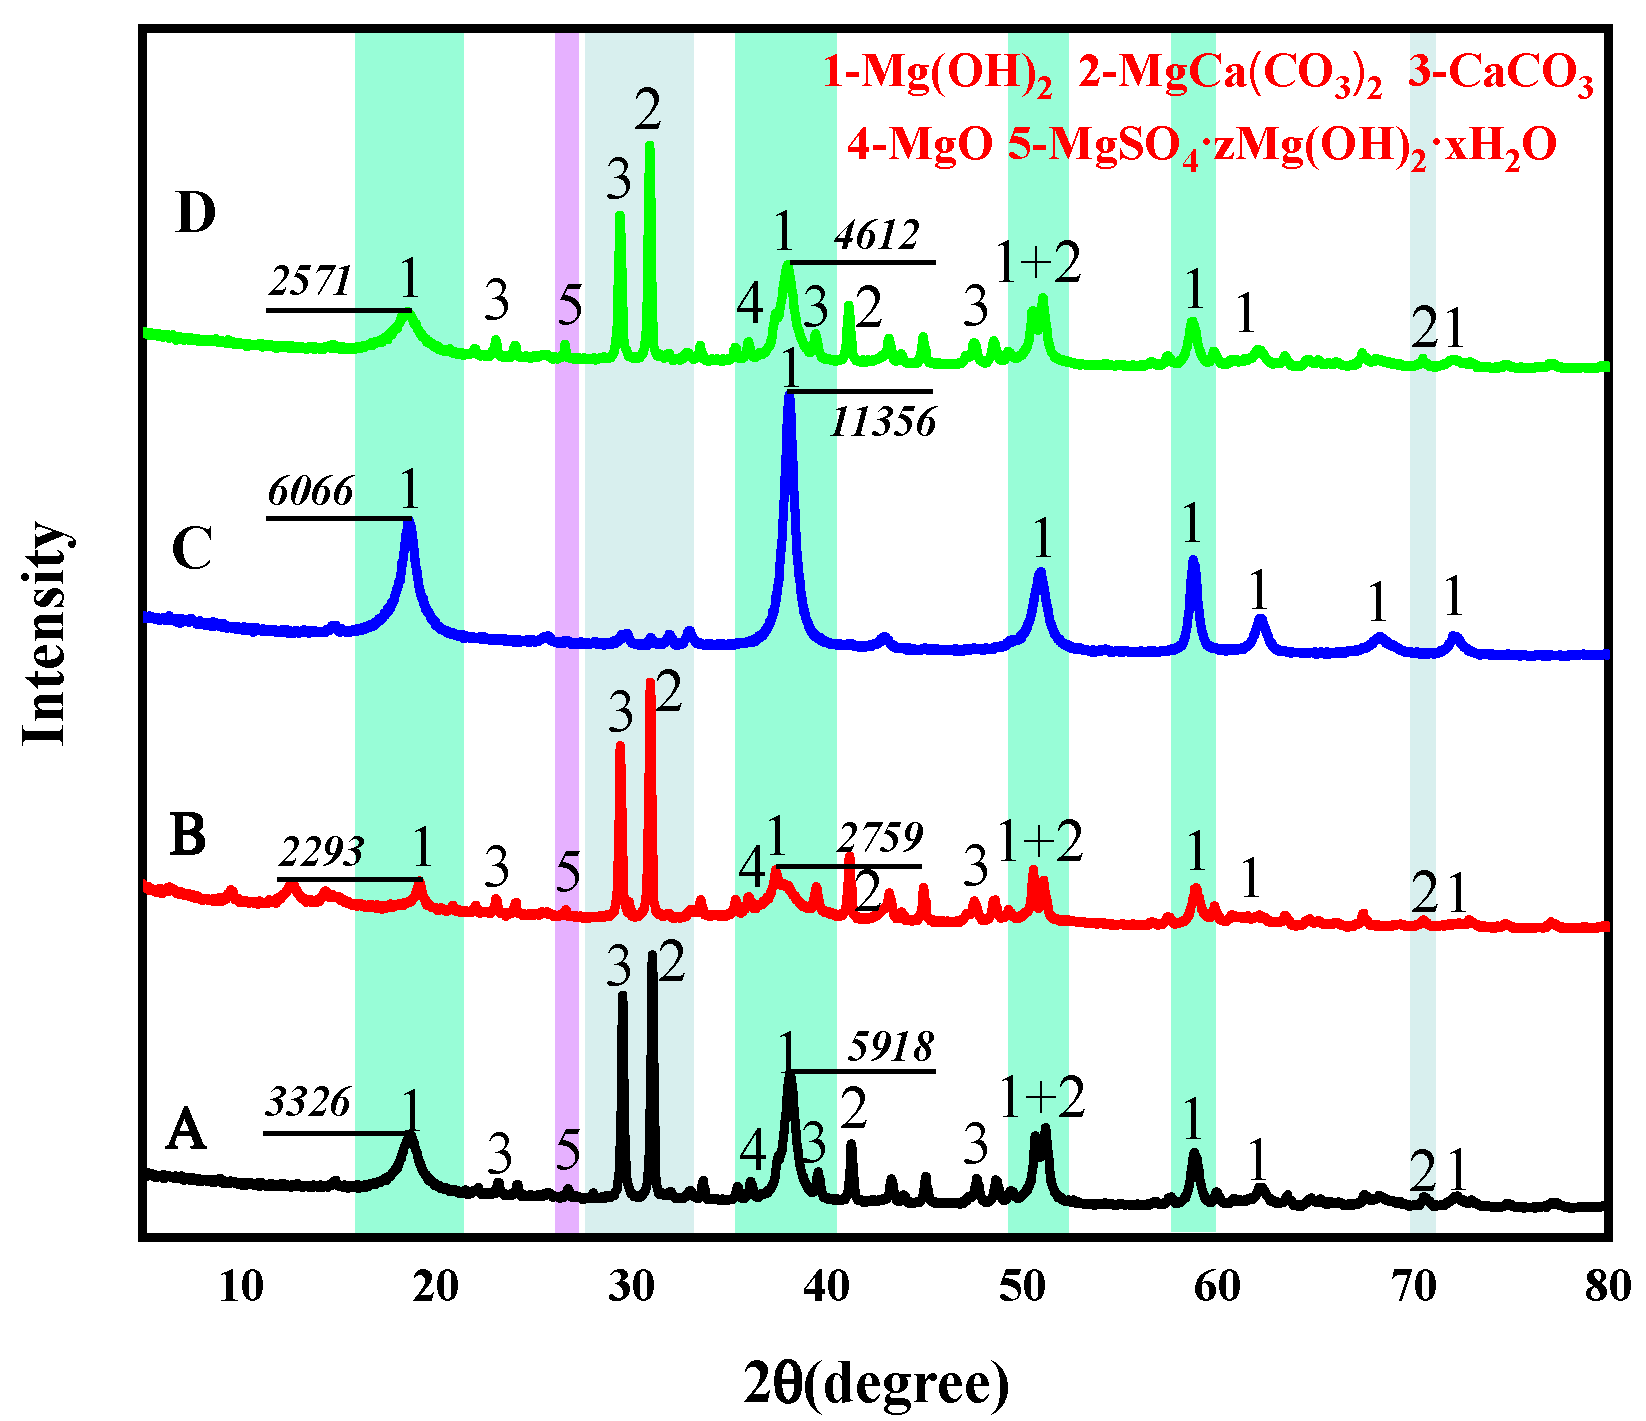
3.3. Effects of Additives on Hydration Products of PSPM

Figure 10 illustrates the microstructures of PSPM hydration products, comparing scenarios with and without different additives. Group A used 6301 glue solution as its base, whereas Group B used water. Despite this variance, after a 24 h incubation period at 85 °C, the microstructures of the hydration products resembled one another, both presenting as “honeycomb” structures composed of stacked lamellar crystals (Figure 10a,c). The sponge-like masses in Figure 10b result from 6301 glue aggregations. Comparing Group A to Group C, the key difference was the presence or absence of SA. A comparative analysis between Figure 10a,c revealed that in both cases, the lamellar crystals were observed to interweave and grow. However, the structure of the hydration products sans SA addition appeared more porous and loosely packed (Figure 10c). Conversely, in the consolidated mass with 20% SA, the lamellar crystals formed a “honeycomb” structure, intertwining and filling gaps to a greater extent, thereby reducing porosity (Figure 10c). Group D differed from Group A due to the BA addition. Post BA addition, while crystals remained lamellar post-BA, their growth shifted from flat stacking to radial compression (Figure 10d). Overall, the morphological impact of BA on the hydration products was minimal.
The impact of additives on the phase composition of hydration products was analyzed through XRD experiments, as depicted in Figure 11. A comparison of Group A and Group B illustrated that the base liquid, whether water or 6301 glue solution, did not exert an influence on the phase composition of the hydration products. Group A versus Group D proved that BA had no impact either. However, contrasting Group A to Group C revealed a distinctive finding: without SA, the hydration products comprised solely flaky Mg(OH)2 crystals with narrower, sharper peaks, hinting at increased purity and crystallinity. Adding 20% SA led to flake crystals Mg(OH)2, acicular crystals MgSO4·zMg(OH)2·xH2O, reaction residuals (S1), unreacted materials MgCa(CO3)2 and CaCO3, confirming these latter two came from SA. The quantitative analysis of XRD data reveals that the full width at half maximum of the peaks for the four groups of Mg(OH)2 were 0.410~0.752, 0.419~0.737, 0.421~0.682, and 0.366~0.852, respectively. These results indicated that the incorporation of each component enhanced the crystallization of magnesium hydroxide, with BA exhibiting the most pronounced promotional effect.
Consequently, it was deduced that SA, due to its inert nature, neither participated in the hydration reactions nor chemically reacted with other PSPM components. Instead, it functioned merely as a physical filler, thereby reinforcing the structural strength of the consolidated mass. This conclusion elucidated the mechanism behind SA’s role in enhancing the compressive strength of PSPM.

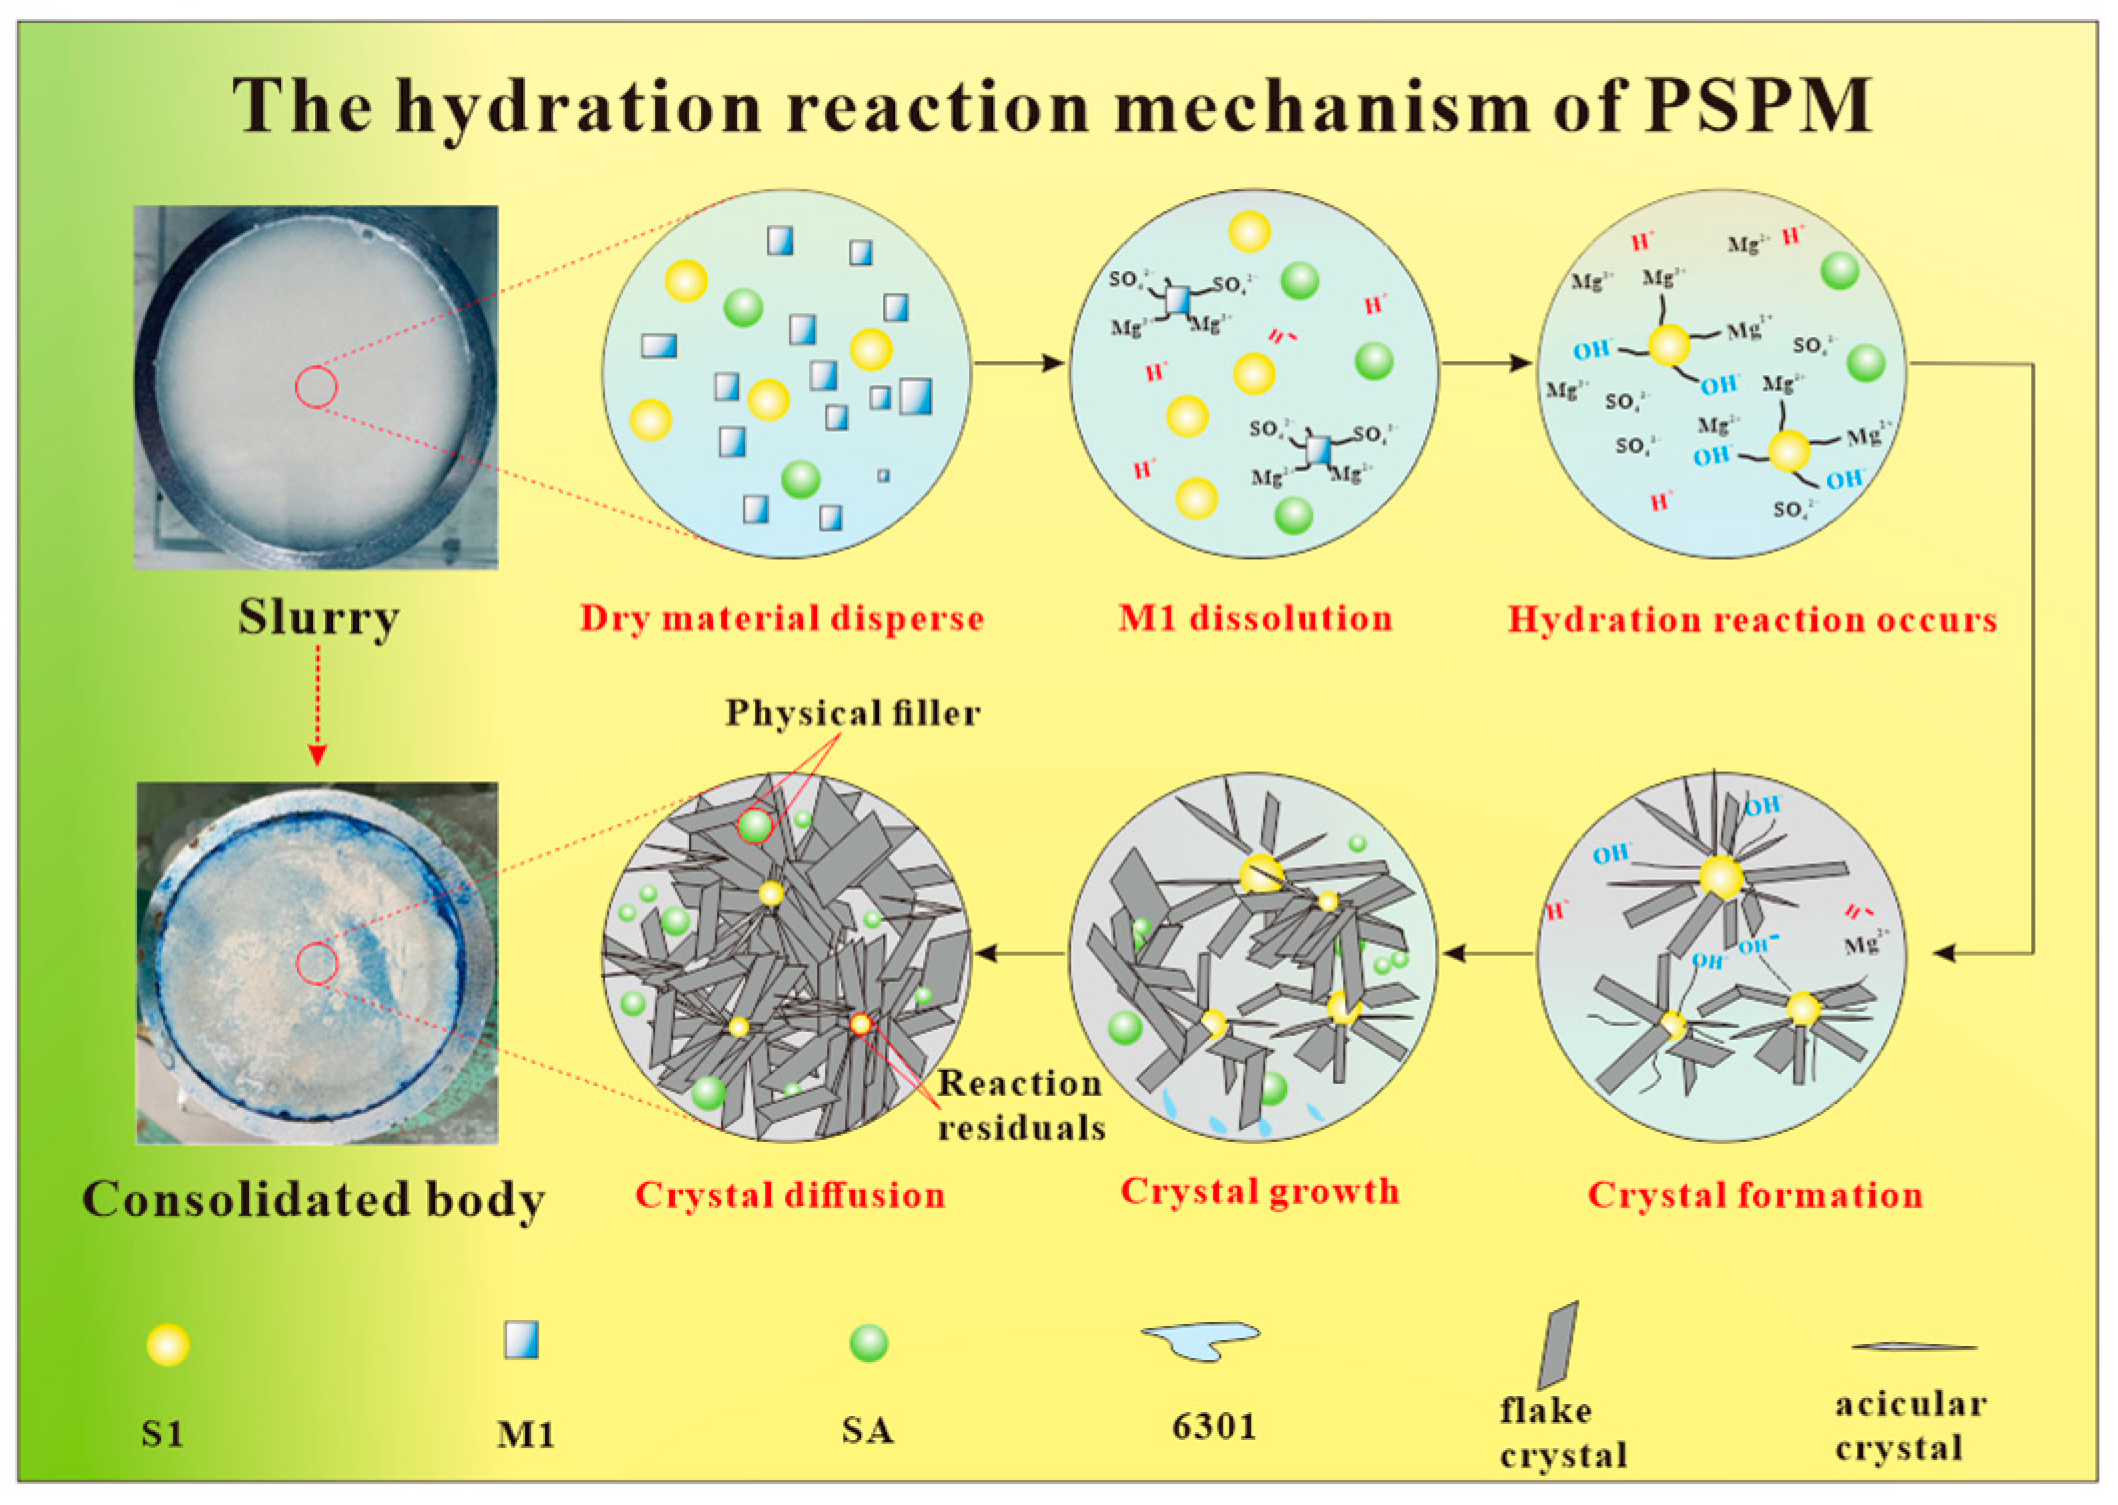
3.4. The Hydration Reaction Mechanism of PSPM

Based on the aforementioned analysis of how various admixtures affected the properties, hydration process, and hydration products of PSPM, it can deduce the hydration reaction mechanism of PSPM, illustrated in Figure 12. Initially, upon the introduction of dry ingredients into the 6301 solutions, M1 dissolved, releasing Mg2+, SO42−, and H+, reducing the pH of the system. Subsequently, S1 dissolved under the H+ influence, releasing Mg2+ and OH, elevating the pH. As the concentrations of Mg2+ and OH in the solution reach supersaturation levels, Mg(OH)2 precipitates grow in situ, enveloping and coating the surface of S1 particles, thereby hindering further contact between the S1 and the water. Concurrently, the Mg2+ and OH encounter SO42− within the system, MgSO4·zMg(OH)2·xH2O acicular crystals formed. A competitive reaction ensued between these two crystal types, vying for Mg2+ available at the surface of S1. As hydration progressed, diminishing free water within the system diminished, transforming PSPM from a slurry into a consolidated body. The growth of Mg(OH)2 flake crystals and MgSO4·zMg(OH)2·xH2O acicular crystals, combined with the physical filling effect of SA, resulted in the formation of a solidified plugging material endowed with a certain degree of structural strength.

4. Conclusions

In this paper, PSPM was the subject of investigation, with an emphasis on the effects of three additives on the system characteristics, the hydration process, and the hydration products. The key observations include: (1) Neither the SA nor the 6301 took part in the hydration reaction of PSPM, nor did they influence the hydration product constitutions. Rather, SA fulfilled the role of physically filling spaces, enhancing the structure of the consolidated body, whereas 6301 ensured the stability of the slurry. (2) The BA resulted in the postponement of PSPM’s setting time and thickening time, instigating an abrupt thickening behavior within the slurry, thereby enhancing its thixotropic qualities. (3) The hydration sequence of PSPM was delineated as encompassing three phases: the NG-I-D stage. The integration of BA was shown to modify the kinetics of the hydration reaction, shifting the model from NG-I-D to KG-D, thereby decelerating the hydration progression. (4) The hydration products of PSPM were constituted by flake crystals Mg(OH)2, acicular crystals MgSO4·zMg(OH)2·xH2O, reaction residuals S1, unreacted materials SA, entwining to create a three-dimensional lattice framework. Formation of these crystals occurred via the hydration reactions involving S1 and M1. By studying the role of each component of the plugging solidified material in the hydration process, we have significantly contributed to enhancing the efficacy of the PSPM, promising broader utility in lost circulation control.

Author Contributions

Conceptualization, H.Z.; validation, Y.F. and G.T.; investigation, J.N.; writing—original draft preparation, H.Z.; writing—review and editing, J.S. All authors have read and agreed to the published version of the manuscript.

Funding

This research was funded by the National Natural Science Foundation of China, grant number: 51704043; the Science and Technology Planning Project of Sichuan Province, grant number: 2021YJ0359; and the National Natural Science Youth Foundation of China, grant number: 52104003.

Data Availability Statement

The original contributions presented in this study are included in the article. Further inquiries can be directed to the corresponding author.

Conflicts of Interest

Authors Hui Zhang and Yongchao Feng were employed by the company SINOPEC. The remaining authors declare that the research was conducted in the absence of any commercial or financial relationships that could be construed as a potential conflict of interest.

References

  1. Pu, L.; Xu, P.; Xu, M.B.; Song, J.J.; He, M. Lost circulation materials for deep and ultra-deep wells: A review. J. Pet. Sci. Eng. 2022, 214, 110404. [Google Scholar] [CrossRef]
  2. Yang, J.B.; Sun, J.S.; Bai, Y.R.; Lv, K.H.; Zhang, G.D.; Li, Y.H. Status and prospect of drilling fluid loss and lost circulation control technology in fractured formation. Gels 2022, 8, 260. [Google Scholar] [CrossRef] [PubMed]
  3. Sun, J.S.; Bai, Y.R.; Cheng, R.C.; Lv, K.H.; Liu, F.; Feng, J.; Lei, S.F.; Zhang, J.; Hao, H.J. Research progress and prospect of plugging technologies for fractured formation with severe lost circulation. Pet. Explor. Dev. 2021, 48, 732–743. [Google Scholar] [CrossRef]
  4. Zhu, Q.; Wang, Y.; Zhang, Y.Q.; Wang, Z.F.; Wang, Z.H.; Liu, C. Successful Applications of a Novel Compound Lost Circulation Additive with Variable Structure. In Proceedings of the SPE Kingdom of Saudi Arabia Annual Technical Symposium and Exhibition, Dammam, Saudi Arabia, 23–26 April 2018. [Google Scholar] [CrossRef]
  5. Kang, Y.L.; Wang, K.C.; Xu, C.Y.; You, L.J.; Wang, L.M.; Li, N.; Li, J.X. High-temperature aging property evaluation of lost circulation materials in deep and ultra-deep well drilling. Acta Pet. Sin. 2019, 40, 215–223. [Google Scholar] [CrossRef]
  6. Su, X.M.; Lian, Z.H.; Xiong, H.Q.; Yuan, Y.; Fang, J.W. Laboratory Study on a New Composite Plugging Material with High Bearing Strength and High-Temperature Resistance. J. Chem. 2019, 2019, 1874617. [Google Scholar] [CrossRef]
  7. Zhu, Q. Applications of a Novel Lost Circulation Additive. In Proceedings of the International Petroleum Technology Conference, Virtual, 23 March–2 April 2021. [Google Scholar] [CrossRef]
  8. Liu, P.D.; Wei, F.L.; Zhang, S.; Zhu, X.Y.; Wang, L.F.; Xiong, C.M. A bull-heading water control technique of thermo-sensitive temporary plugging agent. Pet. Explor. Dev. 2018, 45, 536–543. [Google Scholar] [CrossRef]
  9. Li, C.P.; Yang, S.C.; Zheng, W.; Pan, Y.; Zeng, F.Z.; Zhao, C.L. The research of new type gel plugging agent for deep well. Energy Sources Part A Recovery Util. Environ. Eff. 2020, 46, 7485–7499. [Google Scholar] [CrossRef]
  10. Zhou, T.; Liu, J.T.; Kong, X.J.; Qian, F.; Li, W.J.; Zhong, Z.; Jing, N.; Feng, J.; Zheng, Q.; Gu, Y.X. Development of responsive well plugging material in carbonate reservoir. J. Phys. Conf. Ser. 2021, 1777, 012016. [Google Scholar] [CrossRef]
  11. Cheng, K.Y.; Liu, Y.J.; Qi, Z.L.; Tian, J.; Luo, T.T.; Hu, S.B.; Li, J. Laboratory Evaluation of the Plugging Performance of an Inorganic Profile Control Agent for Thermal Oil Recovery. Energies 2022, 15, 5452. [Google Scholar] [CrossRef]
  12. Cui, K.X.; Jiang, G.C.; Yang, L.L.; Deng, Z.Q.; Zhou, L. Preparation and properties of magnesium oxysulfate cement and its application as lost circulation materials. Pet. Sci. 2021, 18, 1492–1506. [Google Scholar] [CrossRef]
  13. Tian, L.; Bu, Y.; Liu, H.; Guo, S. Study on the penetration of strengthening material for deep-water weakly consolidated shallow formation. J. Pet. Sci. Eng. 2022, 210, 109862. [Google Scholar] [CrossRef]
  14. Zhang, J.Y.; Liu, S.H.; Liu, J.H.; Zhang, F.Y.; Cheng, Z.W. Development and application of chemical consolidation plugging agent HDL-1. Pet. Drill. Tech. 2014, 42, 69–74. [Google Scholar] [CrossRef]
  15. Chen, Z.W.; Wang, Y.J.; Li, D.Q.; Liu, S.H.; Lin, Y.X. Application of high temperature downhole crosslinking solidification technology for mud loss control in tahe oilfield. Drill. Fluid Complet. Fluid 2015, 32, 42–46. [Google Scholar] [CrossRef]
  16. Fang, J.W.; Zhang, X.; Li Liang Zhang, J.J.; Shi, X.; Hu, G.Q. Research progress of high-temperature resistant functional gel materials and their application in oil and gas drilling. Gels 2022, 9, 34. [Google Scholar] [CrossRef] [PubMed]
  17. Yang, J.B.; Bai, Y.R.; Sun, J.S.; Lv, K.H. High-Temperature Salt-Resistant High-Strength-Controlled Consolidated Resin Slurry for Fracture Plugging during Oil Gas Well Drilling. SPE J. 2024, 29, 4619–4632. [Google Scholar] [CrossRef]
  18. Ashok, S.; Patel, H.; Thaemlitz, C. Expandable, acid soluble and settable LCM for severe losses. In Proceedings of the International Petroleum Technology Conference, Dhahran, Kingdom of Saudi Arabia, 13–15 January 2020. [Google Scholar] [CrossRef]
  19. Jiang, G.C.; Cui, K.X.; Dong, T.F.; Yang, L.L.; Quan, X.H. Magnesium oxysulfate cement as a fast curing agent in drilling fluids to solve the severe loss. Pet. Sci. Technol. 2021, 39, 216–234. [Google Scholar] [CrossRef]
  20. Yang, J.B.; Bai, Y.R.; Sun, J.S.; Lv, K.H. Curing kinetics and plugging mechanism of high strength curable resin plugging material. Pet. Sci. 2024, 21, 3446–3463. [Google Scholar] [CrossRef]
  21. Pang, X.Y.; Sun, L.J.; Sun, F.; Zhang, G.; Guo, S.L.; Bu, Y.H. Cement hydration kinetics study in the temperature range from 15 °C to 95 °C. Cem. Concr. Res. 2021, 148, 106552. [Google Scholar] [CrossRef]
  22. Guo, X.Y.; Deng, Z.Z.; Li, Z.Y.; Zhang, X.G.; Zhang, L.H.; Zhao, Q.Y. The effect of different activators on the performance of an inorganic solidifiable gel plugging fluid. J. Nat. Gas Sci. Eng. 2016, 34, 253–264. [Google Scholar] [CrossRef]
  23. Sun, Y.X.; Zhang, W.J.; He, Y.; Kong, S.Q.; Liu, Y.L.; Han, R.F. A novel application of new high-strength plugging agent in Baikouquan oilfield. Appl. Sci. 2022, 12, 8150. [Google Scholar] [CrossRef]
  24. Han, F.; He, X.; Zhang, Z.; Liu, J. Hydration heat of slag or fly ash in the composite binder at different temperatures. Thermochim. Acta 2017, 655, 202–210. [Google Scholar] [CrossRef]
  25. He, J.H.; Long, G.C.; Chang, Z.Y.; Yang, Z.H.; Xie, Y.J. Effect of SAP on the Hydration Kinetics of Cement Paste at Different Curing Temperature. Mater. Rev. 2022, 36, 223–229. [Google Scholar] [CrossRef]
  26. Dai, L.H.; Xie, G.C.; Gong, J.W. Comparative study on the effect of fly ash on early hydration of low-heat cement and ordinary Portland cement. Concrete 2023, 2, 75–79+84. [Google Scholar] [CrossRef]
  27. Zhang, H.; She, J.P.; Yang, Y.; Ni, J.J.; Han, K. Plugging and Formation Damage Control Performance of a Lost Circulation Material. Oilfield Chem. 2020, 37, 581–586. [Google Scholar] [CrossRef]
  28. Knudsen, T. On particle size distribution in cement hydration. In Proceedings of the 7th International Congress on the Chemistry of Cement, Paris, France, 5–11 July 1980; pp. 170–175. [Google Scholar]
  29. Krstulović, R.; Dabić, P. A conceptual model of the cement hydration process. Cem. Concr. Res. 2000, 30, 693–698. [Google Scholar] [CrossRef]
  30. Dabić, P.; Krstulović, R.; Rušić, D. A new approach in mathematical modelling of cement hydration development. Cem. Concr. Res. 2000, 30, 1017–1021. [Google Scholar] [CrossRef]
  31. GB/T 8077; Technical Specification for Methods for Testing Uniformity of Concrete Admixture. China Standard Press: Beijing, China, 2000.
  32. GB/T 1346-2011; Test Methods for Water Requirement of Normal Consistency, Setting Time and Soundness of the Portland Cement. China Standard Press: Beijing, China, 2011.
  33. Qingdao Haitongda Special Instruments Co., Ltd. Available online: https://www.haitongda.com/htd1250.html (accessed on 1 November 2024).
  34. GB/T 19139-2012; Test Method for Oil Well Cement. China Standard Press: Beijing, China, 2012.
  35. GB/T 12959-2008; Test Methods for Heat of Hydration of Cement. China Standard Press: Beijing, China, 2008.
  36. Teng, G.G. Study on the Mechanism of Retarding Agent Inhibiting the Hydration Reaction of Phase Change Solidified Plugging Materials. Master’s Thesis, Chengdu University of Technology, Chengdu, China, 2024. [Google Scholar]
Figure 1. Dry materials.
Processes 13 02160 g001
Figure 2. The performance changes of PSPM with the addition of SA: (a) on fresh slurry; (b) during the phase transition process; (c) on consolidated body.
Processes 13 02160 g002
Figure 3. The influence of 6301 on the stability of slurry: (a) the slurry state before standing; (b) the slurry state after standing for 30 min.
Processes 13 02160 g003
Figure 4. The performance changes of PSPM with the addition of 6301: (a) on fresh slurry; (b) during the phase transition process; (c) on consolidated body.
Processes 13 02160 g004
Figure 5. The setting time of adding BA.
Processes 13 02160 g005
Figure 6. The thickening time of adding BA: (a) The consistency of slurry with different dosage BA; (b) The thickening time of slurry with different dosage BA.
Processes 13 02160 g006
Figure 7. The compressive strength of adding BA.
Processes 13 02160 g007
Figure 8. Hydration heat flow and hydration heat curves of different groups: (a) Hydration heat flow and hydration heat curves of group A; (b) Hydration heat flow and hydration heat curves of group B; (c) Hydration heat flow and hydration heat curves of group C; (d) Hydration heat flow and hydration heat curves of group D.
Processes 13 02160 g008
Figure 9. Hydration reaction rate curves of different groups: (a) Hydration reaction rate curves of group A; (b) Hydration reaction rate curves of group B; (c) Hydration reaction rate curves of group C; (d) Hydration reaction rate curves of group D.
Processes 13 02160 g009
Figure 10. SEM of hydration products before and after adding different additives: (a) SEM of hydration products obtained by group A; (b) SEM of hydration products obtained by group B; (c) SEM of hydration products obtained by group C; (d) SEM of hydration products obtained by group D.
Processes 13 02160 g010
Figure 11. XRD of hydration products before and after adding different additives: (A) XRD of hydration products obtained by group A; (B) XRD of hydration products obtained by group B; (C) XRD of hydration products obtained by group C; (D) XRD of hydration products obtained by group D.
Processes 13 02160 g011
Figure 12. Hydration process diagram of PSPM.
Processes 13 02160 g012
Table 1. Experimental design.
GroupS1 + M1SA6301BA
A---
B------
C------
D
Table 2. Slurry stratification after standing for 30 min.
63016301 Mass Concentration/%
1.00.80.60.40.20
Supernatant volume/mL<1<114912
Table 3. Results of Knudsen equations for different groups.
GroupQmax (J/g)t50 (h)Knudsen Equations
A292.957.51/Q = 0.003414 + 0.025602/(t − t0)
B280.696.21/Q = 003563 + 0.022088/(t − t0)
C275.746.81/Q = 0.003627 + 0.024661/(t − t0)
D266.1746.21/Q = 0.003757 + 0.173573/(t − t0)
Table 4. Calculation results of kinetic parameters of hydration reaction in different groups.
GroupQmax (J/g)t0 (h)t50 (h)nK1K2K3
A292.950.2417.51.45160.03470.00630.0015
B280.690.2546.21.36880.03350.00630.0016
C275.740.5126.81.39970.03440.00640.0016
D266.170.31446.21.38130.01850.00290.0079
Disclaimer/Publisher’s Note: The statements, opinions and data contained in all publications are solely those of the individual author(s) and contributor(s) and not of MDPI and/or the editor(s). MDPI and/or the editor(s) disclaim responsibility for any injury to people or property resulting from any ideas, methods, instructions or products referred to in the content.

