Abstract
Micro-fracturing technology is a key approach to enhancing the flow capacity of oil sands reservoirs and improving Steam-Assisted Gravity Drainage (SAGD) performance, whereas heterogeneity in reservoir physical properties significantly impacts stimulation effectiveness. This study systematically investigates the coupling mechanisms of asphaltene content, clay content, and heavy oil viscosity on micro-fracturing stimulation effectiveness, based on the oil sands reservoir in Block Zhong-18 of the Fengcheng Oilfield. By establishing an extended Drucker–Prager constitutive model, Kozeny–Poiseuille permeability model, and hydro-mechanical coupling numerical simulation, this study quantitatively reveals the controlling effects of reservoir properties on key rock parameters (e.g., elastic modulus, Poisson’s ratio, and permeability), integrating experimental data with literature review. The results demonstrate that increasing clay content significantly reduces reservoir permeability and stimulated volume, whereas elevated asphaltene content inhibits stimulation efficiency by weakening rock strength. Additionally, the thermal sensitivity of heavy oil viscosity indirectly affects geomechanical responses, with low-viscosity fluids under high-temperature conditions being more conducive to effective stimulation. Based on the quantitative relationship between cumulative injection volume and stimulation parameters, a classification-based optimization model for oil sands reservoir operations was developed, predicting over 70% reduction in preheating duration. This study provides both theoretical foundations and practical guidelines for micro-fracturing parameter design in complex oil sands reservoirs.
1. Introduction
The efficient development of oil sand reservoirs relies on the targeted enhancement of flow capacity through a micro-fracturing approach [1,2,3]. Although previous studies have focused on the effects of permeability, porosity, and in situ stress on stimulation performance [4,5,6], a systematic understanding of how reservoir compositional heterogeneity—specifically asphaltene content, clay content, and heavy oil viscosity—affects micro-fracturing effectiveness remains underdeveloped. The oil sands in Block Zhong-18 of China’s Fengcheng Oilfield exhibit pronounced reservoir heterogeneity due to high asphaltene content (6–14%) and widespread clay interbeds (5–22%) [3,7], rendering conventional stimulation models ineffective for precise performance prediction. Furthermore, the thermal sensitivity of heavy oil viscosity (104–5 × 10⁵ mPa·s) significantly complicates the coupled geomechanical–flow mechanisms [8,9]. Similar structural complexities have been observed in stable intracratonic basins, where abrupt deformation changes may further amplify heterogeneity [10].
Recent advances in multi-scale characterization of reservoir heterogeneity highlight that compositional variations control not only static properties but also dynamic stimulation responses. Integrated core-to-reservoir studies demonstrate that asphaltene-clay assemblages fundamentally alter pore–throat geometries and stress distributions, establishing a petrophysical basis for stimulation variability beyond conventional permeability–porosity models [11]. This necessitates explicit quantification of compositional controls in micro-fracturing design. Relevant studies highlight the critical role of composition driven heterogeneity in SAGD performance. Huang et al. (2025) demonstrated that abrupt deformation changes in cratonic basins amplify permeability contrasts [10], while Lin et al. (2017) identified clay asphaltene interactions as key permeability inhibitors [3]. Conversely, the thermomechanical coupling of viscous heavy oils remains poorly quantified. Fung et al. (1994) noted viscosity-dependent stress redistributions [12], but lacked operational design guidelines for highly heterogeneous reservoirs [8,9]. Recent advancements in computational geomechanics offer promising tools to address these complex couplings. Advanced co-simulation protocols, such as those developed between MATLAB and ABAQUS™, enable more efficient and robust simulation of the thermo-hydro-mechanical (THM) processes inherent in micro-fracturing operations within heterogeneous formations 24. Similarly, computational approaches developed for complex fluid systems [13] further validate the necessity of integrated multi-physics frameworks. These frameworks facilitate the parametric studies necessary to unravel the intricate interplay between reservoir composition, fluid properties, and geomechanical response under varying operational conditions.
Furthermore, the structural setting of the reservoir, particularly within stable cratonic basins, can impose a first-order control on heterogeneity distribution. Abrupt deformation changes associated with structural boundaries can significantly amplify permeability contrasts and influence stress regimes, further complicating stimulation predictions [10]. Understanding this structural context and the composition of the reservoirs is crucial when evaluating compositional heterogeneity effects, so this study focuses on the indirect pathways through which asphaltene content, clay content, and heavy oil viscosity influence stimulation effectiveness. The selection of asphaltene content, clay content, and heavy oil viscosity as key factors is based on their dominant control over reservoir heterogeneity. Asphaltene governs rock brittleness [7], clay minerals dictate permeability anisotropy [14], and viscosity modulates thermal–fluid coupling [8]. These parameters collectively explain >80% of stimulation variability in Fengcheng Oilfield [3,15], justifying their prioritization.
Geomechanical responses in compositionally complex reservoirs are inherently multi-physics phenomena. As demonstrated in unconsolidated sand analogs [16], the competition between particle detachment (driven by clay content) and cementation loss (governed by asphaltene solubility) dictates whether stimulation enhances permeability or induces formation damage. Capturing these competing mechanisms requires coupled hydro-thermo-mechanical (THM) formulations.
To unravel these complex interactions, and incorporate the influence of structural heterogeneity [10], we develop an extended Drucker–Prager constitutive model coupled with a dynamic permeability model, and integrating 3D surface fitting with weight analysis, this study quantitatively characterizes the nonlinear effects of reservoir properties on elastic modulus, Poisson’s ratio, and initial permeability. Critically, our numerical implementation leverages advanced co-simulation protocols between MATLAB R2023a (Natick, MA, USA) and ABAQUS™ 2024 (Dassault Systèmes, Île-de-France, France), building upon the unified computational framework established by Shao et al. (2024) for efficient coupled THM analysis [17]. This approach enables robust parametric studies of heterogeneous formations while accommodating the unique thermomechanical coupling inherent in SAGD operations. Ultimately, by establishing quantitative relationships among cumulative injection volume, hydraulic connectivity coefficient, and stimulated radius, a classification-optimized operational design strategy was developed, significantly reducing the SAGD preheating period—providing both theoretical foundations and engineering references for micro-fracturing design in highly heterogeneous oil sands reservoirs.
2. Governing Equations
2.1. Physical Model
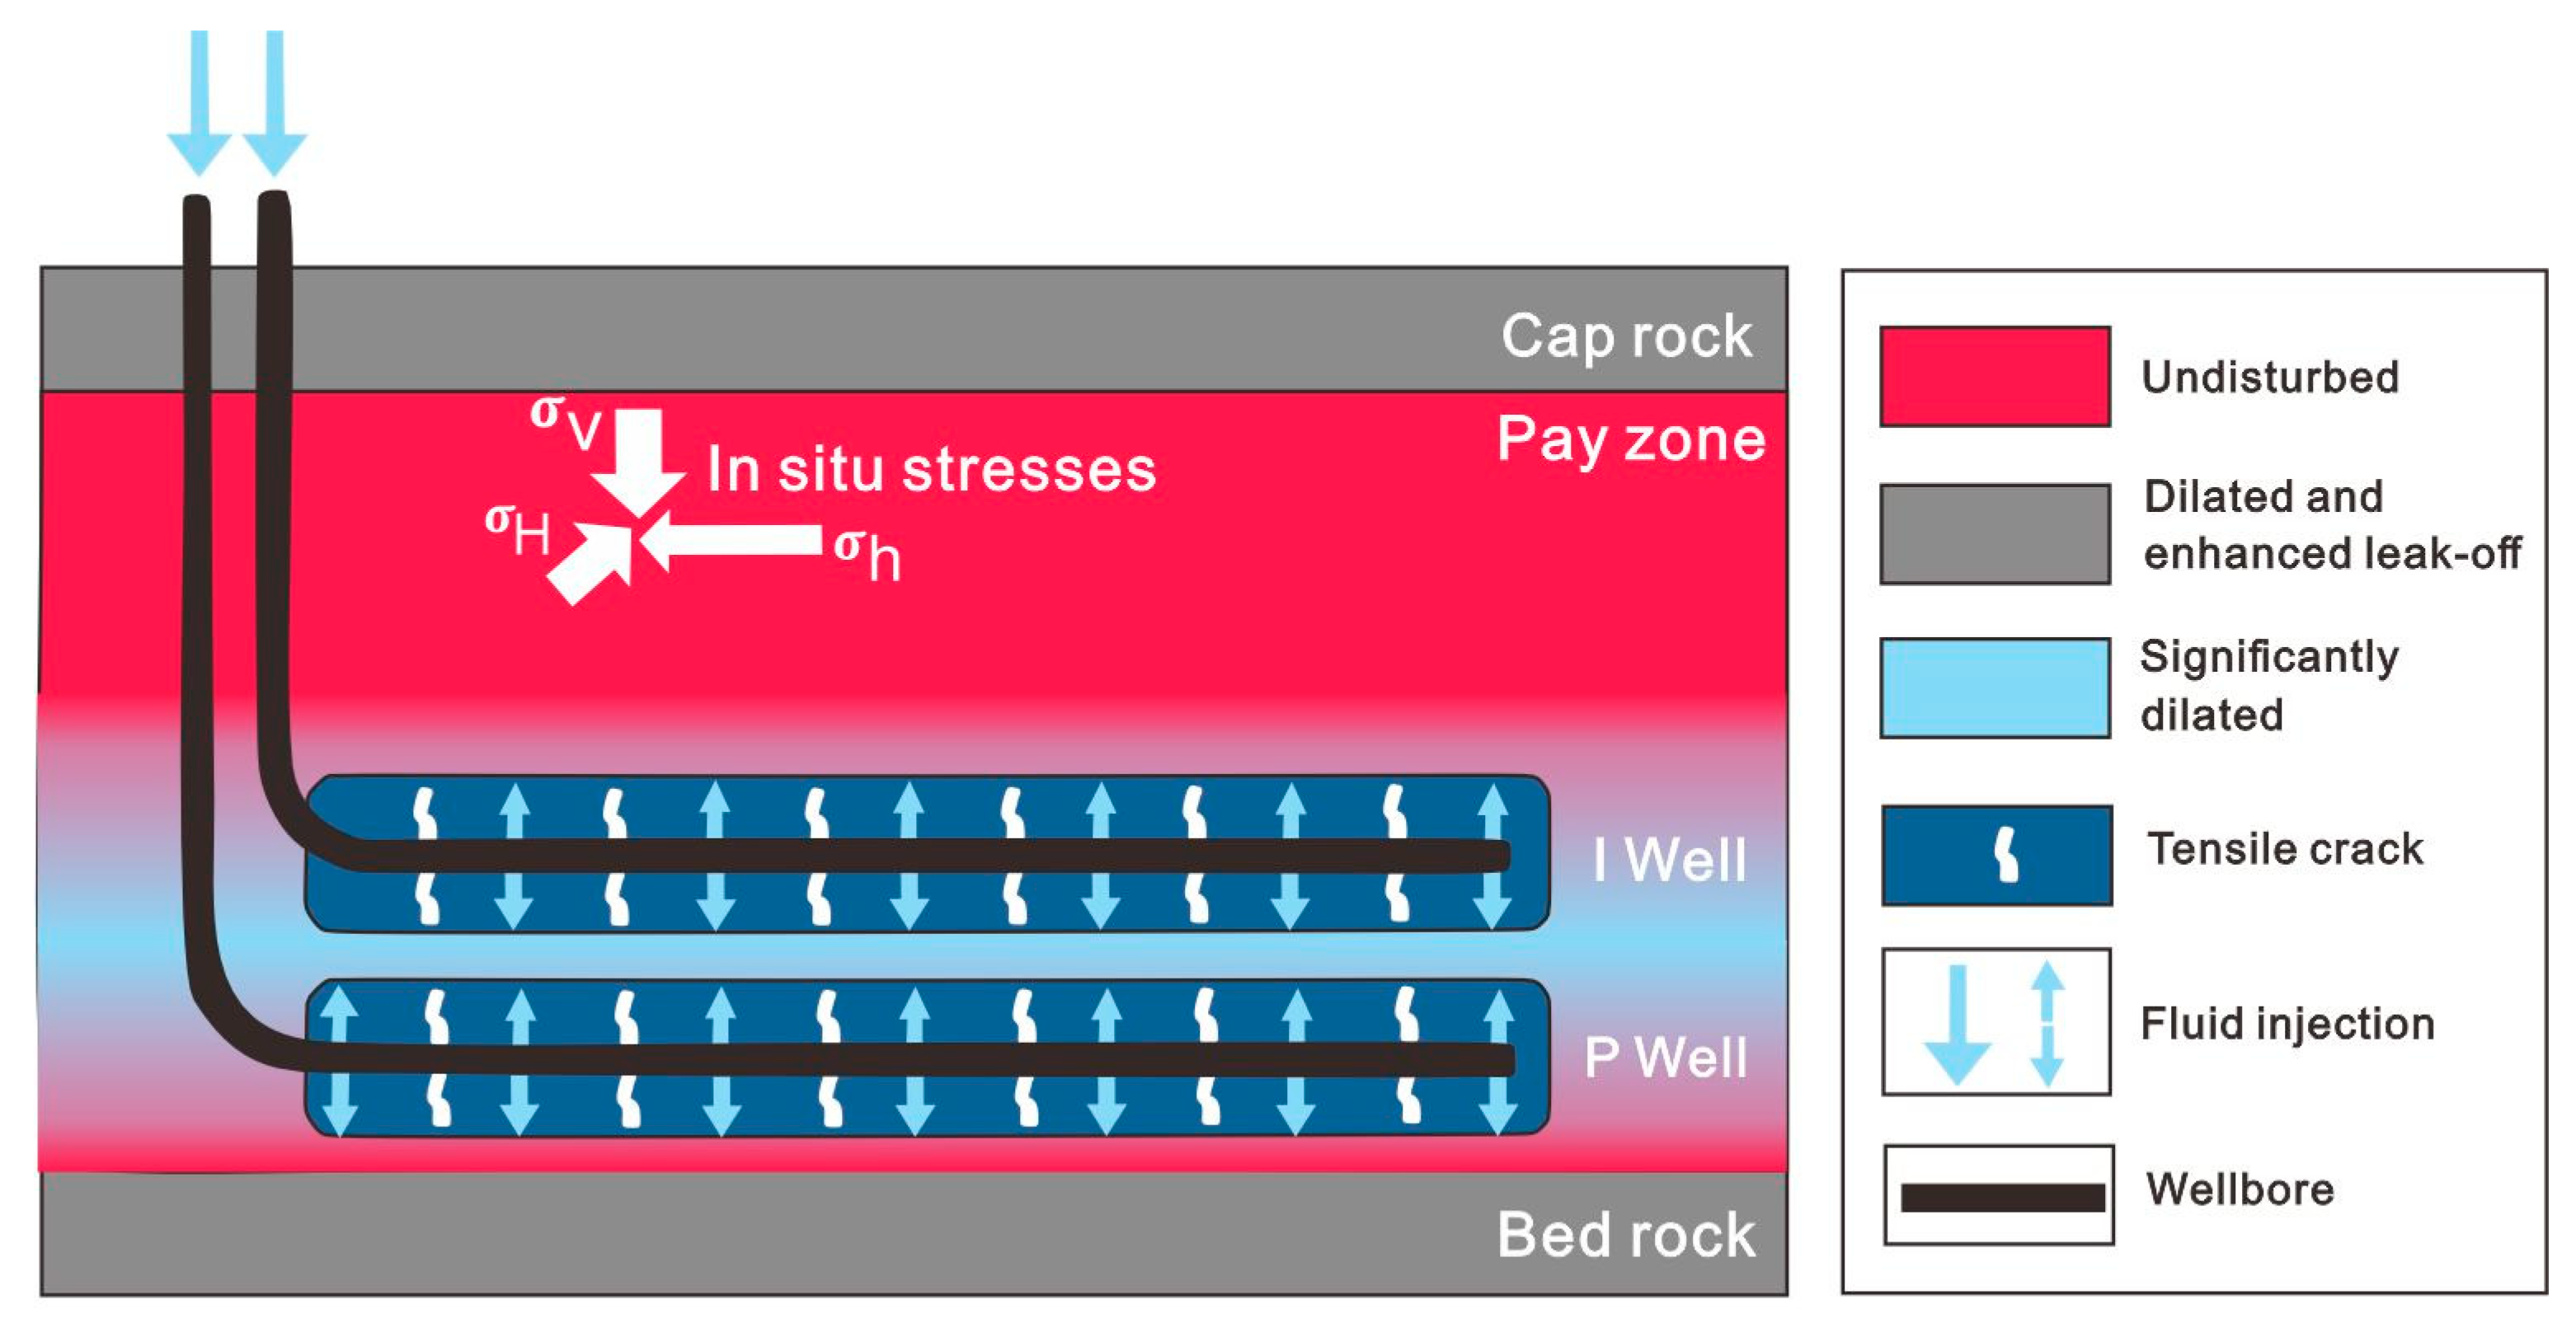
The physical model for micro-fracturing in oil sands reservoirs of the Fengcheng SAGD project is illustrated in Figure 1. During the early preheating stage, simultaneous injection of treatment fluid into both I and P wells induces intense tensile stimulation in the near-wellbore region (dark blue zone in Figure 1). When the injection pressure reaches a critical threshold (where pore pressure exceeds the tensile strength of oil sands), tensile microfractures form in this zone. Concurrently, as the effective confining pressure (confining pressure minus pore pressure) decreases in the near-wellbore region (dark blue zone), the deviatoric stress induced by in situ stress differentials triggers pronounced shear dilation in the oil sands, thereby expanding the pore volume and enhancing reservoir flow capacity. In the distal wellbore region beyond fluid invasion, the undisturbed (or minimally disturbed) oil sands exhibit negligible tensile stimulation and insignificant shear dilation. The transitional zone between near-wellbore and distal regions demonstrates progressively diminishing tensile and shear stimulation effects with increasing distance from the wellbore.

Figure 1.
Schematic diagram of the physical model for micro-fracturing in Fengcheng SAGD oil sands reservoirs [3,18].
The above analyses lead to the following conclusions—(1) injection pressure induces intense shear dilation and tensile stimulation in the near-wellbore region; (2) the degree of reservoir stimulation progressively decreases with increasing distance from the horizontal well; (3) the most significant permeability enhancement and highest flow velocity occur near the wellbore.
2.2. Mechanical Model
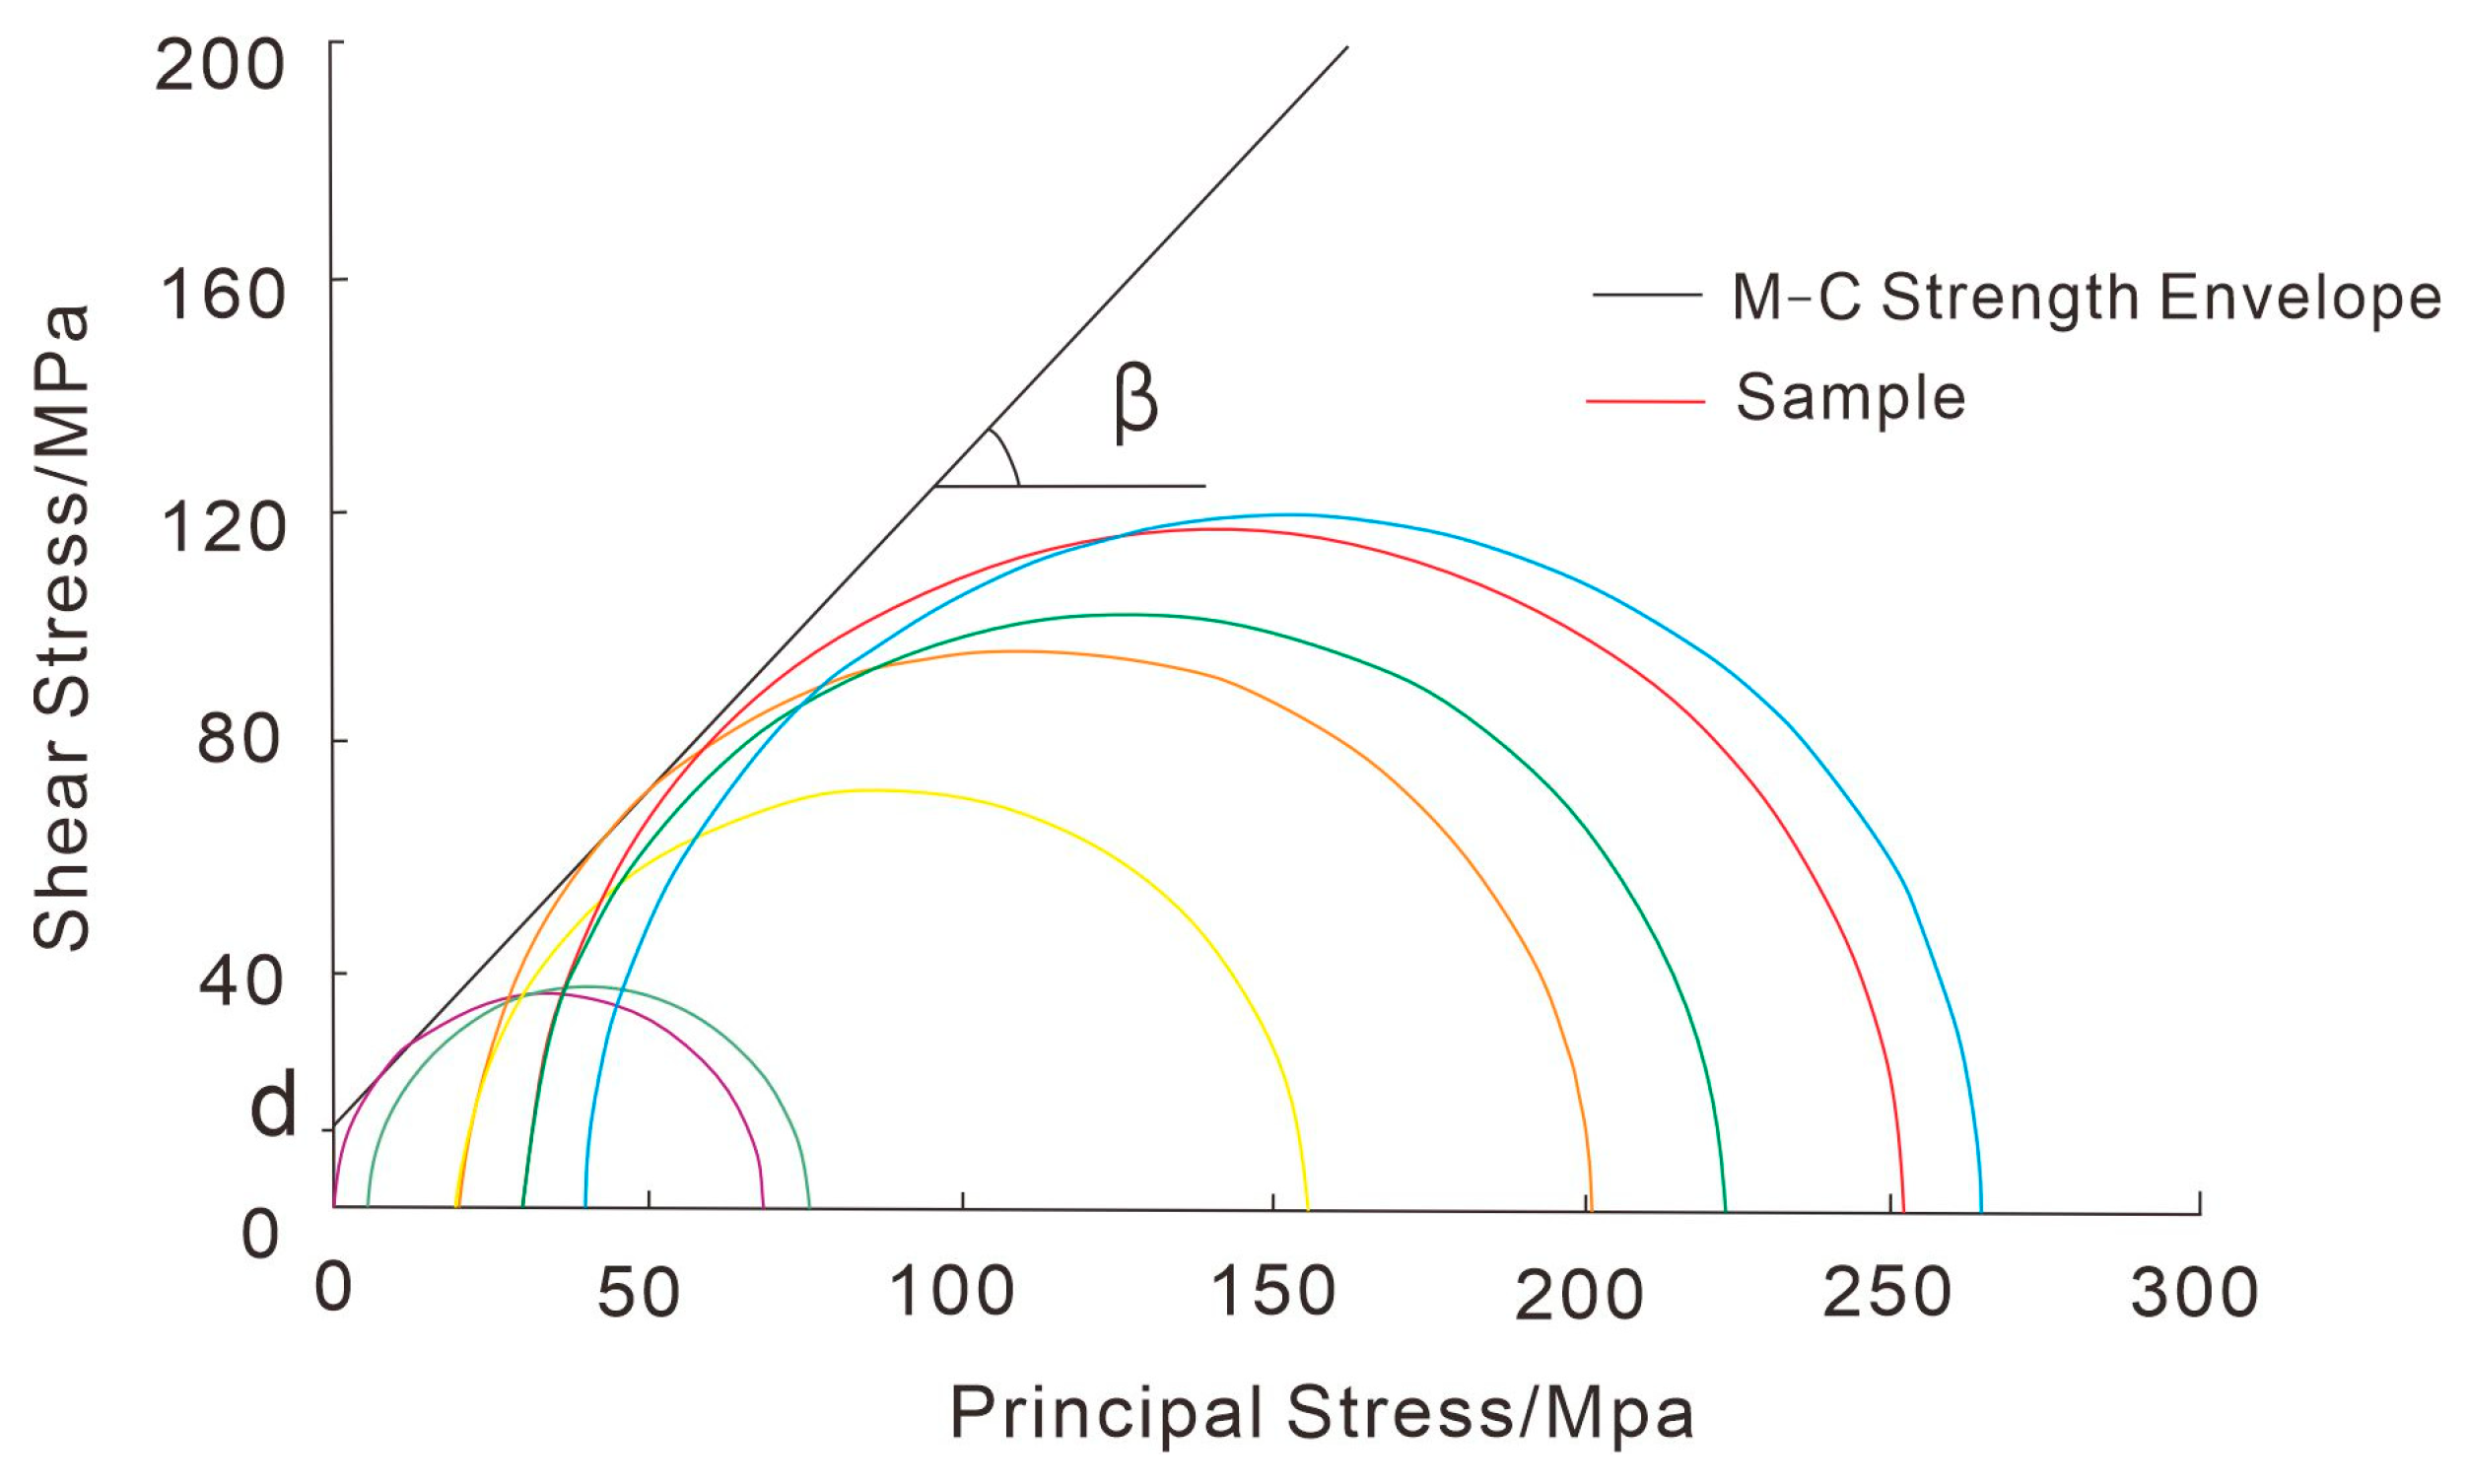
There are two standard mechanical models, the Mohr–Coulomb model (M-C) and the Drucker–Prager (D-P) model. These mechanical models describe materials’ yield or failure behavior under complex stress states and are widely used in geotechnical mechanics, geological engineering, geotechnical numerical simulation, and other fields. The M-C model is a typical yield criterion of plastic theory, which was first proposed by C.A. Coulomb in 1773 and then developed and improved by Mohr in 1900. It mainly describes the failure behavior of brittle materials (such as rock and soil) under shear. The M-C model curve is shown in Figure 2

Figure 2.
Mohr–Coulomb mechanical model.
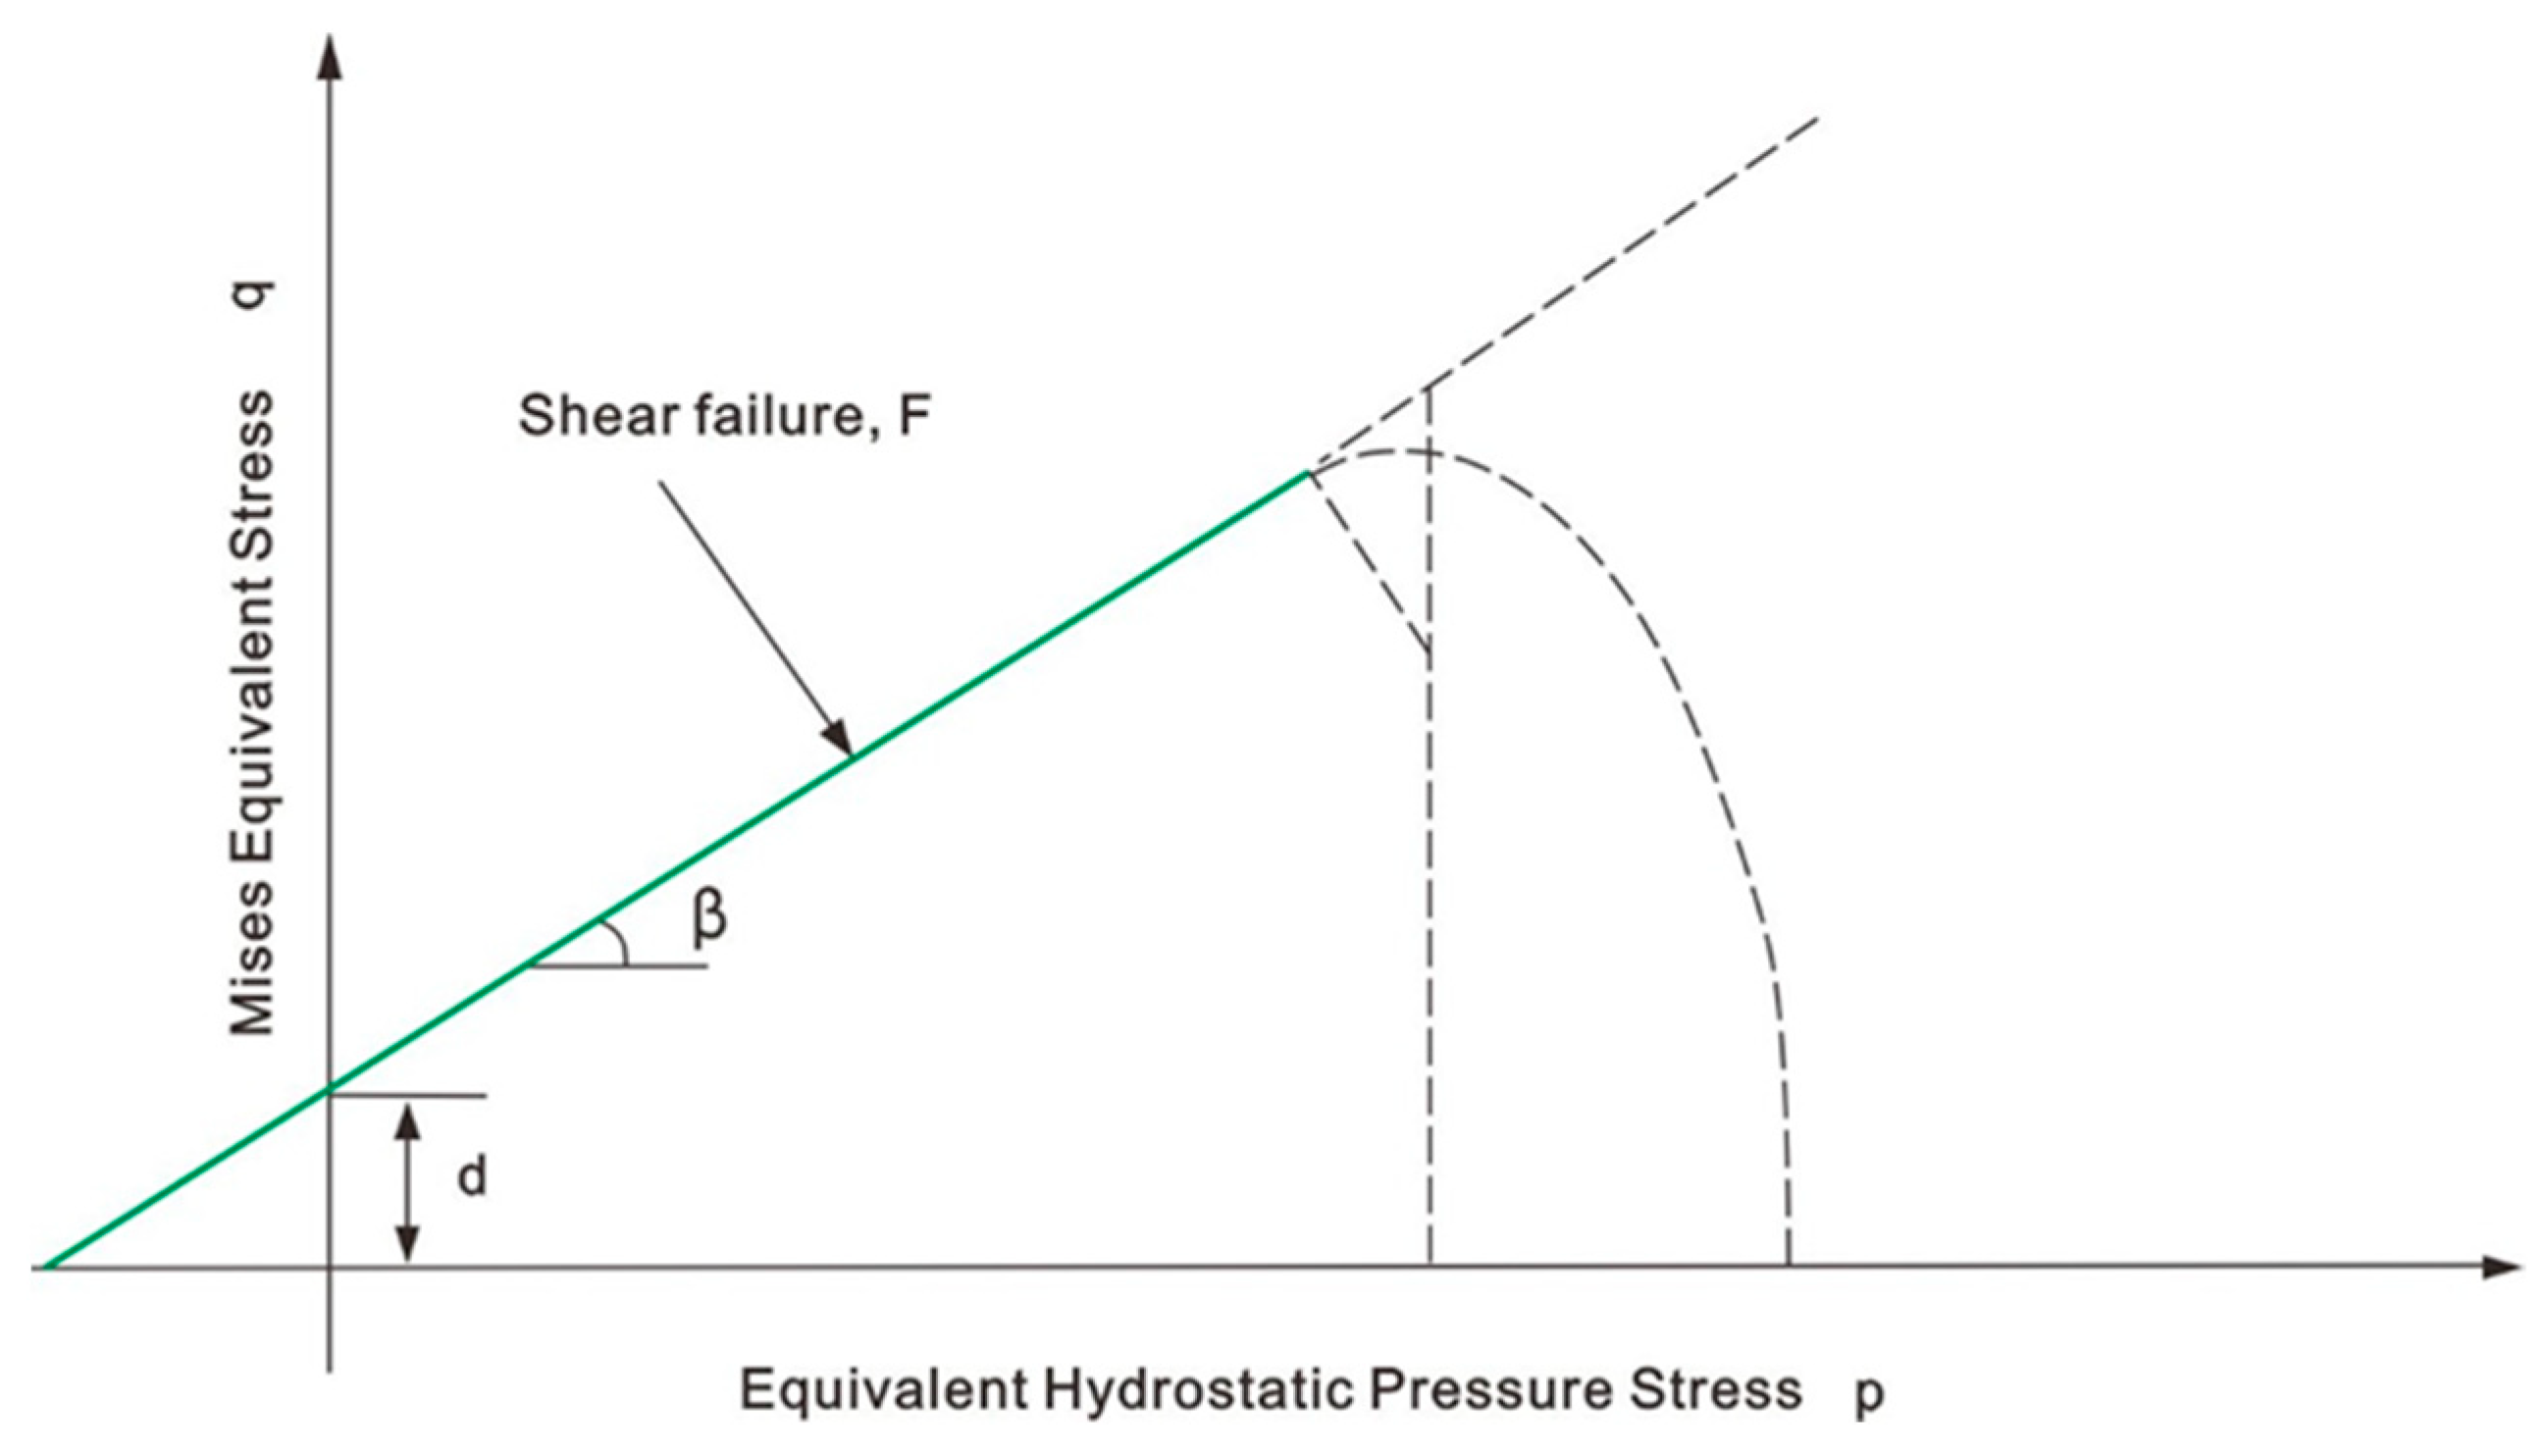
The D-P mechanical model is a smooth and continuous generalization of Mohr–Coulomb model, which was proposed by Drucker and Prager in 1952. It belongs to the yield criterion of plasticity theory and is used to describe the behavior of ideal plastic materials more widely, especially in finite element analysis. The D-P model curve is shown in Figure 3.

Figure 3.
Drucker–Prager mechanical model.
Micro-fracturing water injection stimulation in oil sands constitutes a hydro-mechanical coupling process. Simulating this process requires first establishing the mechanical constitutive model of the oil sands. The mechanical constitutive model is a mathematical formulation describing the macroscopic mechanical behavior of geomaterials, particularly the stress–strain relationship, and serves as the physical foundation for numerical modeling in rock mechanics. Based on laboratory experimental results, this study employs an extended Drucker–Prager (DP) constitutive model, which effectively characterizes the stress-dependent deformation sensitivity and shear dilation behavior of oil sands. Notably, recent studies on craton basins suggest that long-term geomechanical stability is influenced by stratification patterns [19], which may indirectly support the applicability of DP models in heterogeneous formations. The yield surface expression of the DP model is given as follows [15,20]:
where p′ is the mean effective stress, q is the deviatoric stress, I1 is the first invariant of stress tensor, J2 is the second invariant of deviatoric stress, β is the Drucker–Prager internal friction angle, and d is the Drucker–Prager cohesion.
The stresses in Equations (1)–(3) are expressed as effective stresses, which relate to total stresses as follows:
where is the Biot coefficient and is the pore pressure (i.e., formation pressure). For unconsolidated porous oil sands, the Biot coefficient is taken as 1. The conversion relationships between β, d, and the Mohr–Coulomb friction angle φ and cohesion c are given as follows [14]:
In the above equation, is the dilation angle, calculated as follows:
where is determined from the volumetric strain -axial strain relationship obtained through uniaxial or triaxial testing.
When reservoir deformation is within the elastic stage, strain calculations in all directions obey poroelastic medium mechanics [21]:
where and are the shear modulus and bulk modulus, respectively, and is Poisson’s ratio. When micro-fracturing progresses to the plastic stage, plastic deformation follows a non-associated flow rule, i.e., the yield surface and plastic potential surface diverge. The plastic strain is calculated as
where is the plastic strain increment, is the axial plastic strain increment under uniaxial compression, and the parameter is calculated as
where is the plastic potential function, calculated as
The shear dilation and tensile stimulation of oil sands lead to increased pore space and enhanced flow capacity. The volumetric strain can be calculated from triaxial deformation as
2.3. Permeability Model
Based on laboratory experimental results, the Kozeny–Poiseuille permeability model was adopted, which incorporates the mechanism of permeability enhancement through real-time stimulation dynamics. Laboratory tests demonstrated close agreement between measured permeability data and model predictions [15,22].
Here, k and k0 are the effective and original water permeabilities, respectively; , and denote the volumetric, axial, and radial strains; and represents the initial porosity.
3. Impacts of Reservoir Properties on Micro-Fracturing Stimulation Effectiveness
3.1. Effects of Asphaltene Content and Clay Content
For modeling different oil sand reservoir classifications, key controllable rock parameters were determined by referencing the analytical methodology specified in Methods for Determining Triaxial Strength and Deformation Parameters of Coal and Rock (GB/T 23561.9-2009) [23]. A correlation Table A1 was established between asphaltene content (), clay content () (corresponding to distinct oil sands reservoirs), and the following mechanical parameters: Young’s modulus (), Poisson’s ratio (), internal friction angle (), flow stress ratio (), dilation angle (), yield stress (), plastic axial strain (), initial porosity (), and initial permeability (). Functional relationships between these variables were subsequently derived through mathematical modeling.
Clearly, the controllable rock parameters are not solely bivariate functions of asphaltene and clay contents. For analytical simplicity, two conditions are established. (1) This functional relationship specifically applies to the oil sands in Block Zhong-18 of the Fengcheng Oilfield, where asphaltene content ranges between 6 and 14% and clay content varies within 5–22%. (2) Beyond asphaltene and clay contents, other variables remain constant, exhibit negligible variations, or exert minimal influence on the controllable rock parameters.
Based on the data provided in Table A1, with asphaltene content () () and clay content () () as independent variables and controllable rock parameters as dependent variables, fitting curves of varying forms were established, followed by validation, calibration, and refinement of these curves.
Two distinct fitting methods were employed: (1) 3D surface fitting and (2) weighted analysis. For the weighted method, given that asphaltene content reduces stimulation effectiveness by approximately 5%, while clay content diminishes it by approximately 12%, weighting coefficients of 0.3 and 0.7 were assigned to asphaltene and clay contents, respectively. Note that other reservoir and fluid properties are excluded from this analysis, implying that their effects on stimulation are either negligible or nonexistent.
3.1.1. Relationship Between Asphaltene Content, Clay Content, and Young’s Modulus
- (a)
- Three-dimensional surface fitting
Young’s modulus is a parameter that expresses the relationship between stress and stress in the elastic deformation stage of rock, which reflects the stiffness of rock and is an important mechanical parameter in the process of oilfield development. The model results show that the argillaceous mineral dominant skeleton is a high elastic modulus, and the asphaltene dominant skeleton is a low elastic modulus. The porosity of oil sands with large argillaceous content has the characteristics of being smaller and more uniform.
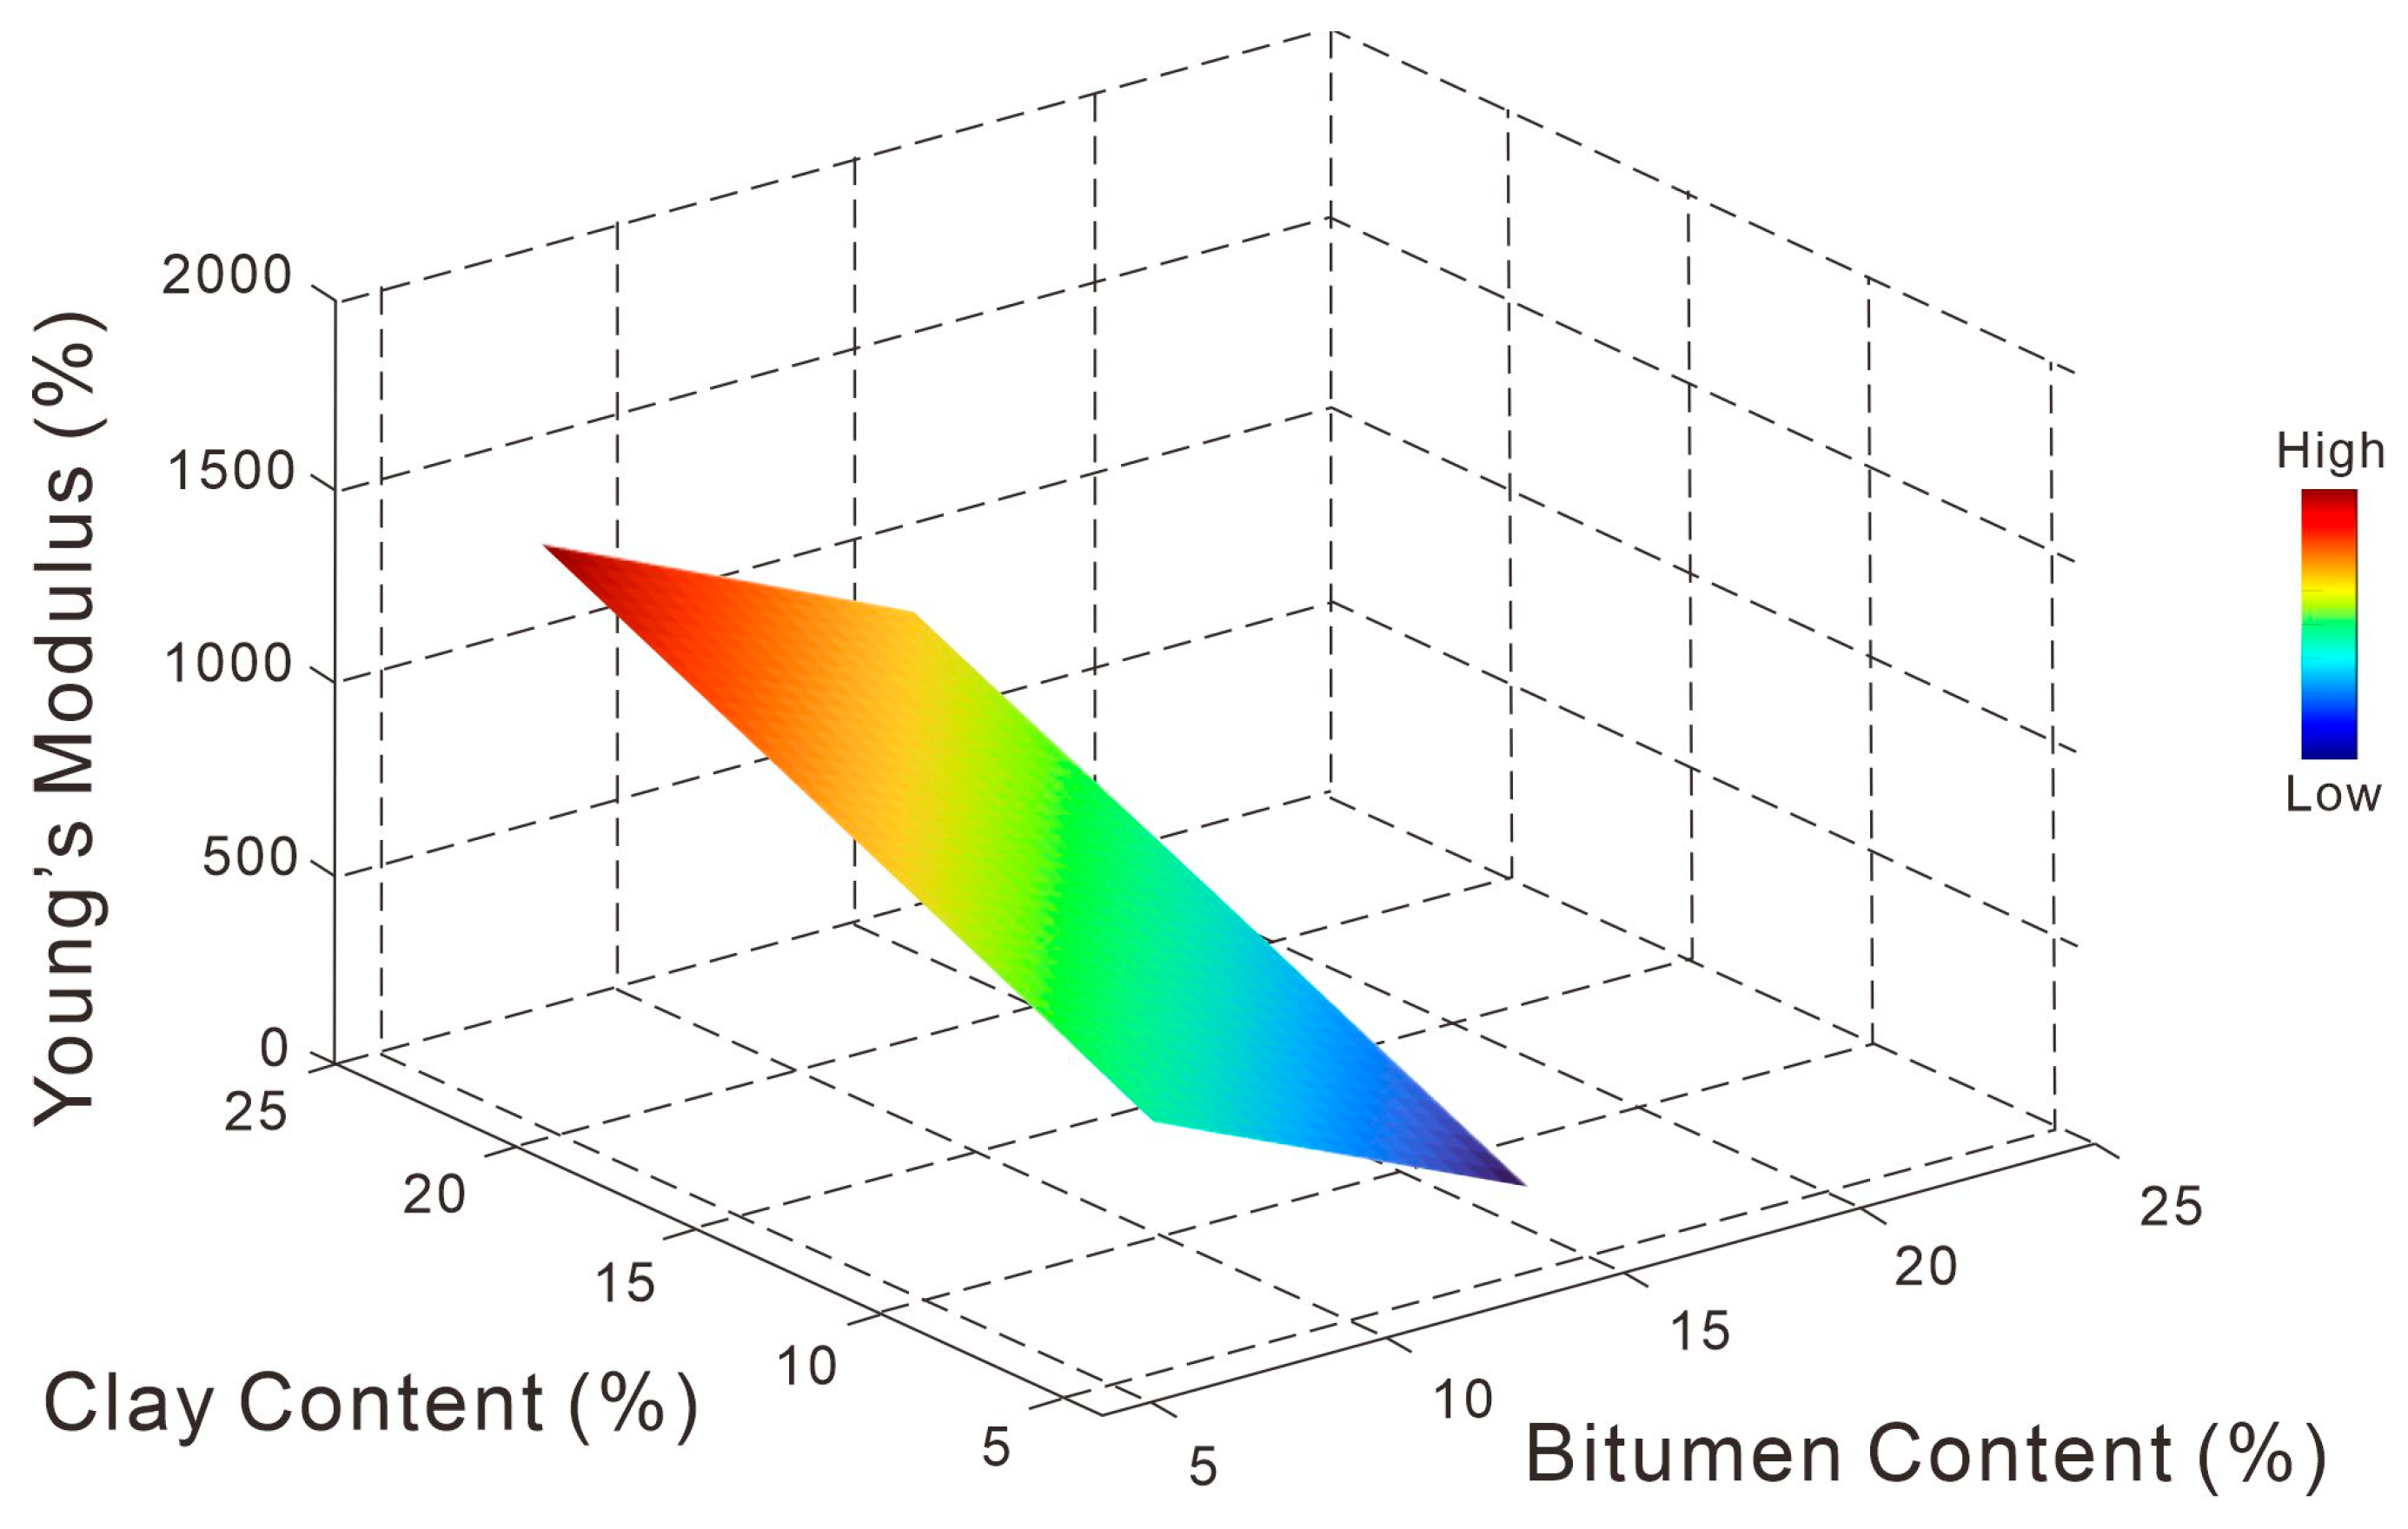
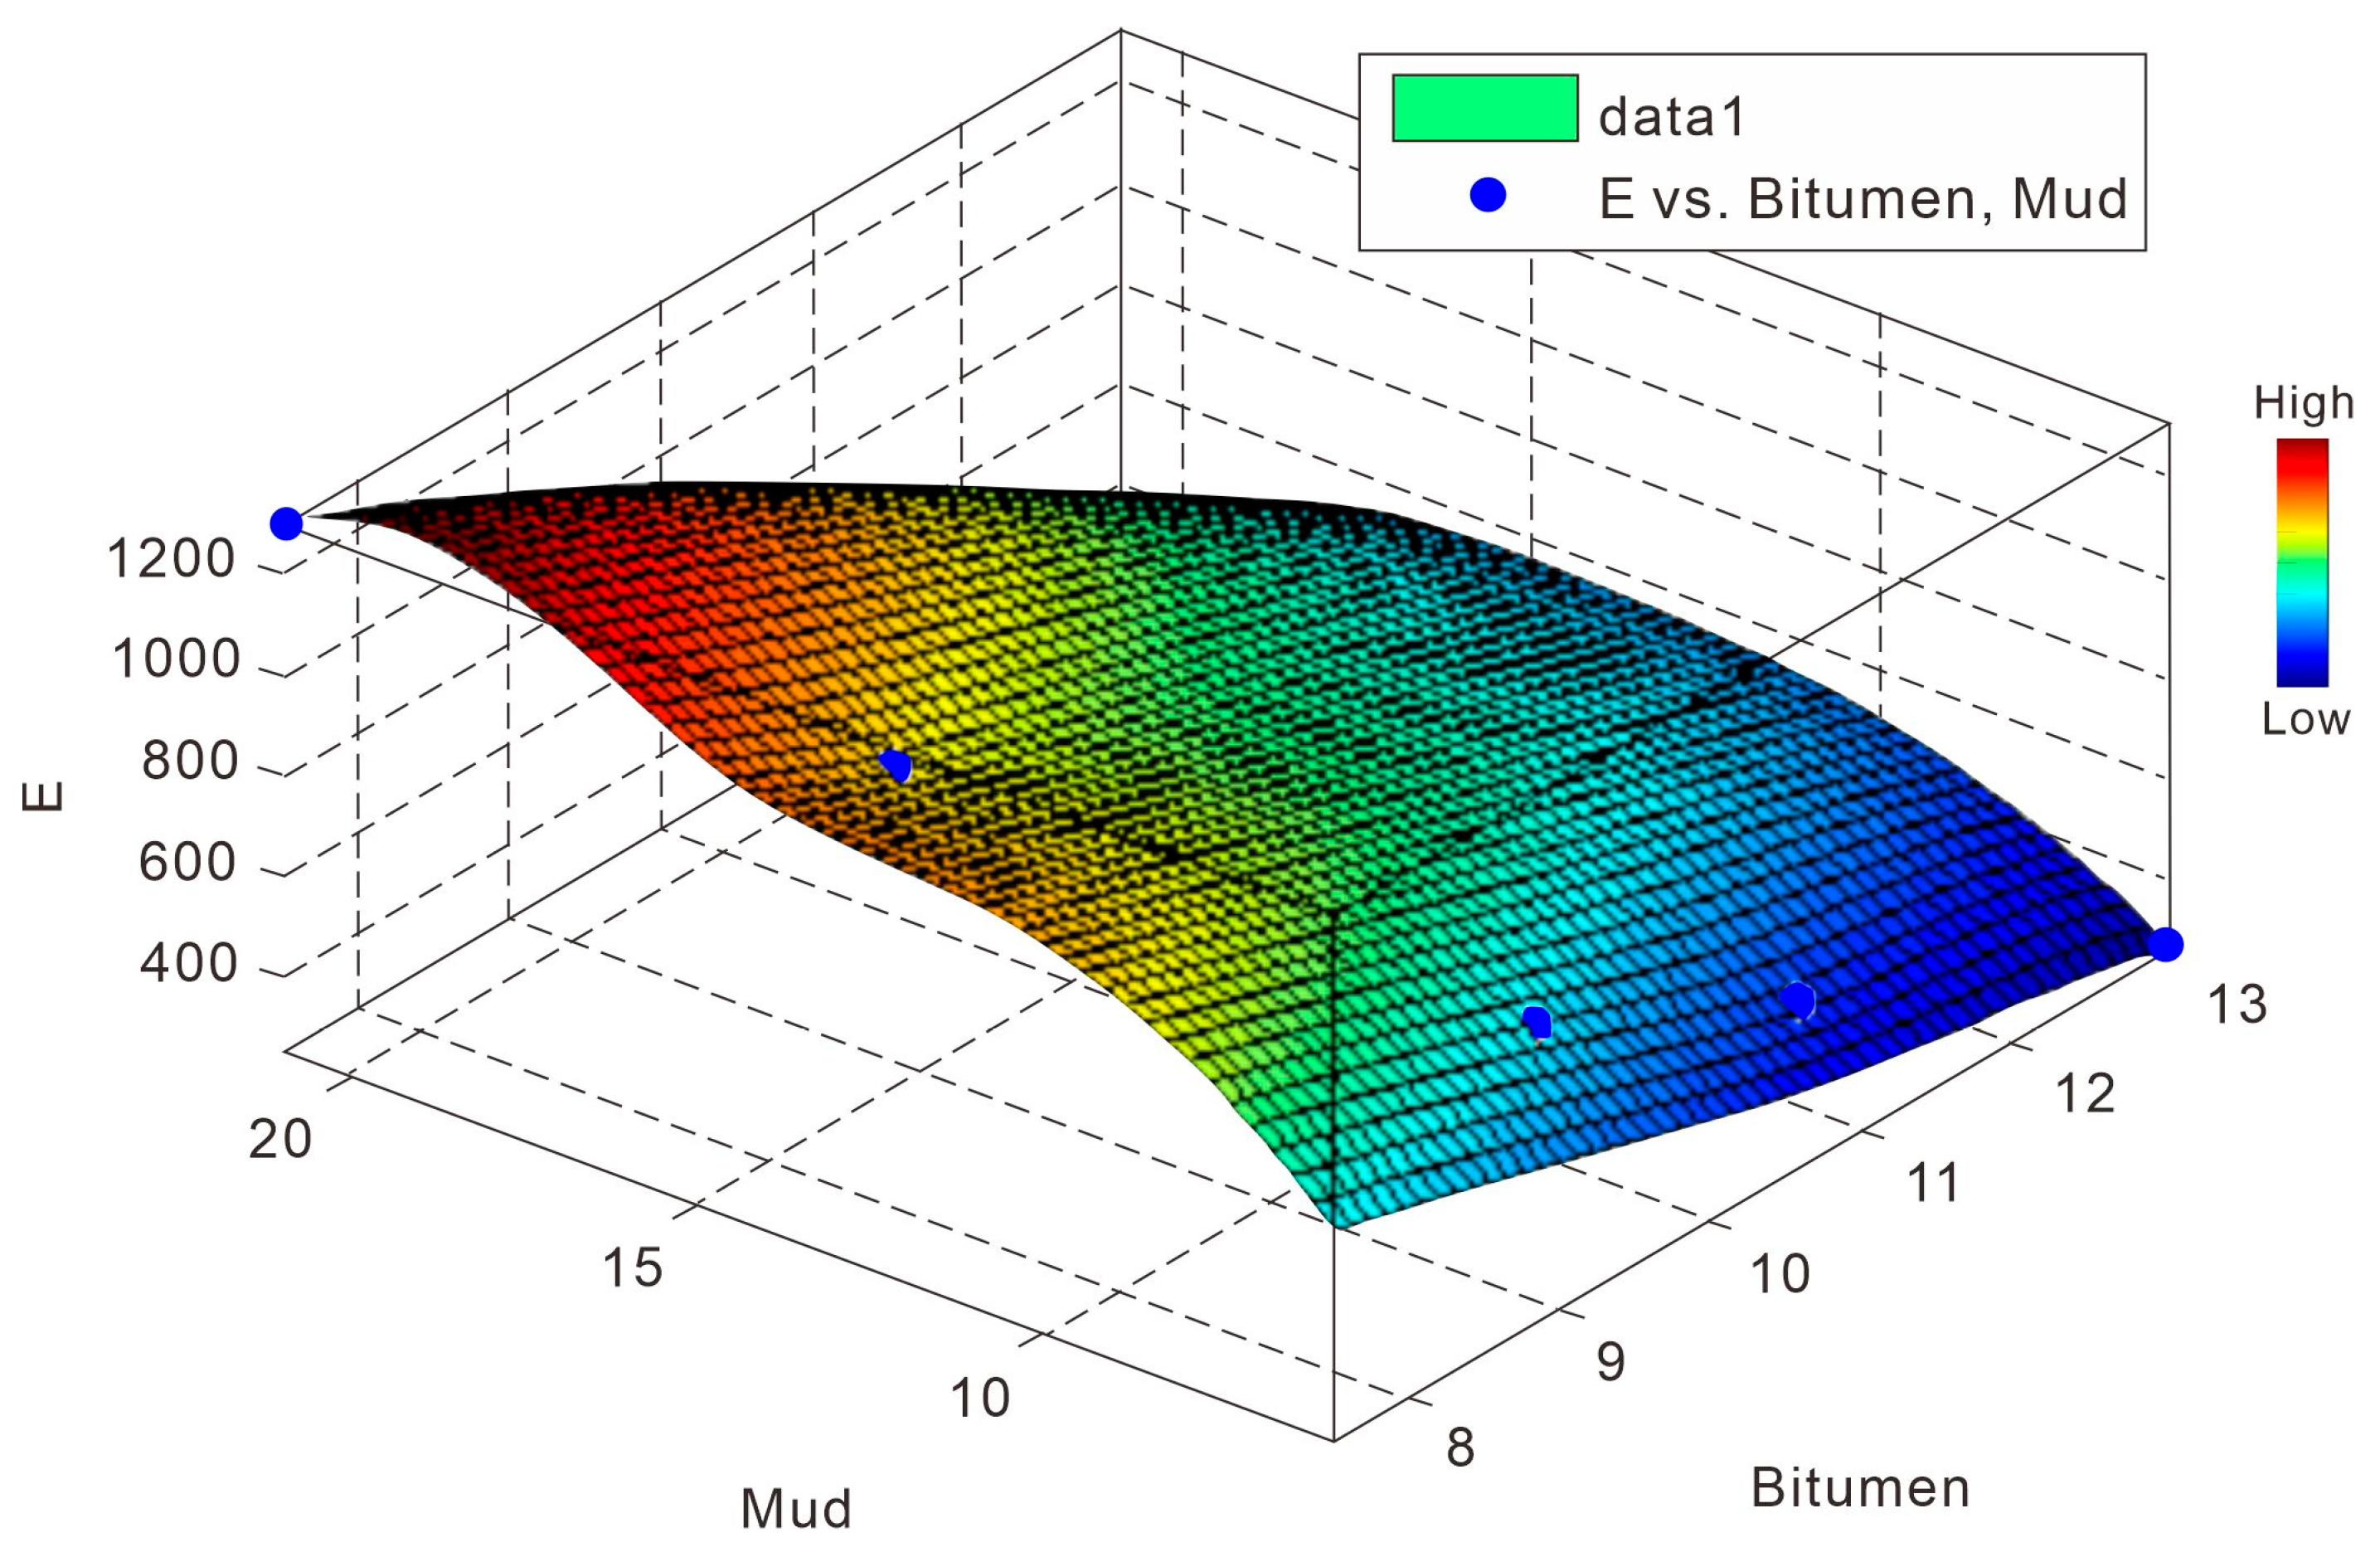
Using asphaltene content () as the x-axis, clay content () as the y-axis, and Young’s modulus () as the z-axis, experimental data were input to generate a 3D fitted surface via MATLAB, as illustrated in Figure 4.

Figure 4.
Correlation between bitumen/clay content and Young’s modulus.
As shown in Figure 4, Young’s modulus increases with clay content but decreases with asphaltene content. When = 8–11 and = 6–9, Young’s modulus stabilizes around 650 MPa, consistent with conventional oil sands. When = 10–14 and = 5–8, the modulus drops to approximately 400 MPa, aligning with asphaltene-rich oil sands. Conversely, when = 6–10 and = 10–22, the modulus rises to about 900 MPa. In other regions ( < 12%, < 20%), the surface exhibits gradual variations, all within the plausible range around 250–1500 MPa.
- (b)
- Weighted analysis method
Existing literature reports the elastic modulus of Fengcheng oil sands as typically ranging between 250 and 650 MPa, while clay-rich oil sands exhibit values around 1000 MPa. However, our mechanical tests on clay-dominated oil sands revealed anomalously low moduli, likely due to severe hydration and strong heterogeneity, prompting a calibrated modulus of 1300 MPa. Experimental results clearly demonstrate an inverse correlation between Young’s modulus and asphaltene content, but a positive correlation with clay content.
The functional relationship between asphaltene content, clay content, and elastic modulus was fitted using piecewise linear interpolation, as illustrated in Figure 5:
Considering the weighting effects, we derive
where the ranges of asphaltene and clay contents are between and . The above equation was input into MATLAB for graphical representation, with the output plot shown below.

Figure 5.
Correlation between bitumen–clay content and Young’s modulus.
Figure 5.
Correlation between bitumen–clay content and Young’s modulus.
The results of this model are proposed for the first time in this paper, which is not a conclusion found in the literature, the same applies for the information below.
Figure 5 reveals that the bivariate function forms a smooth surface, with Young’s modulus values all within the reasonable range (approximately 100–1300 MPa). Unlike the 3D surface fitting method, the weighted approach generates an inclined plane. Notably, both methods consistently demonstrate that the Young’s modulus increases with higher clay content and lower asphaltene content. Comparing this plane with experimentally measured data points shows that asphaltene-rich and moderately asphaltic oil sands exhibit Young’s moduli of 200–450 MPa and conventional oil sands cluster around 650 MPa, while clay-rich and highly argillaceous oil sands range between 900 and 1300 MPa. Except for some deviation in highly argillaceous oil sands, these results align well with experimental measurements for other types.
Comparing the functions and graphical outputs from both 3D surface fitting and weighted analysis reveals close agreement across most parameter ranges. To minimize error, the more conservative weighted method was prioritized. Additionally, the weighted approach offers a key advantage; it allows the seamless incorporation of new factors through weight redistribution as experimental samples and datasets expand—a critical consideration in method selection. Therefore, the weighting method model has accuracy, and in order to reduce the error, a conservative weighting method is adopted.
Subsequent simulations of parameters such as Poisson’s ratio, initial porosity, and initial permeability will be conducted using the weight method instead of the three-dimensional surface simulation method.
- (1)
- Relationship between asphaltene content, clay content, and Poisson’s ratio. The relationship between asphaltene content, clay content, and Poisson’s ratio can be expressed as
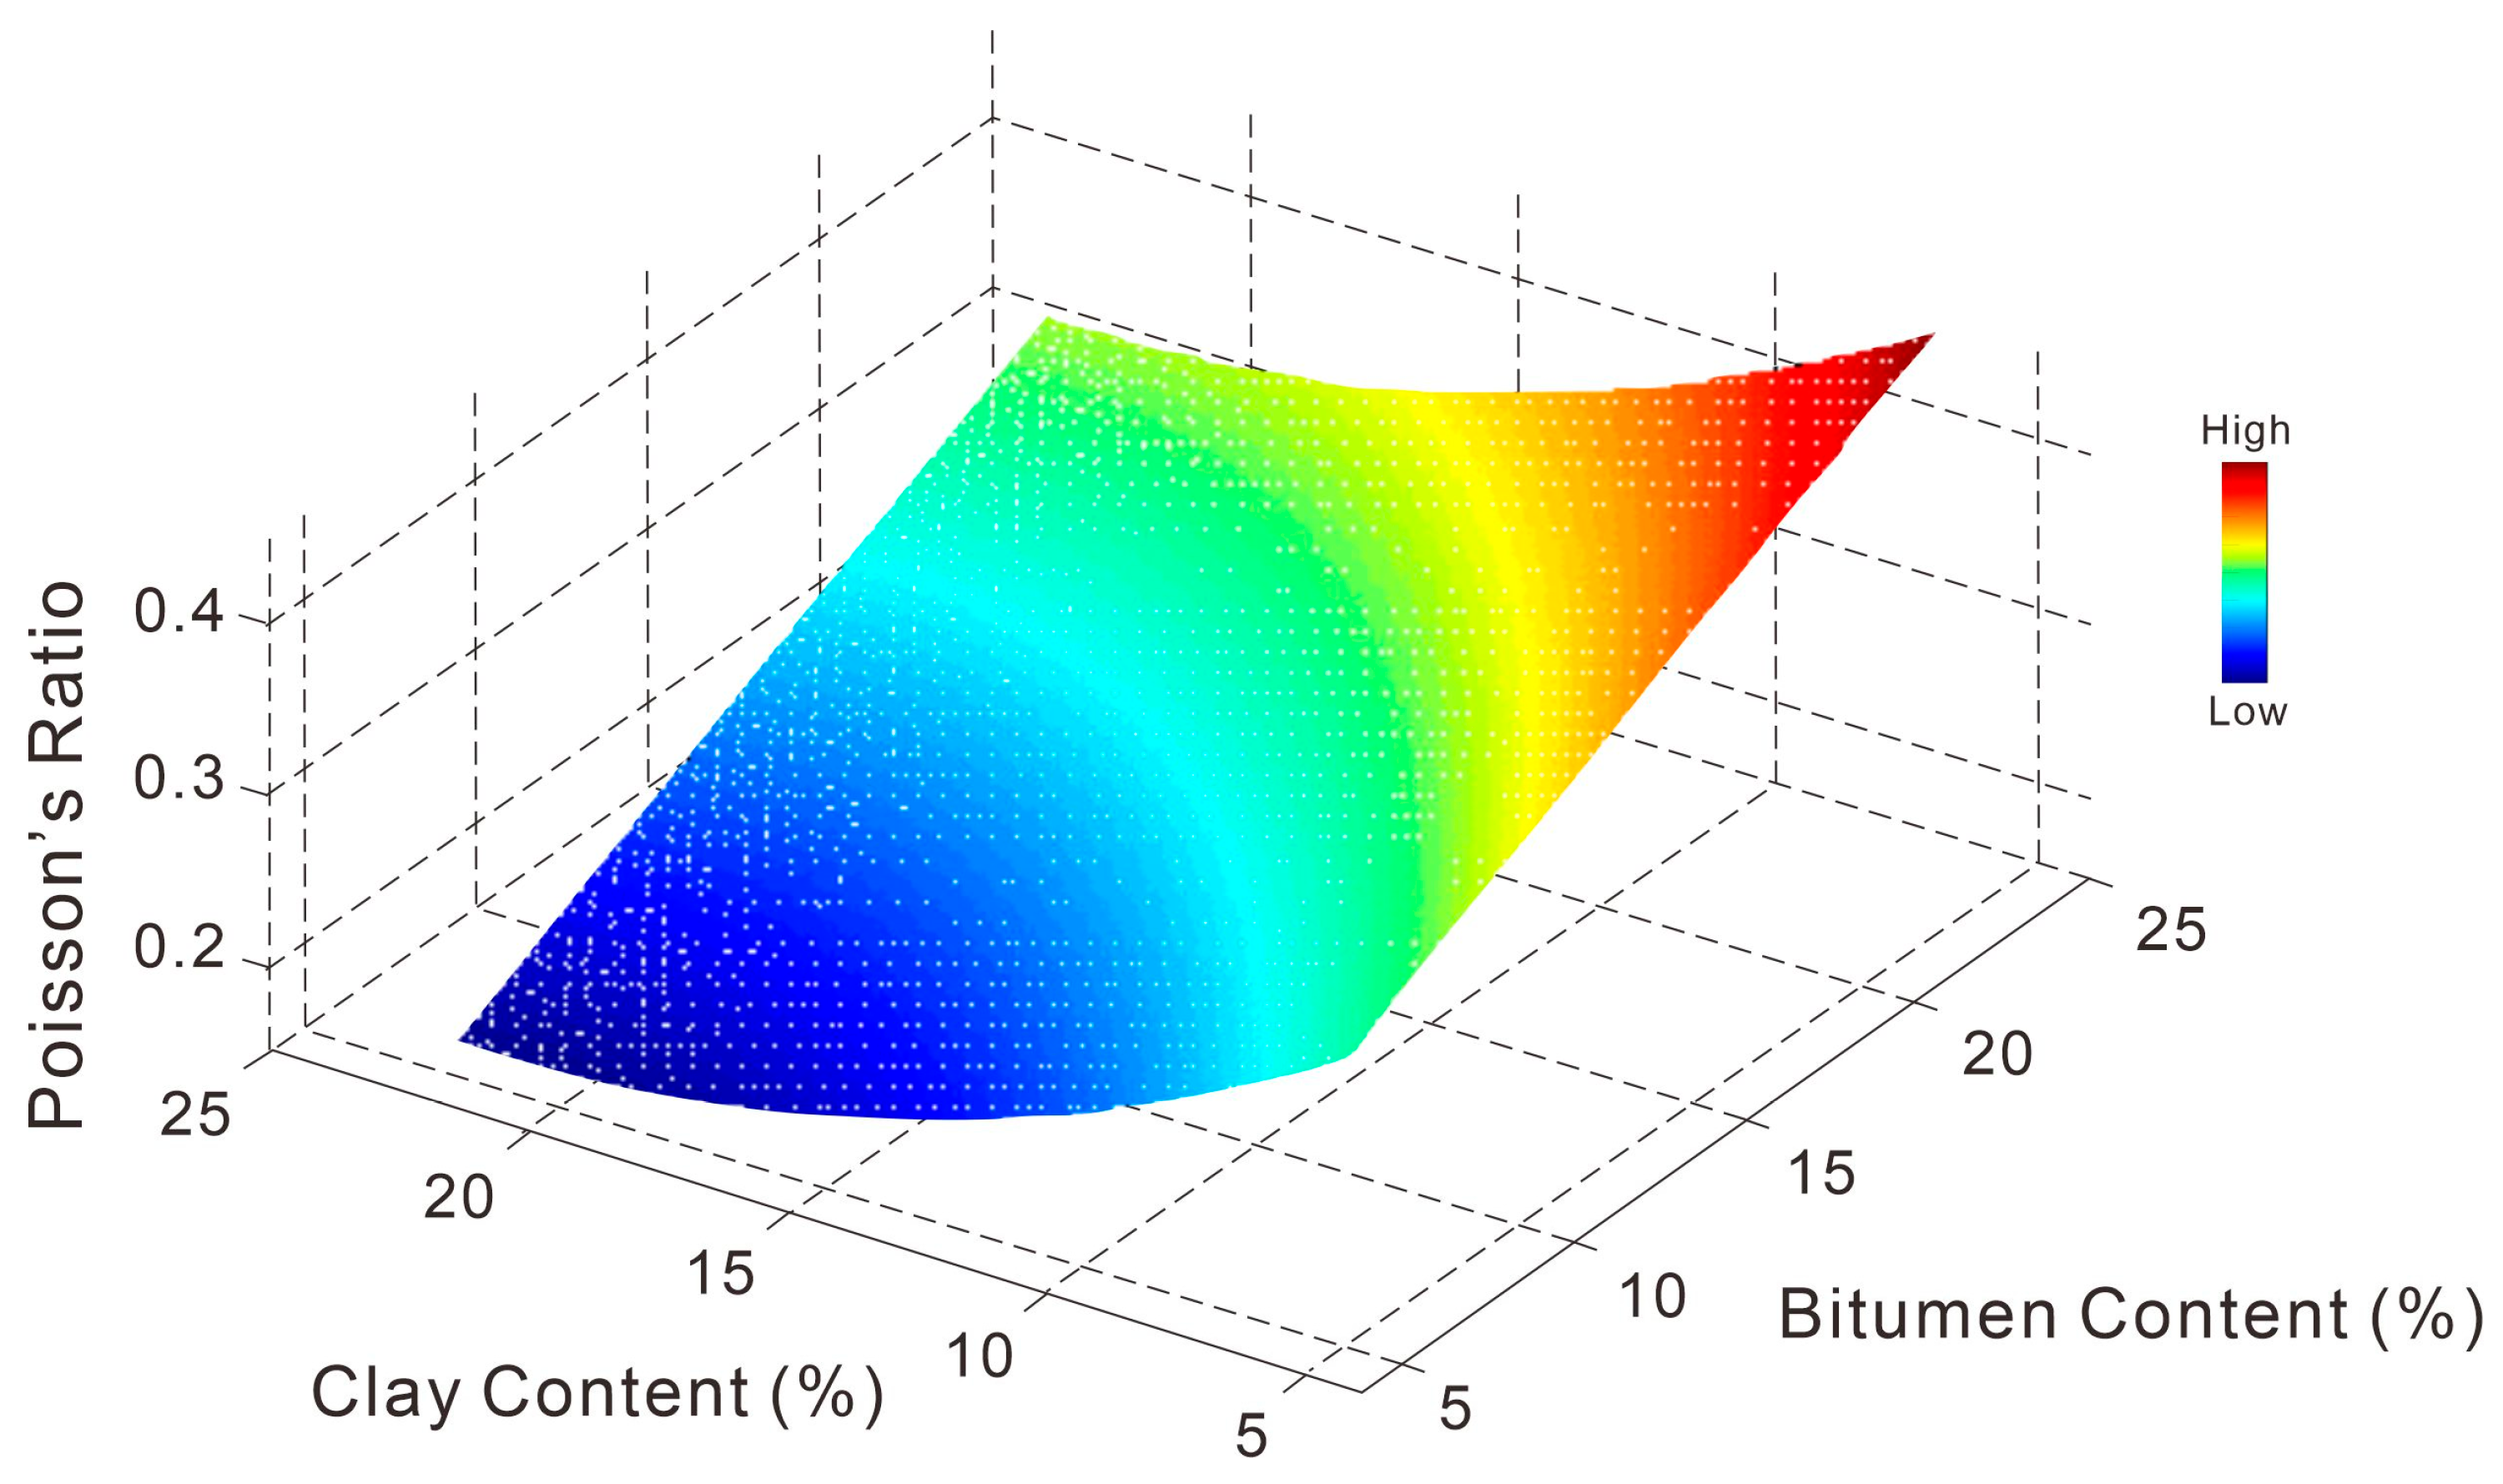
The relationship between asphaltene content, clay content, and Poisson’s ratio is graphically represented in Figure 6.

Figure 6.
Correlation between bitumen–clay content and Poisson’s ratio.
As shown in Figure 6, the Poisson’s ratio of oil sands ranges approximately between 0.2 and 0.4, increasing with higher asphaltene content and lower clay content. Specifically, asphaltene-rich and moderately asphaltic oil sands exhibit Poisson’s ratios of 0.35–0.4, conventional oil sands cluster around 0.3, while clay-rich and highly argillaceous oil sands show lower values of approximately 0.2–0.25. These ranges align well with experimentally measured samples.
Poisson’s ratio is a dimensionless parameter that characterizes the sample’s transverse strain and axial strain ratio under the axial stress of rock, which reflects the deformation characteristics of the rock and is the mechanical characteristic parameter that is the focus of the oilfield development process. Therefore, according to the simulation results, it was found that a continuous rigid skeleton was formed in the rock. When subjected to axial stress, the strong interaction between rigid particles (ionic bonds, covalent bonds) will limit the lateral deformation, resulting in a lower Poisson’s ratio and a decrease in argillaceous content, the pores in the rock may increase or be more unevenly distributed, the stress transmission path is more complex, the transverse deformation is more likely to occur, and the Poisson’s ratio increases. Conversely, asphaltenes are high-molecular-weight organic mixtures with weak van der Waals forces and lack strong chemical bonds. Under the action of stress, asphaltenes are prone to viscoelastic deformation (slippage and rearrangement of molecular segments), which is manifested as high shear flexibility, which will lead to an increase in Poisson’s ratio.
- (2)
- Relationship between asphaltene content, clay content, and initial porosity.
The relationship between asphaltene content, clay content, and initial porosity can be expressed as
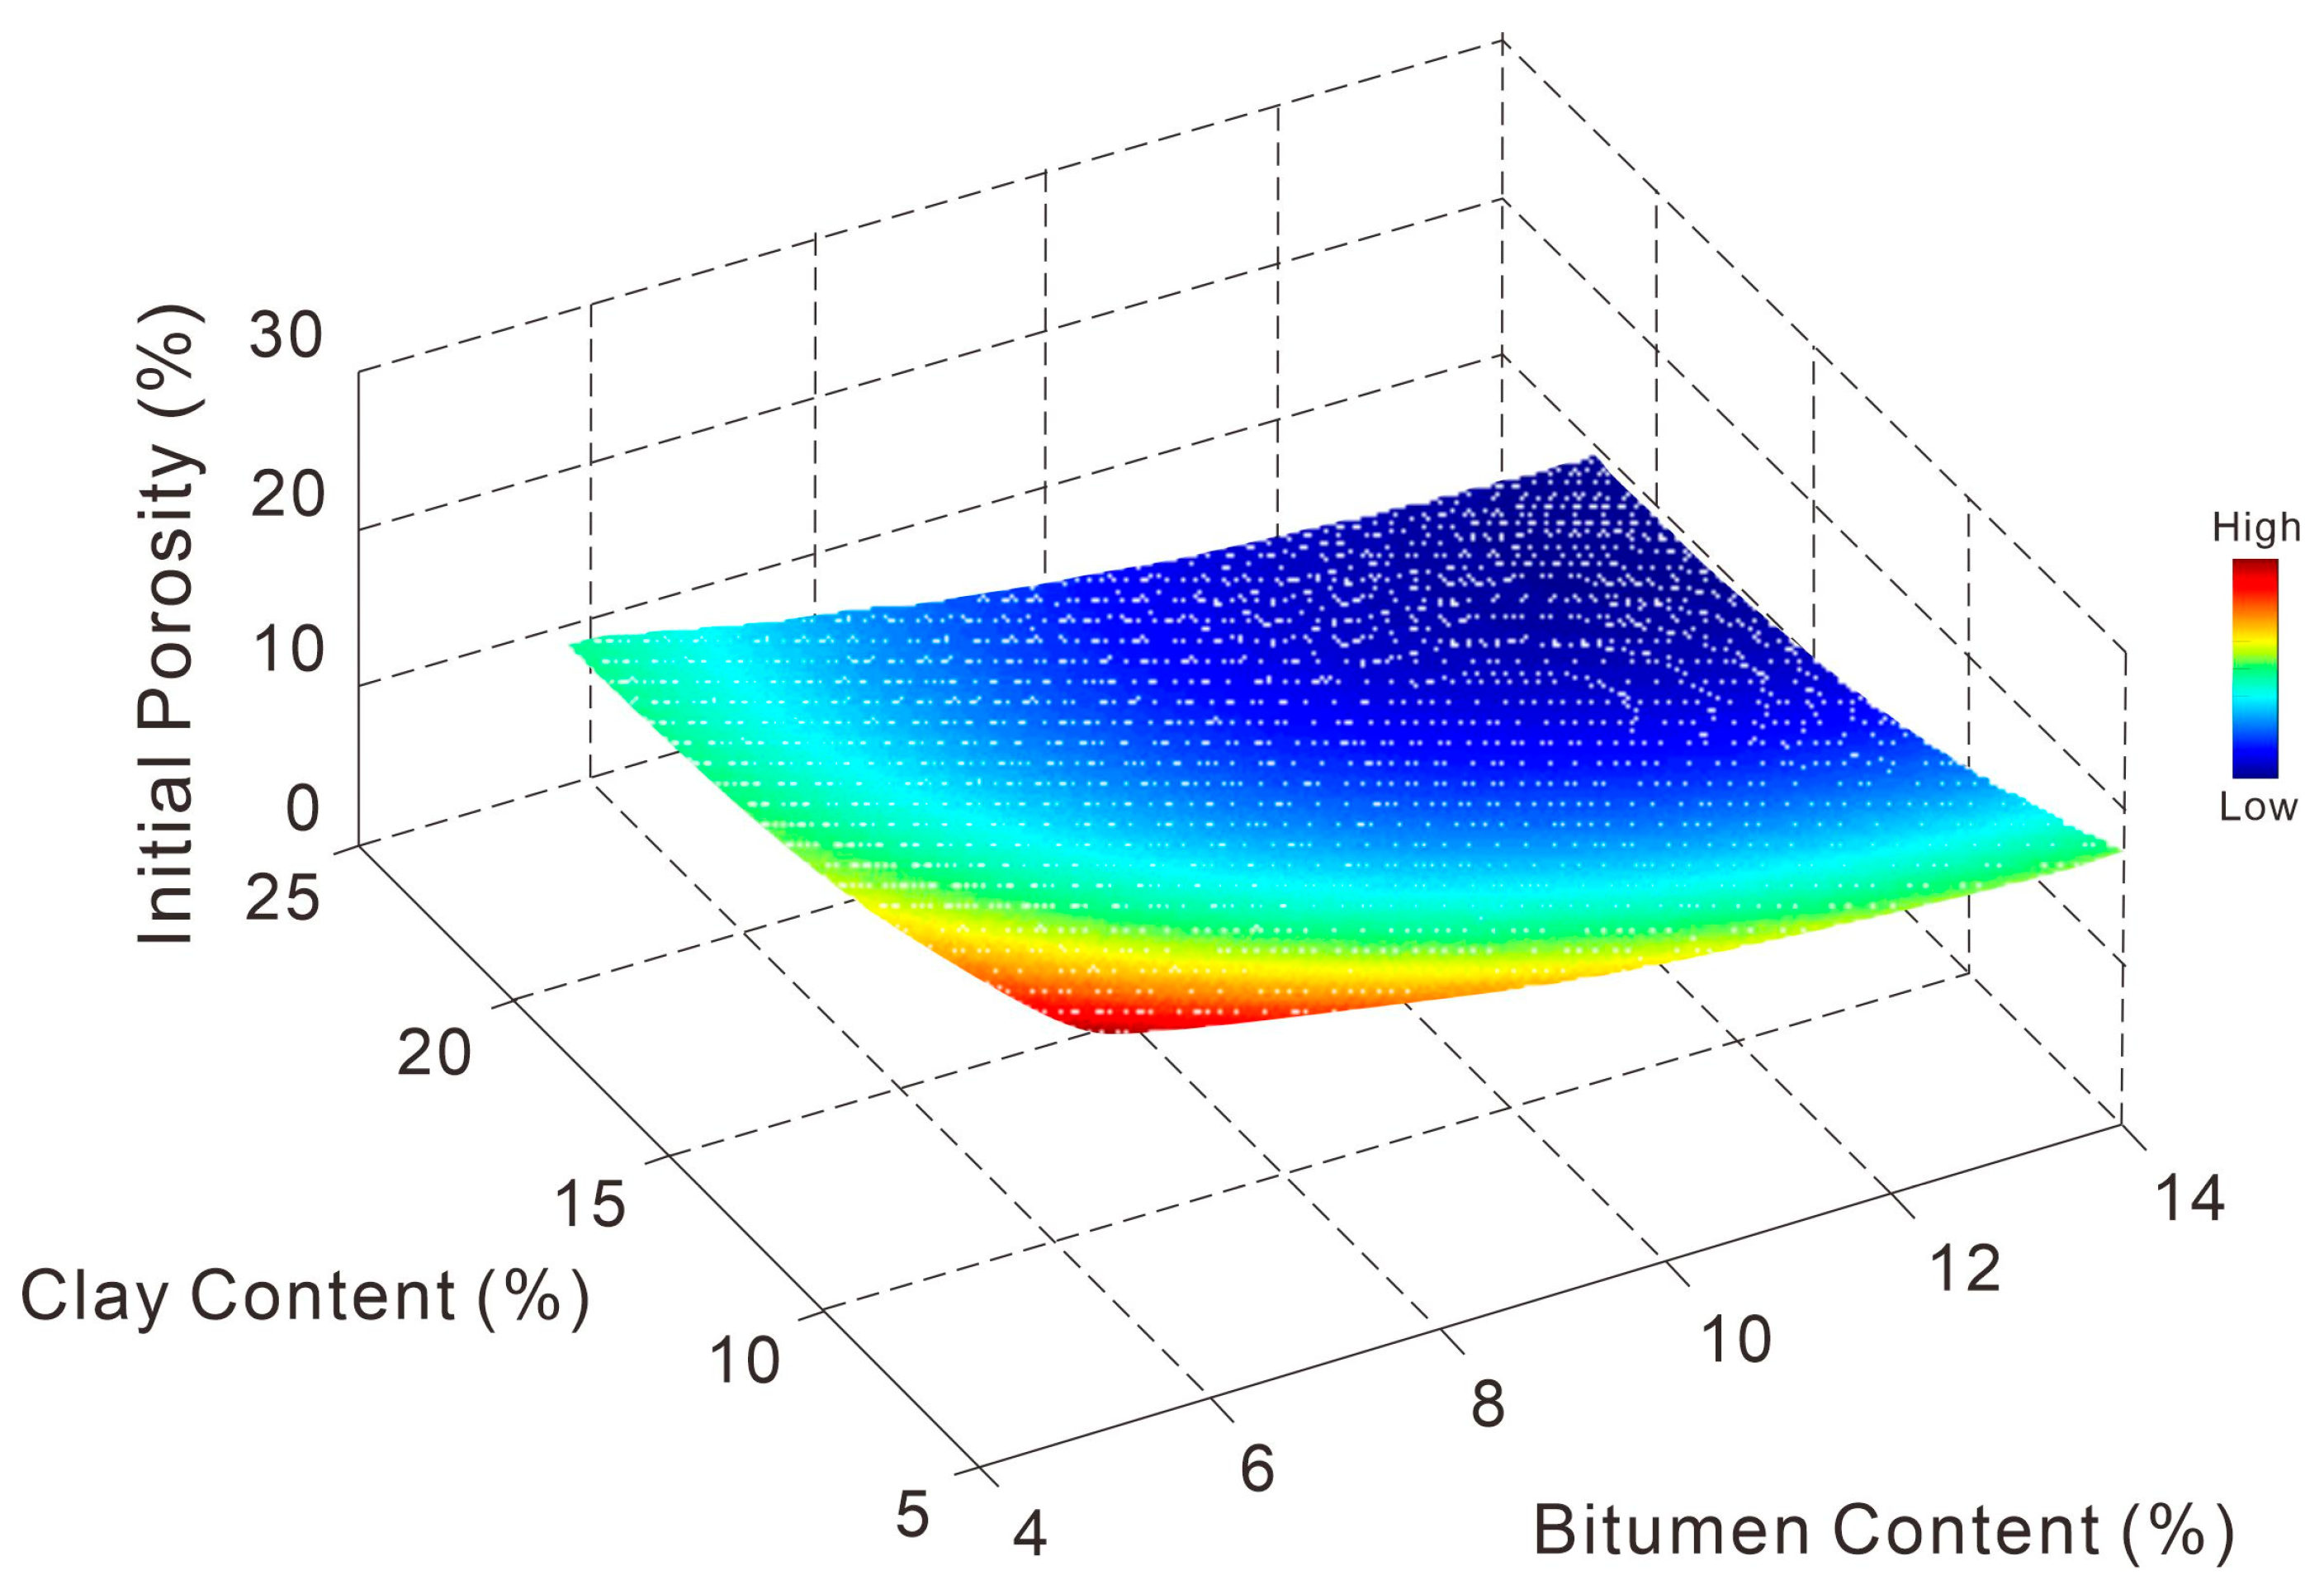
The relationship between asphaltene content, clay content, and initial porosity is graphically presented in Figure 7.

Figure 7.
Correlation between bitumen–clay content and initial porosity.
Figure 7 demonstrates that the initial oil-free porosity ranges between 9% and 22%, decreasing with higher clay or asphaltene content. Specifically, clay-dominated and asphaltene-rich oil sands exhibit initial porosities around 10%, moderately clayey and asphaltic types average 15%, while conventional oil sands reach approximately 20%. These values closely match laboratory-measured samples.
The influence of asphaltene and argillaceous content on permeability is not wholly consistent because the argillaceous is mainly in the form of micron-sized particles, and the size of the blocked pore throat is relatively large. Asphaltenes, on the other hand, exist in the form of molecular or nanoscale aggregates, which can be adsorbed on the surface of minerals or filled with nanoscale pores, which has an impact on the pore space at a smaller scale and has a more significant adverse effect on permeability.
- (3)
- Relationship between asphaltene content, clay content, and initial permeability.
The relationship between asphaltene content, clay content, and initial permeability can be expressed by the following equation:
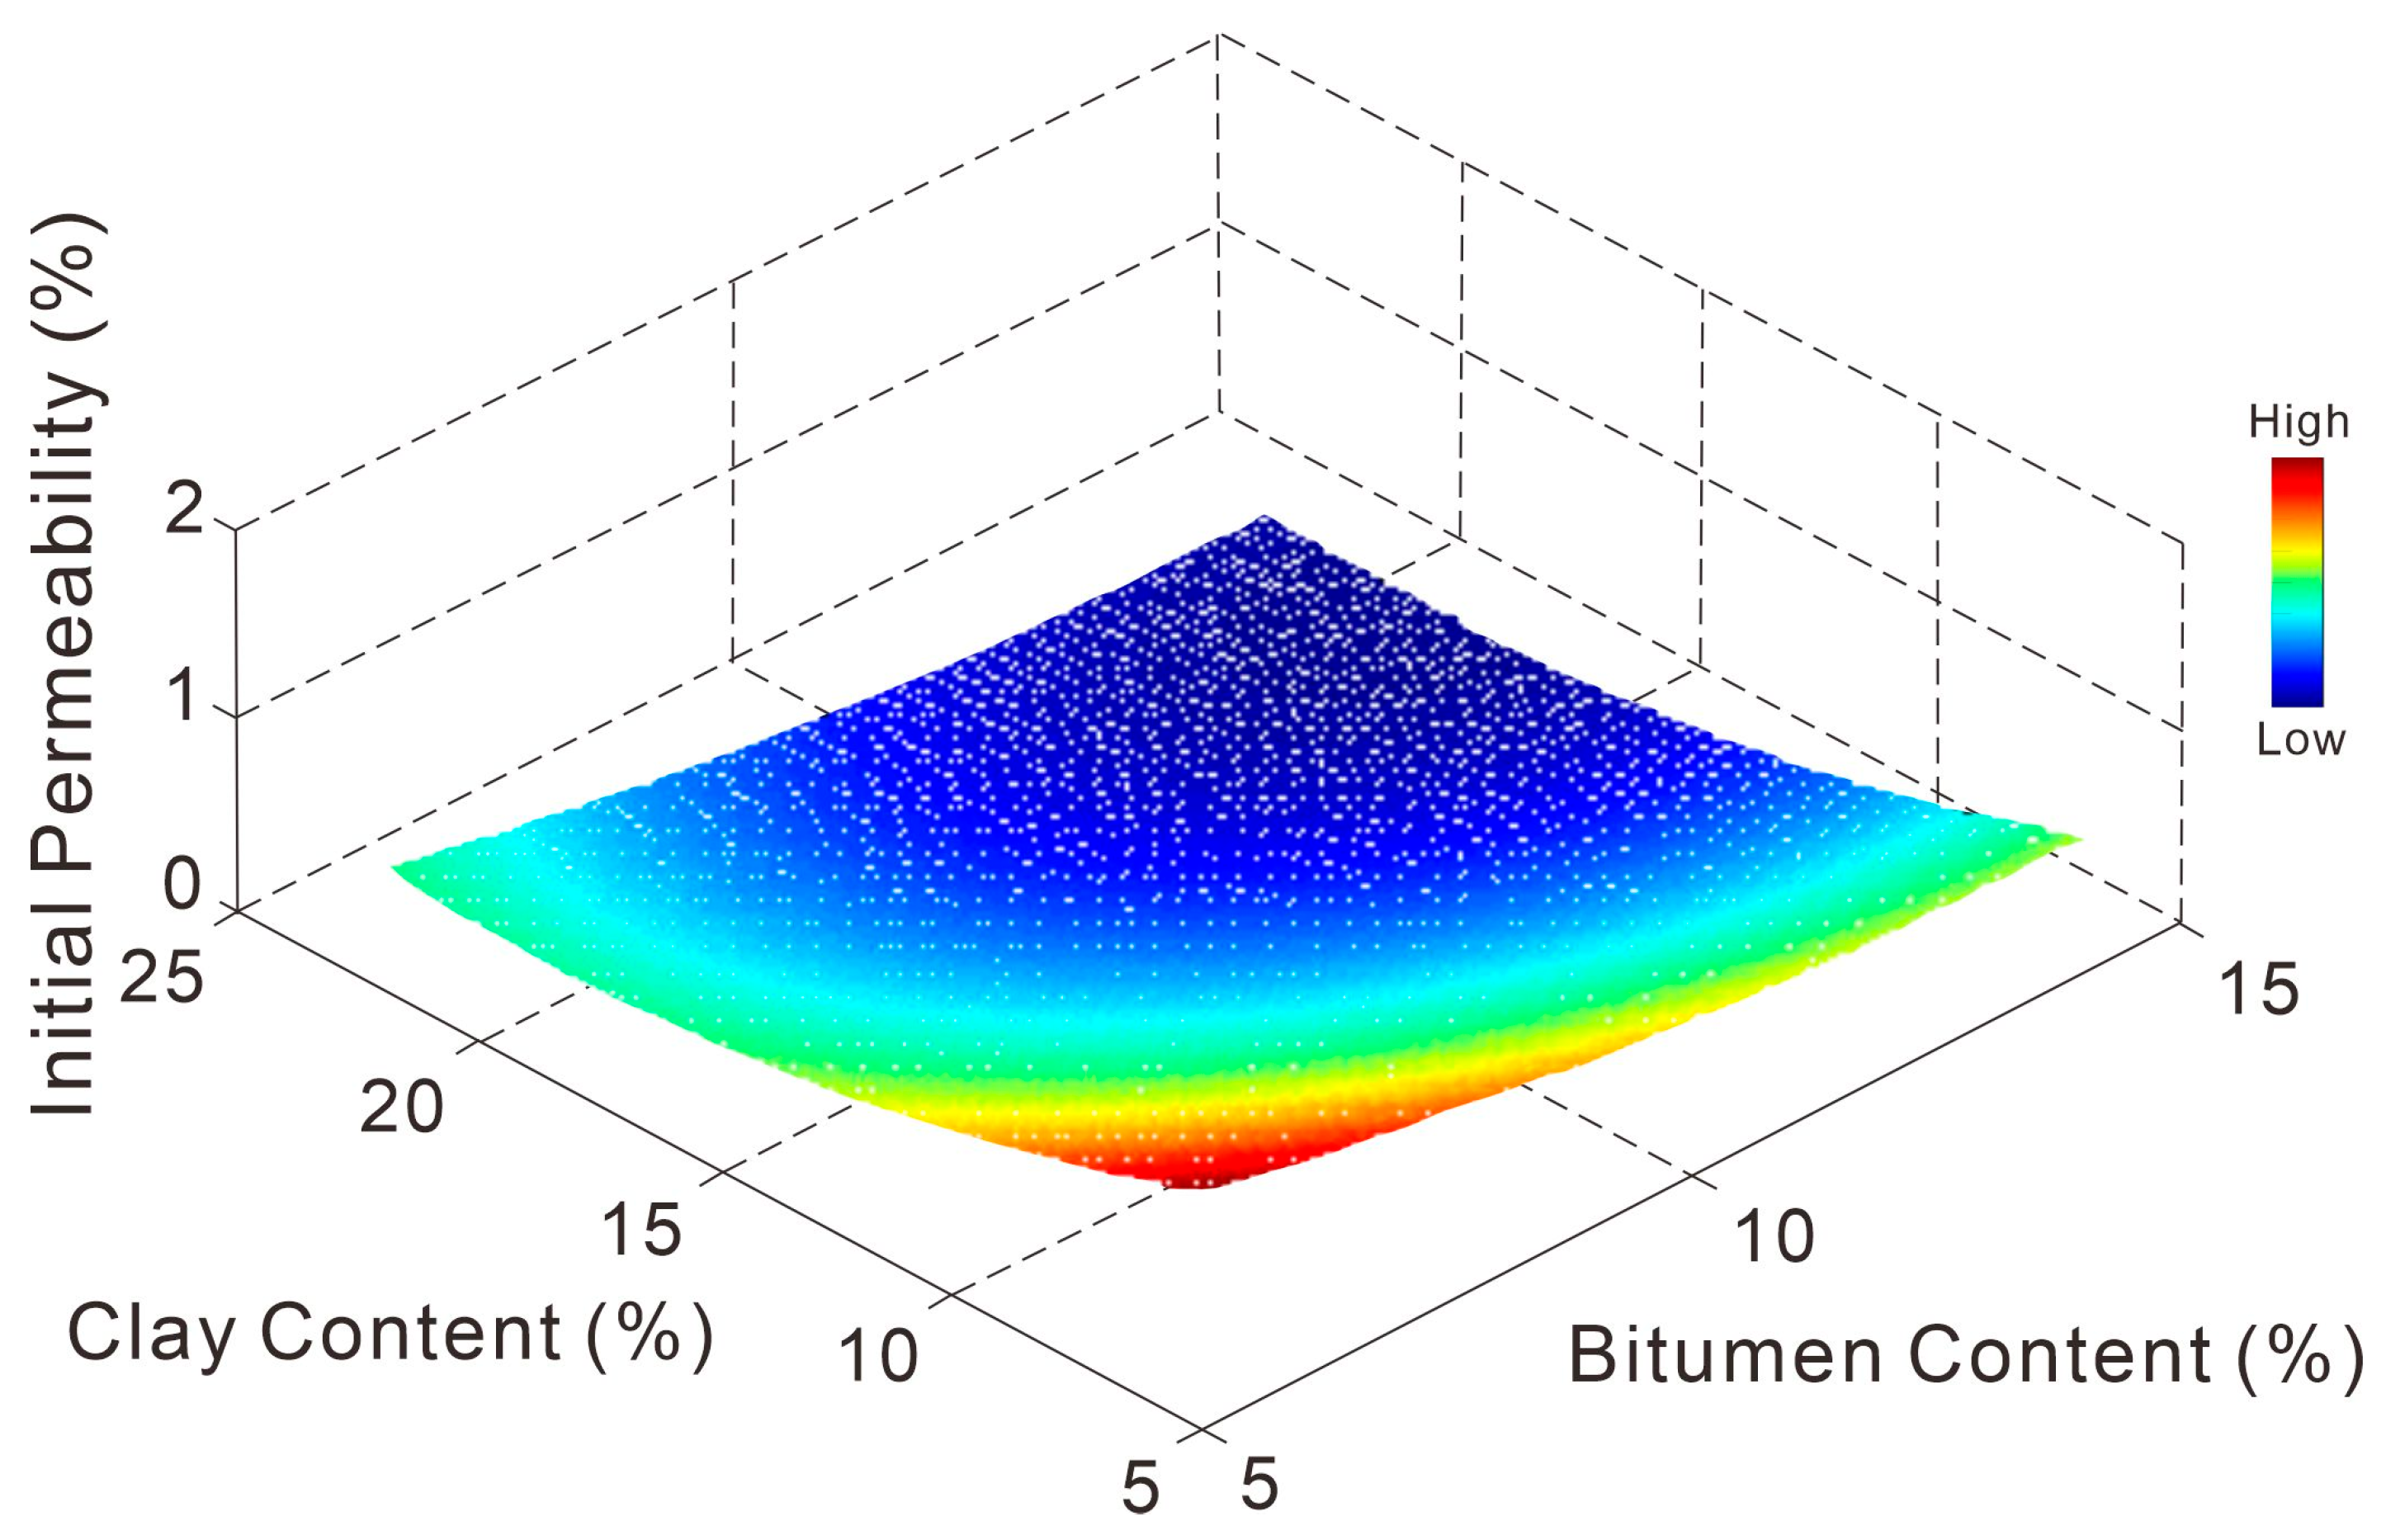
The relationship between asphaltene content, clay content, and initial permeability is graphically represented as follows.
Figure 8 reveals that the initial permeability of oil sands ranges approximately between 0.1 and 1 mD, exhibiting a decreasing trend with higher asphaltene and clay contents, where asphaltene exerts a more pronounced influence. Specifically, asphaltene-rich oil sands show initial permeabilities around 0.3 mD, moderately asphaltic types average 0.6 mD, conventional oil sands approximately 0.5 mD, and clay-dominated oil sands drop to around 0.1 mD—all consistent with laboratory-measured data. Note: All initial permeability values reported here represent water effective permeability.

Figure 8.
Correlation between bitumen-clay content and initial permeability.
Table A2 shows that the influence of asphaltene and argillaceous content on permeability is not entirely consistent because the argillaceous is mainly in micron-sized particles, and the size of the blocked pore throat is relatively large. Asphaltenes, on the other hand, exist in the form of molecular or nanoscale aggregates, which can be adsorbed on the surface of minerals or filled with nanoscale pores, which has an impact on the pore space at a smaller scale and has a more significant negative impact on permeability.
In parameterizing the mechanical model, this study assumes constant values for the dilation angle, cohesion, internal friction angle, and yield stress, considering the influences of asphaltene and clay contents on these parameters to be negligible, and thus excludes them from further discussion.
3.1.2. Case Analysis of Asphaltene and Clay Content Impacts on Stimulation Effectiveness
To investigate the effects of asphaltene and clay contents on stimulation performance, six comparative experimental groups were designed in Table A3.
Validation was conducted using optimized physical model parameters and operational parameters from Well FWH3055 in Block Zhong-18, with the operational parameters detailed in Table A4.
Using the computational methodology from literature [3,15], the experimental results are presented in Table A5.
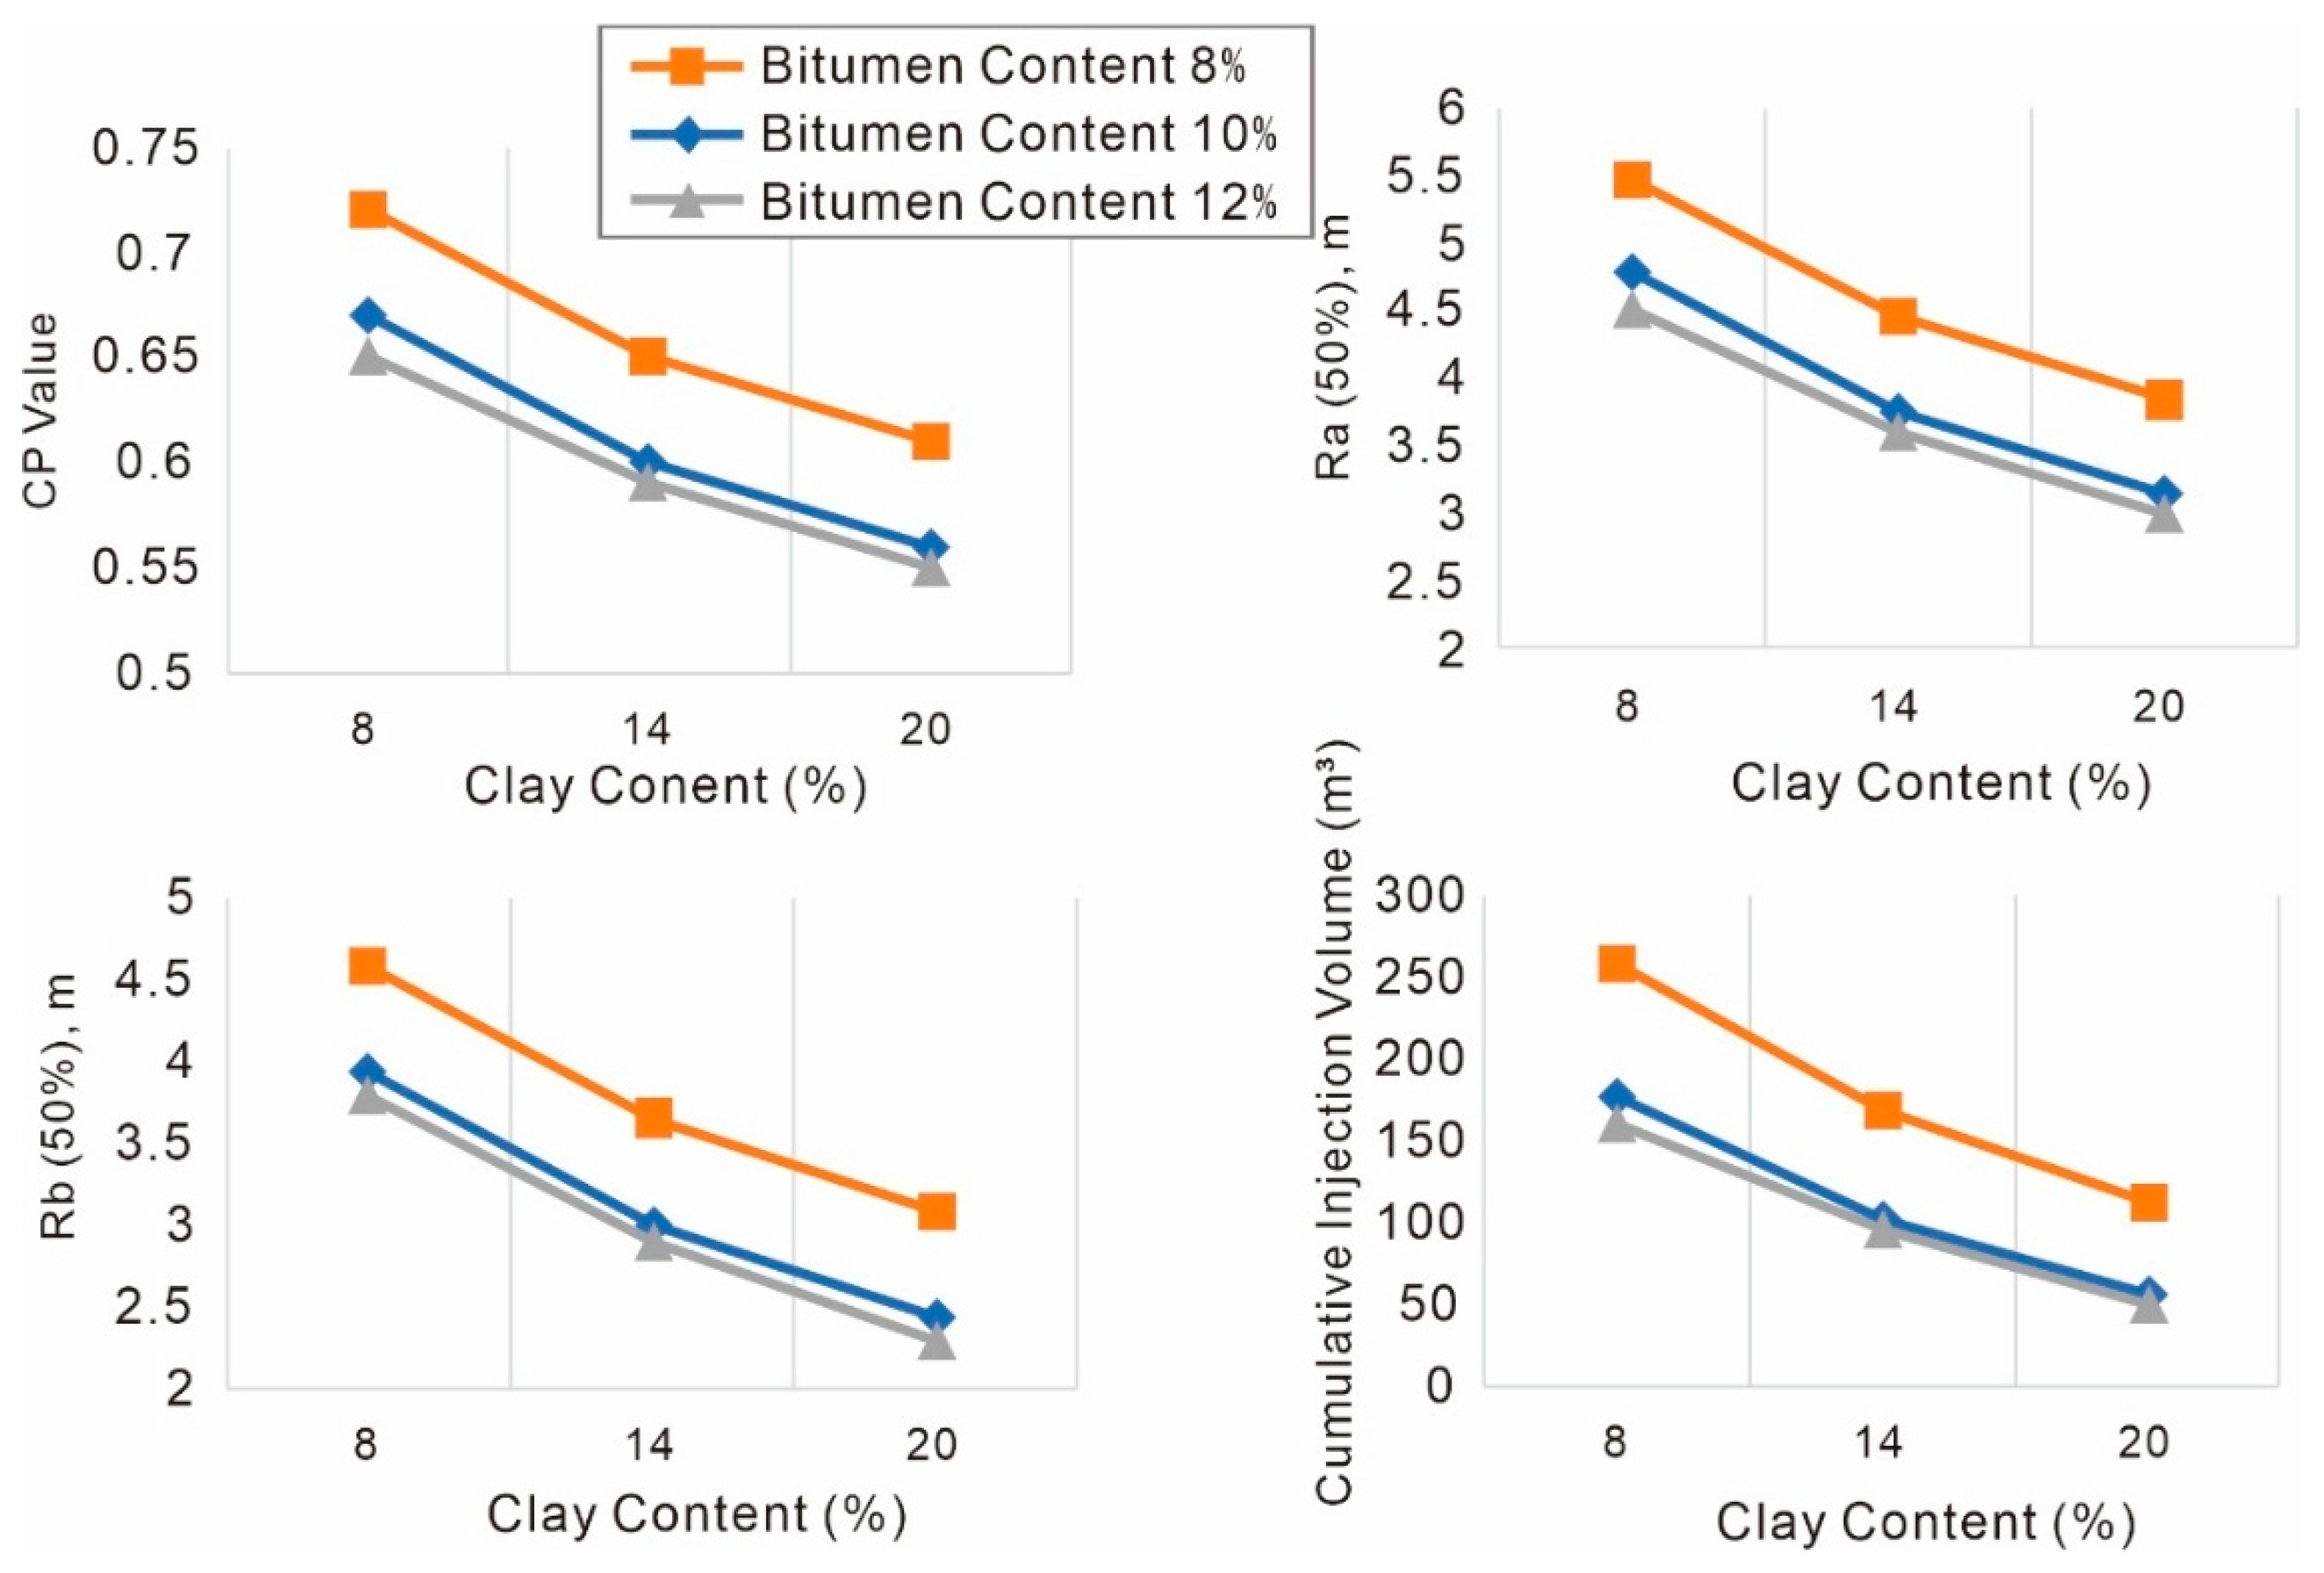
As shown in Figure 9, comparative analysis of Groups 1–3 (or 4–6, or 7–9) demonstrates that under constant asphaltene content, higher clay content correlates with reduced hydraulic connectivity coefficient, stimulated radius, and cumulative injection volume. Simultaneously, at elevated asphaltene levels, the diminishing magnitudes of these parameters become less pronounced. Therefore, the lower argillaceous content in the oil sands reservoir is more likely to produce microfractures, and this theory provides theoretical guidance for field technicians to adopt the development and transformation technology of the reservoir.

Figure 9.
Effects of clay content on dilation effectiveness.
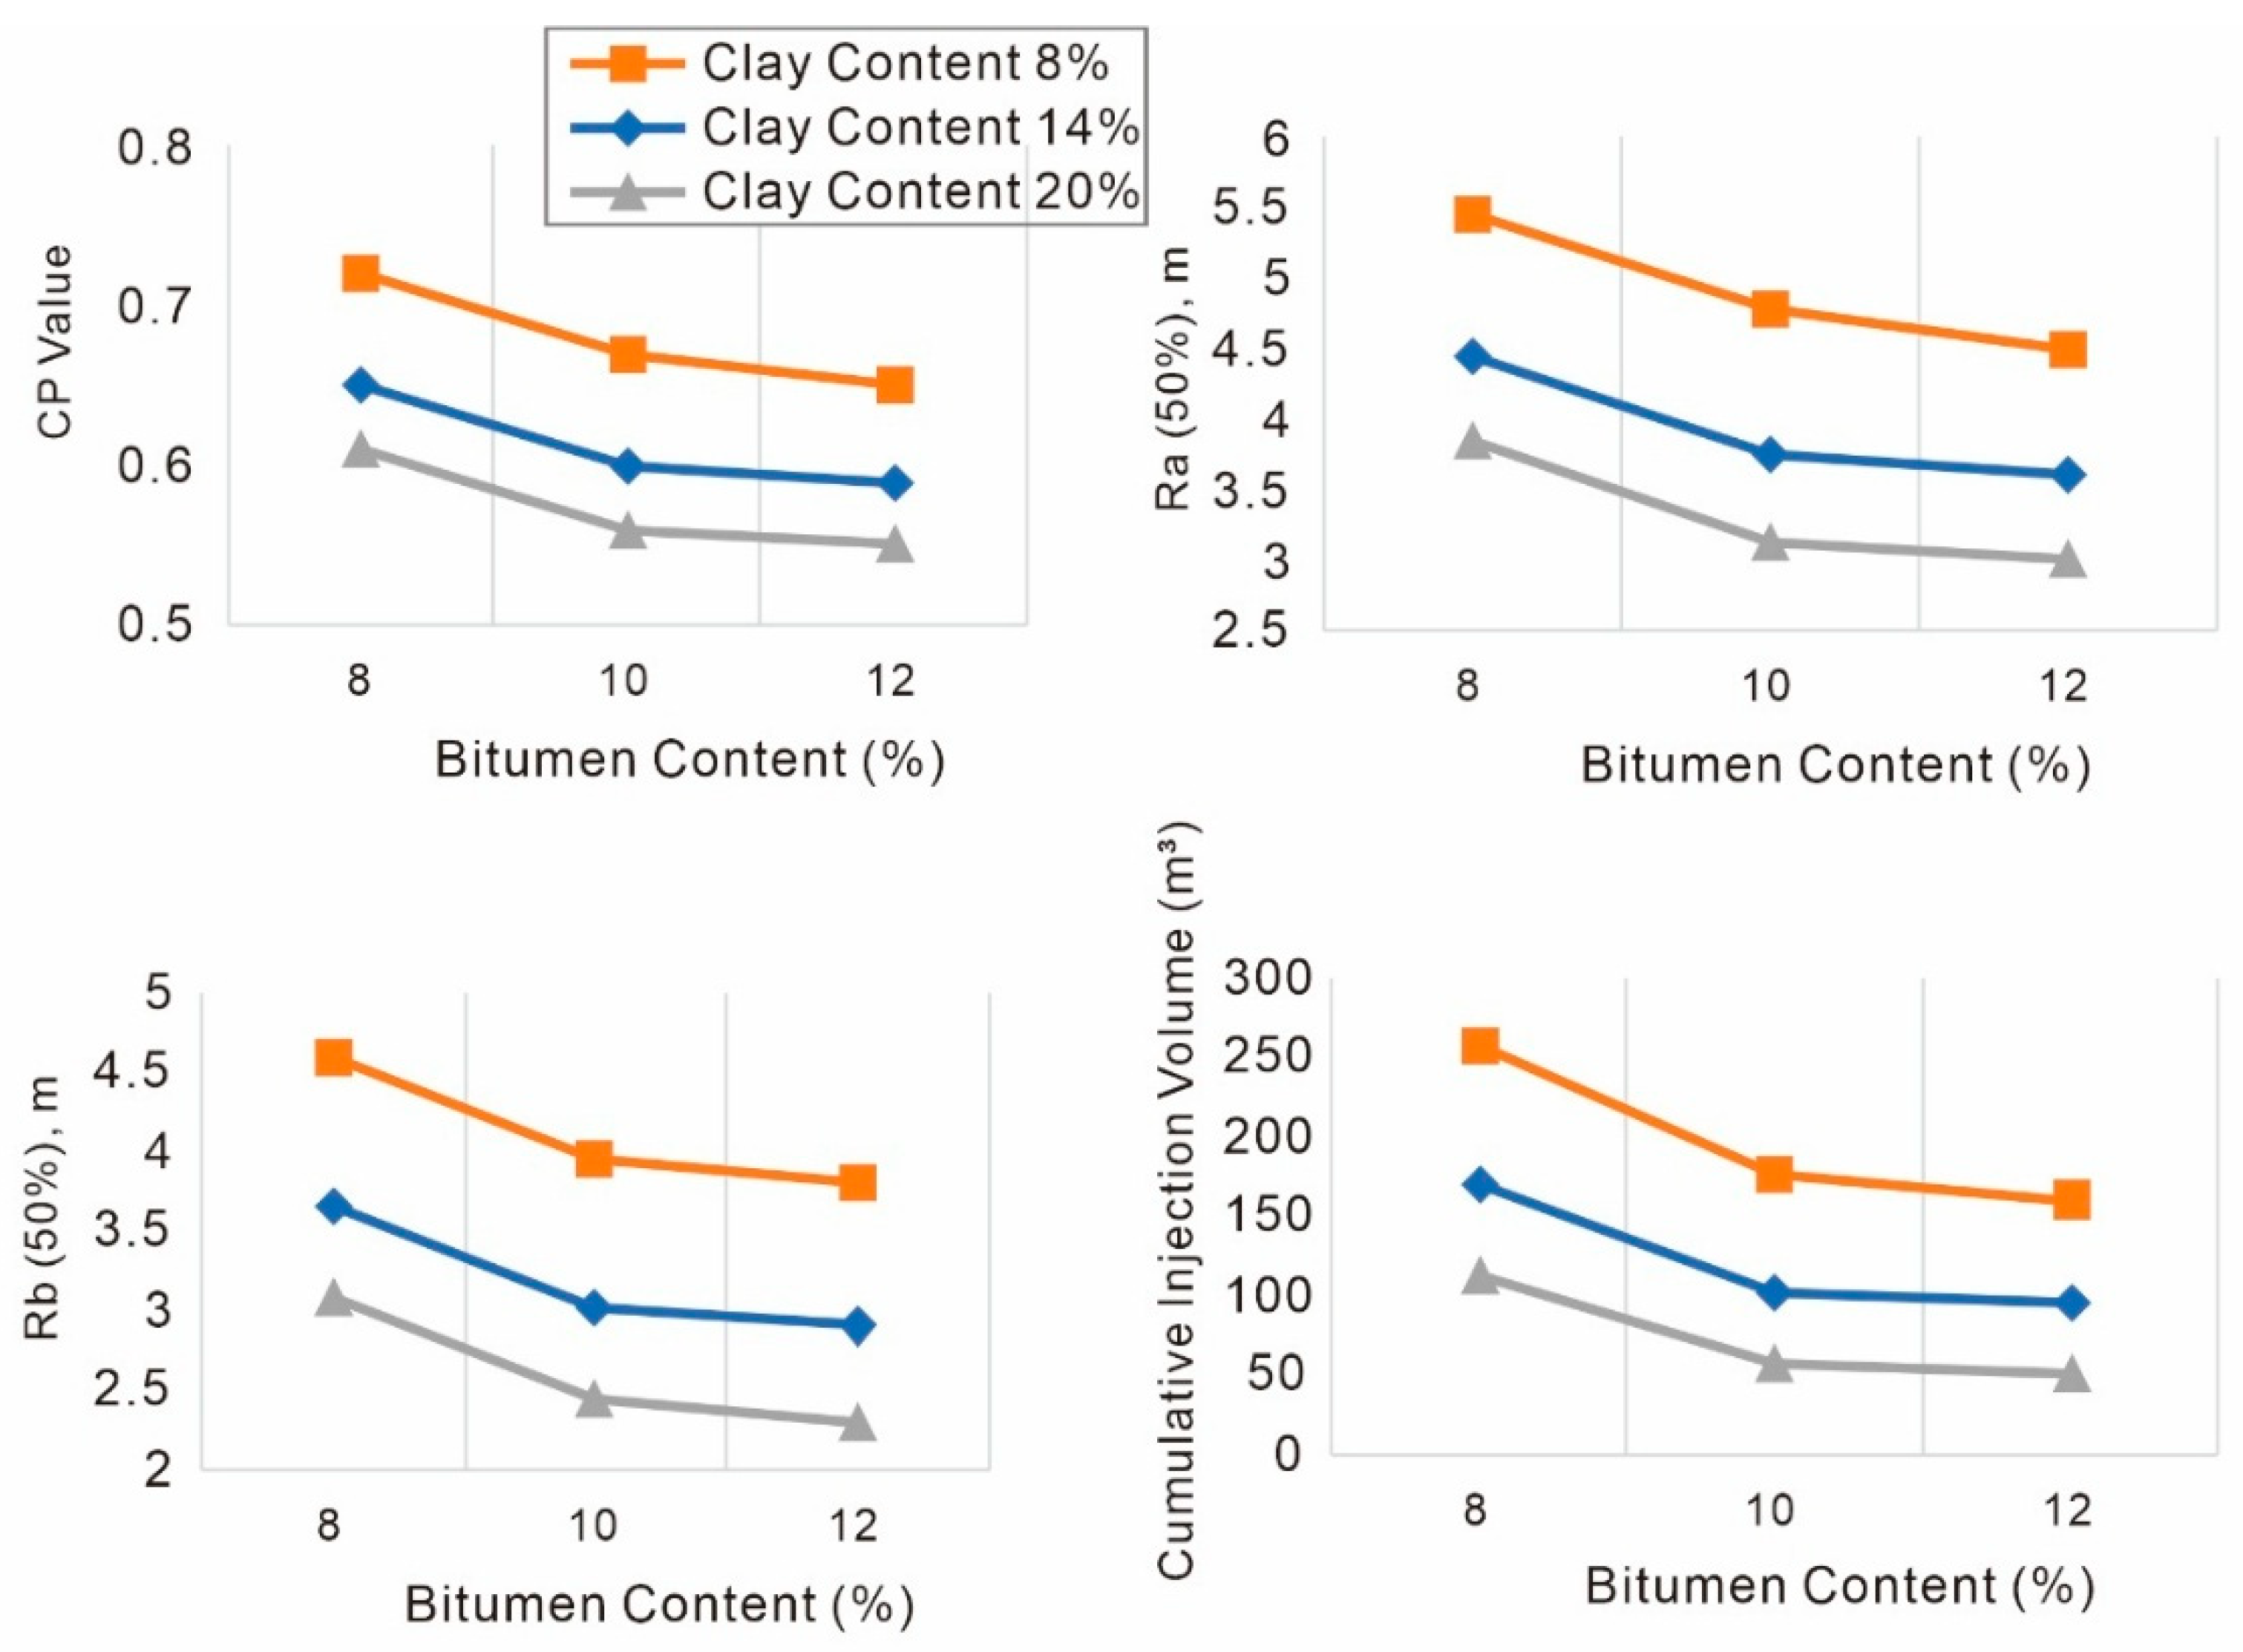
Figure 10 reveals that under constant clay content (comparing Groups 1/4/7, 2/5/8, or 3/6/9), increasing asphaltene content progressively reduces the hydraulic connectivity coefficient, stimulated radius, and cumulative injection volume. Notably, under low clay content conditions, these parameters exhibit more significant variation amplitudes. Therefore, the lower asphaltene content in the oil sands reservoir is more likely to produce micro-fractures, and this theory provides theoretical guidance for field technicians on what kind of development and transformation technology to adopt in the reservoir.

Figure 10.
Effects of bitumen content on dilation performance.
3.2. Effects of Heavy Oil Viscosity
The heavy oil in the Fengcheng Oilfield exhibits exceptionally high viscosity, exceeding 106 mPa·s at reservoir temperature, with partial blocks showing no mobility below 50–90 °C. At 50 °C; the surface degassed oil viscosity ranges between 10,000 and 500,000 mPa·s, averaging approximately 50,000 mPa·s. The oil demonstrates strong thermo-viscous sensitivity, with viscosity decreasing by around 50–70% per 10 °C temperature increases. As a key fluid property, heavy oil viscosity influences both geomechanical and flow models. To investigate its impact on stimulation effectiveness, we first analyze viscosity-dependent variations in controllable rock parameters, then incorporate these parameter sets into established models for simulation evaluation.
Given the pronounced thermal sensitivity of Fengcheng’s heavy oil and temperature’s significant influence on reservoir rock parameters, temperature is adopted as an intermediate variable to correlate heavy oil viscosity with other controllable rock parameters. Note: This analysis focuses on conventional oil sands within the temperature range of 30–250 °C (303–523 K).
3.2.1. Temperature–Viscosity Curve of Heavy Oil
Literature indicates that the temperature–viscosity profiles of most heavy oils conform well to the Arrhenius equation, with viscosity calculated as follows [7]:
Taking the logarithm of both sides yields
In the above equations —viscosity, mPa·s; , —constants; R—universal gas constant; T—absolute temperature, K; —activation energy, J/mol; and , —constants.
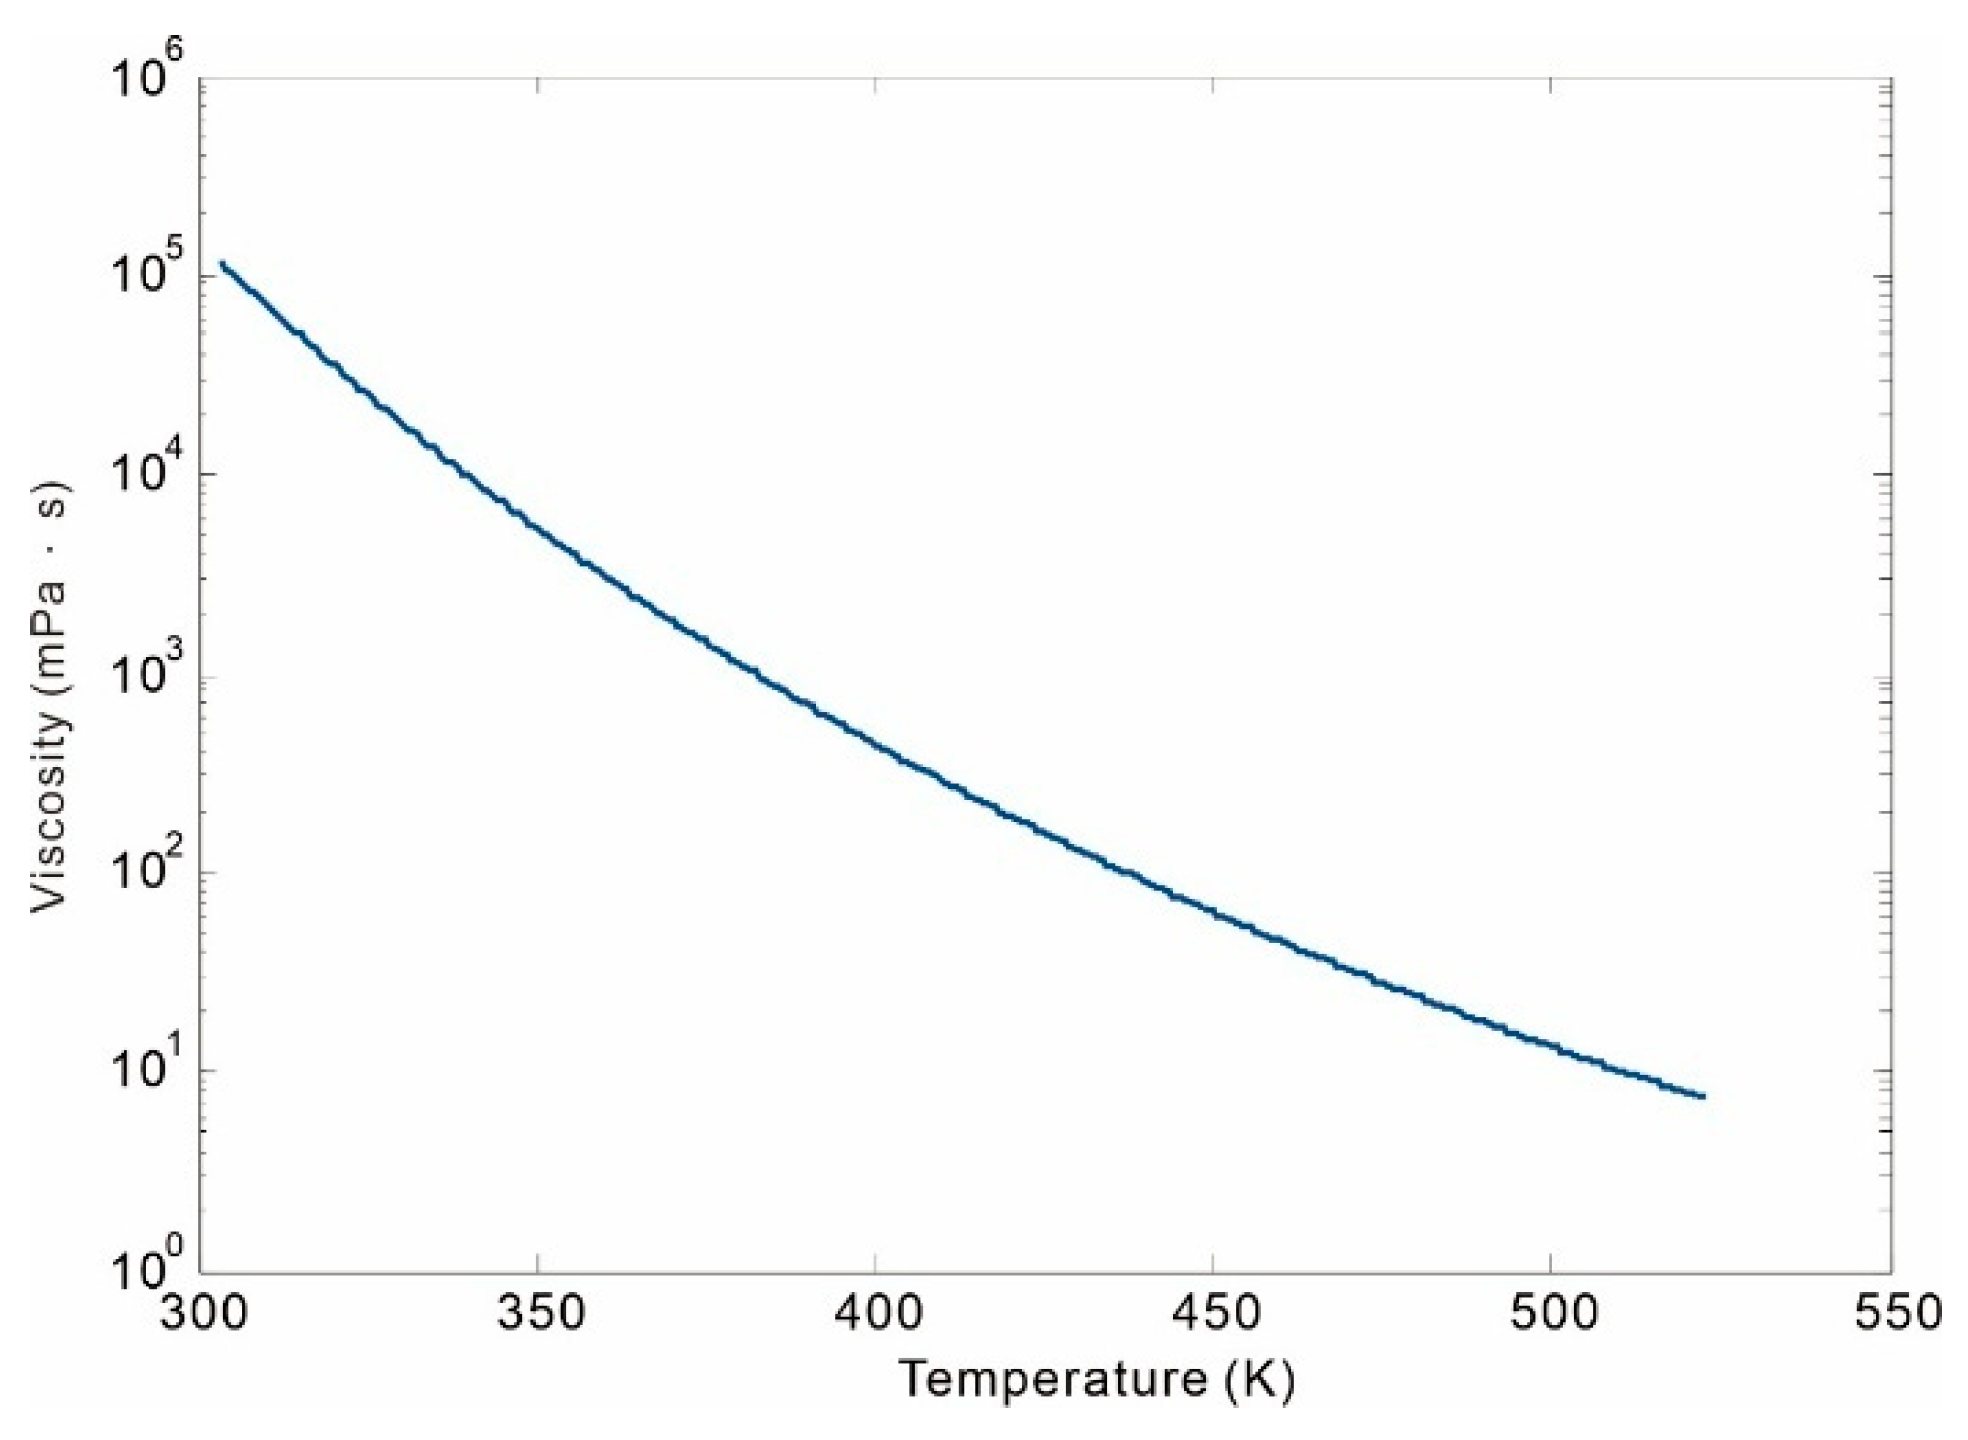
Existing literature and experimental data indicate a viscosity of 30,000 mPa·s at 50 °C (323 K) and 29 mPa·s at 200 °C (473 K). Thus, selecting two experimental points (, ) as (3.3673, ) and (10.3190, ), the heavy oil’s temperature–viscosity curve is derived as follows:
The graphical representation is shown in Figure 11.

Figure 11.
Viscosity–temperature curve.
To verify the reliability of the viscosity–temperature curve, two test points were selected and calculated using the above equation. When the temperature was 100 °C (373 K), the viscosity was 1596 mPa·s; when the temperature was 150 °C (423 K), the viscosity was 172 mPa·s. Both results showed good agreement with the actual viscosity values (approximately 1000 mPa·s and 100 mPa·s, respectively). The lower the viscosity of the oil sands, the stronger the fluid fluidity, which is more conducive to oil extraction. Therefore, high temperature conditions are more conducive to the development of heavy oil reservoirs.
3.2.2. The Temperature Sensitivity of Rock Mechanical Parameters
The literature review indicates that rock mechanical parameters exhibit significant temperature-dependent variations for rocks such as marble, granite, and coarse-grained sandstone. However, for unconsolidated oil sands, the temperature sensitivity of their mechanical properties is notably more pronounced.
(1) Relationship between elastic modulus and temperature
Under otherwise constant conditions, the elastic modulus of rocks exhibits a negative correlation with temperature. This relationship is typically expressed in the literature as follows [7,9,24]:
where E is the elastic modulus (MPa); T is the ambient temperature (°C); and a and b are material constants related to rock type, with units of MPa and MPa/°C, respectively.
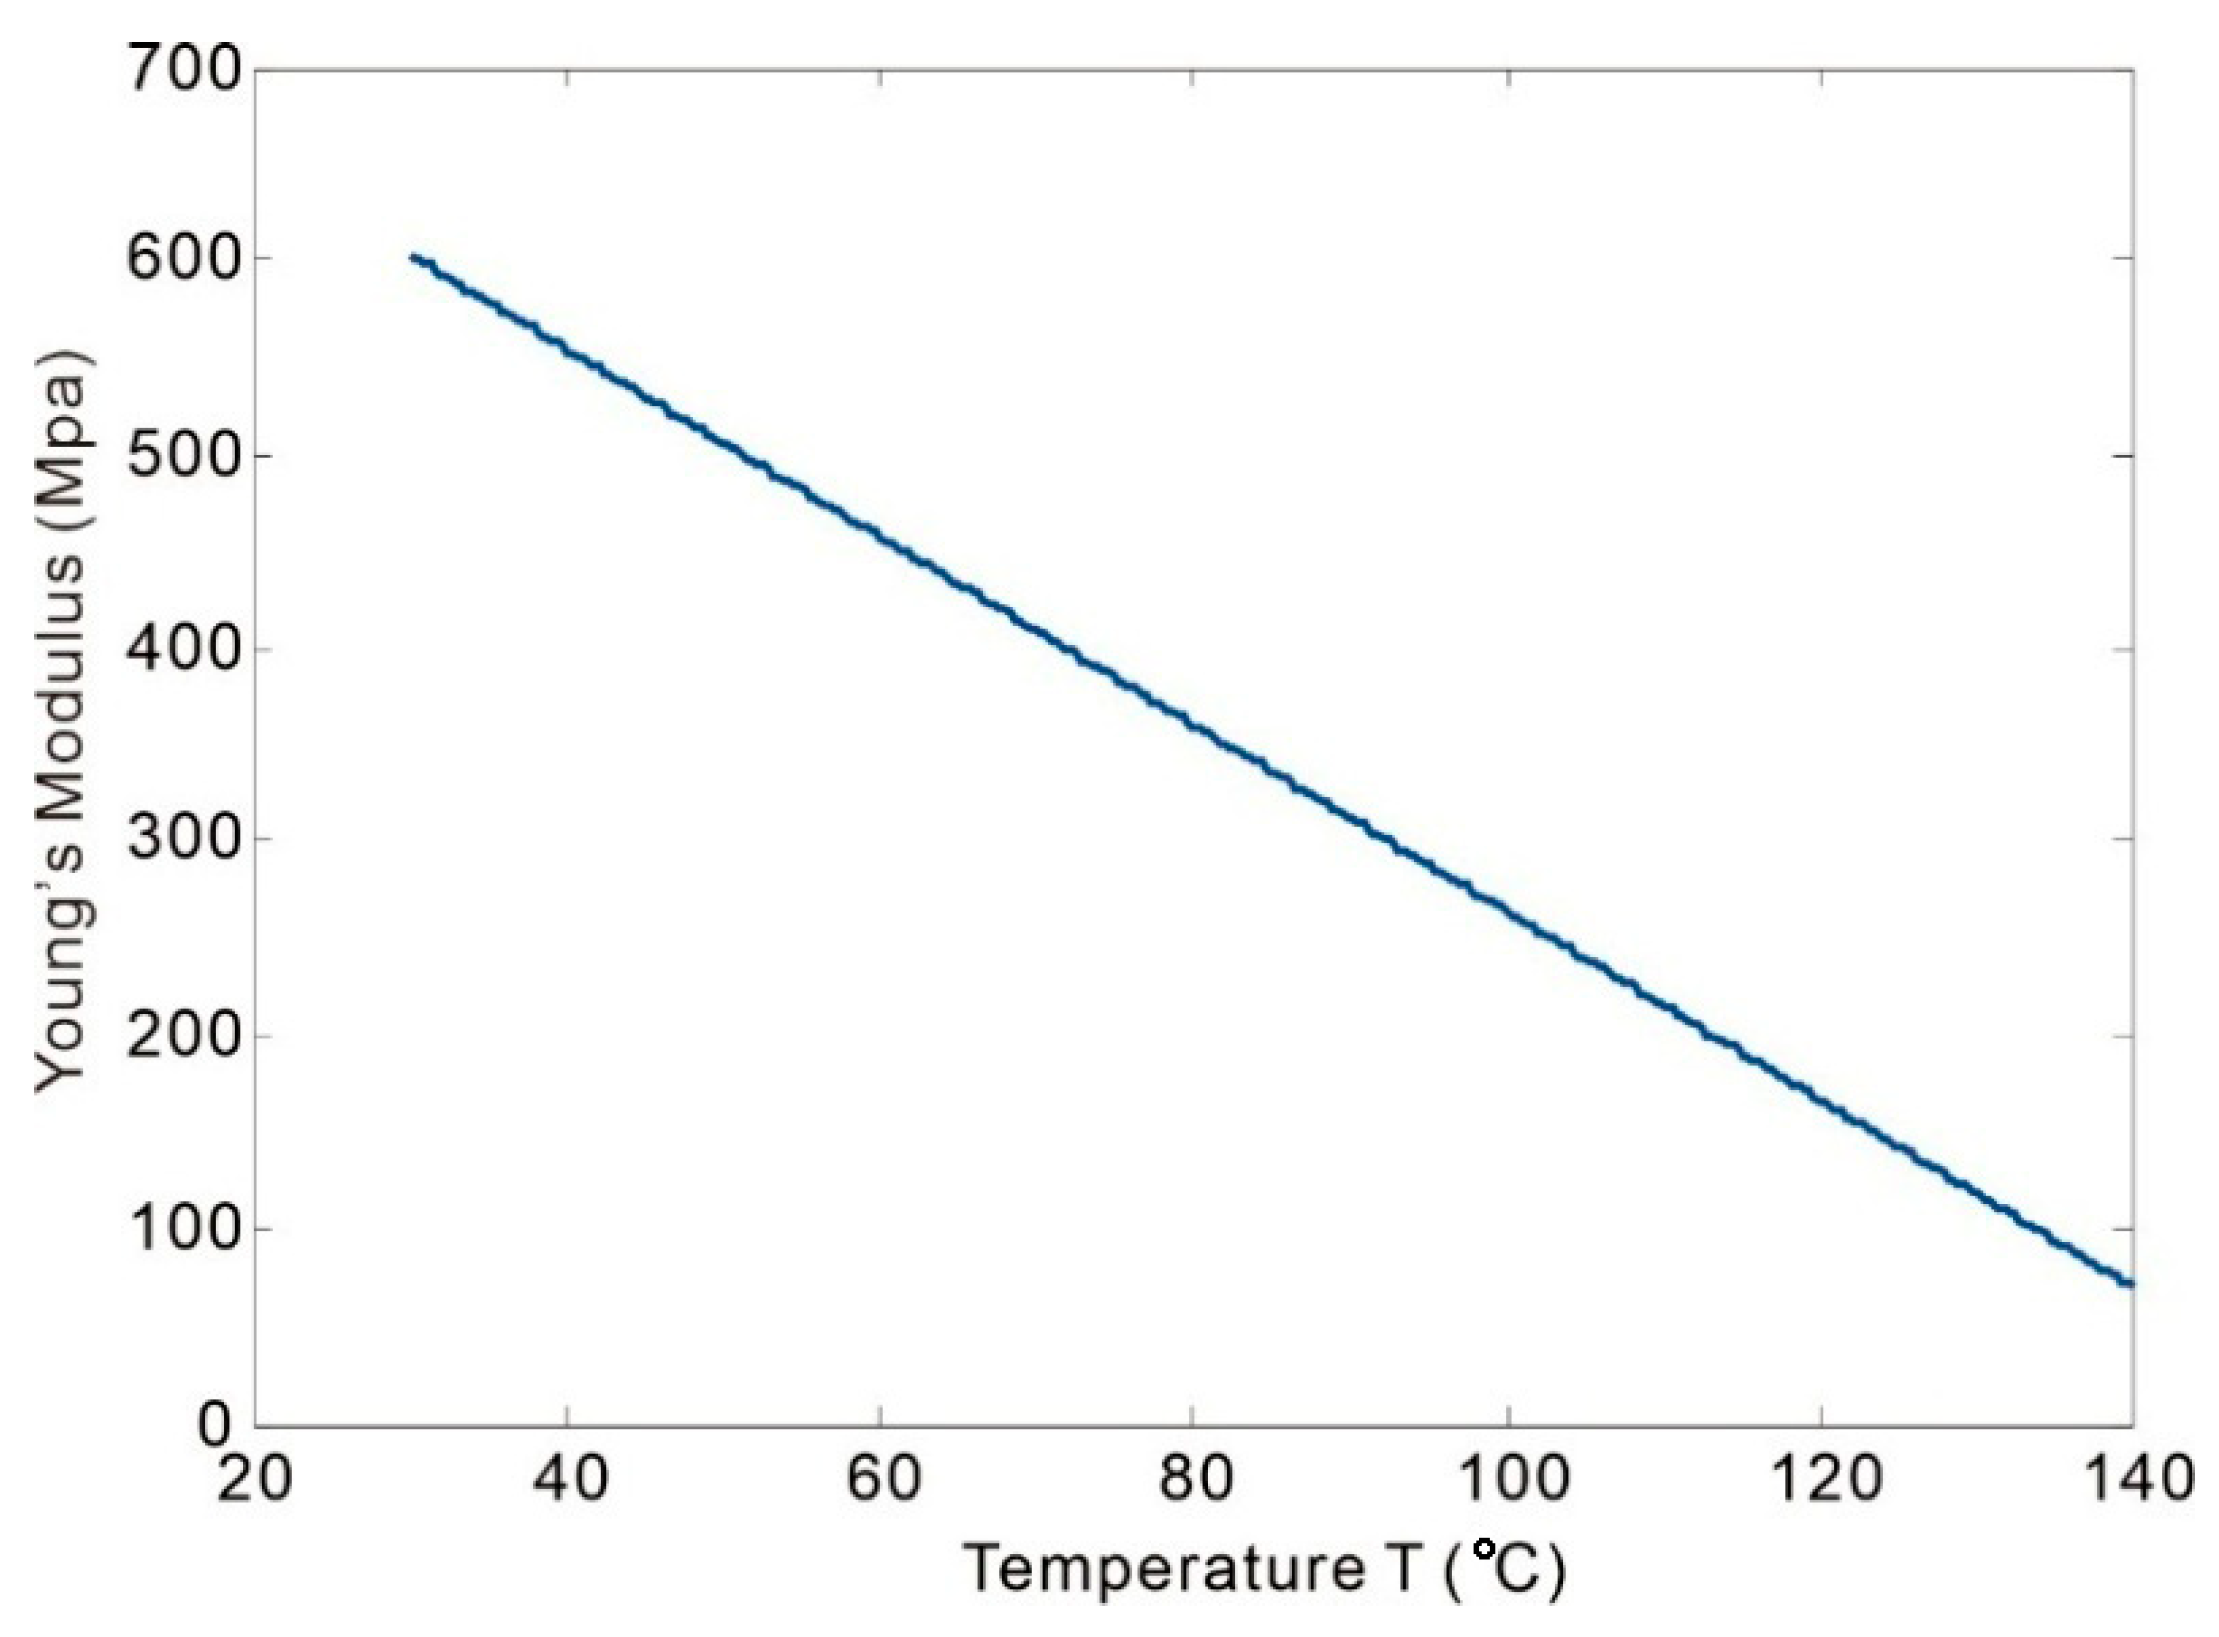
By selecting two experimental data points (E, T) of (652, 20) and (168, 120), the derived relationship is expressed as
The curve is expressed as shown in Figure 12.

Figure 12.
Correlation between temperature and Young’s modulus.
When the temperature is 75 °C, the elastic modulus is 386 MPa, showing good agreement with the actual measured value (421 MPa). At high temperatures, the stiffness of the oil sands is smaller, and plastic deformation is more likely to occur, so a large deformation will occur.
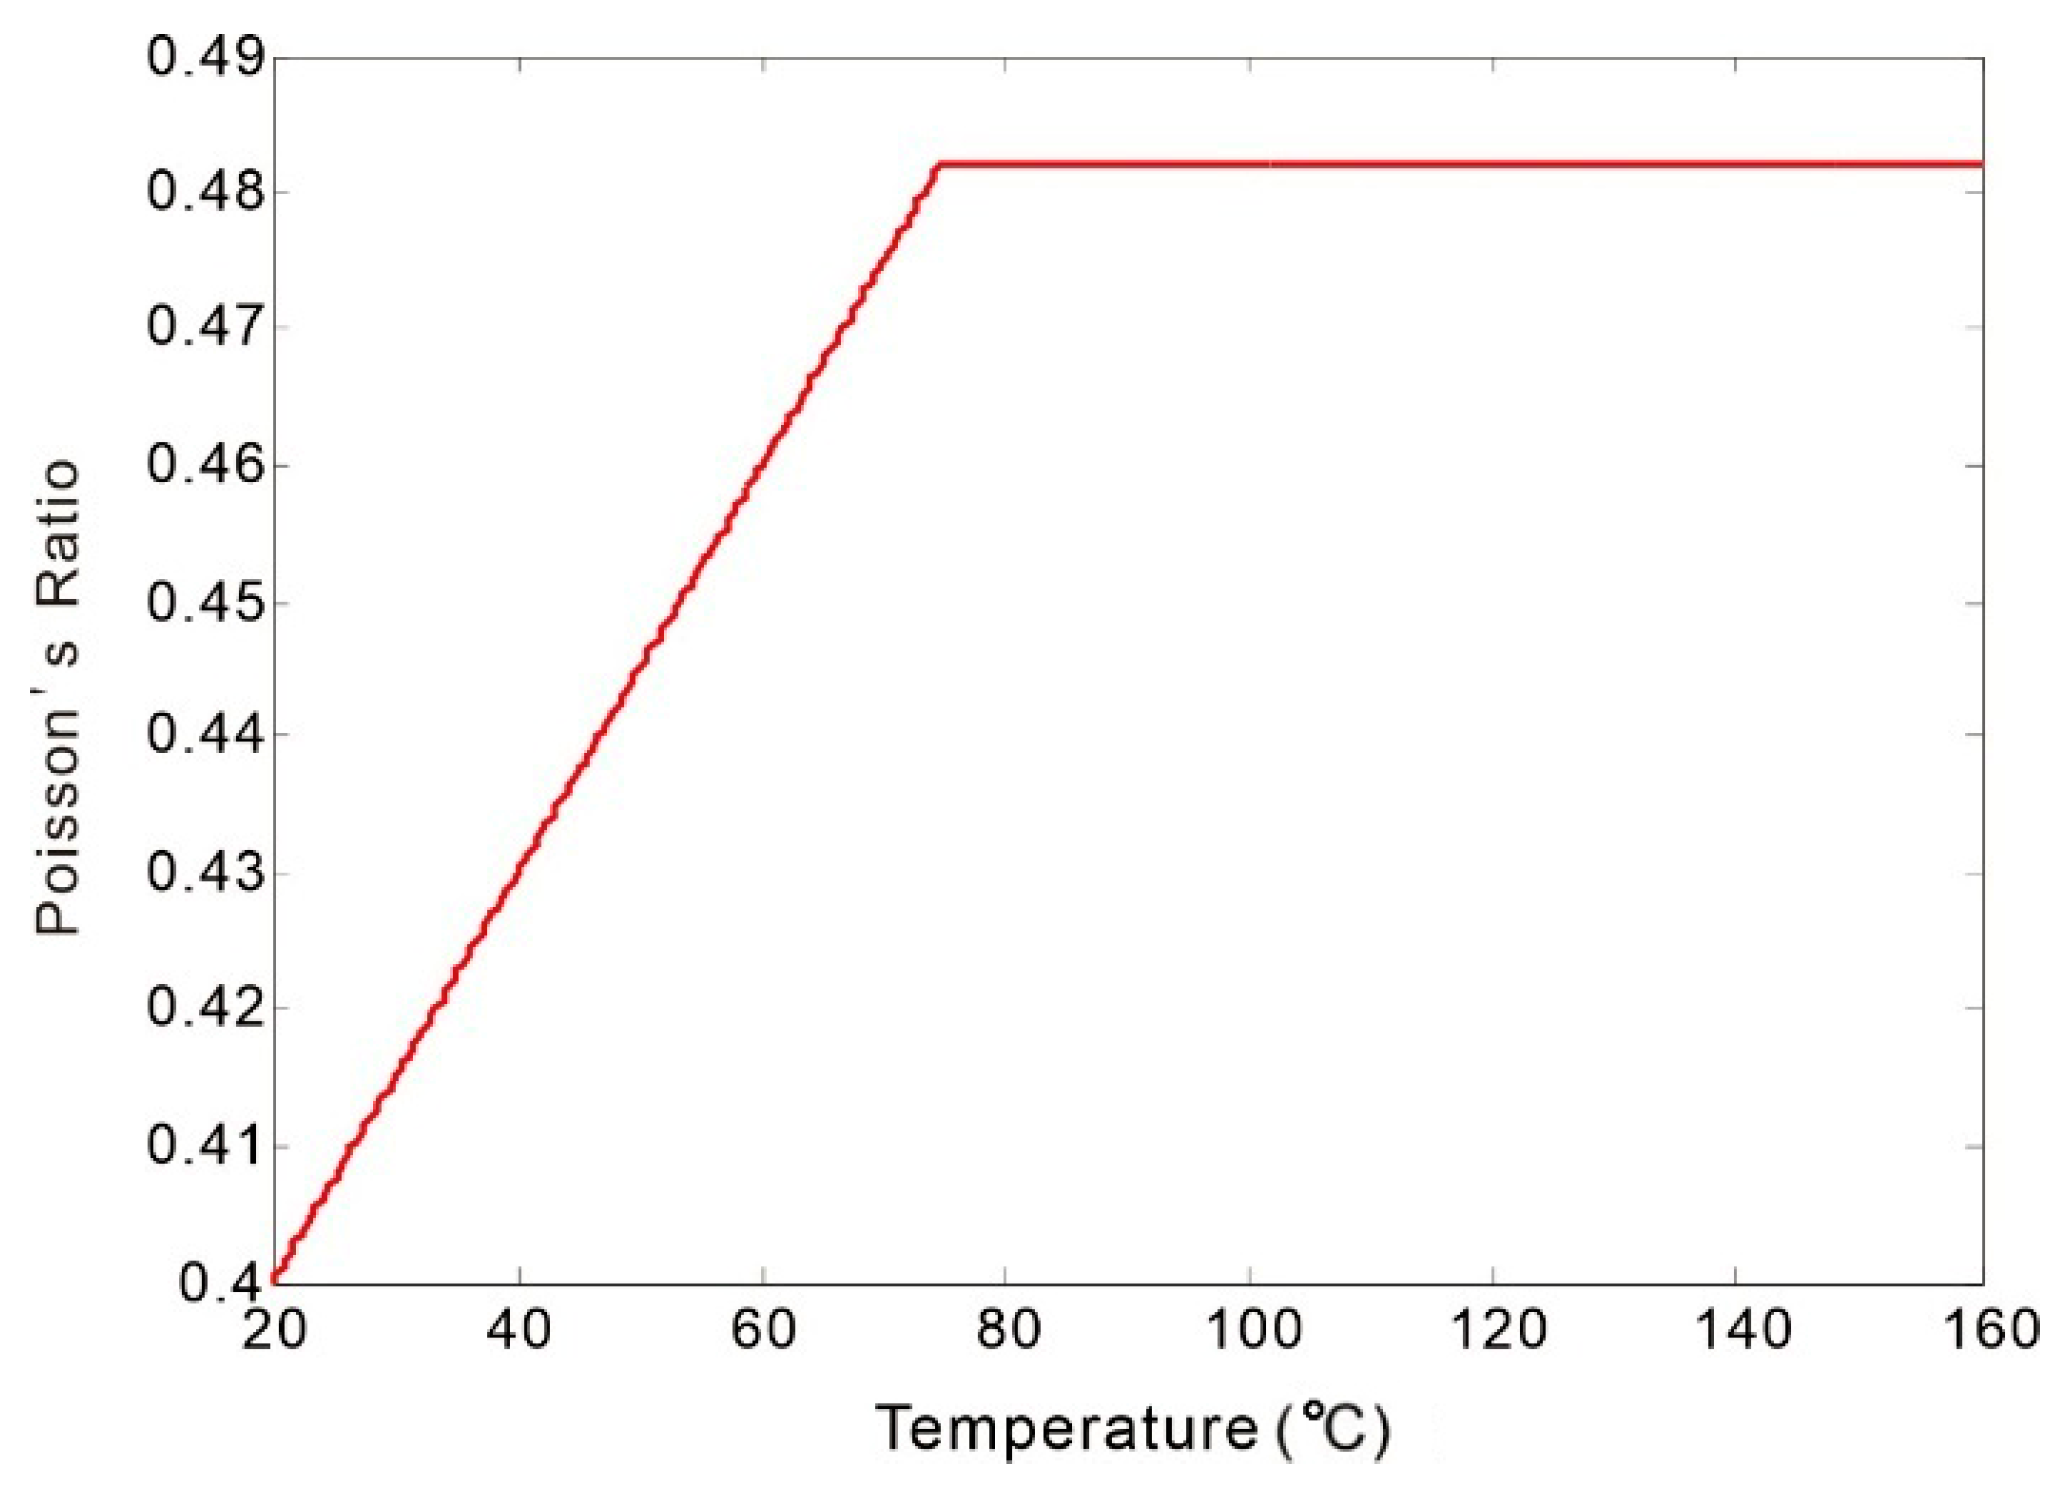
(2) Correlation between Poisson’s ratio and temperature
For a given rock material, there exists a critical temperature. Below this threshold, Poisson’s ratio increases with temperature; above it, Poisson’s ratio remains essentially constant [25]. The critical temperature for oil sands is approximately 75 °C, comparable to that of granite and other rocks. The Poisson’s ratio of oil sands can reach around 0.48, significantly higher than that of granite (0.3). In this study, the Poisson’s ratio at ambient temperature (20 °C) is set at approximately 0.4. Consequently, below the critical temperature, the ratio increases by an average of 0.0015 per degree Celsius, expressed functionally as
The curve is expressed as shown in Figure 13.

Figure 13.
Correlation between temperature and Poisson’s ratio.
According to the temperature and Poisson’s ratio curve, it is found that the Poisson’s ratio becomes larger under high temperature conditions, which means that the oil sands are more inclined to transverse deformation when stressed. Therefore, the transverse shrinkage or expansion of the oil sands is more significant under the same axial load.
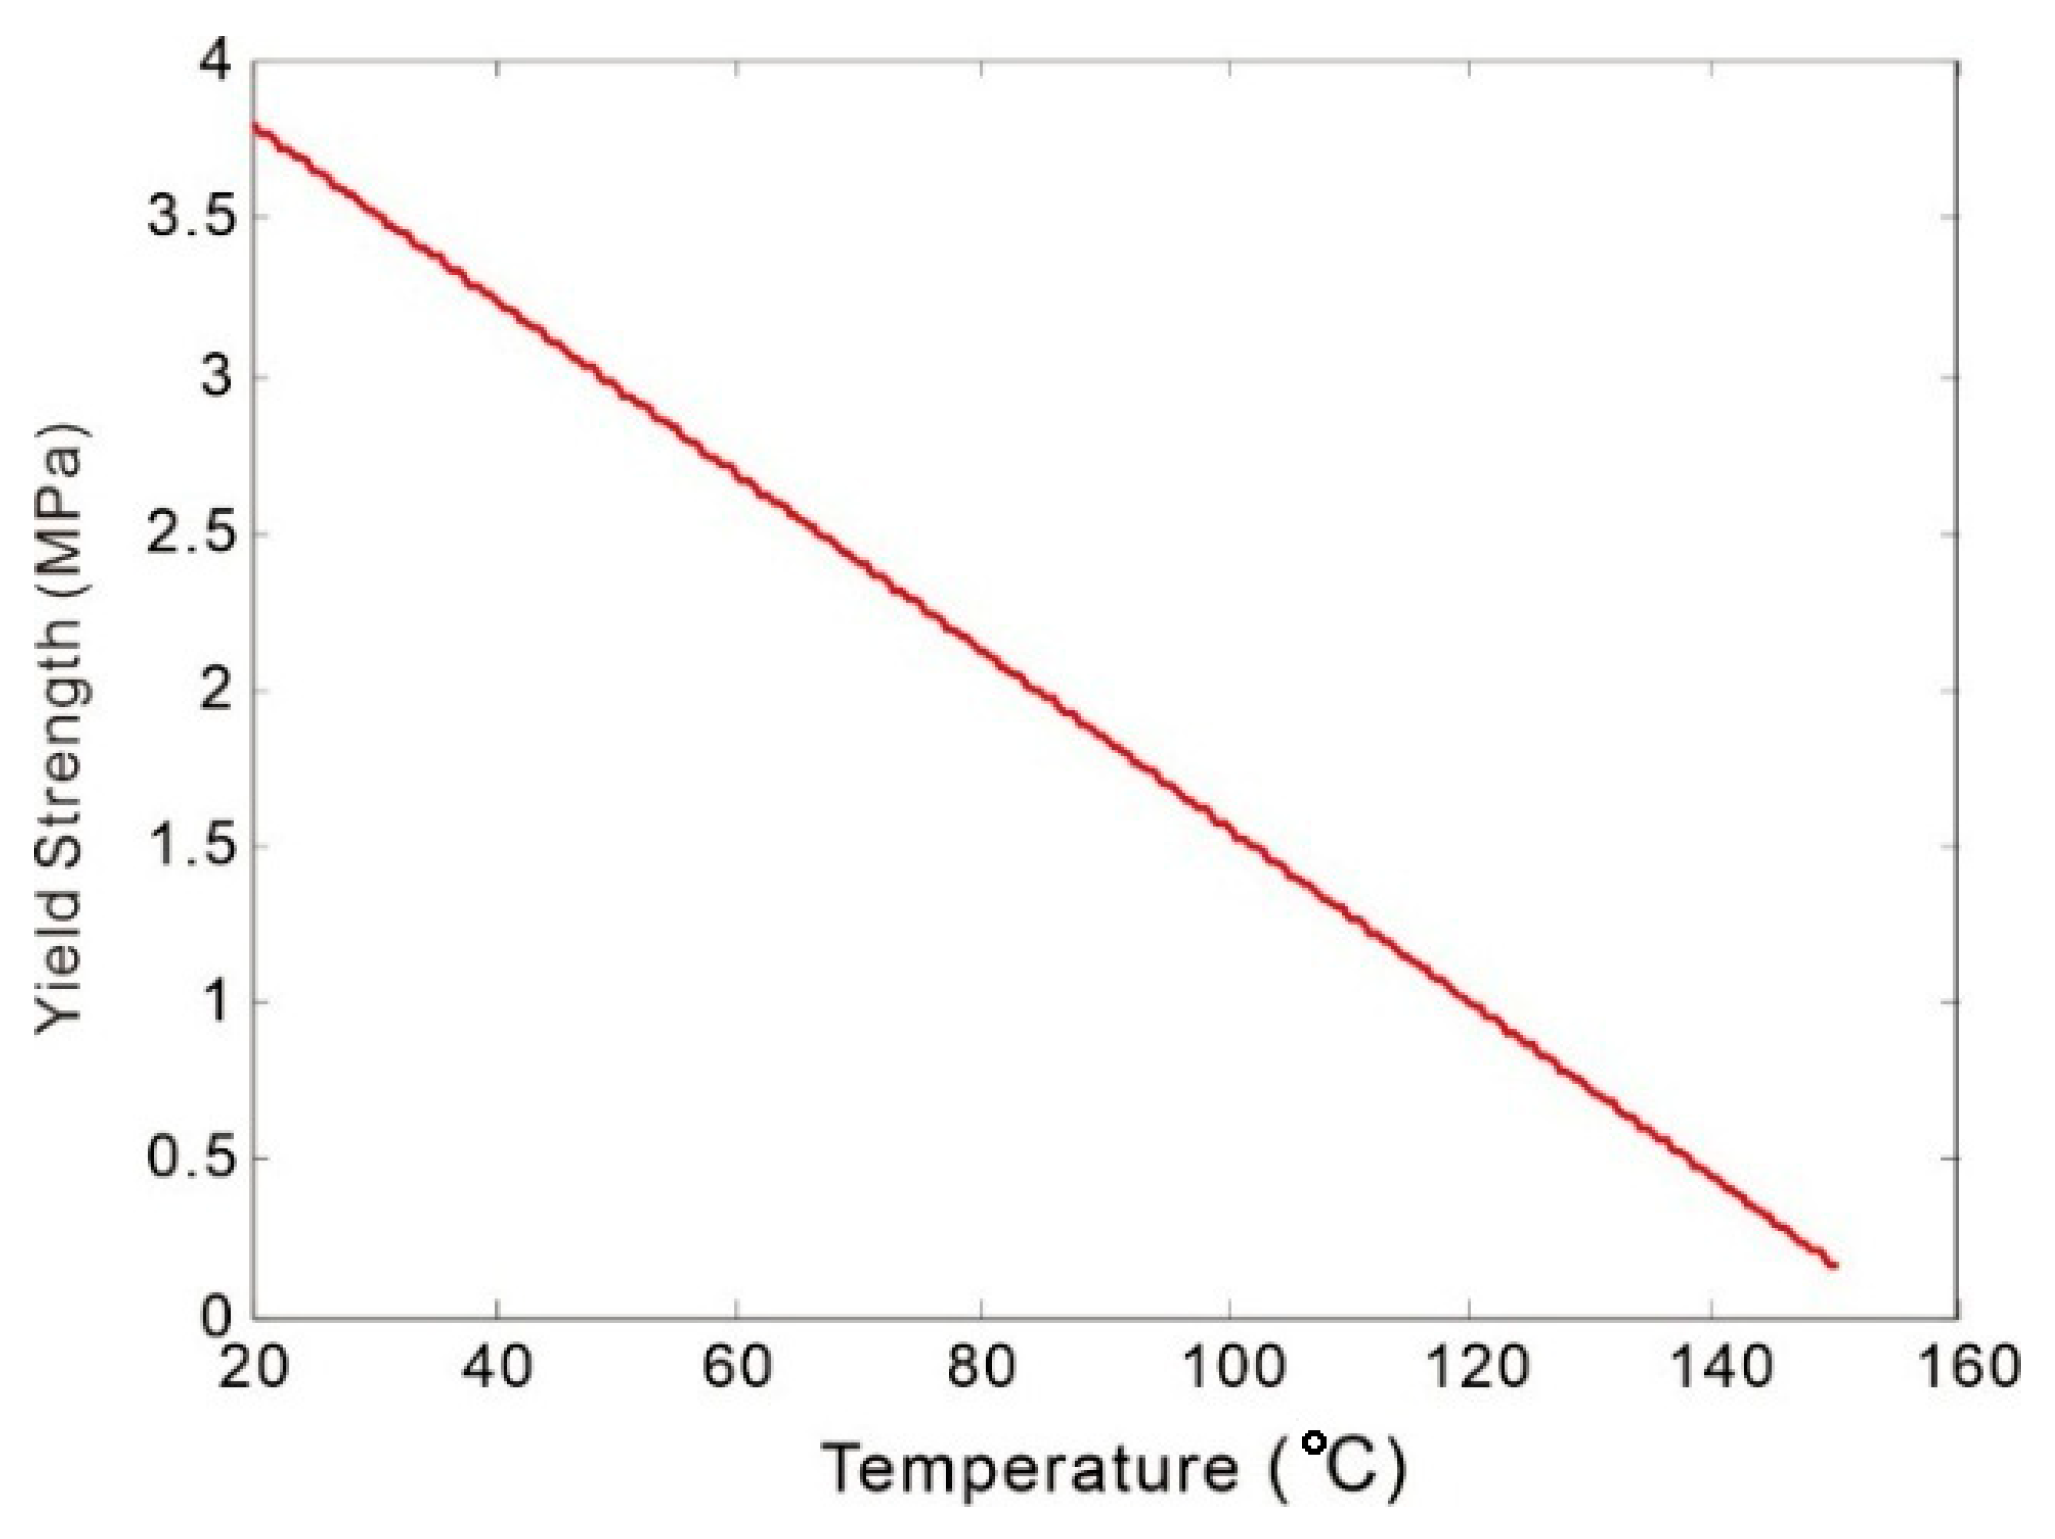
(3) Correlation between yield strength and temperature
Generally, rock strength decreases with increasing temperature. This strength reduction can be attributed to the differential thermal expansion rates of mineral grains within oil sands. Thermally induced deformation incompatibility between grains generates structural stress, which intensifies with rising temperature. This leads to the development of additional microcracks or propagation of pre-existing fractures in the oil sand matrix, ultimately manifesting macroscopically as thermal weakening—a phenomenon also observed in granite.
The relationship between temperature and yield strength is described using a linear function [24]:
The relationship between yield strength and temperature is illustrated in Figure 14.

Figure 14.
Correlation between temperature and yield strength.
Yield strength refers to the critical stress value of the oil sands in the process of elastic deformation to plastic deformation, and irreversible plastic deformation or failure will occur after the oil sands exceed this value. According to Figure 14, the yield of the oil sands plummets as the temperature increases. This phenomenon shows that the oil sands are more prone to plastic deformation under high-temperature conditions, which is mutually verified in Figure 10.
3.2.3. Effects of Heavy Oil Viscosity on Rock Mechanical Parameters
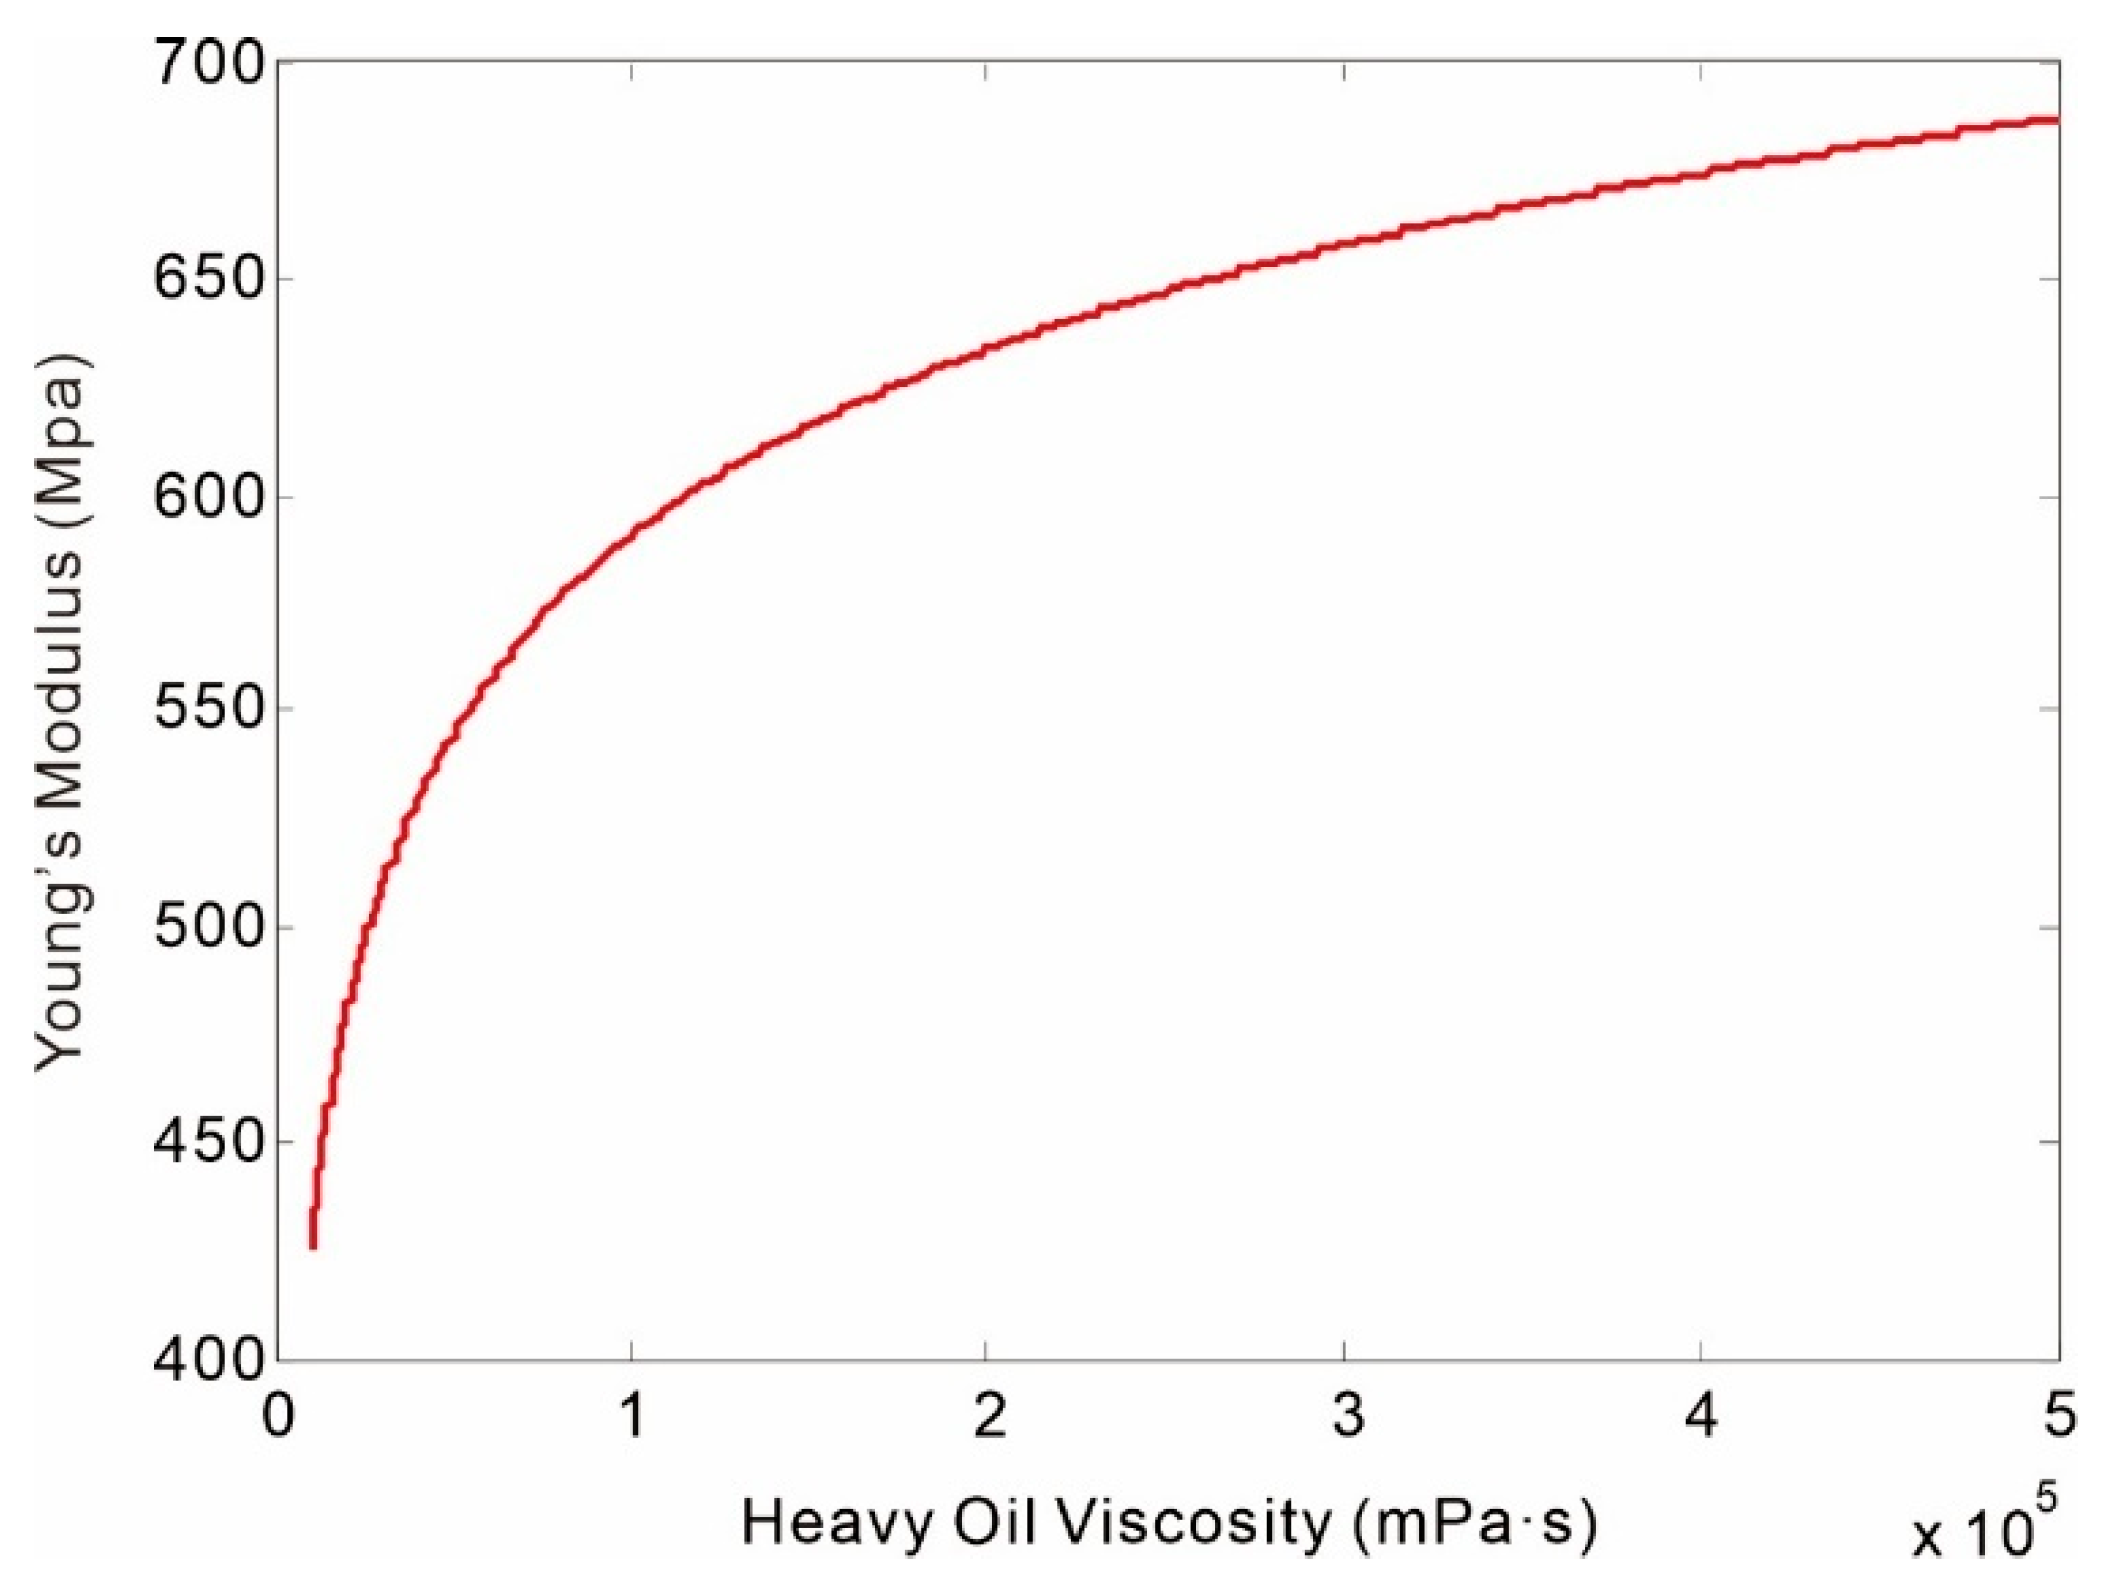
(1) Effect of heavy oil viscosity on Young’s modulus
For conventional oil sands, Young’s modulus and viscosity are correlated using temperature as an intermediate variable, with the functional expression given by
The relationship between viscosity and Young’s modulus is shown in Figure 15. Figure 15 shows that the Young’s modulus is affected by temperature and the viscosity of heavy oils.

Figure 15.
Correlation between heavy oil viscosity and Young’s modulus.
Figure 15 reveals a nonlinear positive correlation between heavy oil viscosity and Young’s modulus. When the heavy oil viscosity is 10,000 mPa·s, the minimum Young’s modulus is approximately 425 MPa; at a viscosity of 500,000 mPa·s, the maximum Young’s modulus reaches 680 MPa.
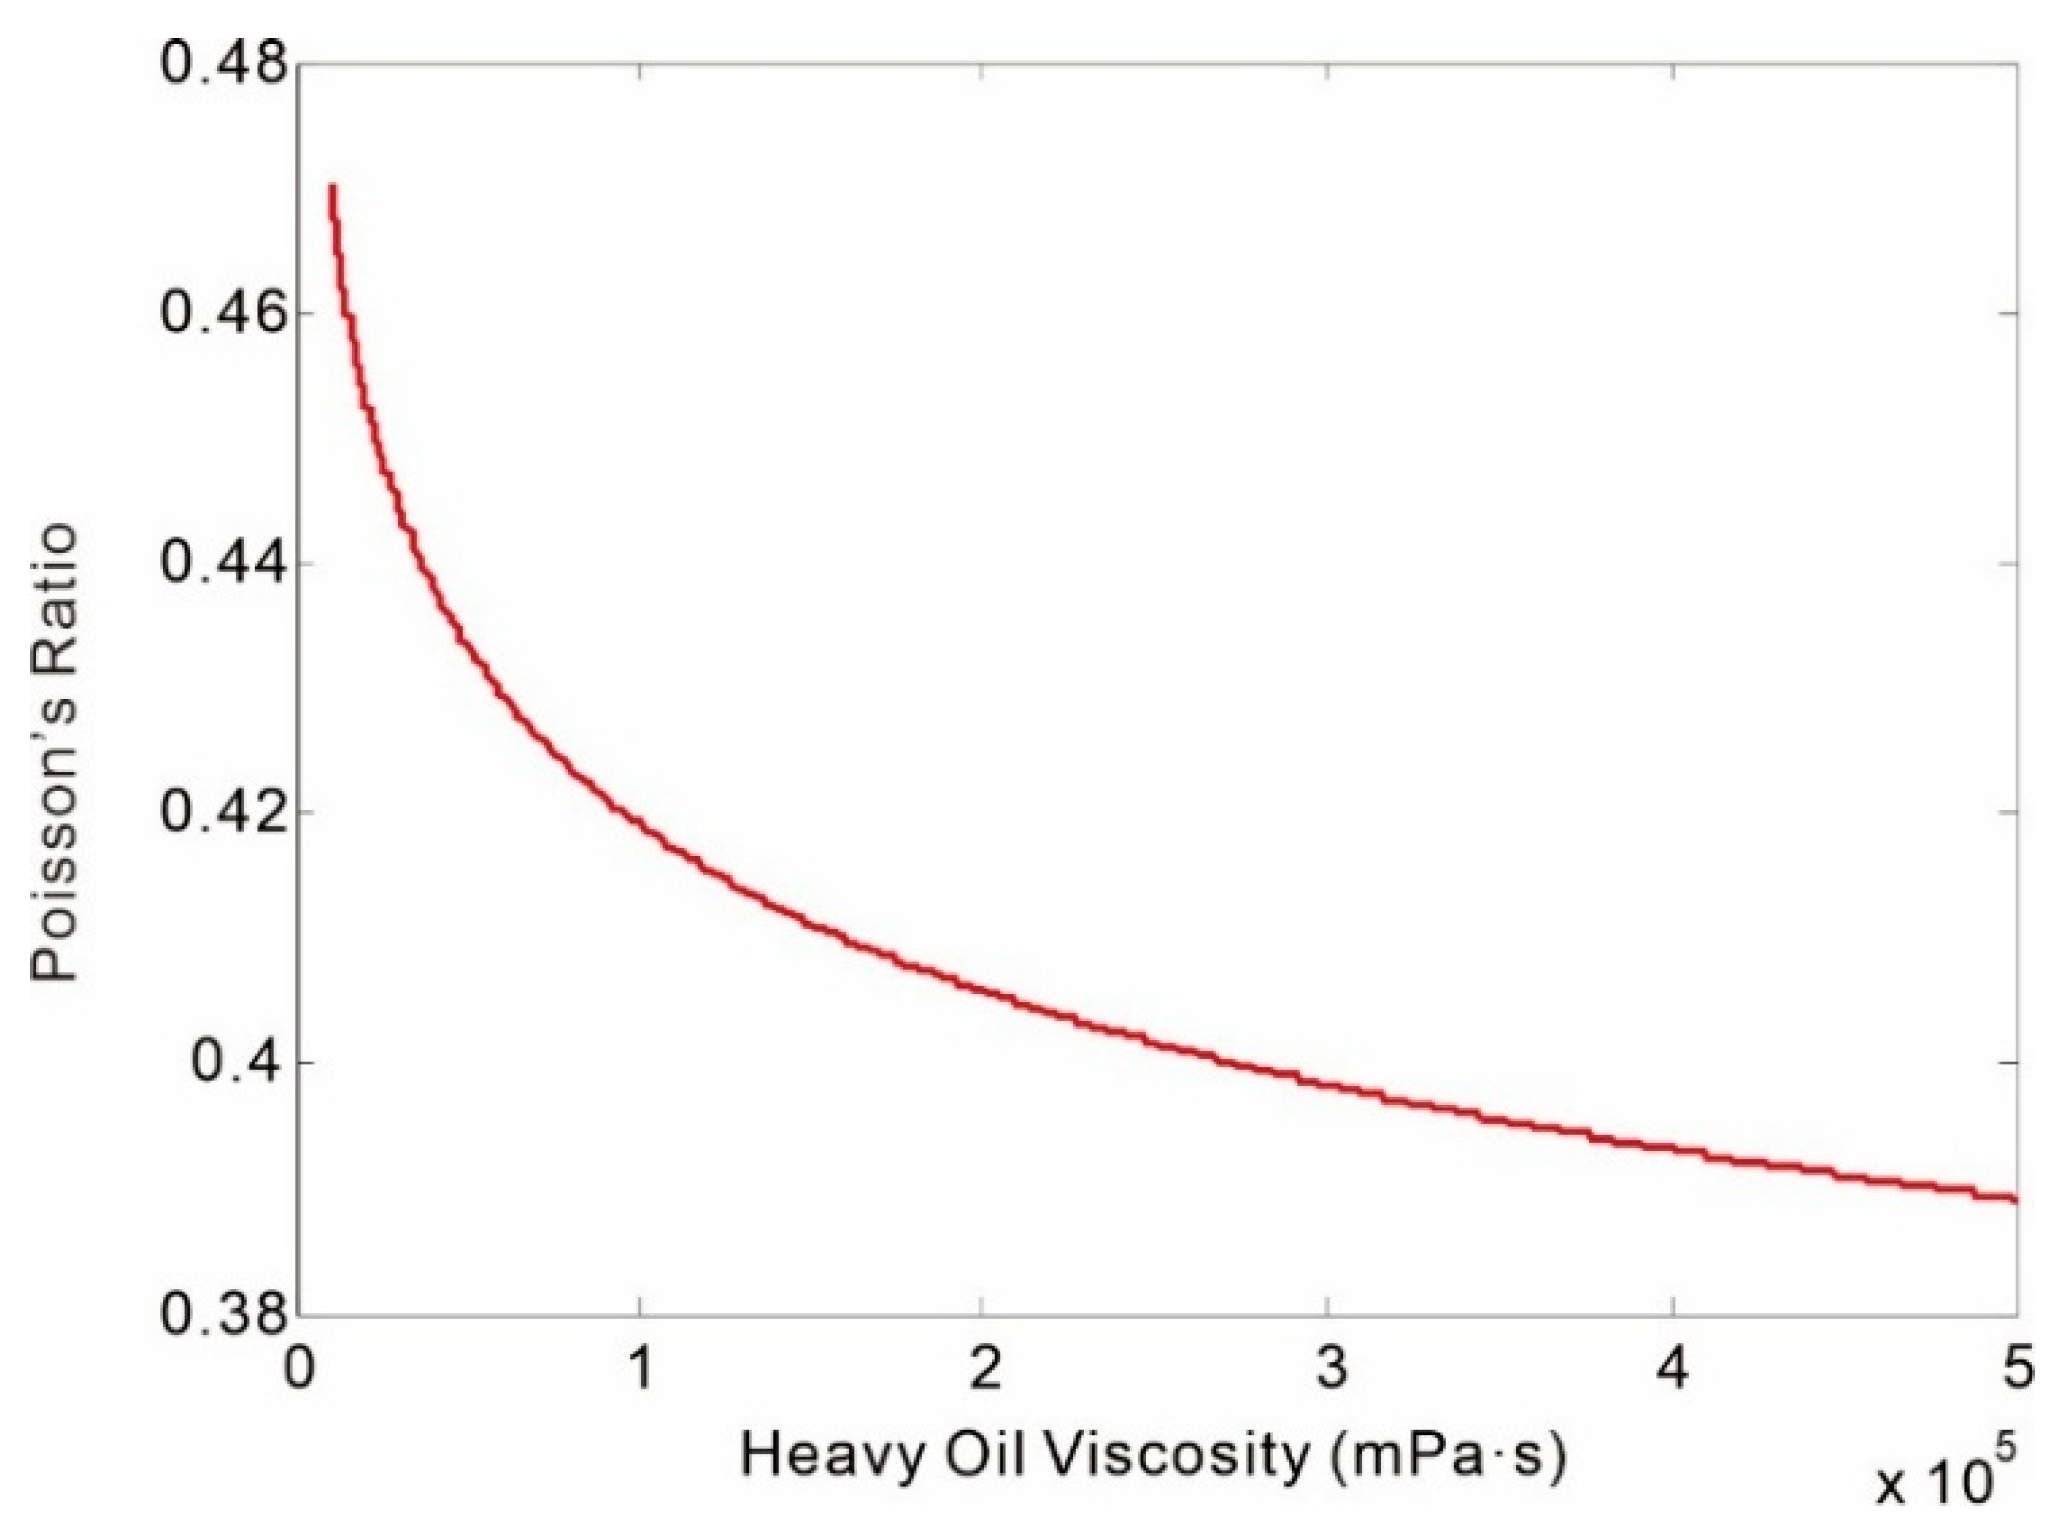
(2) Relationship between heavy oil viscosity and Poisson’s ratio
By employing temperature as an intermediate variable, the functional relationship between Poisson’s ratio and viscosity is established as
Figure 16 shows that the Poisson’s ratio is affected by temperature and the viscosity of heavy oils. Its relationship with Poisson’s ratio is expressed by the following curve.

Figure 16.
Correlation between heavy oil viscosity and Poisson’s ratio.
Figure 16 demonstrates a nonlinear negative correlation between heavy oil viscosity and Poisson’s ratio. The maximum Poisson’s ratio reaches approximately 0.47 at a viscosity of 10,000 mPa·s, while it decreases to about 0.39 when the viscosity increases to 500,000 mPa·s.
(3) Relationship between heavy oil viscosity and yield strength
Using temperature as an intermediate variable, the yield strength is correlated with viscosity through the following functional expression:
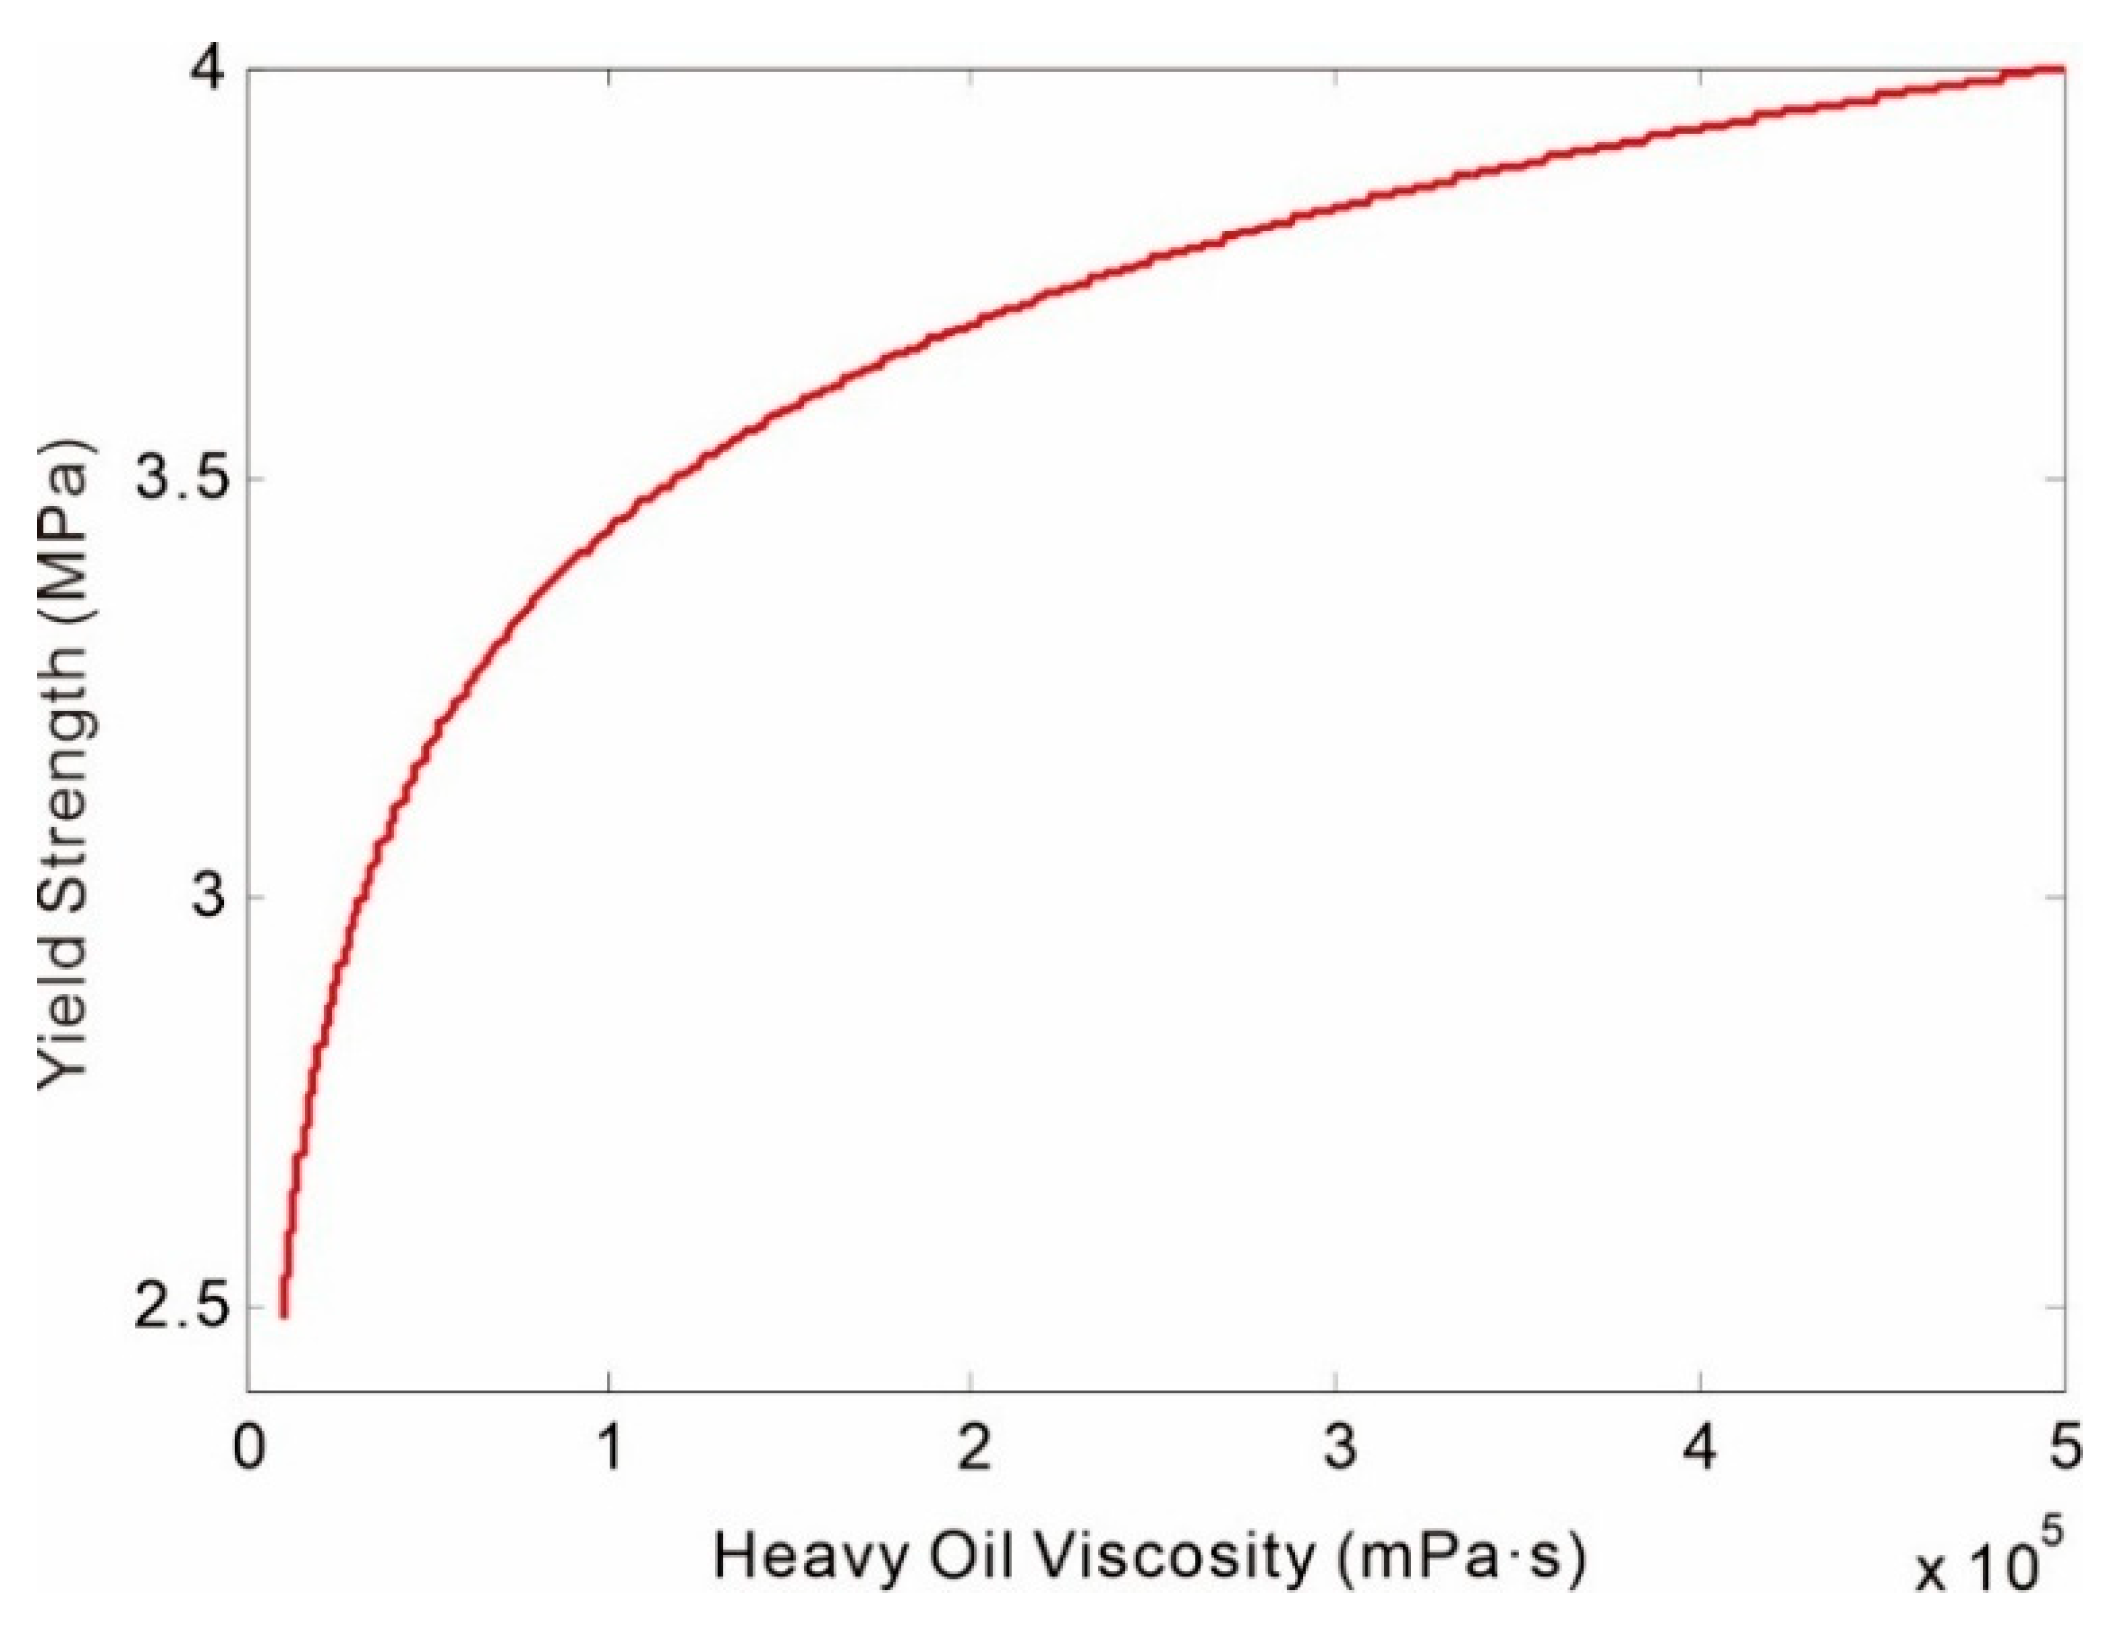
Figure 17 shows that the yield strength is affected by temperature and the viscosity of heavy oils. The relationship curve between it and yield strength is shown in the figure below.

Figure 17.
Correlation between heavy oil viscosity and yield strength.
As illustrated in Figure 17, a nonlinear positive correlation exists between heavy oil viscosity and yield strength. The minimum yield strength is approximately 2.5 MPa at a viscosity of 10,000 mPa·s, while it increases significantly to about 4 MPa when the viscosity reaches 500,000 mPa·s.
3.2.4. Case Analysis of Heavy Oil Viscosity Effects on Dilation Behavior
To investigate the influence of heavy oil viscosity on dilation effects, a comparative study was conducted using the finite element model established in the previous literature [3,15], with the experimental design outlined in Table A6.
Validation was performed using the physical model parameters and operational parameters from Well FWH3055 in Block 18 of the heavy oil reservoir prior to optimization, with the operational parameters specified in Table A7.
The simulation results obtained using the finite element method are presented in the following Table A8.
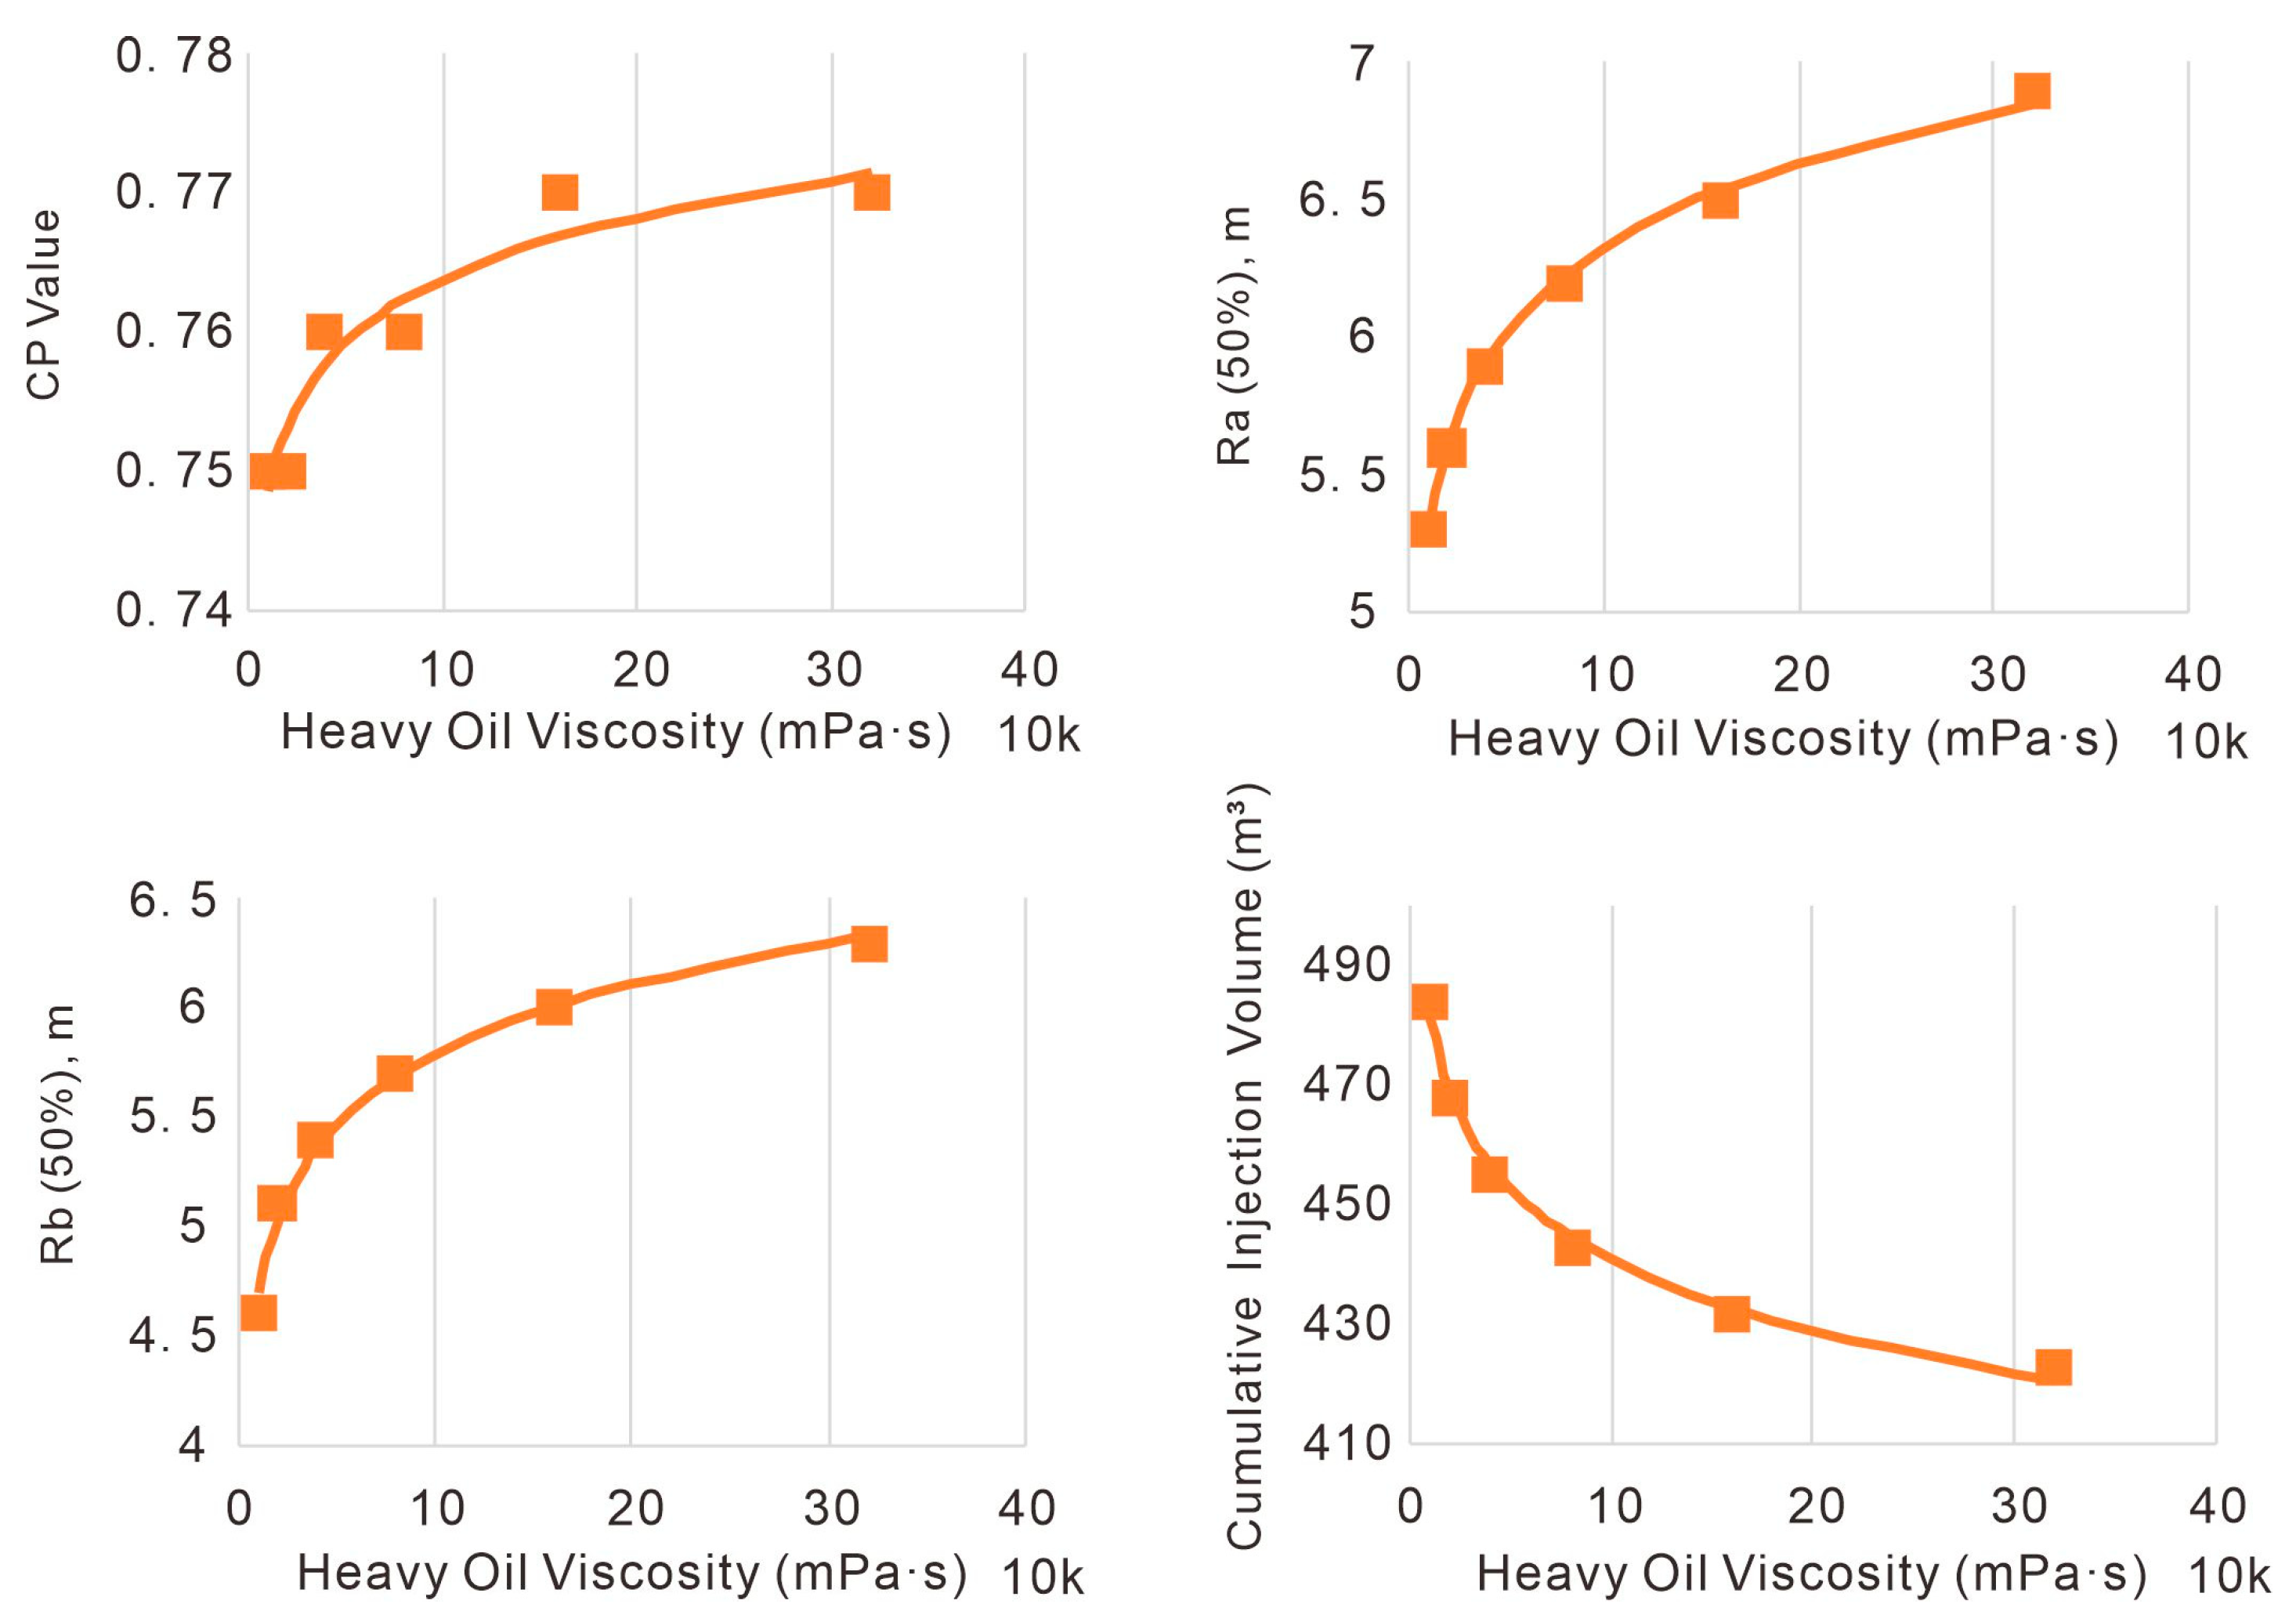
As shown in Figure 18, comparative analysis of Groups 1–6 reveals that increased heavy oil viscosity enhances the hydraulic connectivity coefficient and dilation radius, while reducing the cumulative injection volume. Through the analysis of the four graphs in Figure 18, it is found that the higher the viscosity of heavy oil, the CP value and expansion radius of the reservoir increase, but the cumulative amount of pumped fluid decreases. Therefore, the influence of heavy oil viscosity on microfractures in oil sand reservoirs is not unidirectional, and the development effect of different heavy oil reservoirs requires special analysis of specific reservoirs. This theory provides theoretical guidance for field technicians on what kind of development and transformation technology to adopt for reservoirs.

Figure 18.
Impact of heavy oil viscosity on dilation effectiveness.
4. Optimization Objectives and Strategies
In the field operations of micro-fracturing, the cumulative injection volume of a well represents the most readily controllable, manageable, and visualized operational parameter. By establishing the correlation between cumulative injection volume and dilation effectiveness based on acquired data, the operational procedures can be significantly streamlined, thereby enhancing the practicality of dilation evaluation methodologies.
Generally, for different types of oil sand reservoirs, the injected fluid volume depends on temporal factors, injection pressure, and reservoir physical properties (e.g., porosity, permeability, and saturation). However, when injecting identical volumes of hot fluid, the resulting dilation trends should theoretically exhibit consistent patterns. Therefore, for oil sands with varying reservoir properties, the influence of cumulative injection volume on the hydraulic connectivity coefficient and dilation radius should follow consistent patterns. Through analysis of existing experimental data distributions and subsequent empirical formula curve fitting verification, it is concluded that below a threshold cumulative injection volume, a parabolic relationship (passing through the origin) exists between the injection volume and dilation evaluation parameters and that beyond this threshold, these parameters remain constant. The rationale is as follows. (1) When the cumulative injection volume is zero, both the CP value and dilation radius equal zero. (2) After water injection commences, the CP value and dilation radius increase with growing cumulative injection volume. (3) Generally, the rate of change in dilation evaluation parameters relative to injection volume varies. For instance, the CP value’s sensitivity to injection volume decreases during late-stage injection, whereas the dilation radius shows the opposite trend—precisely controllable through parabolic curvature adjustment. (4) The parabola’s terminus corresponds to a threshold cumulative injection volume (for downward-opening parabolas, never exceeding the axis of symmetry), indicating complete water saturation of non-oil-bearing pores. Further injection causes water breakthrough from the oil sand reservoir. (5) The finite reservoir space limits dilation effects, which plateau after excessive water injection [26].
In the following analysis of cumulative injection volume’s impact on dilation effectiveness, lithological variations among oil sands are initially disregarded to establish a unified mathematical model.
where
- CP = hydraulic connectivity coefficient (dimensionless)
- R = dilation radius (m)
- Q = cumulative injection volume (m3)
- a, b, m, n = material constants dependent on oil sand type (or reservoir properties)
For wells in different types of oil sand reservoirs, data on corresponding hydraulic connectivity coefficients and dilation radii have been obtained under various cumulative injection volumes. Here, we treat cumulative injection volume as the controlled independent variable, with the hydraulic connectivity coefficient and dilation radius as dependent variables, to investigate their variations in response to different volumes of injected hot fluid.
Using data from Well FHW3077, FHW3078, FHW3079 (conventional oil sands), FHW3099 (argillaceous oil sands) in Block 18, and Well FHW325U (bituminous oil sands) in Block 1, all measured/calculated experimental data points were plotted as scatter diagrams and fitted with empirical formulas based on probability theory and mathematical statistics methodologies.
Note: This study categorizes reservoirs into Type ① to Type ⑤. While bituminous oil sands and oil-rich bituminous oil sands exhibit differences in reservoir properties, these variations are relatively minor—for instance, the CP value difference during hydraulic connectivity establishment is merely 0.4, with comparable cumulative injection volumes under identical time and pressure conditions, and similar dilation radii at equivalent injection volumes. Given their analogous reservoir characteristics, the influence of injection volume on hydraulic connectivity coefficients and dilation radii should be nearly identical for both types. Considering the scarcity of oil sand samples and limited available experimental data points, these two types are treated indistinctly in subsequent analyses and collectively termed (oil-rich) bituminous oil sands. Similarly, argillaceous oil sands and clay-rich argillaceous oil sands are uniformly referred to as (clay-rich) argillaceous oil sands.
After continuous injection for 1000 min (around the first experimental time point), the cumulative injection volume of argillaceous and bituminous oil sands generally remains below 150 m3 due to reservoir properties like permeability and porosity, whereas conventional oil sands typically exceed 250 m3. Notably, the rates of change in CP values and dilation radii with respect to injection volume are significantly higher in argillaceous/bituminous oil sands compared to conventional types. To characterize the differential sensitivity of reservoir properties to injection volume, distinct polynomial fittings were performed for each oil sand category, with the fitted curves and equations presented below.
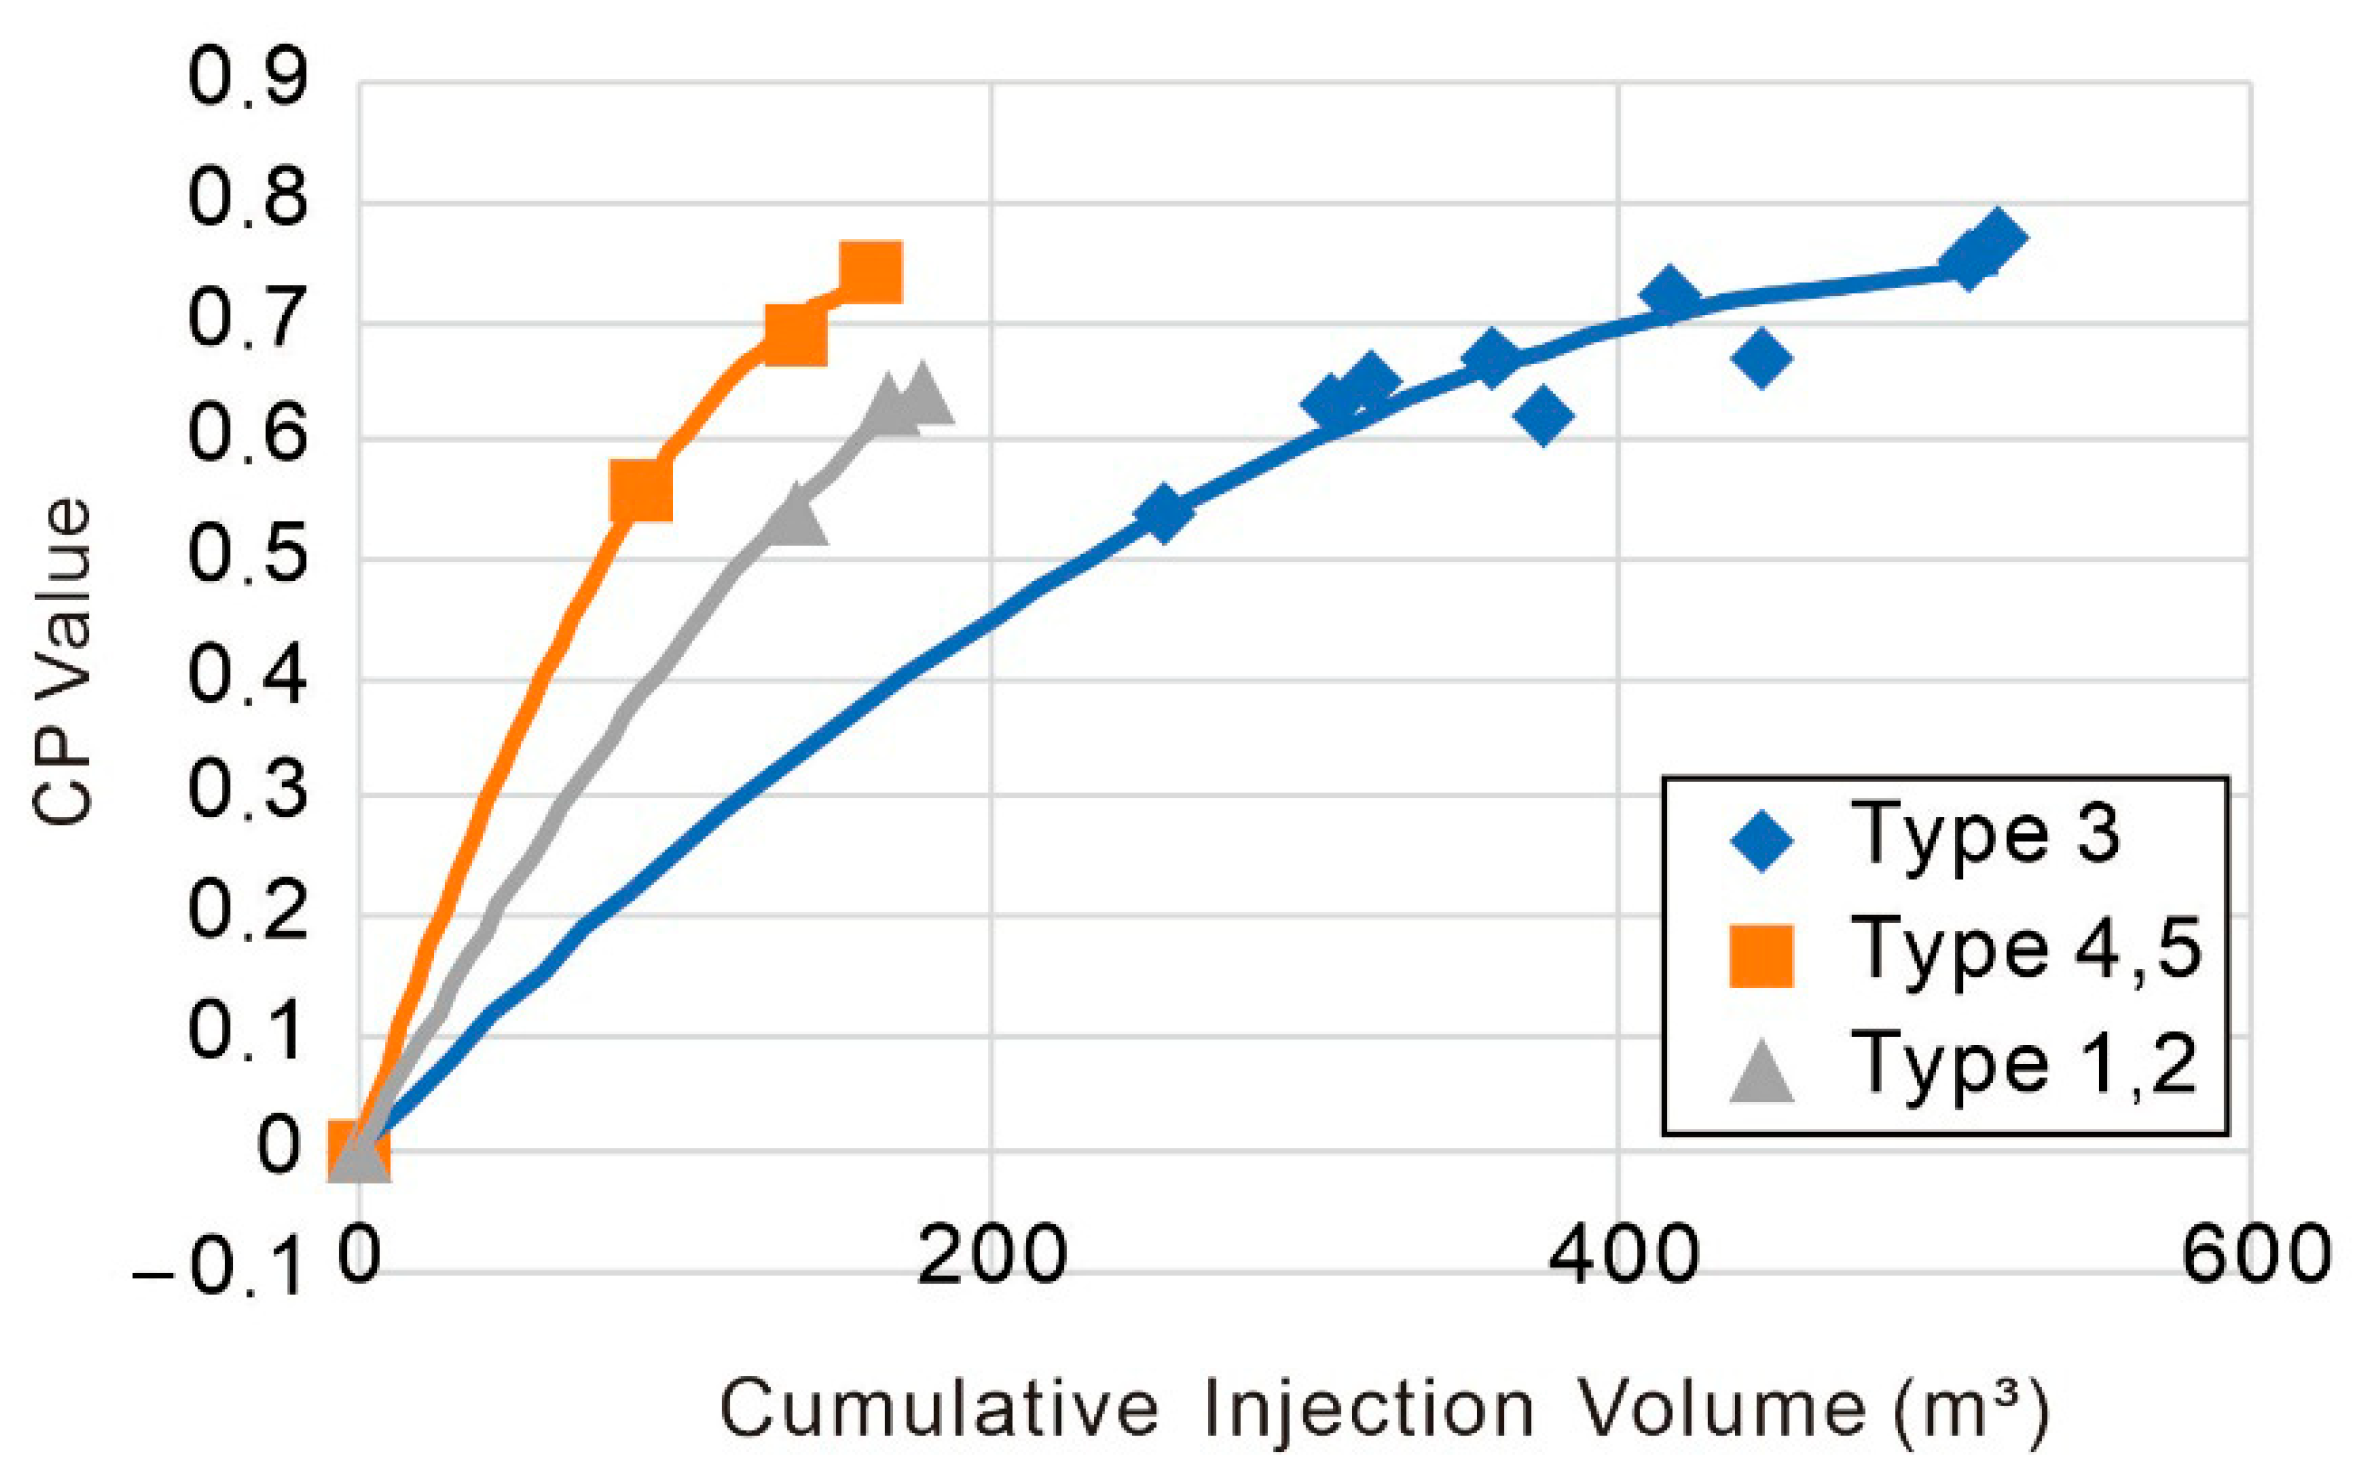
Figure 19 demonstrates that under identical injection volumes, the hydraulic connectivity establishment sequence among oil sand reservoirs is (clay-rich) argillaceous oil sands > (oil-rich) bituminous oil sands > conventional oil sands. Hydraulic connectivity is achieved in (clay-rich) argillaceous oil sands at approximately 150 m3, while (oil-rich) bituminous oil sands exhibit a CP value of about 0.55 and conventional oil sands show a lower value of merely 0.4 at this stage. When the injection volume reaches around 200 m3, (oil-rich) bituminous oil sands establish connectivity, with conventional oil sands displaying a CP value of approximately 0.45. Not until the injection volume approaches 500 m3 do conventional oil sands achieve full hydraulic connectivity.

Figure 19.
Relationship between cumulative injection volume and CP value in different oil sand reservoirs.
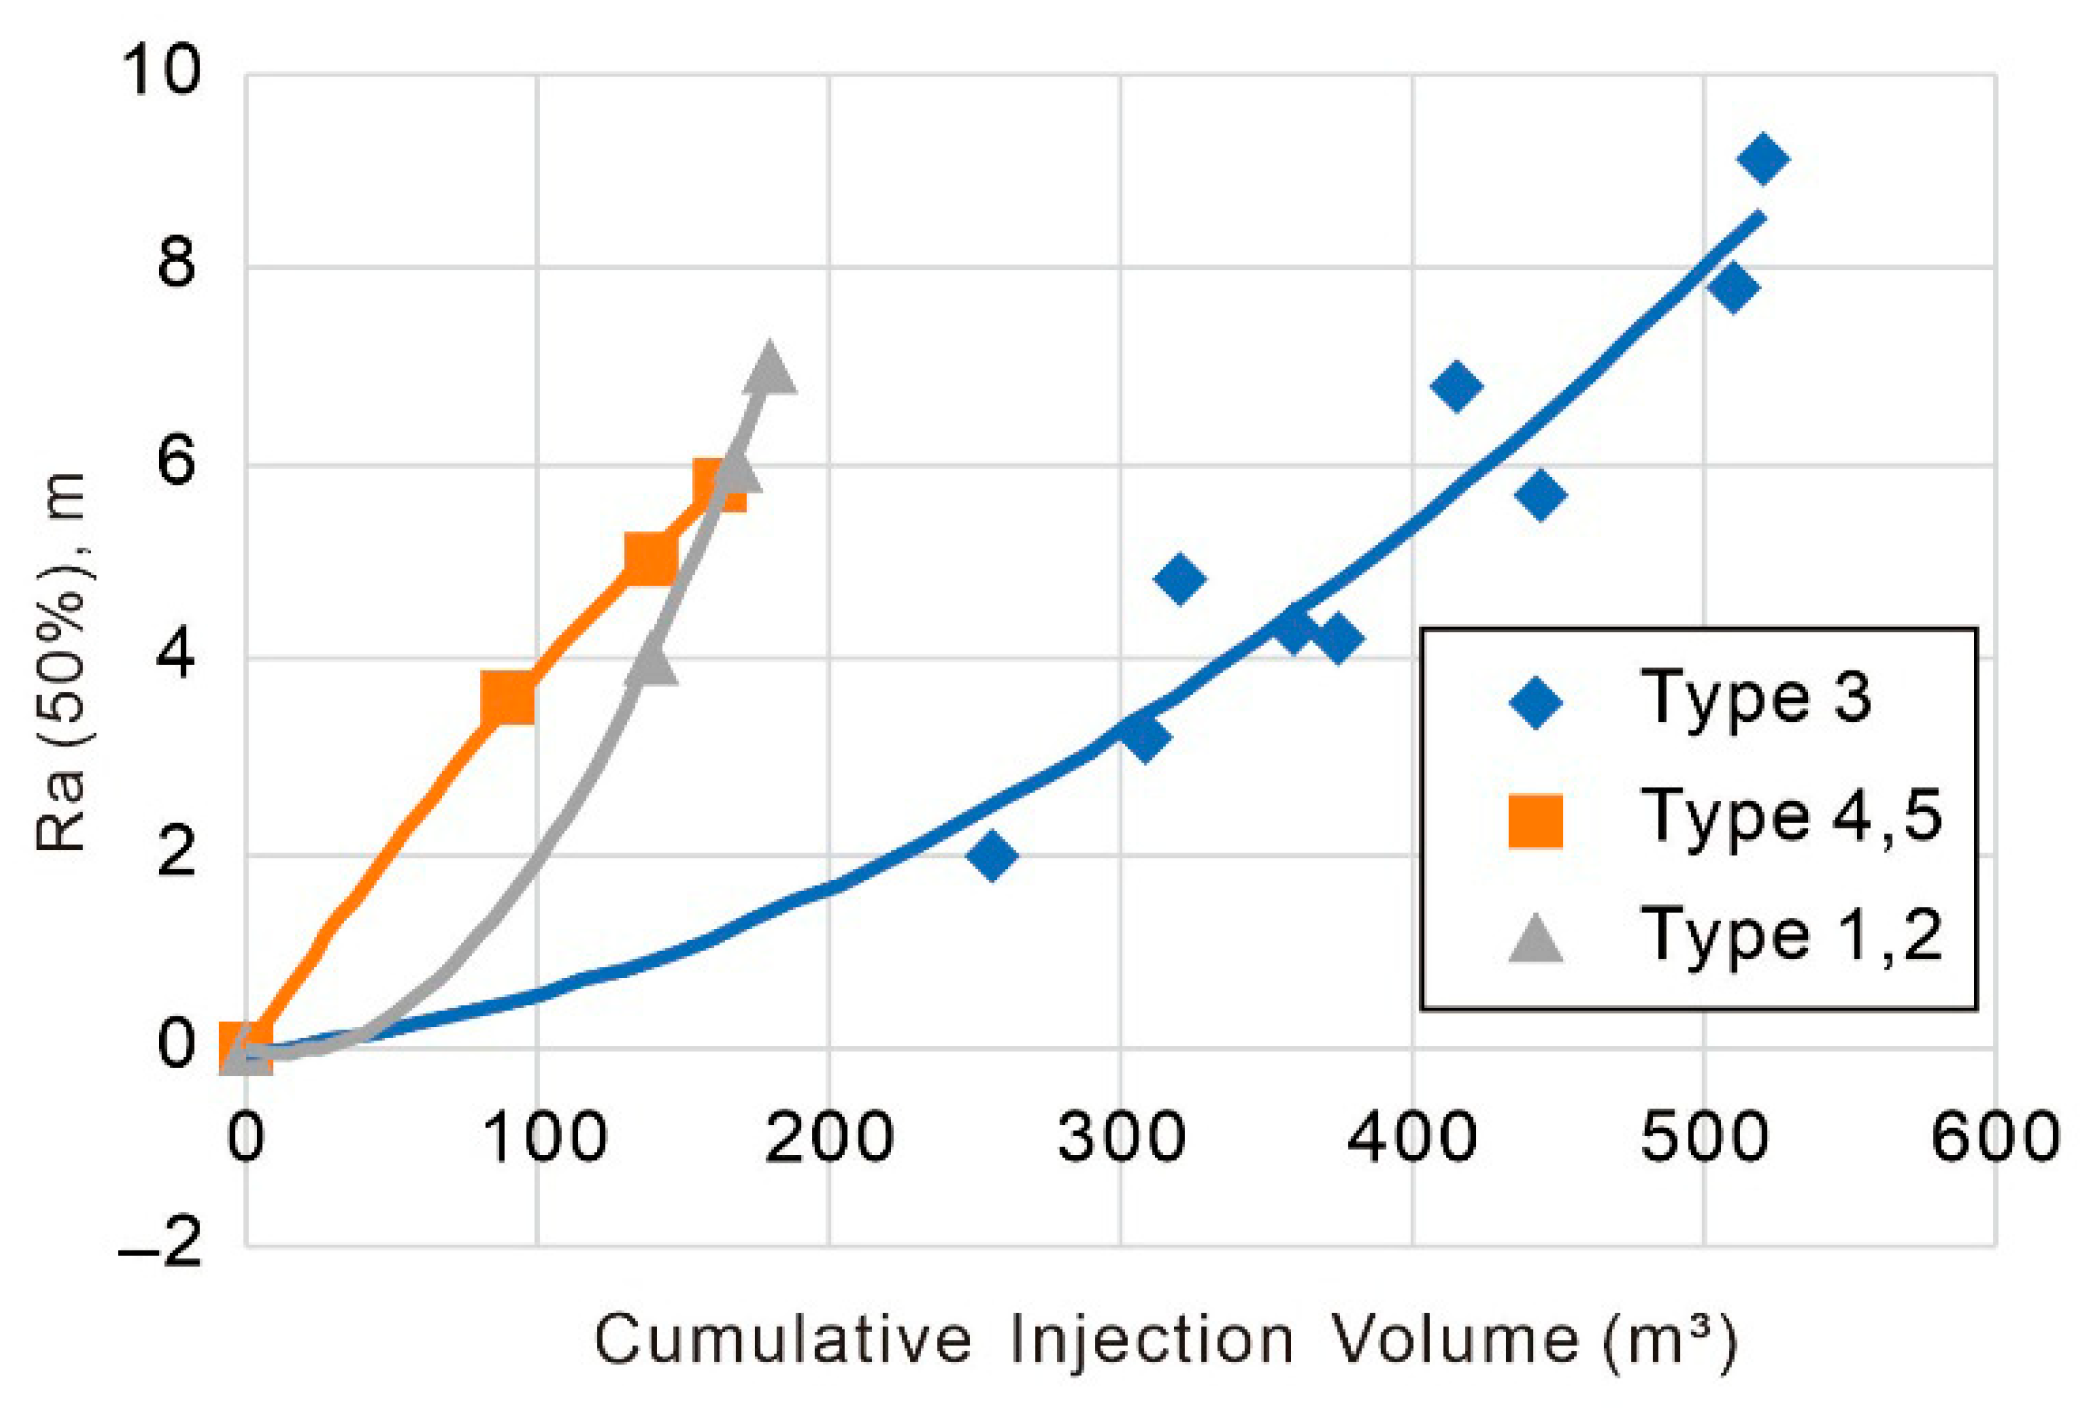
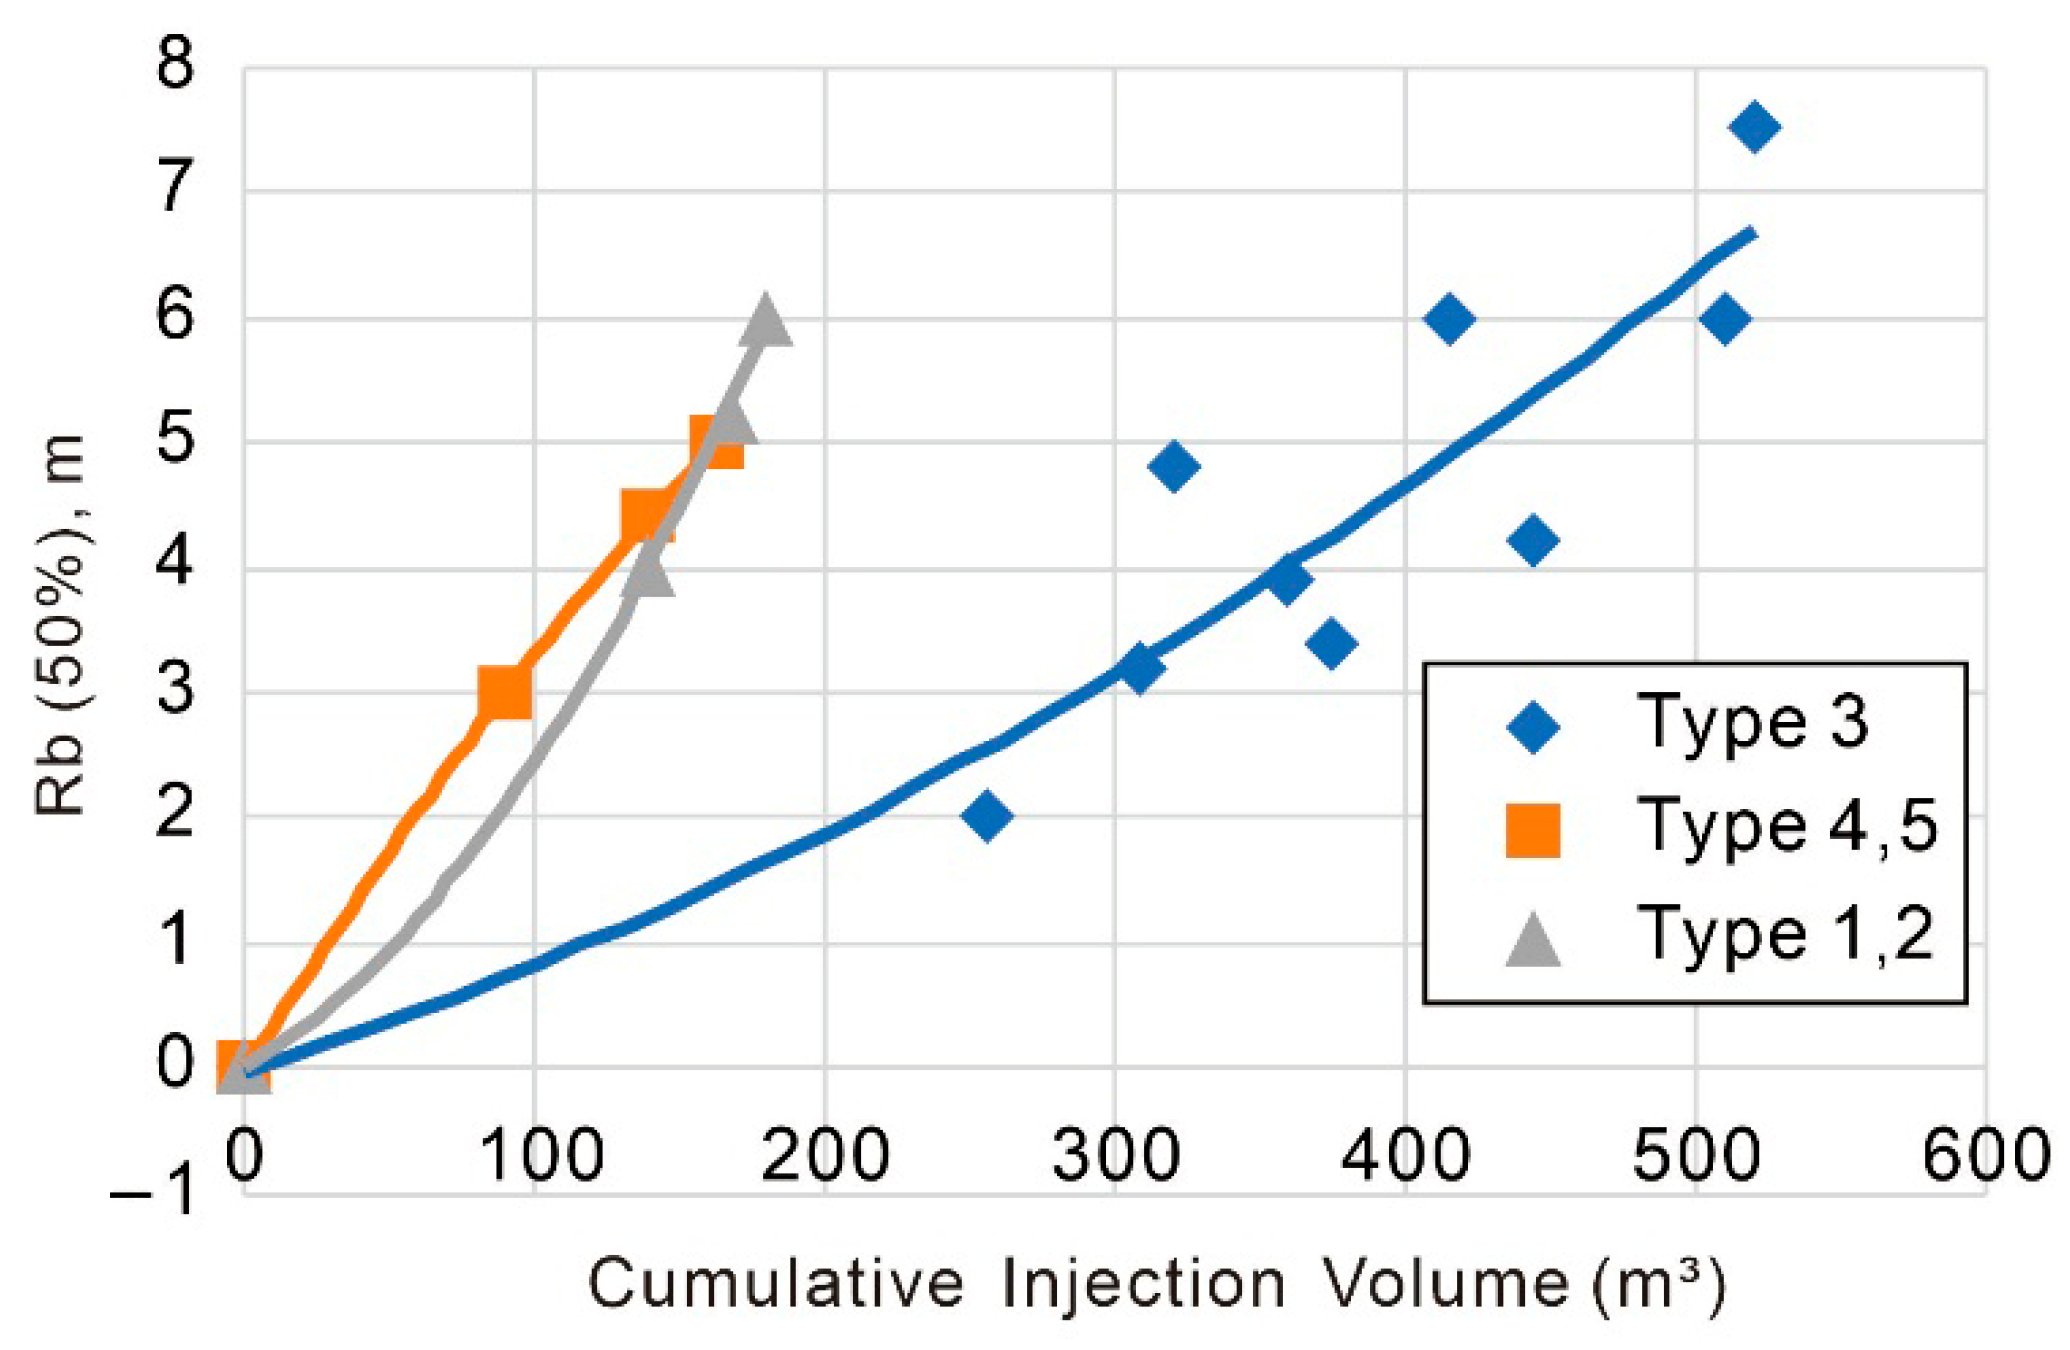
Figure 20 and Figure 21 reveal that under identical injection volumes, the dilation radius follows the order of (clay-rich) argillaceous oil sands > (oil-rich) bituminous oil sands > conventional oil sands, consistent with the CP value response pattern. For (clay-rich) argillaceous and (oil-rich) bituminous oil sands, hydraulic connectivity is essentially established at 200 m3 injection volume, with their dilation radii showing significant variations at lower injection volumes. In contrast, conventional oil sands exhibit lower CP values without established connectivity at this stage, demonstrating weaker sensitivity of dilation radius to cumulative injection. For instance, at 200 m3 injection, conventional oil sands show dilation radii (Ra, Rb) of only ~2 m, whereas argillaceous and bituminous types reach ~7 m and 6.5 m, respectively. Not until ~500 m3 injection do conventional oil sands establish connectivity, with Ra and Rb reaching approximately 8.2 m and 6.5 m.

Figure 20.
Relationship between cumulative injection volume and Ra (50%) in different oil sand reservoirs.

Figure 21.
Relationship between cumulative injection volume and Rb (50%) in different oil sand reservoirs.
In summary, the mathematical relationships between cumulative injection volume and both CP value and dilation radius for different oil sand types can be expressed as follows.
(1) Conventional oil sands:
(2) (Clay-rich) argillaceous oil sands:
(3) (Oil-rich) bituminous oil sands:
All fitted curves exhibit correlation coefficients (R2) exceeding 0.9, indicating excellent fitting quality and demonstrating strong correlations between cumulative injection volume and dilation evaluation parameters.
Given the inherent complexity of oil sand reservoir properties, combined with the influence of operational parameters and subsurface uncertainties, it is impractical to establish a perfectly accurate predictive model that precisely correlates cumulative injection volume with hydraulic connectivity coefficients and dilation radii. The aforementioned fitting method provides only an approximate evaluation of dilation parameters, with inherent challenges in error control.
During field operations, when comprehensive reservoir data (including oil sand classification and key petrophysical parameters) are available, the categorized prediction approach can be implemented. By applying the established relationships between injection volumes and dilation evaluation parameters for specific oil sand types, real-time assessment of post-injection dilation effectiveness becomes feasible. This underscores the assertion that accurate reservoir classification is pivotal for investigating injection volume effects on dilation parameters. In cases of insufficient geological data, predicting dilation effects solely based on total injection volume proves challenging. Under such circumstances, alternative operational parameters—including injection pressure modes, magnitudes, and durations from injector (I) and producer (P) wells—may serve as predictive proxies.
As field operations progress and geological data are progressively acquired, the aforementioned evaluation methodology undergoes continuous refinement. The increasing dataset enhances the fitted curves’ approximation to actual conditions. Given the complex petrophysical characteristics of oil sand reservoirs and operational complexities, reliance on data from merely a few dozen wells introduces significant stochastic errors. Therefore, immediate revisions and improvements should be implemented upon identifying discrepancies during application to achieve optimal predictive accuracy.
5. Prediction of Preheating Period Reduction Magnitude
In this paper, the optimization objectives and scheme design of CP value, expansion radius and other parameters of single variable of oil sands physical properties are discussed. The ‘preheating period reduction magnitude’ is defined as the percentage difference between pre- and post-micro-fracturing cyclic preheating durations relative to the original preheating period, denoted by h. Based on the variations in adjacent well preheating periods (in days) before and after micro-fracturing for each well in Table A9, we establish correlations between the reduction magnitude and dilation evaluation parameters (CP value, dilation radius, and cumulative injection volume).
Based on the distribution patterns observed in the scatter plots, the analysis adopts a binary classification system—conventional oil sands versus unconventional types (including bituminous, oil-rich bituminous, argillaceous, and clay-rich argillaceous oil sands). Post-curve fitting, the results are validated against field observations to ensure methodological reliability.
5.1. Prediction of Preheating Period Reduction Magnitude for Conventional Oil Sands
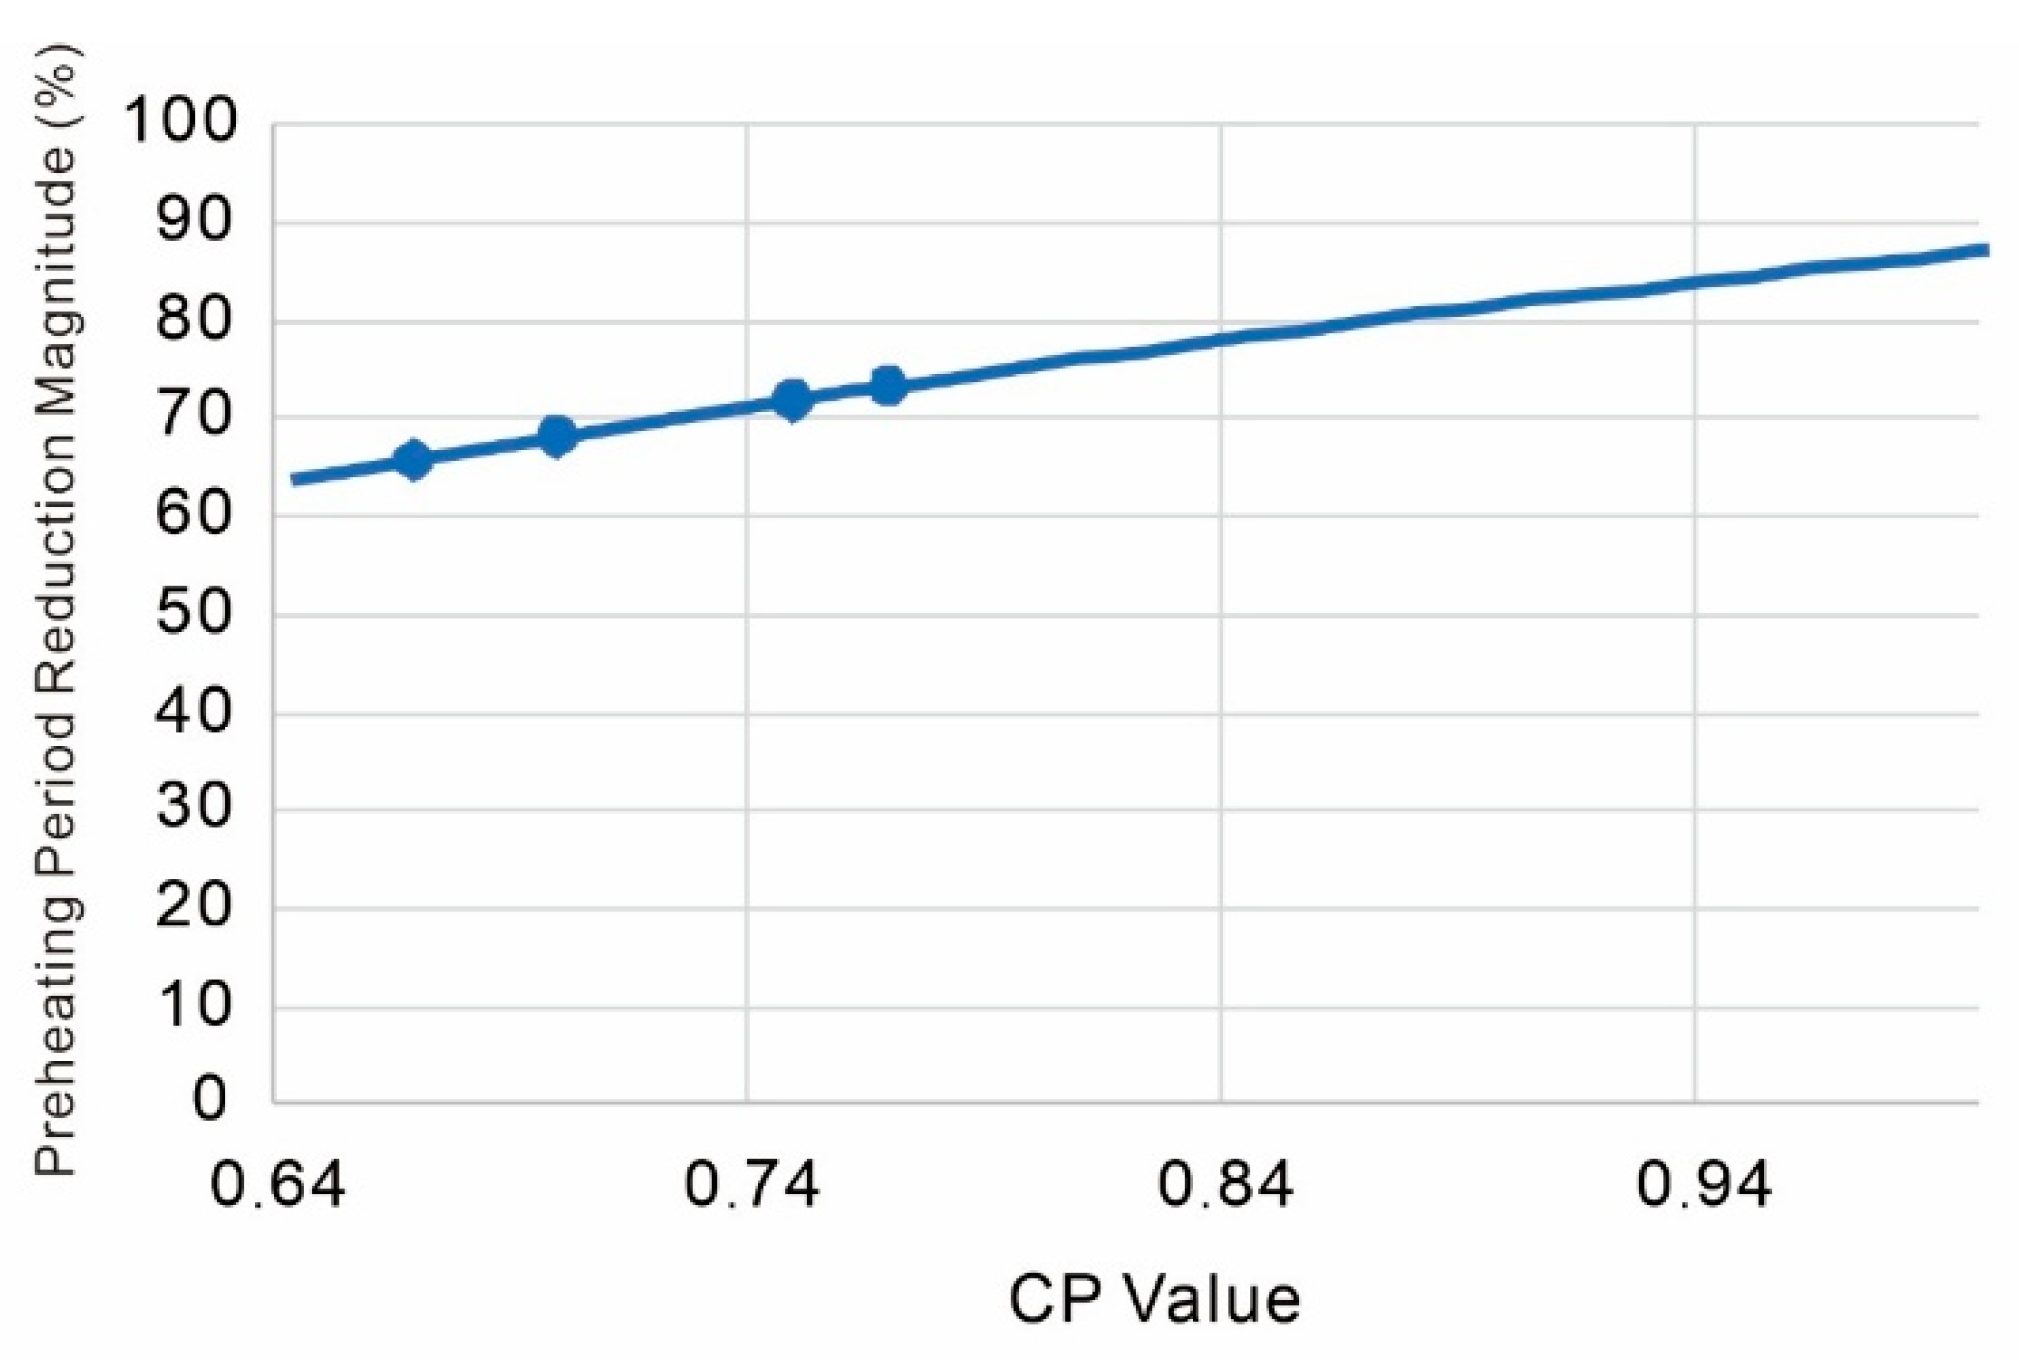
Figure 22 demonstrates that for conventional oil sands, the preheating period reduction magnitude increases progressively with rising CP values. At the hydraulic connectivity threshold (CP = 0.74), micro-fracturing operations can reduce the preheating period to approximately 70% of its original duration. Post-connectivity establishment, further water injection yields diminishing returns in reduction magnitude. When the CP value approaches its theoretical maximum of 1, the preheating period reduction reaches about 88%.

Figure 22.
Correlation between CP value and preheating period reduction magnitude in conventional oil sands.
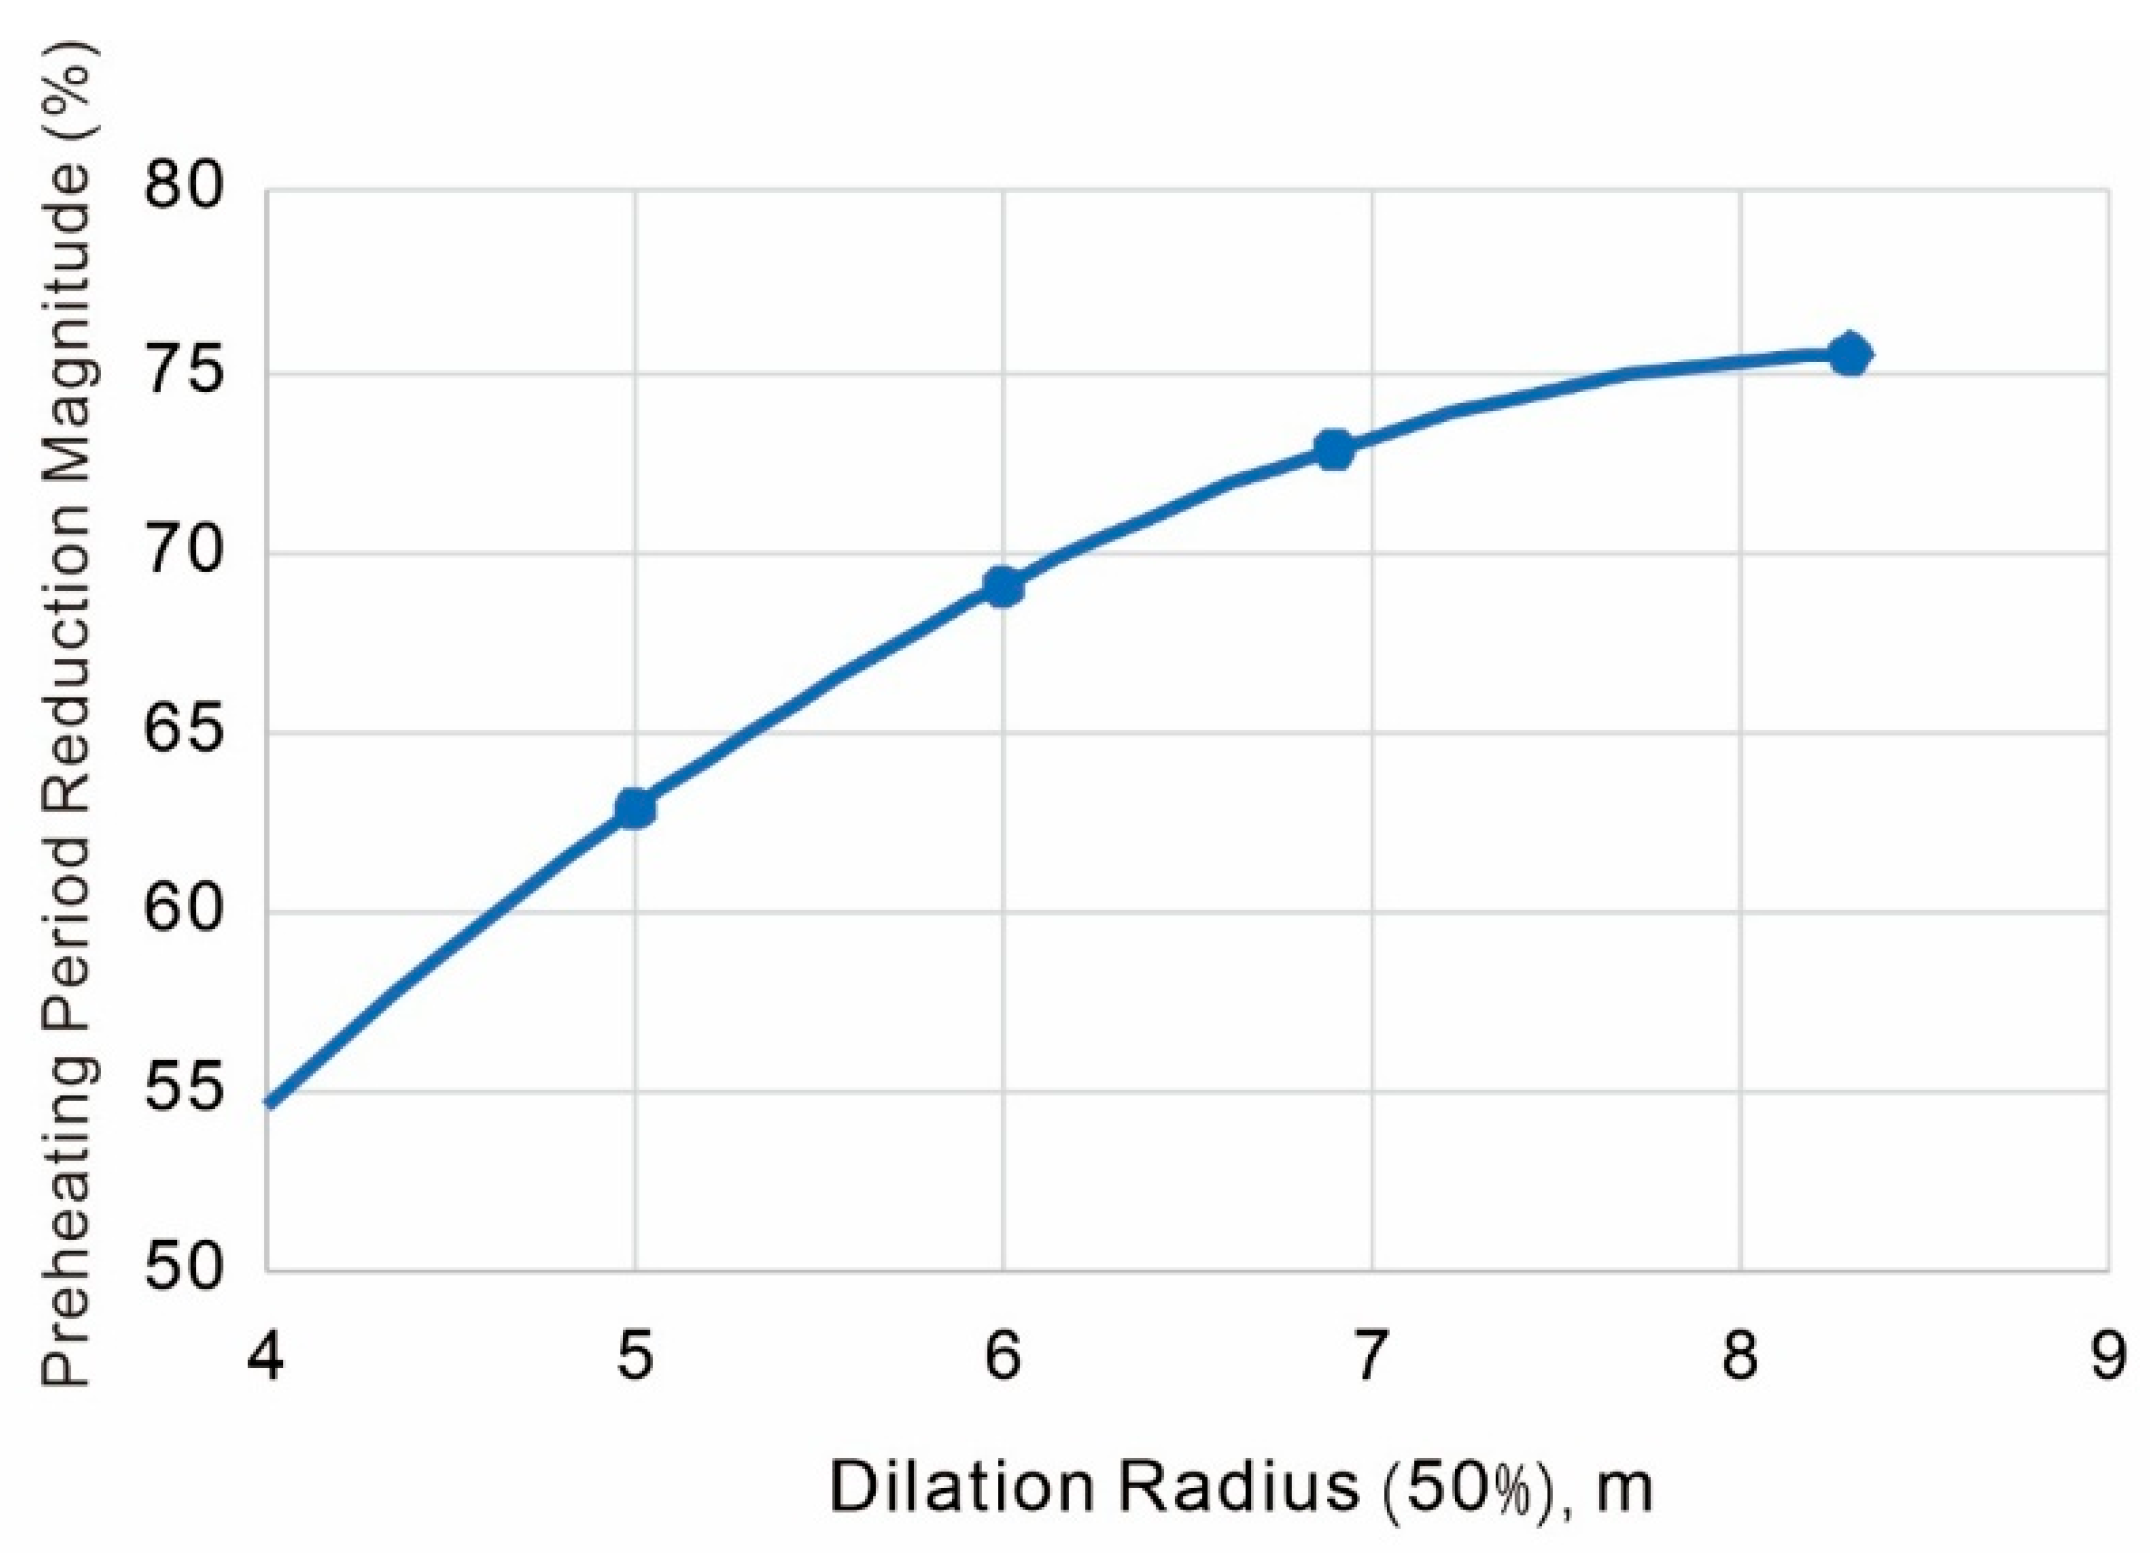
An analysis of Figure 23 reveals that in conventional oil sands, the preheating period reduction magnitude exhibits progressive enhancement with increasing dilation radius. At the hydraulic connectivity establishment stage (typically corresponding to dilation radii of 6–8 m), the reduction magnitude reaches 70–75%. Subsequent radius expansion yields gradually diminishing returns, with an approximate 75% reduction achieved at the critical dilation radius of ~8.2 m.

Figure 23.
Relationship between dilation radius and preheating period reduction magnitude in conventional oil sands.
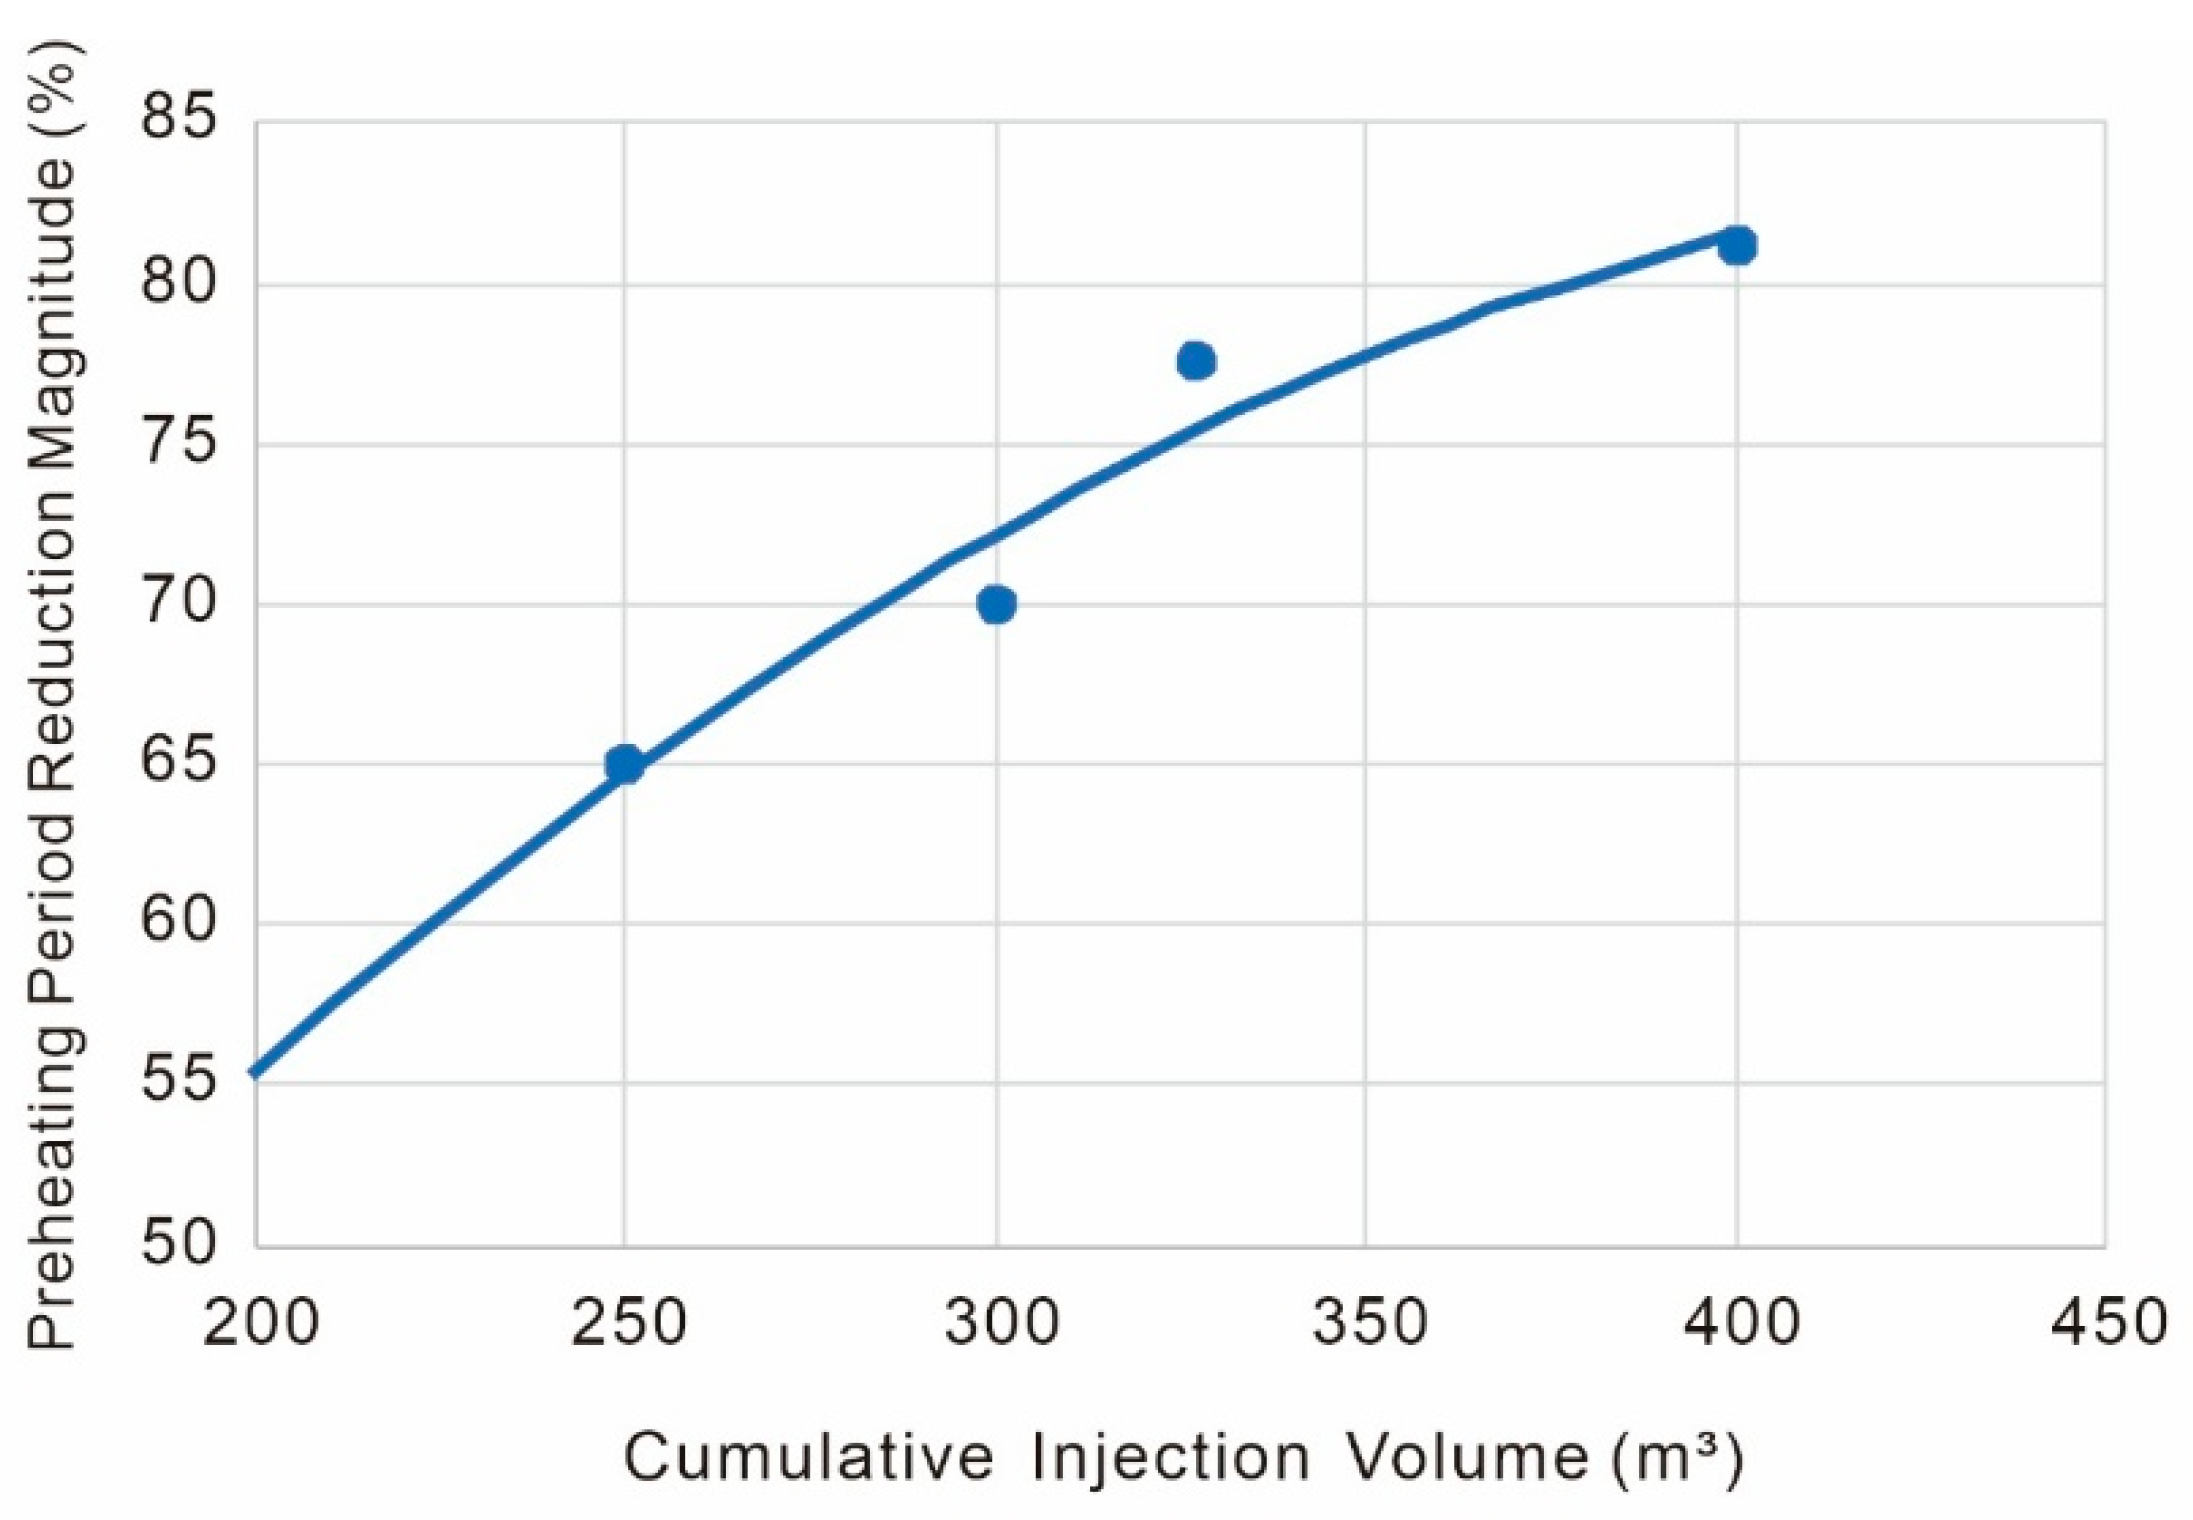
Figure 24 indicates that for conventional oil sands, the preheating period reduction magnitude increases progressively with cumulative injection volume. Hydraulic connectivity is typically established at injection volumes of 270–350 m3, corresponding to a 70–75% reduction in preheating duration. Post-connectivity, continued water injection yields diminishing returns, with the reduction magnitude reaching approximately 82% at ~400 m3 cumulative injection.

Figure 24.
Correlation between cumulative injection volume and preheating period reduction magnitude.
For conventional oil sands, the functional relationships between the preheating period reduction magnitude and (1) CP value, (2) dilation radius, and (3) cumulative injection volume are expressed as follows:
Comprehensively considering the combined effects of CP value, dilation radius, and cumulative injection volume on preheating period reduction magnitude, the weighted average of these three parameters yields
All fitted equations exhibit correlation coefficients around 0.95, indicating excellent fitting quality. There is a 95% probability that the CP value, dilation radius, and cumulative injection volume of conventional oil sands follow downward-opening parabolic relationships with preheating period reduction duration.
It should be noted that Equations (47)–(49) all represent downward-opening parabolas. The axes of symmetry for these parabolas correspond to the critical CP value, critical dilation radius, and critical cumulative injection volume of conventional oil sands, respectively. At these critical thresholds, the preheating period reduction magnitude reaches its maximum, beyond which the reduction effect gradually diminishes. Evidently, the position of the parabolic symmetry axis (i.e., the critical value) depends on factors such as the quantity and quality of fitted data points, as well as oil sand classification granularity. More numerous, accurate data points and refined classification lead to more precise critical values. The same principle applies to subsequent Equations (51)–(53).
5.2. Prediction of Preheating Period Reduction Magnitude for Unconventional Oil Sands
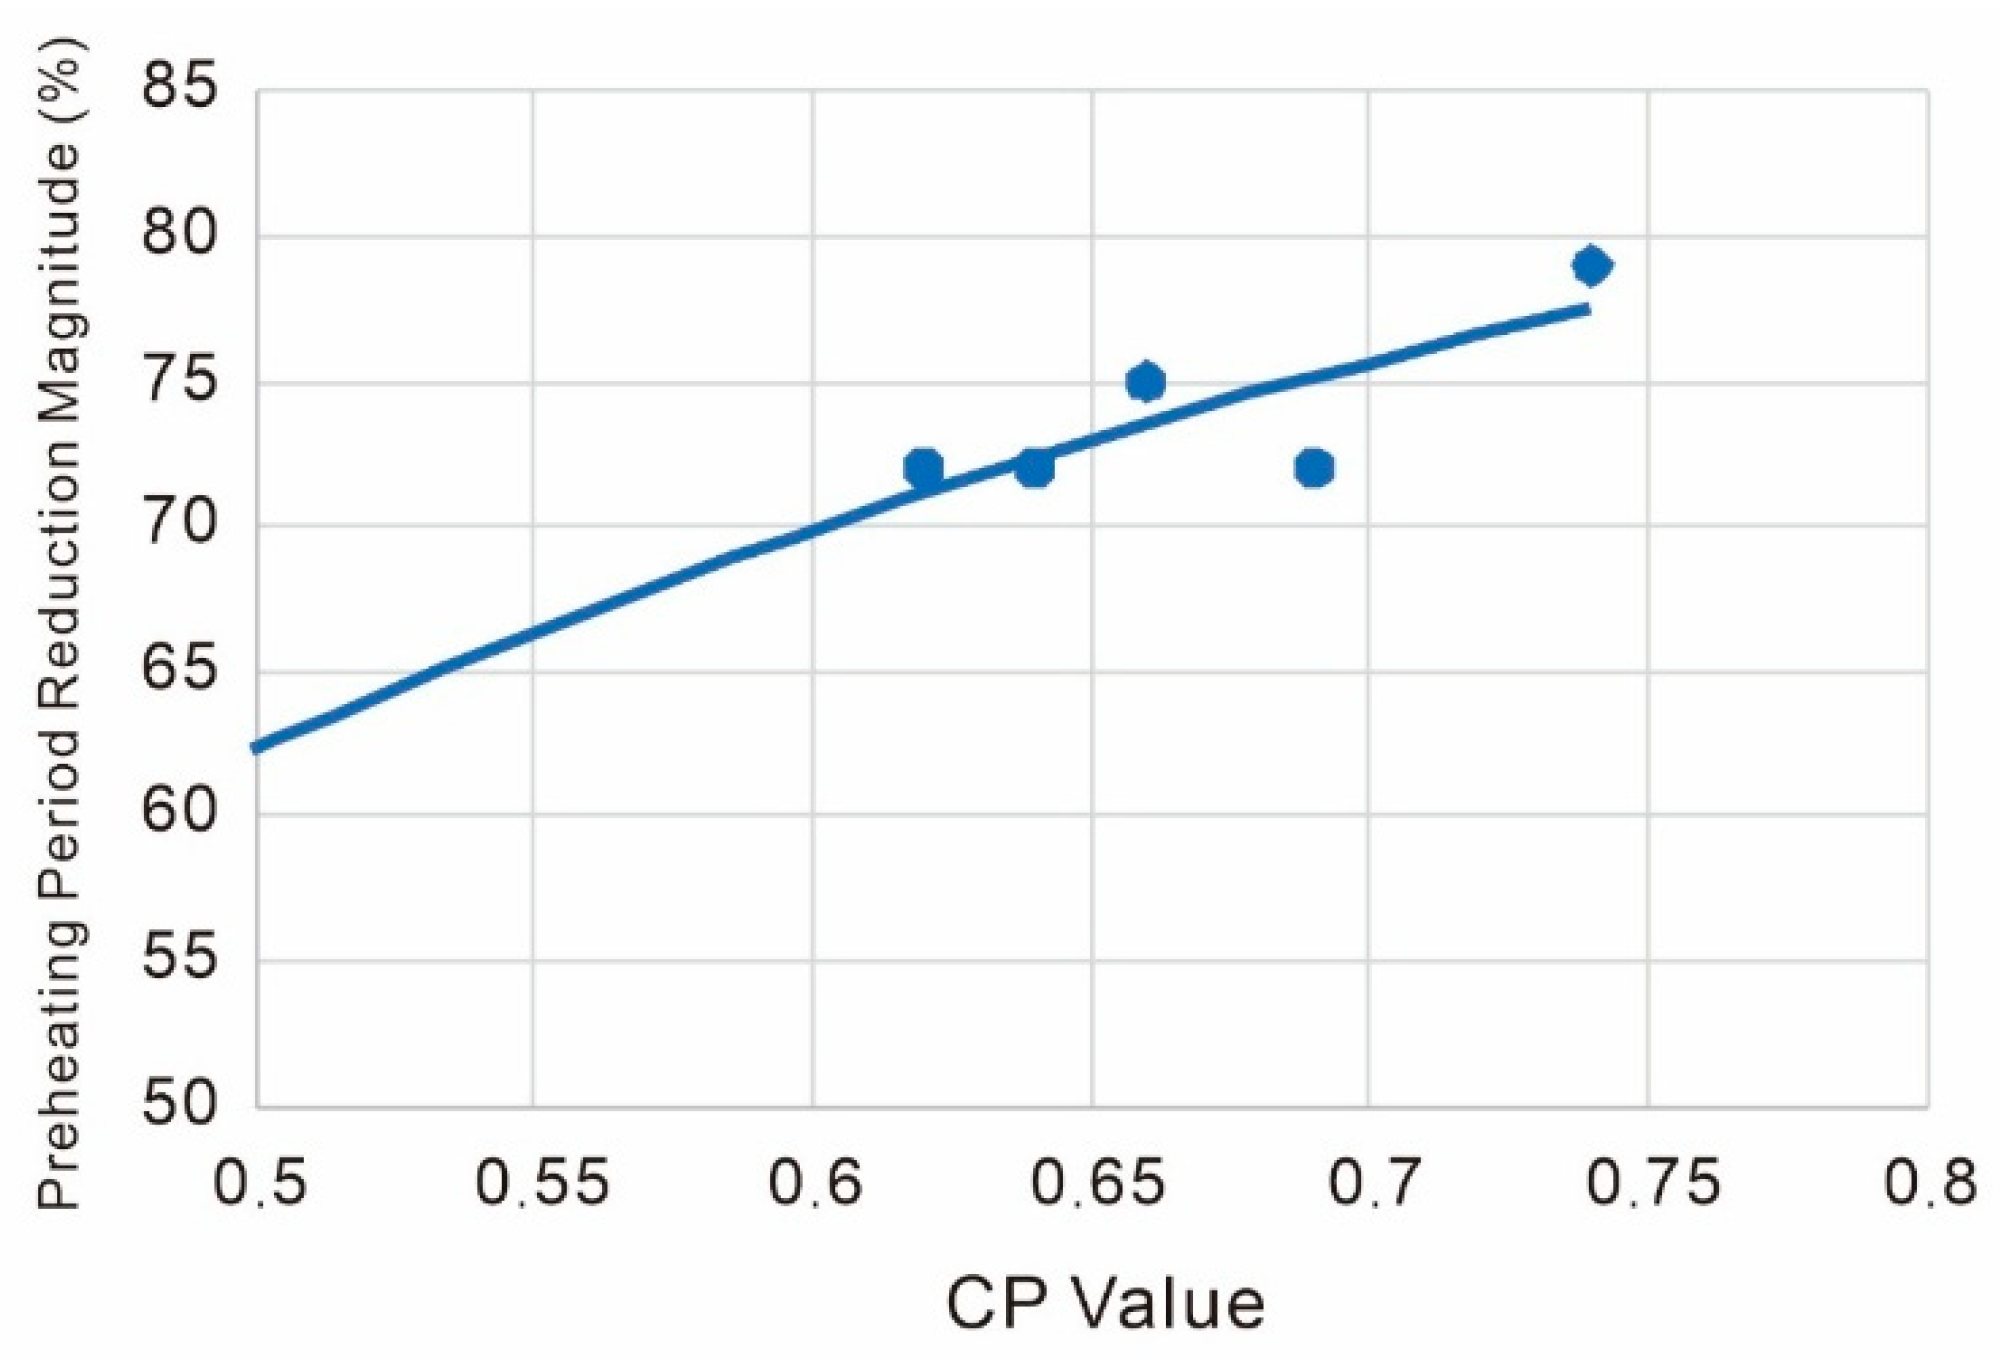
Figure 25 demonstrates that for unconventional oil sands, the preheating period reduction magnitude progressively increases with rising CP values. With hydraulic connectivity coefficients ranging between 0.62 and 0.66, micro-fracturing operations can reduce the preheating period to approximately 73% of its original duration at connectivity establishment—a greater reduction compared to conventional oil sands. Post-connectivity, continued water injection leads to gradually diminishing returns, achieving about 79% reduction at CP ≈ 0.75.

Figure 25.
Correlation between CP value and preheating period reduction magnitude in unconventional oil sands.
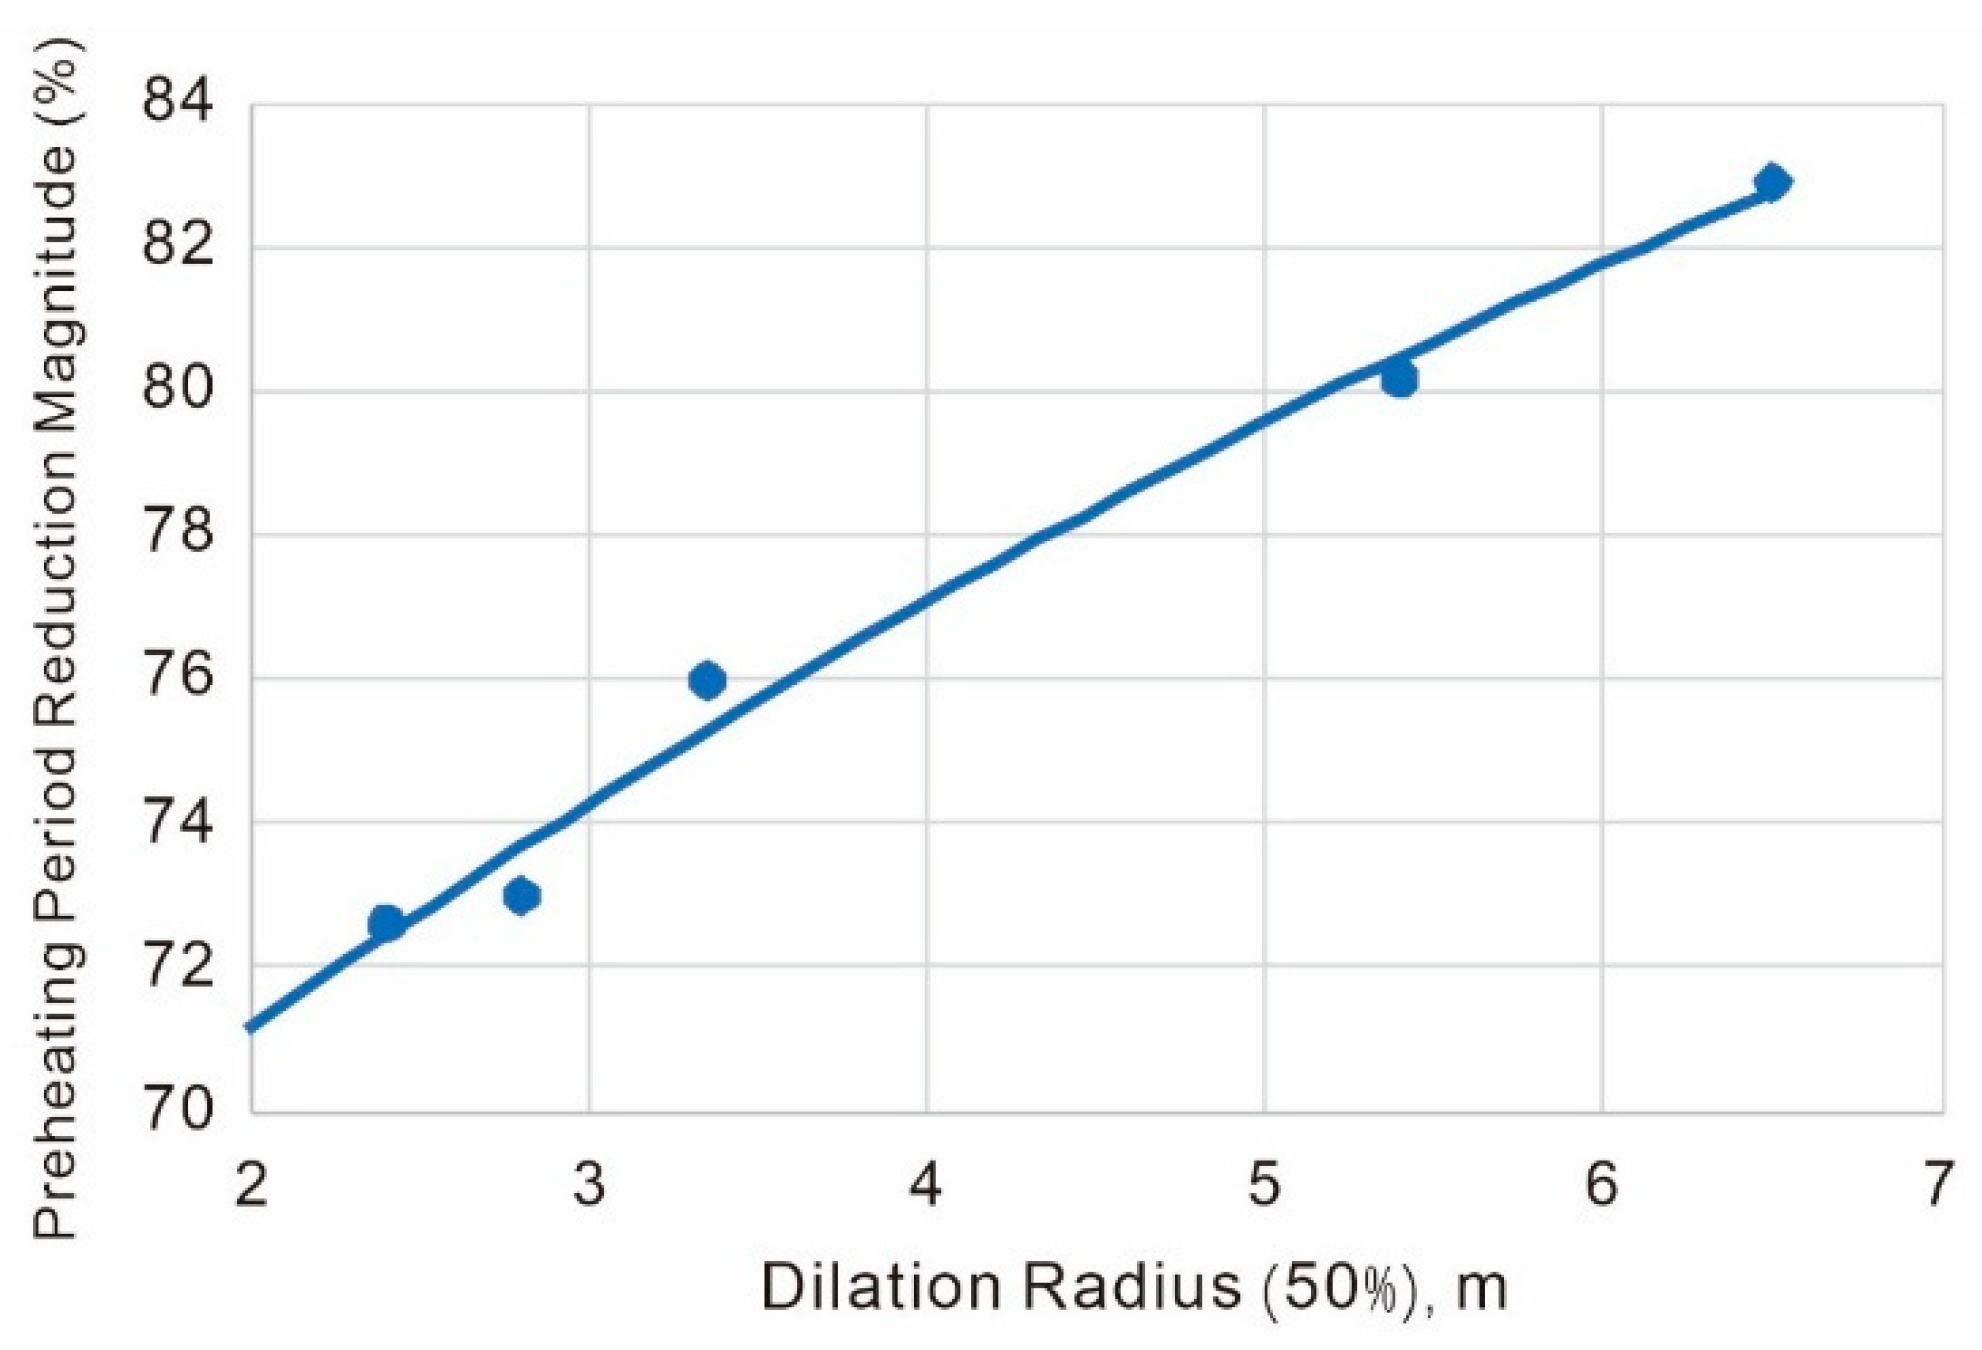
Figure 26 reveals that for unconventional oil sands, the preheating period reduction magnitude increases progressively with dilation radius expansion. Hydraulic connectivity establishment typically occurs at dilation radii of 3–4 m, corresponding to a 74–77% reduction magnitude. Further radius increase yields diminishing returns, with an ~83% reduction achieved at the critical radius of ≈6.5 m.

Figure 26.
Relationship between dilation radius and preheating period reduction magnitude in unconventional oil sands.
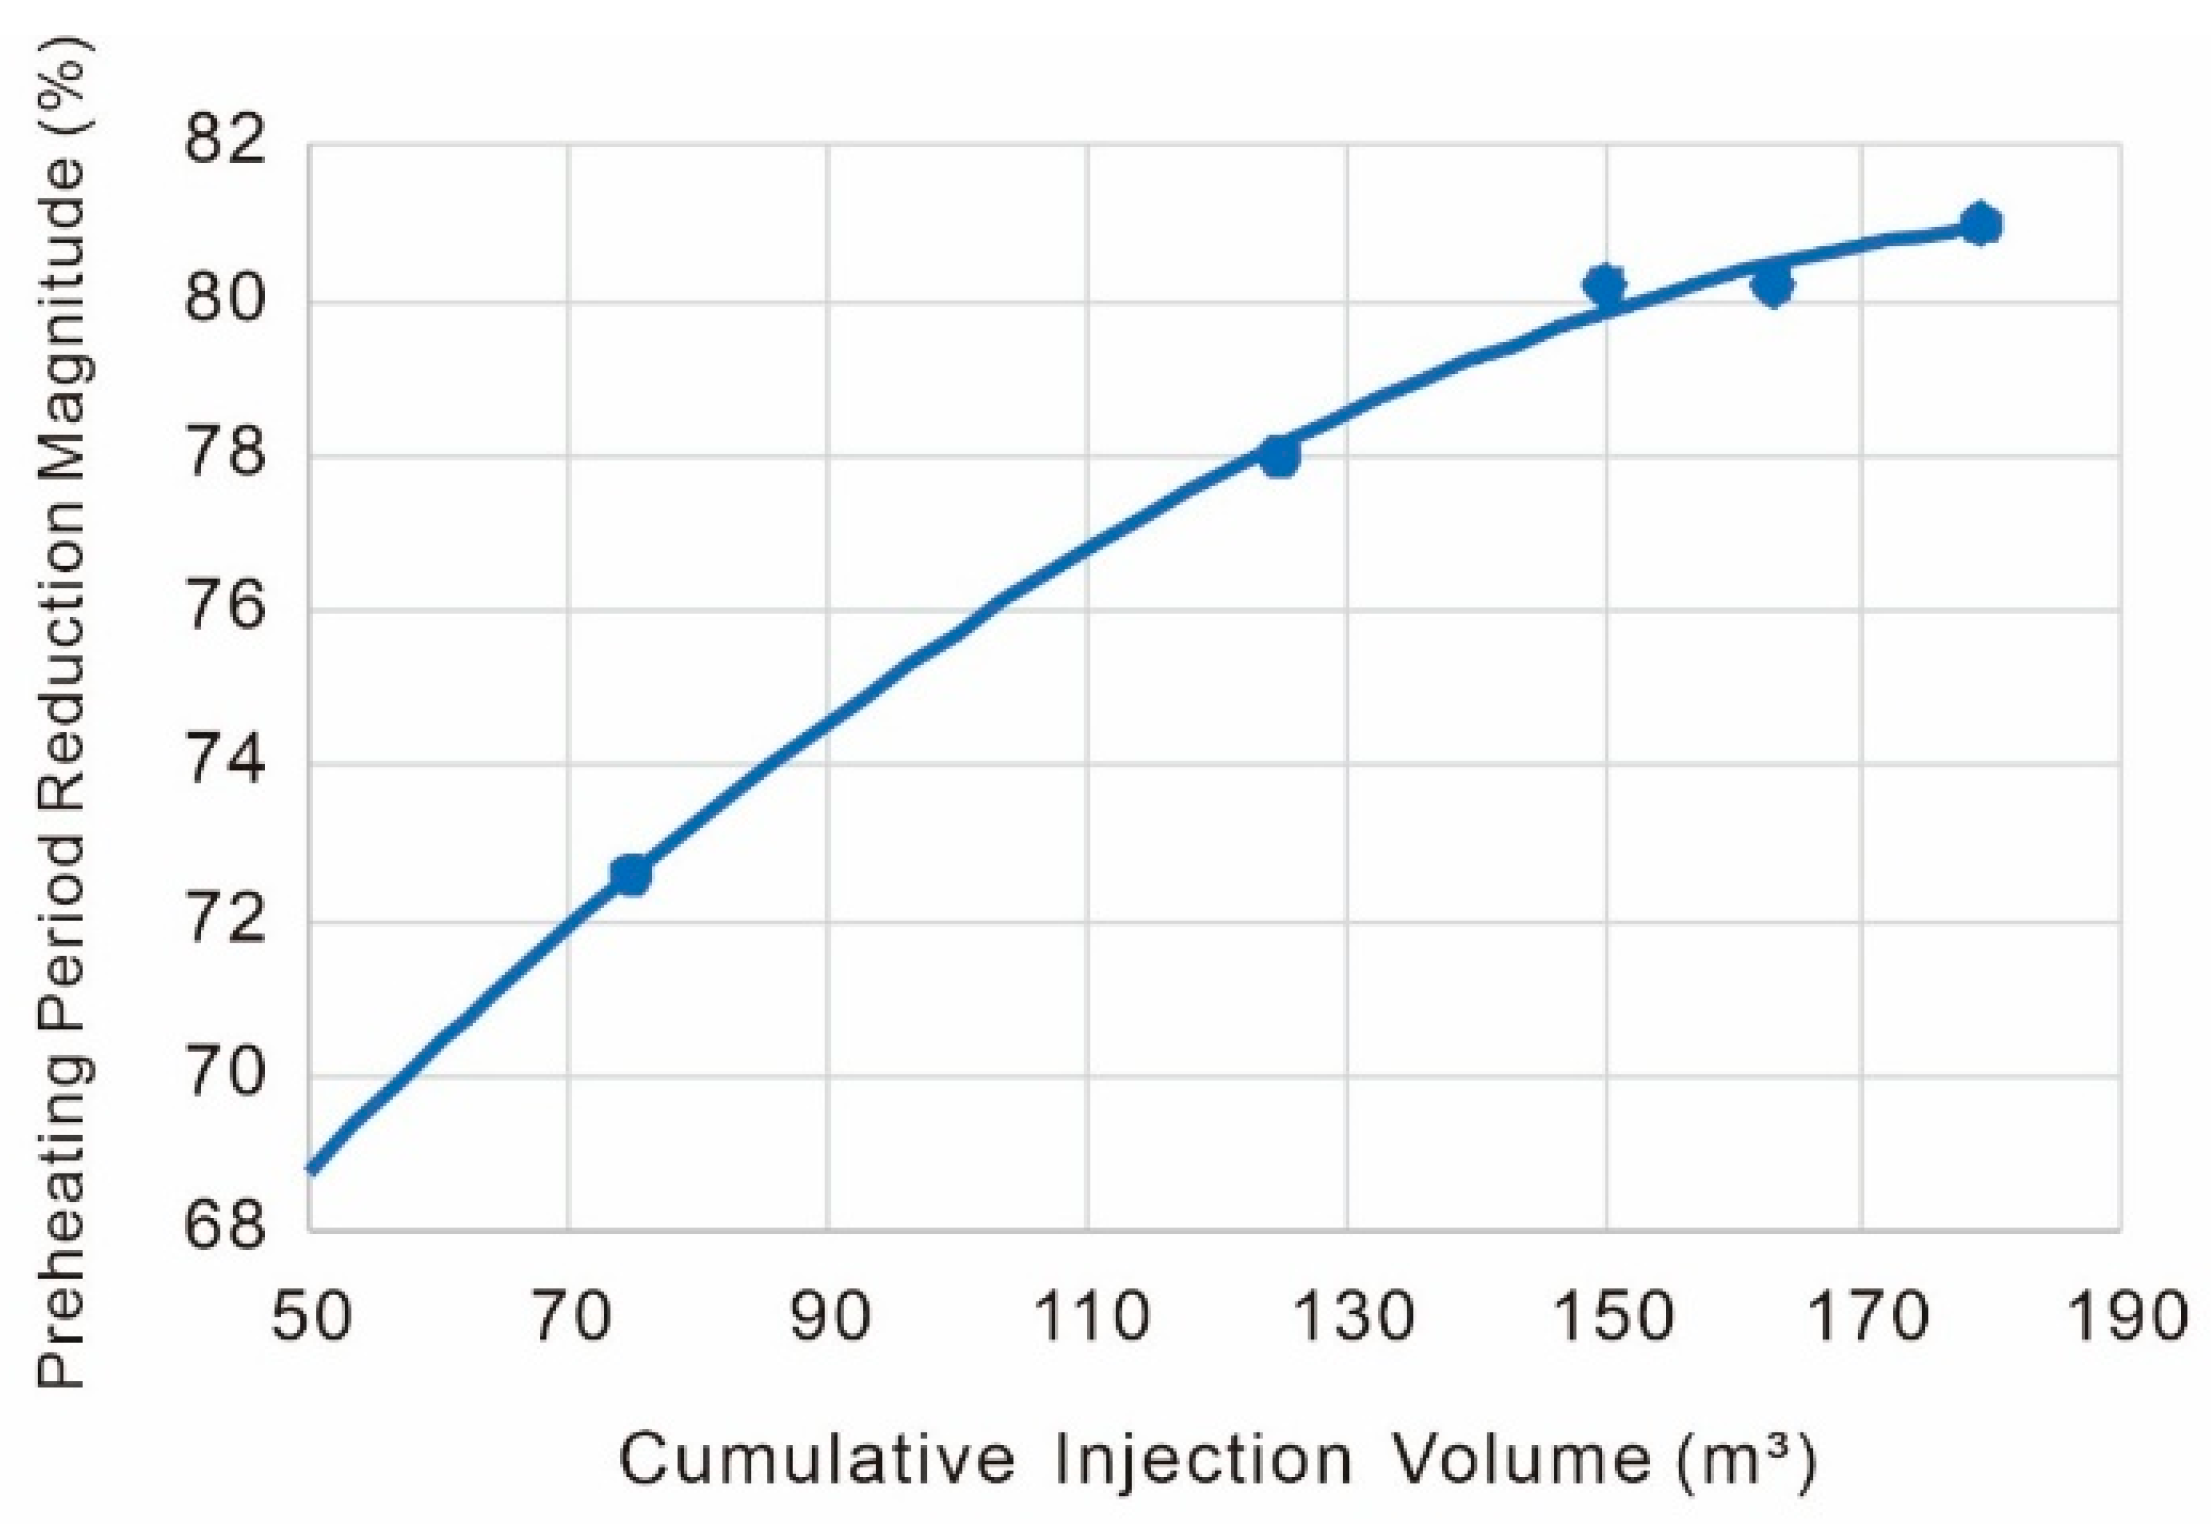
As shown in Figure 27, for unconventional oil sands, the preheating period reduction magnitude gradually increases with rising injection volume. These sands achieve hydraulic connectivity at significantly lower cumulative injection volumes—a 76% reduction magnitude occurs at just 100 m3. Post-connectivity water injection produces diminishing returns, with the reduction magnitude reaching only ~81% at ≈190 m3 cumulative injection.

Figure 27.
Correlation between cumulative injection volume and preheating period reduction magnitude in unconventional oil sands.
For unconventional oil sands, the functional relationships between preheating period reduction magnitude and CP value, dilation radius, and cumulative injection volume are expressed as follows:
By comprehensively considering the combined effects of the CP value, dilation radius, and cumulative injection volume on the preheating period reduction magnitude, the integrated weighted average of these three parameters yields
The fitted equations exhibit correlation coefficients (R2) of approximately 0.95, indicating excellent goodness-of-fit. For unconventional oil sands, there is a 95% probability that the relationships between the preheating period reduction duration and CP value, dilation radius, and cumulative injection volume follow downward-opening parabolic functions.
In summary, we have established generalized relationships between dilation evaluation parameters—CP value, dilation radius, and cumulative injection volume—and preheating period reduction magnitude. For field applications, first, we should input geological data (reservoir characteristics, well completion parameters, geomechanical properties, flow parameters, and operational data) according to the actual situation, and compute the target well’s CP value, dilation radius, and cumulative injection volume through either rapid software estimation or detailed modeling; then, we can apply Equations (47)–(54) or utilize the nomographs in Figure 22, Figure 23, Figure 24, Figure 25, Figure 26 and Figure 27 for parameter estimation. To holistically account for all three dilation parameters’ combined effects, the final reduction magnitude is obtained through weighted averaging of individual results.
It should be particularly noted that during historical data fitting, reservoir classification into two broad categories—conventional and unconventional oil sands—was adopted to differentiate micro-fracturing-induced cycle reduction magnitudes. Although Section 5 originally categorized oil sands into three types (conventional, (clay-rich) argillaceous, and (oil-rich) bituminous) when analyzing total injection volume effects on CP value and dilation radius, closer examination reveals nearly identical coefficients in the fitting equations for the latter two. Given limited data points, these two subtypes can be rationally consolidated into a single category for holistic analysis.
The accuracy of historical data fitting formulas improves with increasing measured data points. For cases like Well FHW325U in Block 1 (bituminous oil sand reservoir) and Well FHW3061 in Block 18 (clay-rich argillaceous oil sand reservoir), establishing reliable fitting relationships based solely on one or two wells’ historical data proves challenging. As micro-fracturing operations expand across diverse oil sand reservoirs, more datasets from various reservoir types will become available. This enables more precise reservoir classification using the aforementioned methodology, followed by the selection of optimal fitting approaches to establish the influence of dilation evaluation parameters on preheating period reduction magnitude.
6. Conclusions and Recommendations
- (1)
- As bitumen content increases, the dilation effectiveness of micro-fracturing in oil sands progressively deteriorates, with more pronounced deterioration trends observed in low-clay-content formations. Field operation recommendations: For low-bitumen oil sands (e.g., conventional oil sands), micro-fracturing demonstrates significant dilation effects; while for high-bitumen oil sands, it still achieves satisfactory dilation performance.
- (2)
- Increasing clay content reduces micro-fracturing effectiveness, particularly in high-bitumen oil sands. Field recommendation: Implement multi-stage pressure elevation protocols for clay-rich oil sands (e.g., argillaceous oil sands) during operations.
- (3)
- Elevated heavy oil viscosity enhances hydraulic connectivity coefficient and dilation radius while moderately reducing cumulative injection volume. Field implication: Higher viscosity reservoirs exhibit superior micro-fracturing response. The Fengcheng oil sands (with in situ viscosity >106 mPa·s at reservoir temperature) in particular demonstrate the necessity of micro-fracturing.
- (4)
- Under identical injection volumes, the dilation radius follows the order of (clay-rich) argillaceous > (oil-rich) bituminous > conventional oil sands, consistent with CP value trends. For conventional oil sands, preheating period reduction magnitude increases with injection volume, achieving 70–75% reduction at the hydraulic connectivity threshold (270–350 m3 cumulative injection).
Future research should integrate advanced structural deformation analyses [10,19] to further refine micro-fracturing models, particularly for reservoirs with strike-slip fault systems [27].
Author Contributions
Conceptualization, S.W. and D.L.; Methodology, W.L.; Software, W.L. and C.Z.; Validation, Y.W.; Formal analysis, S.W., Y.W., C.Z. and D.L.; Investigation, S.W. and J.C.; Resources, J.C. and J.Z.; Data curation, Y.W.; Writing—original draft, S.W.; Writing—review & editing, Y.Z., D.L. and Y.G.; Visualization, S.W. and Y.Z.; Supervision, R.W., D.L. and Y.G.; Project administration, R.W. and Y.G.; Funding acquisition, J.Z. and Y.G. All authors have read and agreed to the published version of the manuscript.
Funding
This research was funded by the National Natural Science Foundation of China (grant number 52204048) and the Key Research and Development Program of Shaanxi (grant number 2025CY-YBXM-164).
Data Availability Statement
The original contributions presented in this study are included in the article. Further inquiries can be directed to the corresponding authors.
Acknowledgments
Acknowledgments to Xinjiang Oilfield Company for providing relevant data.
Conflicts of Interest
The authors declare no conflicts of interest.
Appendix A

Table A1.
Data table of correspondence between bitumen content and controllable rock parameters.
Table A1.
Data table of correspondence between bitumen content and controllable rock parameters.
| Stratum | Asphaltene Content | Clay Content | Elastic Parameters | Plastic Parameters | Hardening (or Softening) Shape | Petrophysical Parameters | ||||||
|---|---|---|---|---|---|---|---|---|---|---|---|---|
| Conventional Oil Sands | 8.5 | 8.2 | E (MPa) | 652 | β | 45 | σy (MPa) | 2.047 | εp | 0 | φ0 | 0.25 |
| ν | 0.3 | K | 1.0 | 3.746 | 0.0064 | k0 (mD) | 0.977 | |||||
| ψ | 25 | 2.624 | 0.04 | |||||||||
| Clay-Rich Oil Sands | 9.1 | 21.5 | E (MPa) | 255 | β | 45 | σy (MPa) | 2.047 | εp | 0 | φ0 | 0.17 |
| ν | 0.3 | K | 1.0 | 3.746 | 0.0064 | k0 (mD) | 0.121 | |||||
| ψ | 25 | 2.624 | 0.04 | |||||||||
| Bitumen-Rich Oil Sands | 13.7 | 6.7 | E (MPa) | 652 | β | 45 | σy (MPa) | 2.047 | εp | 0 | φ0 | 0.23 |
| ν | 0.4 | K | 1.0 | 3.746 | 0.0064 | k0 (mD) | 0.295 | |||||
| ψ | 25 | 2.624 | 0.04 | |||||||||
Table A2.
Quantitative changes in permeability, argillaceous content, and asphaltene content.
Table A2.
Quantitative changes in permeability, argillaceous content, and asphaltene content.
| Argillaceous Content | Asphaltene Content | Initial Permeability |
|---|---|---|
| 5 | 6 | 1.13 |
| 5 | 10 | 0.82 |
| 5 | 14 | 0.72 |
| 10 | 6 | 0.76 |
| 10 | 10 | 0.45 |
| 10 | 14 | 0.35 |
| 15 | 6 | 0.55 |
| 15 | 10 | 0.24 |
| 15 | 14 | 0.14 |
| 20 | 6 | 0.53 |
| 20 | 10 | 0.22 |
| 20 | 14 | 0.12 |
Table A3.
Parameter design table for experiments on bitumen–clay content effects on dilation behavior.
Table A3.
Parameter design table for experiments on bitumen–clay content effects on dilation behavior.
| Experimental Serial Number | Bitumen Content (%) | Clay Content (%) | Elastic Parameters | Petrophysical Parameters | ||
|---|---|---|---|---|---|---|
| Elastic Modulus (MPa) | Poisson’s Ratio | Initial Porosity (%) | Initial Permeability (mD) | |||
| 1 | 8 | 8 | 679 | 0.3 | 17.55 | 0.60 |
| 2 | 8 | 14 | 950 | 0.23 | 15.61 | 0.67 |
| 3 | 8 | 20 | 1221 | 0.20 | 10.89 | 0.29 |
| 4 | 10 | 8 | 568 | 0.32 | 20.04 | 0.75 |
| 5 | 10 | 14 | 839 | 0.25 | 18.10 | 0.82 |
| 6 | 10 | 20 | 1110 | 0.23 | 13.37 | 0.43 |
| 7 | 12 | 8 | 457 | 0.35 | 19.98 | 0.68 |
| 8 | 12 | 14 | 728 | 0.28 | 18.04 | 0.74 |
| 9 | 12 | 20 | 999 | 0.25 | 13.31 | 0.36 |
Table A4.
Operational parameter design table for Well FHW3055 in Block 18.
Table A4.
Operational parameter design table for Well FHW3055 in Block 18.
| Pressure Application Method and Injection Time | Wellhead Pressure of I-Well and P-Well (kPa) | ||
|---|---|---|---|
| Pressure Application Method | Injection Time (min) | I-well | P-well |
| Continuous steady pressure | 3780 | 1800 | 1600 |
Table A5.
Experimental results of bitumen–clay content effects on dilation behavior.
Table A5.
Experimental results of bitumen–clay content effects on dilation behavior.
| Experimental Serial Number | Influencing Factors | Evaluation Metrics for Reservoir Stimulation | ||||||
|---|---|---|---|---|---|---|---|---|
| Bitumen Content (%) | Clay Content (%) | Hydraulic Connectivity Coefficient | Stimulation Radius | Cumulative Injection Volume (m3) | ||||
| Ra | Rb | |||||||
| Ra (50%) | Ra (70%) | Rb (50%) | Rb (70%) | |||||
| 1 | 8 | 8 | 0.72 | 5.46 | 2.8 | 4.58 | 2.51 | 257 |
| 2 | 8 | 14 | 0.65 | 4.46 | 2.61 | 3.66 | 2.08 | 169 |
| 3 | 8 | 20 | 0.61 | 3.84 | 2.49 | 3.09 | 1.82 | 112 |
| 4 | 10 | 8 | 0.67 | 4.78 | 2.67 | 3.95 | 2.22 | 176 |
| 5 | 10 | 14 | 0.6 | 3.75 | 2.48 | 3.01 | 1.78 | 102 |
| 6 | 10 | 20 | 0.56 | 3.14 | 2.36 | 2.44 | 1.51 | 57 |
| 7 | 12 | 8 | 0.65 | 4.5 | 2.83 | 3.8 | 2.58 | 160 |
| 8 | 12 | 14 | 0.59 | 3.6 | 2.64 | 2.9 | 2.14 | 95 |
| 9 | 12 | 20 | 0.55 | 3 | 2.52 | 2.3 | 1.87 | 50 |
Table A6.
Parameter design table for experiments on heavy oil viscosity effects on dilation behavior.
Table A6.
Parameter design table for experiments on heavy oil viscosity effects on dilation behavior.
| Test ID | Heavy Oil Viscosity at 50 °C (mPa·s) | Elastic Modulus E (MPa) | Poisson’s Ratio | Yield Strength (MPa) |
|---|---|---|---|---|
| 1 | 10,000 | 425 | 0.47 | 2.48 |
| 2 | 20,000 | 479 | 0.45 | 2.79 |
| 3 | 40,000 | 529 | 0.44 | 3.08 |
| 4 | 80,000 | 576 | 0.42 | 3.35 |
| 5 | 160,000 | 620 | 0.41 | 3.61 |
| 6 | 320,000 | 661 | 0.40 | 3.85 |
Table A7.
Pre-optimization operational parameter design table for Well FHW3055 in Block 18.
Table A7.
Pre-optimization operational parameter design table for Well FHW3055 in Block 18.
| Pressure Application Method and Injection Duration | Wellhead Pressure at I-Well and P-Well (kPa) | ||
|---|---|---|---|
| Pressure Application Method | Injection Duration (min) | I-Well | P-Well |
| Stepwise Pressure increase | 0–1440 | 700 | 700 |
| 1440–2820 | 1680 | 1680 | |
| 2820–3780 | 2016 | 2016 | |
| 3780–4580 | 2620.8 | 2620.8 | |
Table A8.
Experimental parameter design table for investigating the influence of heavy oil viscosity on dilation effects.
Table A8.
Experimental parameter design table for investigating the influence of heavy oil viscosity on dilation effects.
| Test ID | Heavy Oil Viscosity (mPa·s) | Hydraulic Connectivity Coefficient | Dilation Radius | Cumulative Injection Volume (m3) | |
|---|---|---|---|---|---|
| Ra (50%) | Rb (50%) | ||||
| 1 | 10,000 | 0.75 | 5.3 | 4.6 | 484 |
| 2 | 20,000 | 0.75 | 5.6 | 5.1 | 468 |
| 3 | 40,000 | 0.76 | 5.9 | 5.4 | 455 |
| 4 | 80,000 | 0.76 | 6.2 | 5.7 | 443 |
| 5 | 160,000 | 0.77 | 6.5 | 6.0 | 432 |
| 6 | 320,000 | 0.77 | 6.9 | 6.3 | 423 |
Table A9.
Table of cyclic preheating period variations before and after micro-fracturing.
Table A9.
Table of cyclic preheating period variations before and after micro-fracturing.
| Block | Well ID | Reservoir Type | Rapid Cyclic Preheating Period (days) | Conventional Preheating Period (days) | Reduction Percentage (%) |
|---|---|---|---|---|---|
| Zhong-1 Well Block | FHW325U | Oil-rich | 36 | 211 | 82.93 |
| FHW327 | Oil-rich | 48 | 77.25 | ||
| Zhong-18 Well Block | FHW3055 | Conventional | 68 | 303 | 77.55 |
| FHW3061 | Clay-rich | 83 | 72.60 | ||
| FHW3076 | Argillaceous | 60 | 80.19 | ||
| FHW3077 | Conventional | 132 | 56.43 | ||
| FHW3078 | Conventional | 93 | 69.30 | ||
| FHW3079 | Conventional | 57 | 81.18 | ||
| FHW3080 | Conventional | 145 | 52.14 | ||
| FHW3083 | Argillaceous | 93 | 69.30 | ||
| FHW3099 | Argillaceous | 60 | 80.19 |
References
- Yuan, Y.; Yang, B.; Xu, B. Fracturing in the Oil-Sands Reservoirs. In Proceedings of the Canadian Unconventional Resources Conference, Calgary, AB, Canada, 15–17 November 2011. [Google Scholar]
- Yuan, X.; Dou, S.; Zhang, J.; Chen, S.; Xu, B. Consideration of geomechanics for in-situ bitumen recovery in Xinjiang, China. In Proceedings of the SPE Heavy Oil Conference-Canada, Calgary, AB, Canada, 11 June 2013. [Google Scholar]
- Lin, B.; Jin, Y.; Chen, S. A criterion for evaluating the efficiency of water injection in oil sand reservoirs. J. Pet. Sci. Eng. 2017, 149, 322–330. [Google Scholar] [CrossRef]
- Xu, B.; Wong, R.C.K. Coupled finite-element simulation of injection well testing in unconsolidated oil sands reservoir. Int. J. Numer. Anal. Methods Geomech. 2013, 37, 3131–3149. [Google Scholar] [CrossRef]
- Sun, X.; Xu, B.; Qian, G.; Li, B. The application of geomechanical SAGD dilation startup in a Xinjiang oil field heavy-oil reservoir. J. Petrol. Sci. Eng. 2021, 196, 107670. [Google Scholar] [CrossRef]
- Azad, A.; Chalaturnyk, R.J. A mathematical improvement to SAGD using geomechanical modelling. J. Can. Pet. Technol. 2010, 49, 53–64. [Google Scholar] [CrossRef]
- Lin, B.; Jin, Y.; Pang, H.; Cerato, A.B. Experimental investigation on dilation mechanics of land-facies Karamay oil sand reservoirs under water injection. Rock Mech. Rock Eng. 2016, 49, 1425–1439. [Google Scholar] [CrossRef]
- Li, P.; Chalaturnyk, R.J. History match of the UTF phase A project with coupled reservoir geomechanical simulation. J. Can. Pet. Technol. 2009, 48, 29–35. [Google Scholar] [CrossRef]
- Wong, R.C.K.; Barr, W.E.; Kry, P.R. Stress-strain response of Cold Lake oil sands. Can. Geotech. J. 1993, 30, 220–235. [Google Scholar] [CrossRef]
- Huang, L.; Liu, C.; Wang, Z.; Zhou, Y.; He, F.; Liu, Y.; Huang, Y. An alternative formation mechanism for strike-slip fault in stable intracratonic basin. J. Struct. Geol. 2025, 191, 105292. [Google Scholar] [CrossRef]
- Deutsch, C.V. Geostatistical Reservoir Modeling; Oxford University Press: New York, NY, USA, 2010. [Google Scholar]
- Fung, L.S.; Buchanan, L.; Wan, R.G. Coupled geomechanical-thermal simulation for deforming heavy-oil reservoirs. J. Can. Pet. Technol. 1994, 33, 22–28. [Google Scholar] [CrossRef]
- Ahmadi, S.; Khormali, A.; Kazemzadeh, Y.; Razmjooie, A. Enhancing dehydration/desalting efficiency of crude oil emulsions through experimental and computational insights. Results Eng. 2024, 12, 103094. [Google Scholar] [CrossRef]
- Fei, K.; Zhang, J. Application of ABAQUS in Geotechnical Engineering; China Water & Power Press: Beijing, China, 2010. [Google Scholar]
- Gao, Y.; Wang, X.; Jiang, H.; Ding, S. Numerically coupled thermo-hydro-mechanical analyses of ultra-heavy oil reservoirs during the micro-fracturing stage. Energies 2022, 15, 3677. [Google Scholar] [CrossRef]
- Nouri, A.; Vaziri, H.; Belhaj, H.; Islam, R. Sand production prediction in oil sands: A new model. SPE J. 2006, 11, 230–238. [Google Scholar]
- Shao, H.; Wang, W.; Sun, Y.; Zhang, L.; Kolditz, O. OpenGeoSys-MATLAB: A unified framework for coupled thermo-hydro-mechanical simulation of energy geostructures. Results Eng. 2024, 22, 103094. [Google Scholar]
- Gao, Y.; Chen, M.; Lin, B.; Jin, Y. Experimental investigation on compressibility of Karamay oil sands under water injection. In Proceedings of the 51st U.S. Rock Mechanics/Geomechanics Symposium, San Francisco, CA, USA, 25–28 June 2017. ARMA-2017-0597. [Google Scholar]
- Huang, L.; Liu, C.; Wang, Z.; Zhou, Y.; Liu, Y.; Li, X.; Yang, L. Abrupt structural deformation changes from the boundary to the interior of a craton basin: Implications for the long-term stability of cratonic blocks. Geol. Soc. Am. Bull. 2025, 137, 825–840. [Google Scholar] [CrossRef]
- Helwany, S. Applied Soil Mechanics: With ABAQUS Applications; John Wiley & Sons, Inc.: Hoboken, NJ, USA, 2007; ISBN 978-0-471-79107-2. [Google Scholar]
- Fjar, E.; Holt, R.M.; Raaen, A.M.; Risnes, R. Petroleum Related Rock Mechanics, 2nd ed.; Elsevier Science: Amsterdam, The Netherlands, 2008. [Google Scholar]
- Chalaturnyk, R.; Scott, J.D. Geomechanics issues of steam assisted gravity drainage. In Proceedings of the SPE International Heavy Oil Symposium, Calgary, AB, Canada, 19–21 June 1995. SPE-30280-MS. [Google Scholar]
- GB/T 23561.9-2009; Methods for Determining the Physical and Mechanical Properties of Coal and Rock—Part 9: Determination Method of Rock Point Load Strength Index. Standards Press of China: Beijing, China, 2009.
- Tian, H.; Kempka, T.; Yu, S.; Ziegler, M. Mechanical Properties of Sandstones Exposed to High Temperature. Rock Mech. Rock Eng. 2016, 49, 321–327. [Google Scholar] [CrossRef]
- Pang, H.; Jin, Y.; Gao, Y. Evaluation of elastic property changes in Karamay oil sand reservoir during thermal stimulation. Energy Sci. Eng. 2019, 7, 1233–1253. [Google Scholar] [CrossRef]
- Lin, B.; Chen, S.; Jin, Y. Evaluation of reservoir deformation induced by water injection in SAGD wells considering formation anisotropy, heterogeneity and thermal effect. J. Pet. Sci. Eng. 2017, 157, 767–779. [Google Scholar] [CrossRef]
- Huang, L.; Liu, C.; Liu, Y.; Zhou, Y.; He, F.; Wang, Z.; Zhang, Y.; Guo, B.; Liang, C. Development model of vertical stratification for the strike-slip fault in the Ordos Basin and its significance. Sci. China Earth Sci. 2025, 68, 1497–1510. [Google Scholar] [CrossRef]
Disclaimer/Publisher’s Note: The statements, opinions and data contained in all publications are solely those of the individual author(s) and contributor(s) and not of MDPI and/or the editor(s). MDPI and/or the editor(s) disclaim responsibility for any injury to people or property resulting from any ideas, methods, instructions or products referred to in the content. |
© 2025 by the authors. Licensee MDPI, Basel, Switzerland. This article is an open access article distributed under the terms and conditions of the Creative Commons Attribution (CC BY) license (https://creativecommons.org/licenses/by/4.0/).