

Predicting the Compressive Strength of Concrete Incorporating Olivine Aggregate at Varied Cement Dosages Using Artificial Intelligence


Abstract
1. Introduction
2. Significance of This Study
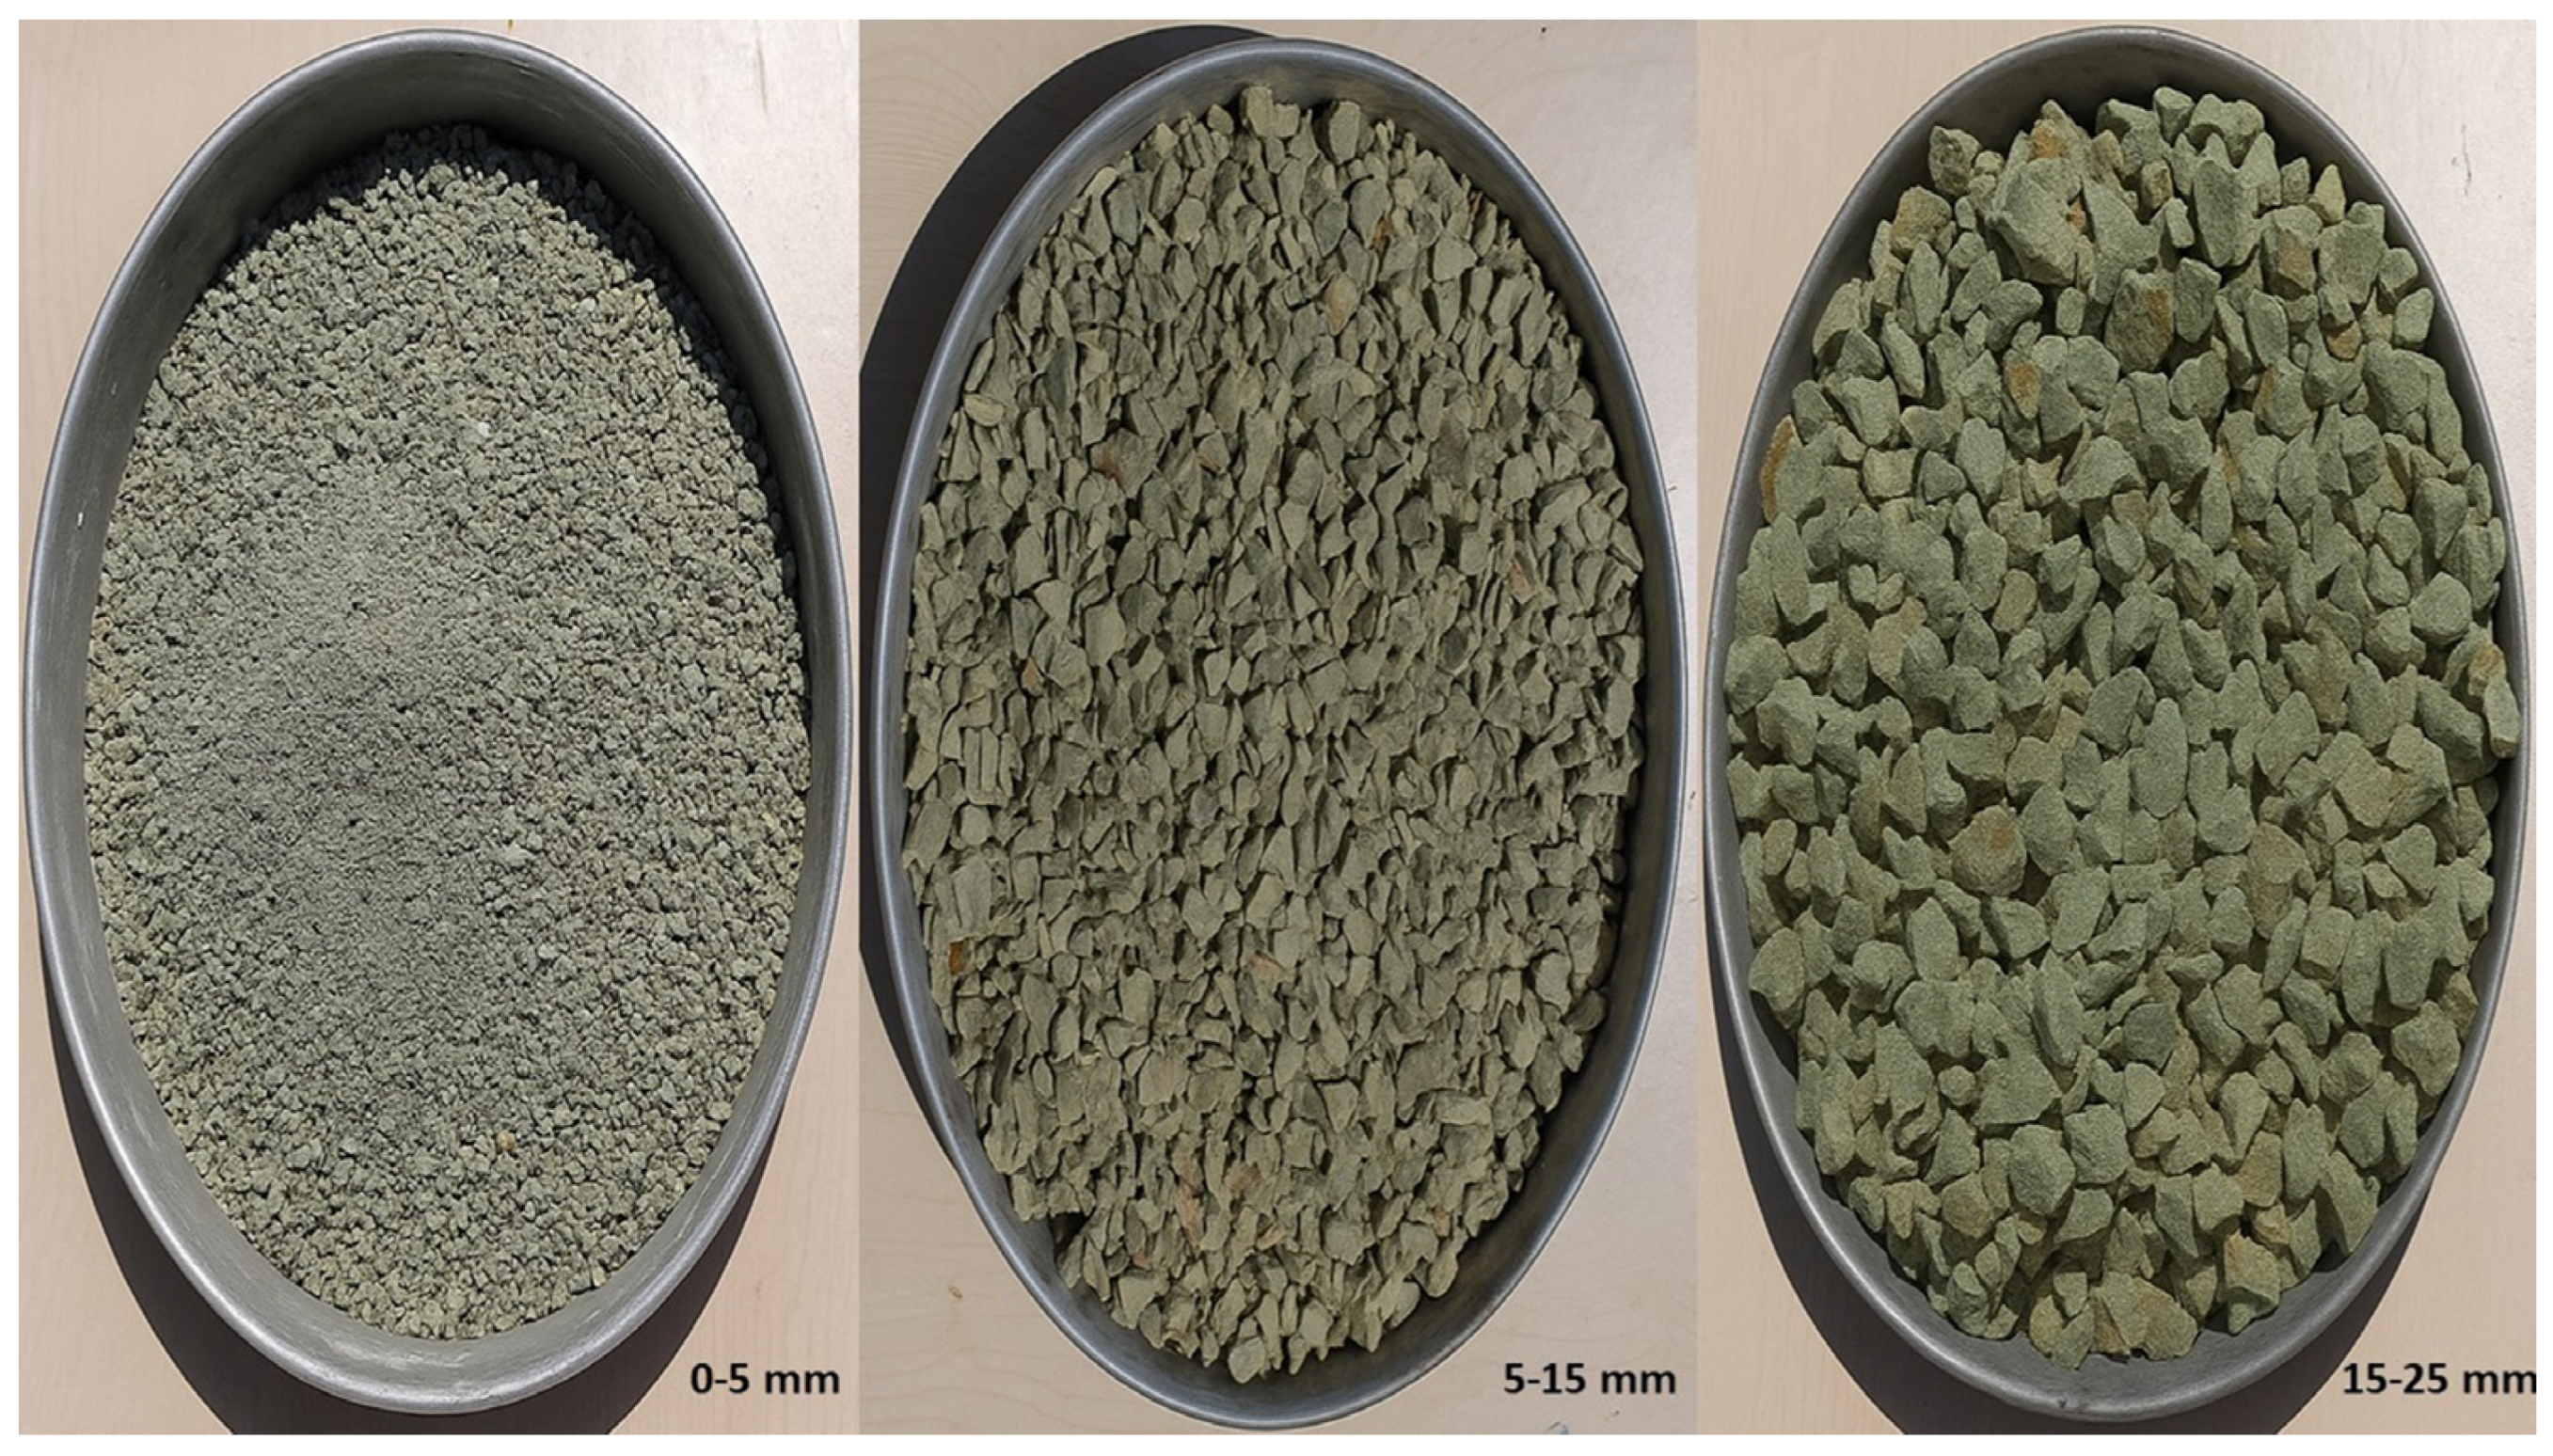
3. Methodology
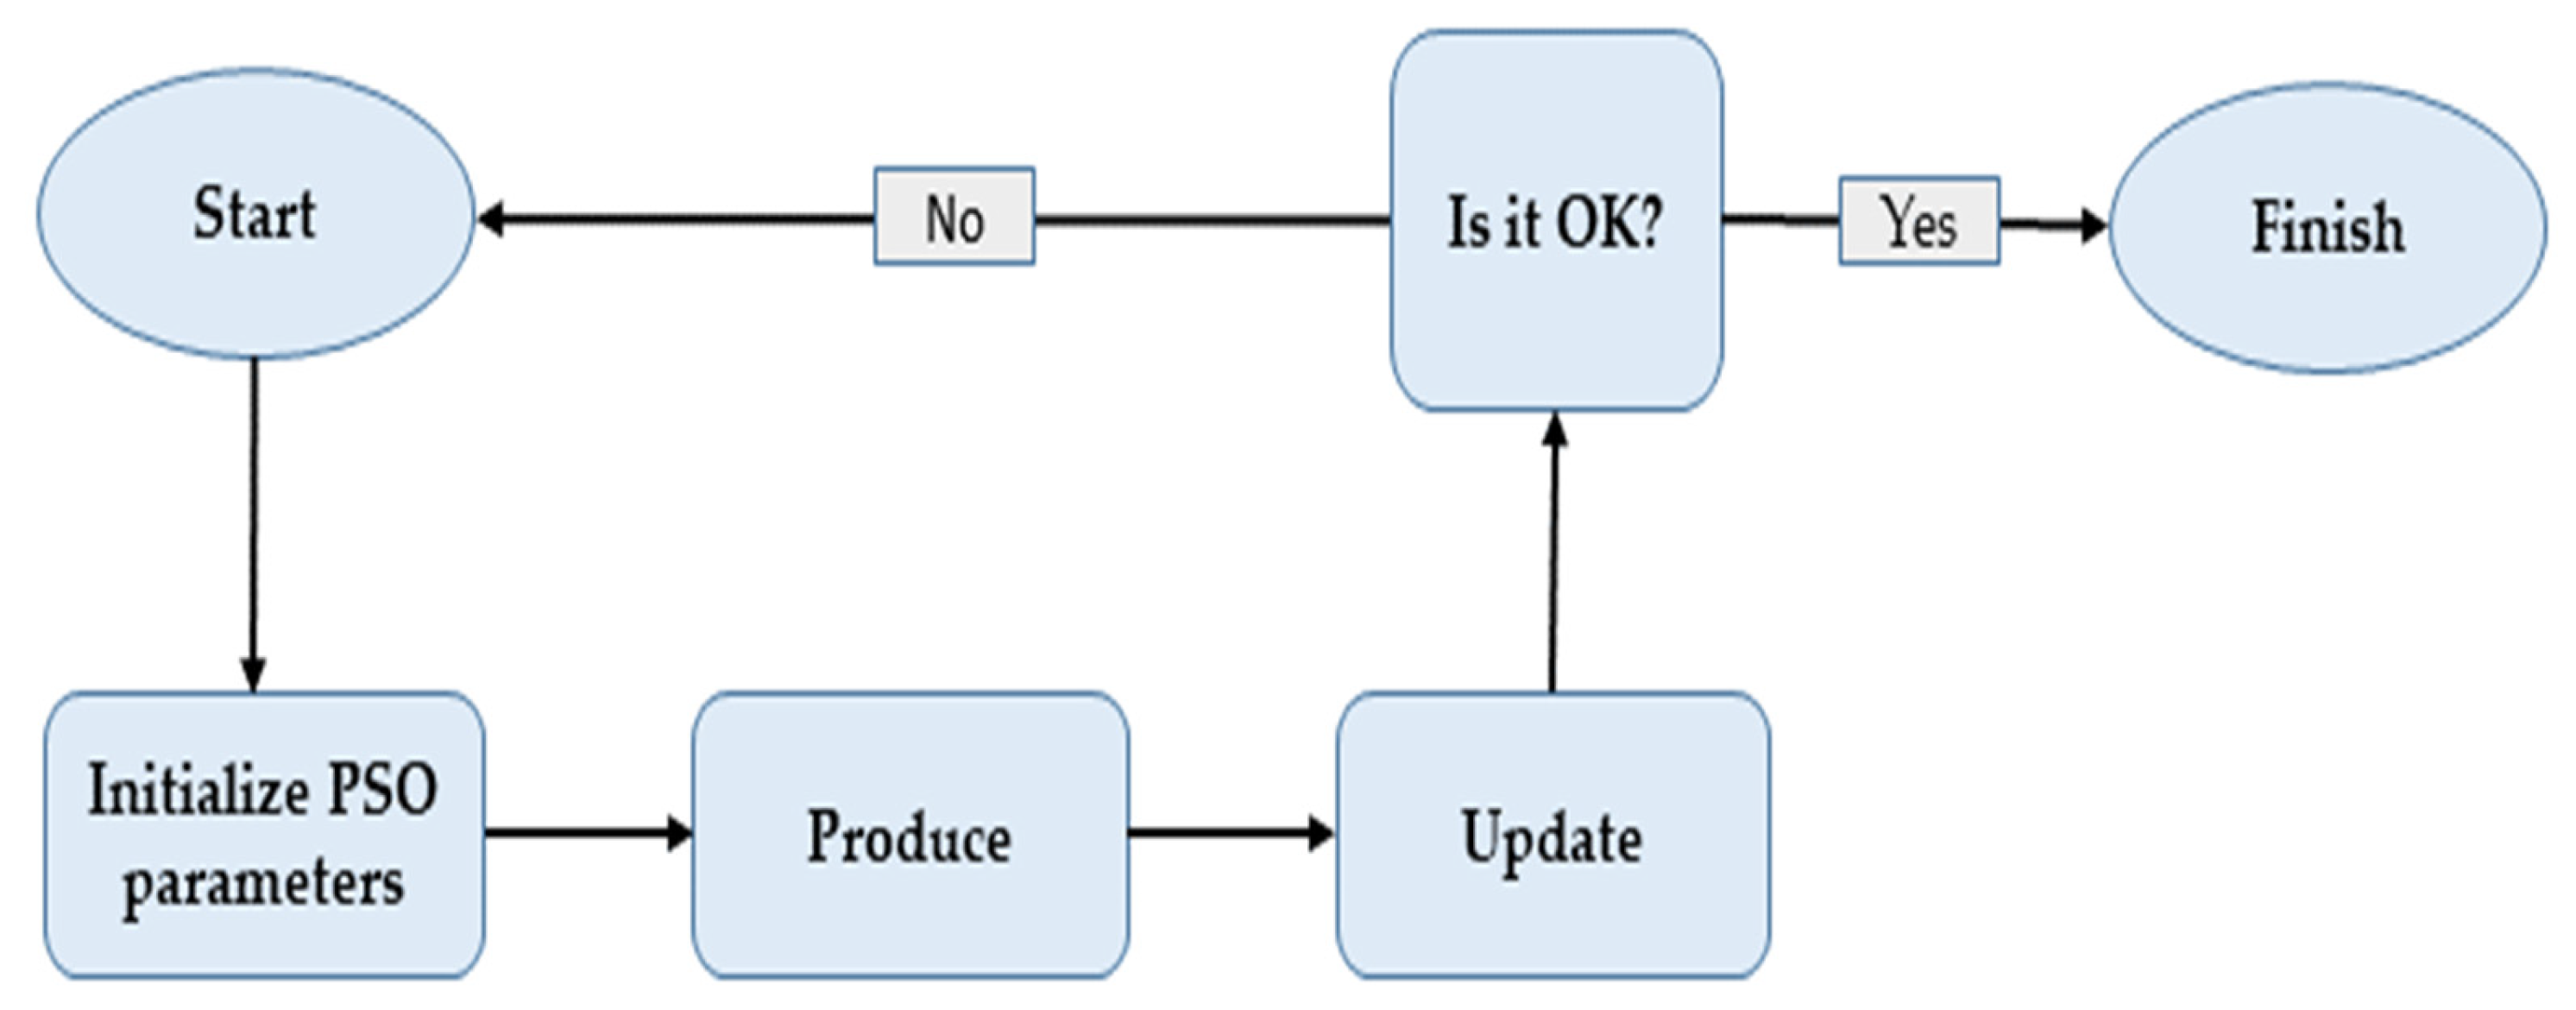
3.1. Particle Swarm Optimization (PSO)
3.2. Artificial Neural Network (ANN)
3.3. Evaluation Criteria
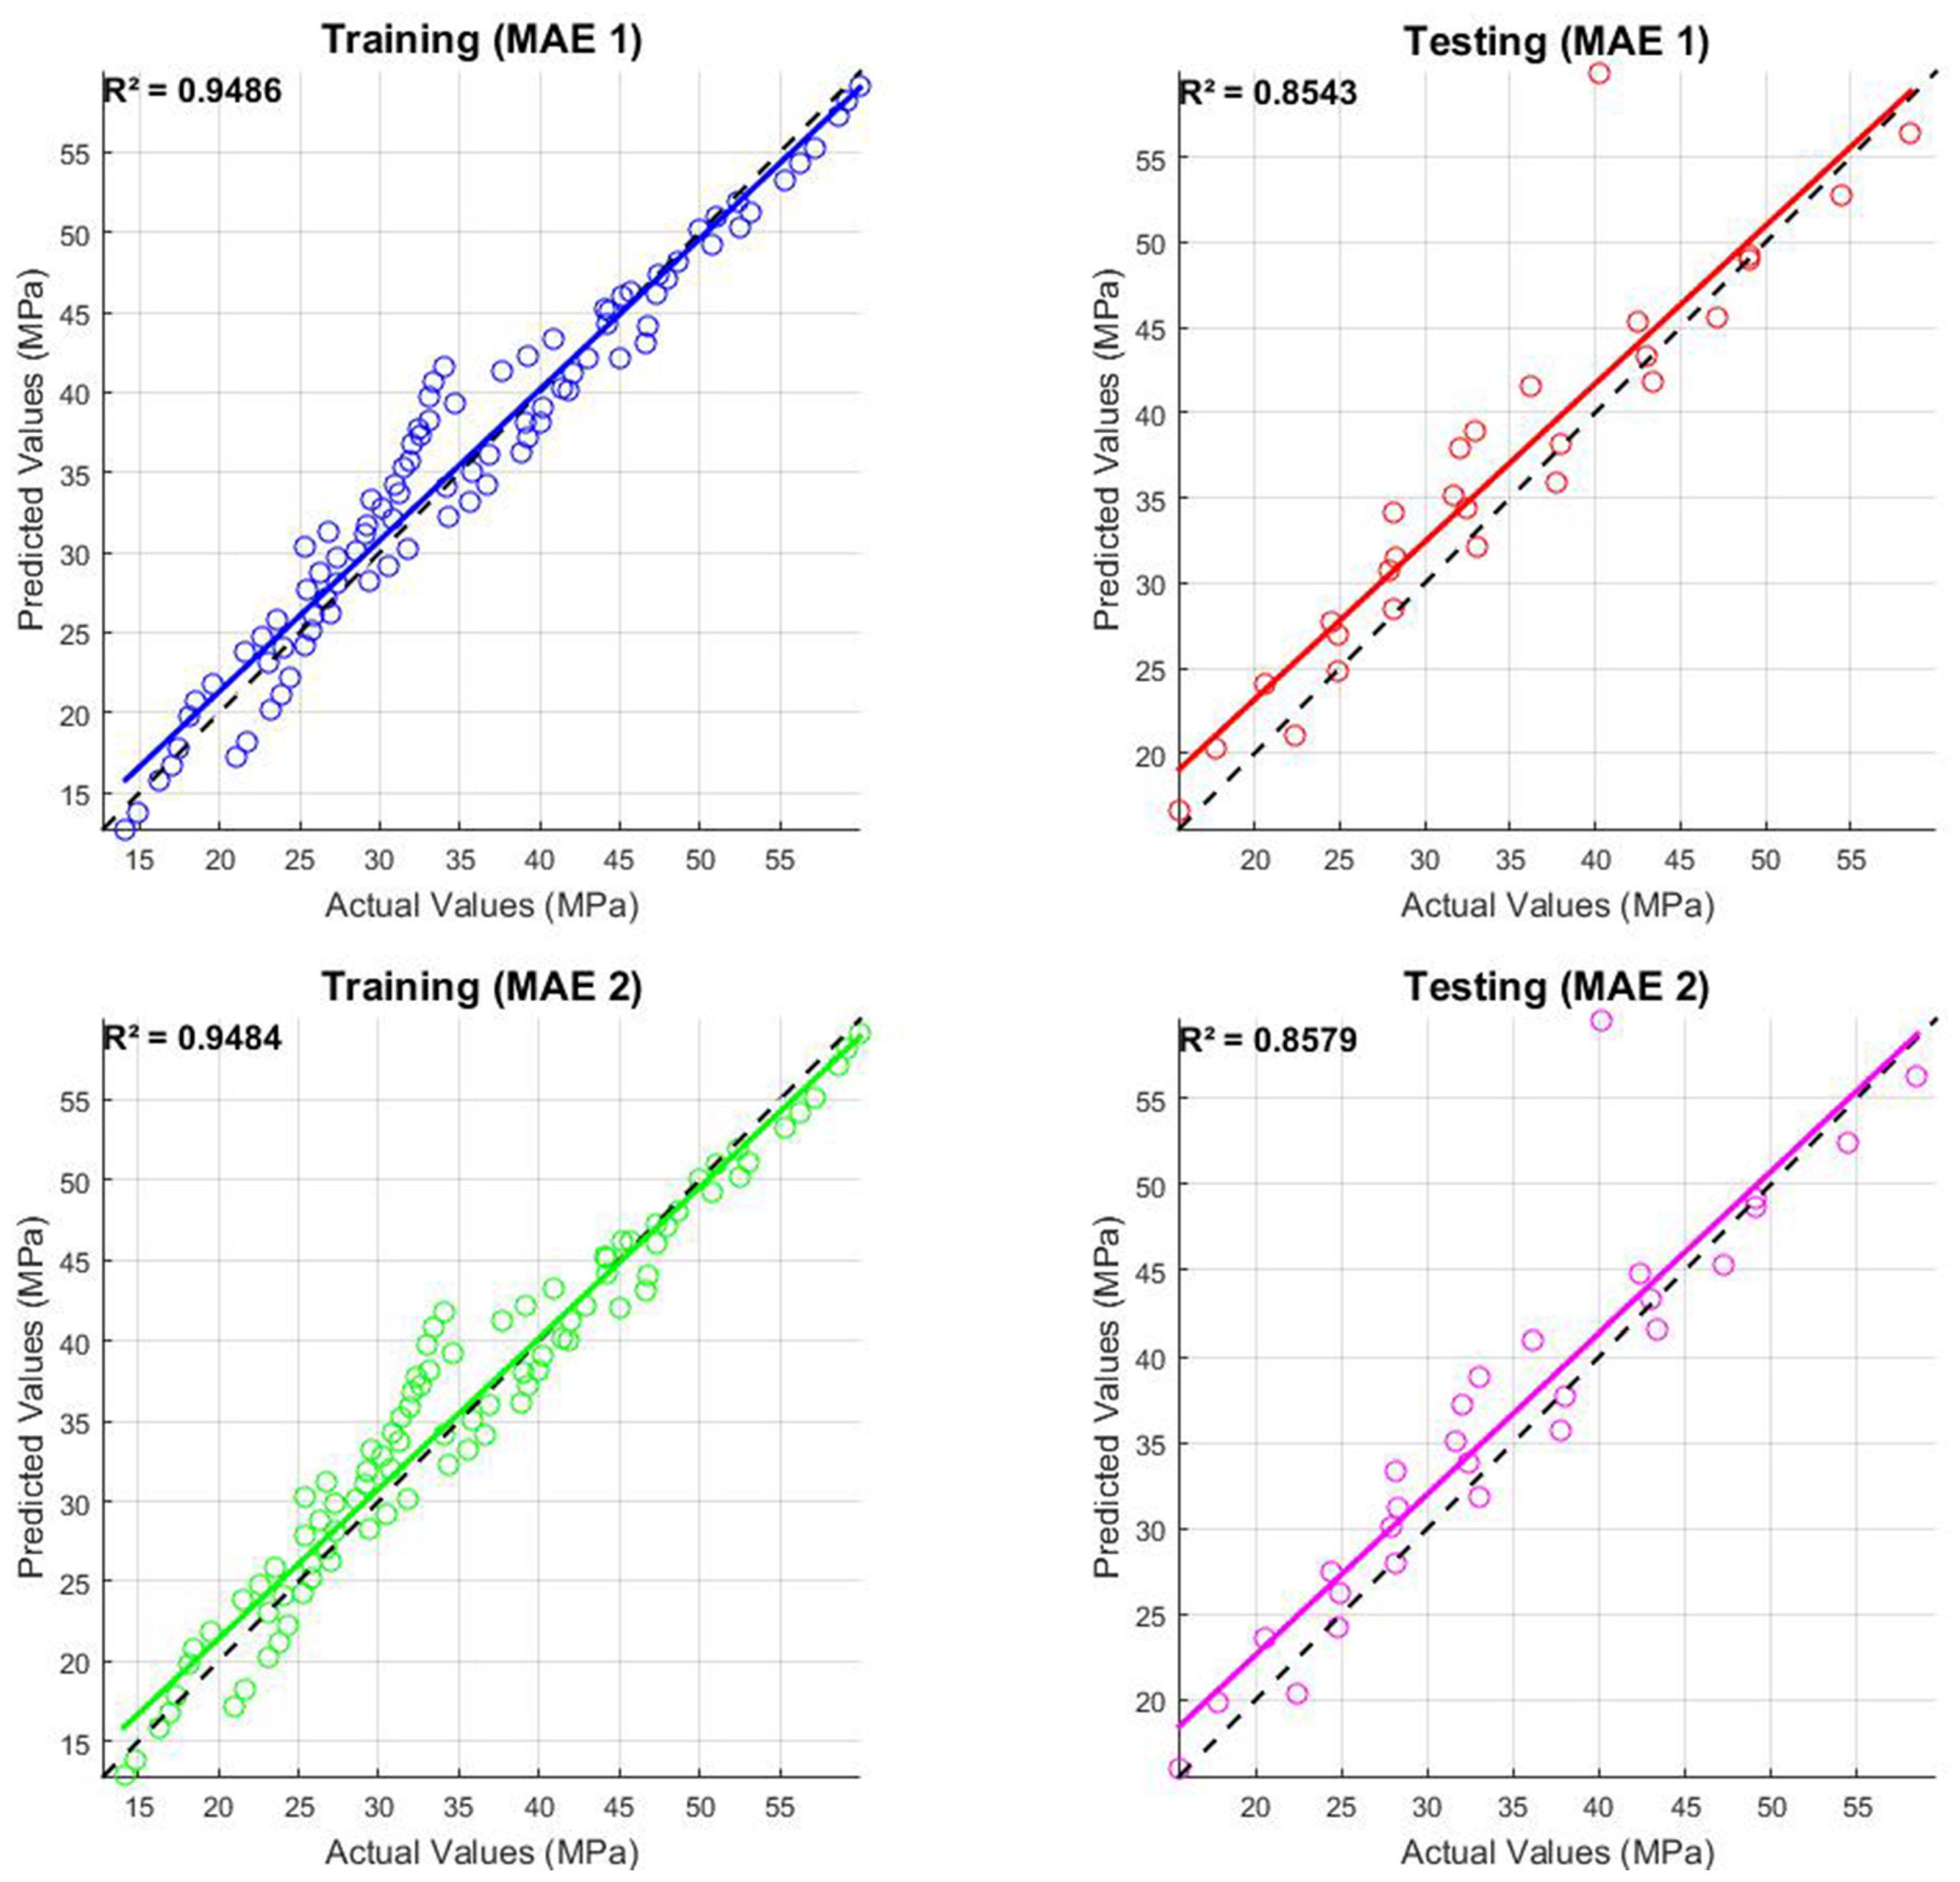
3.3.1. Mean Absolute Error (MAE)
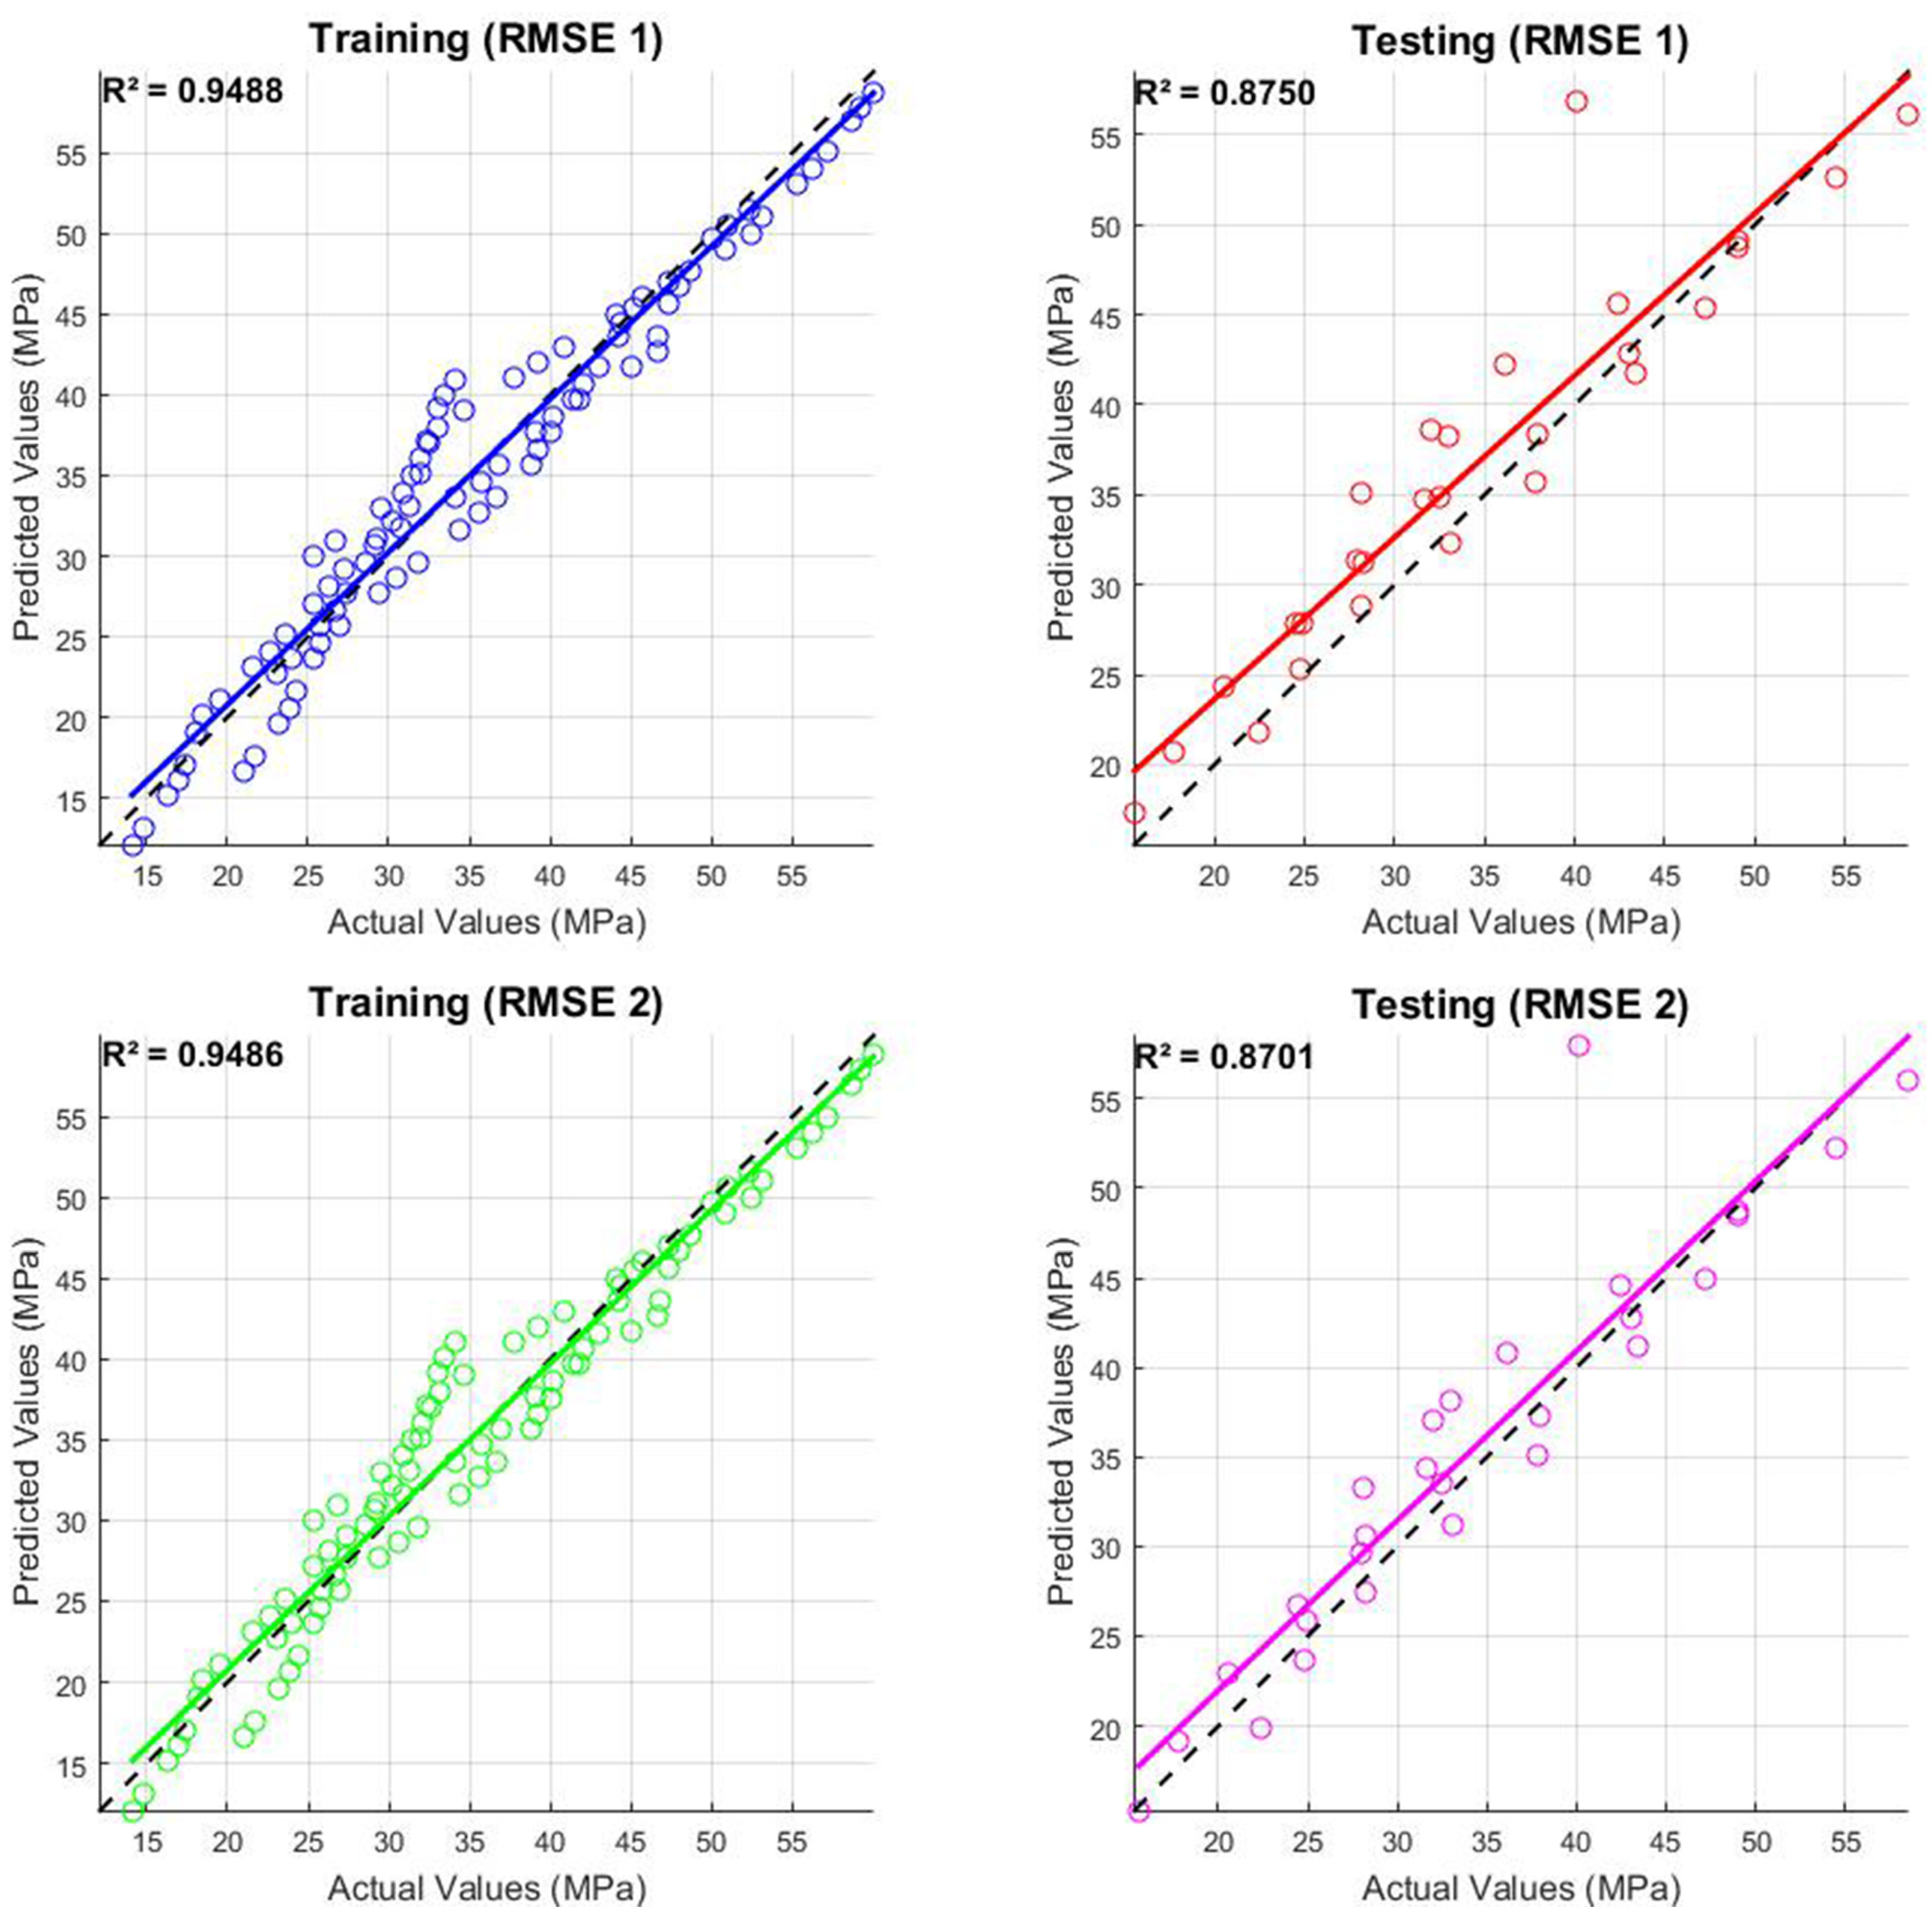
3.3.2. Root Mean Square Error (RMSE)
3.3.3. Weighted Root Mean Square Error (WRMSE)
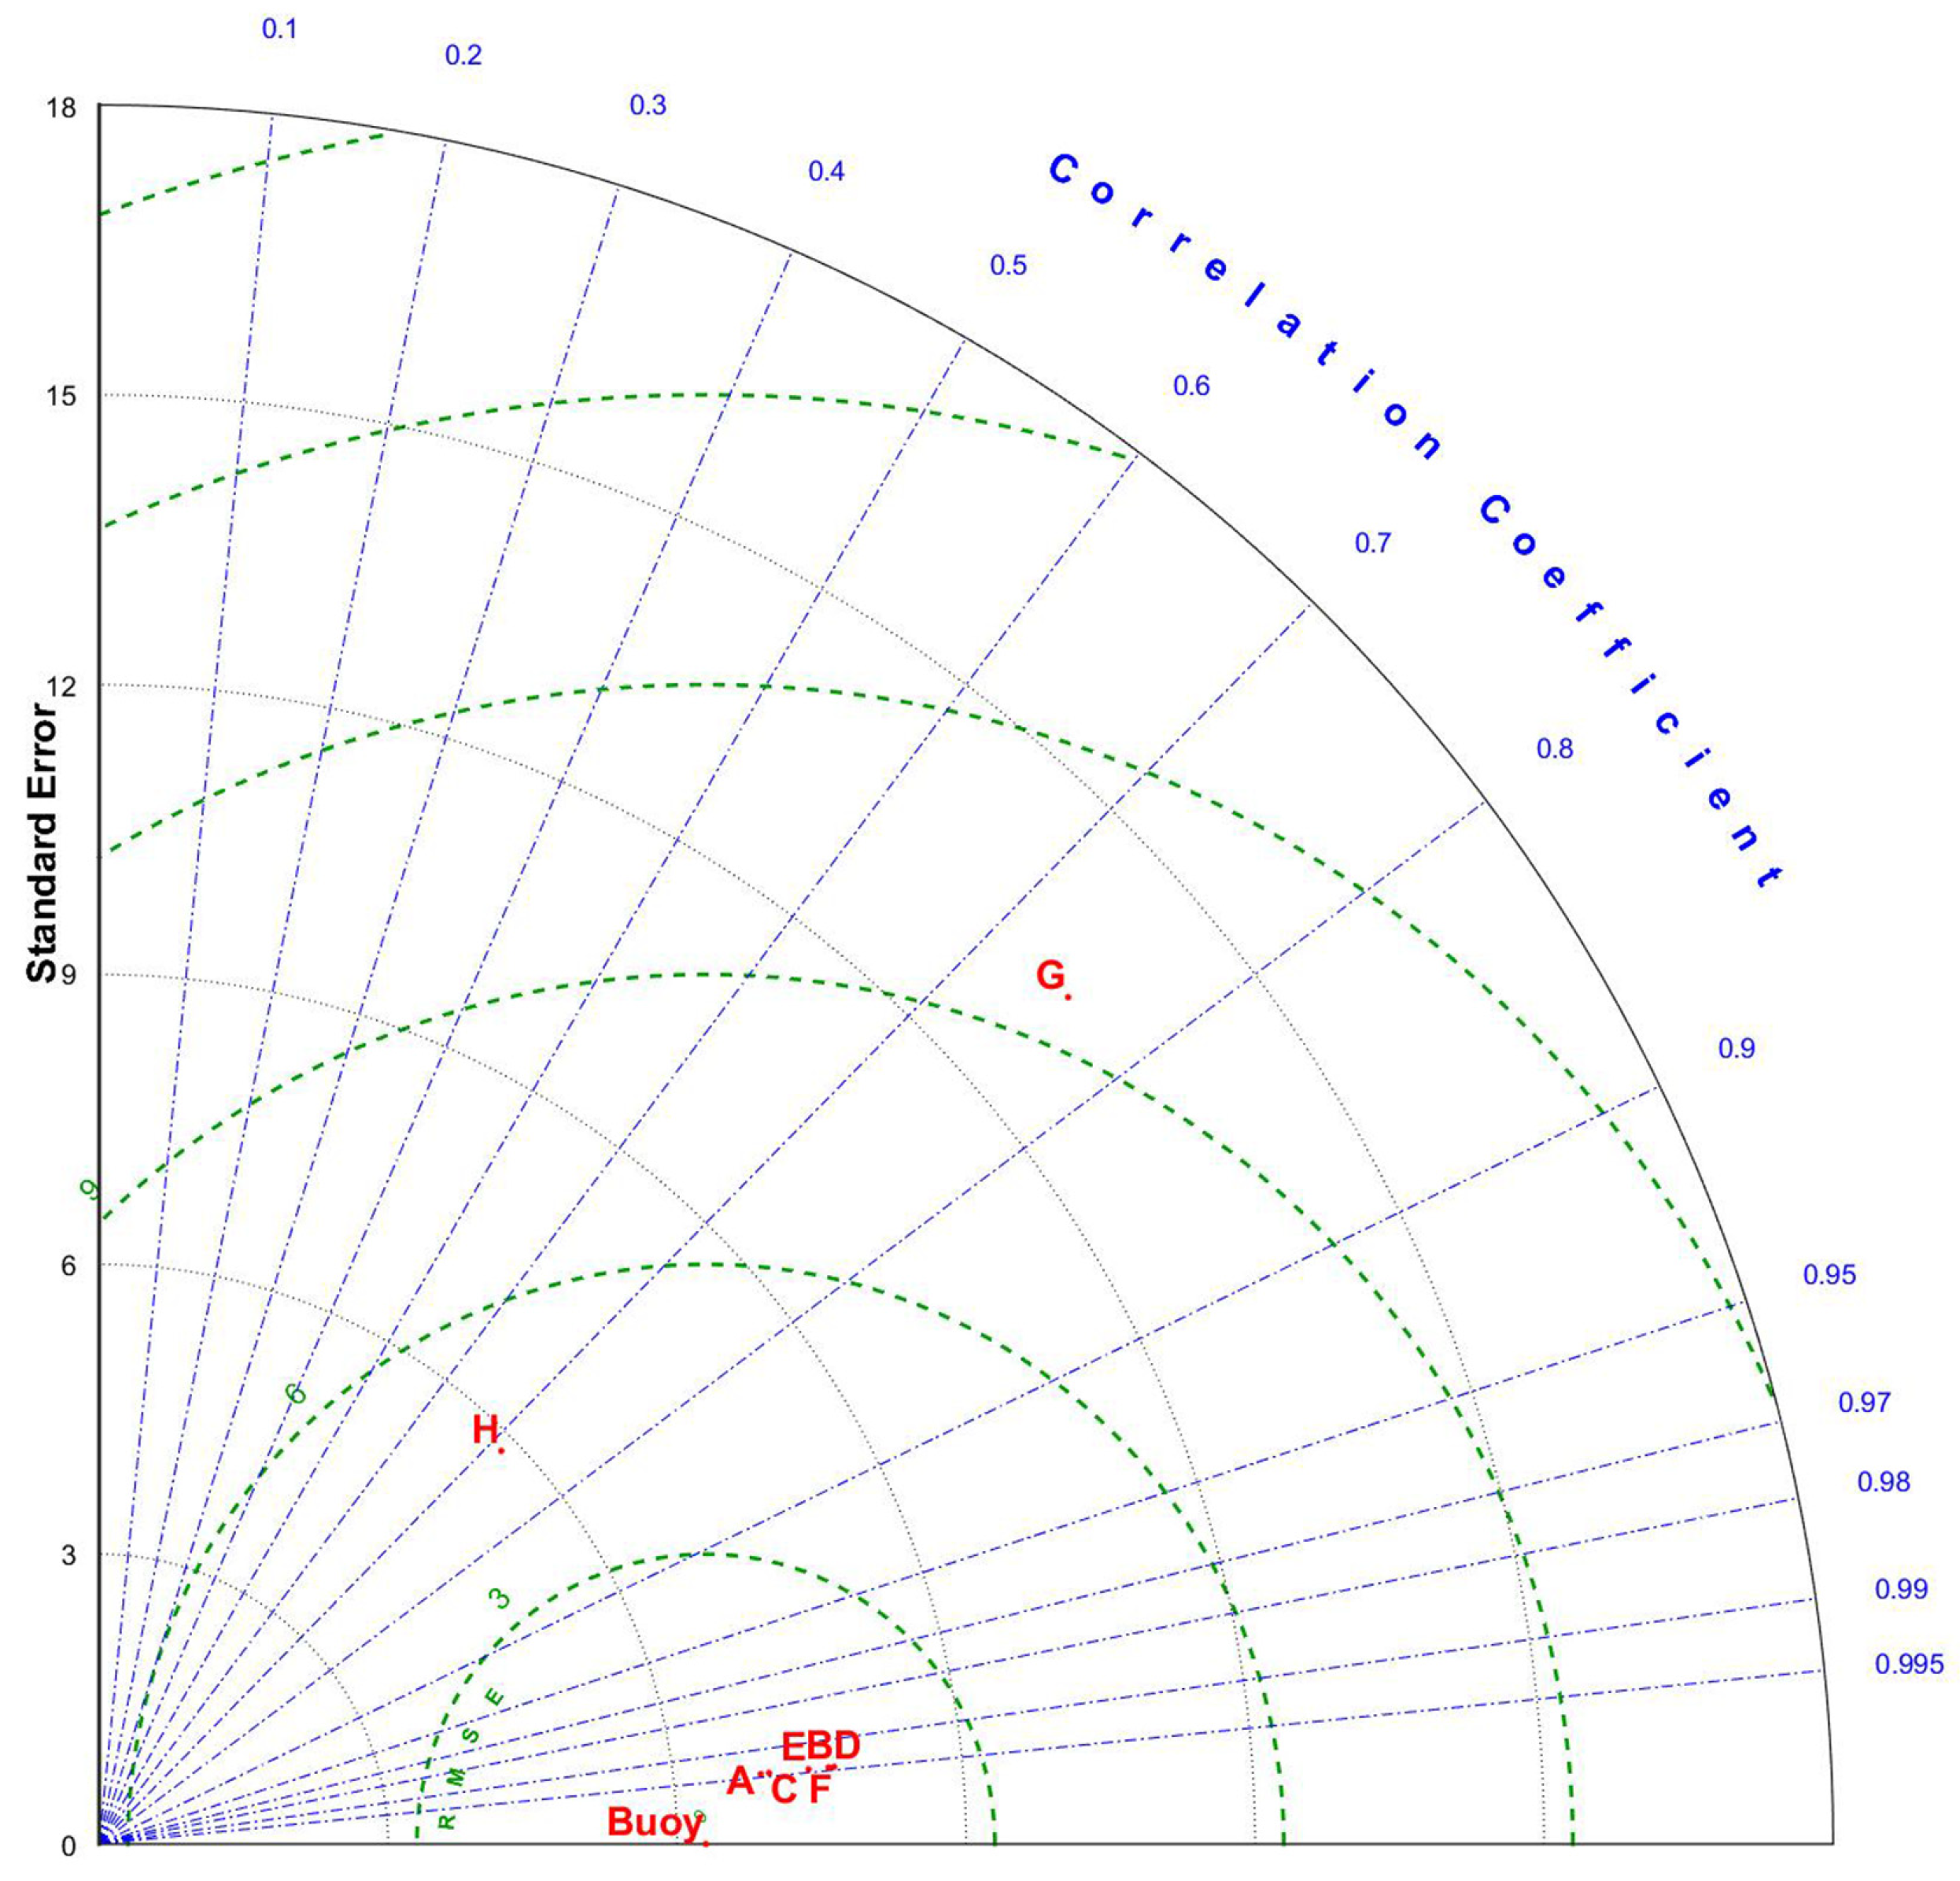
3.3.4. Taylor Diagram
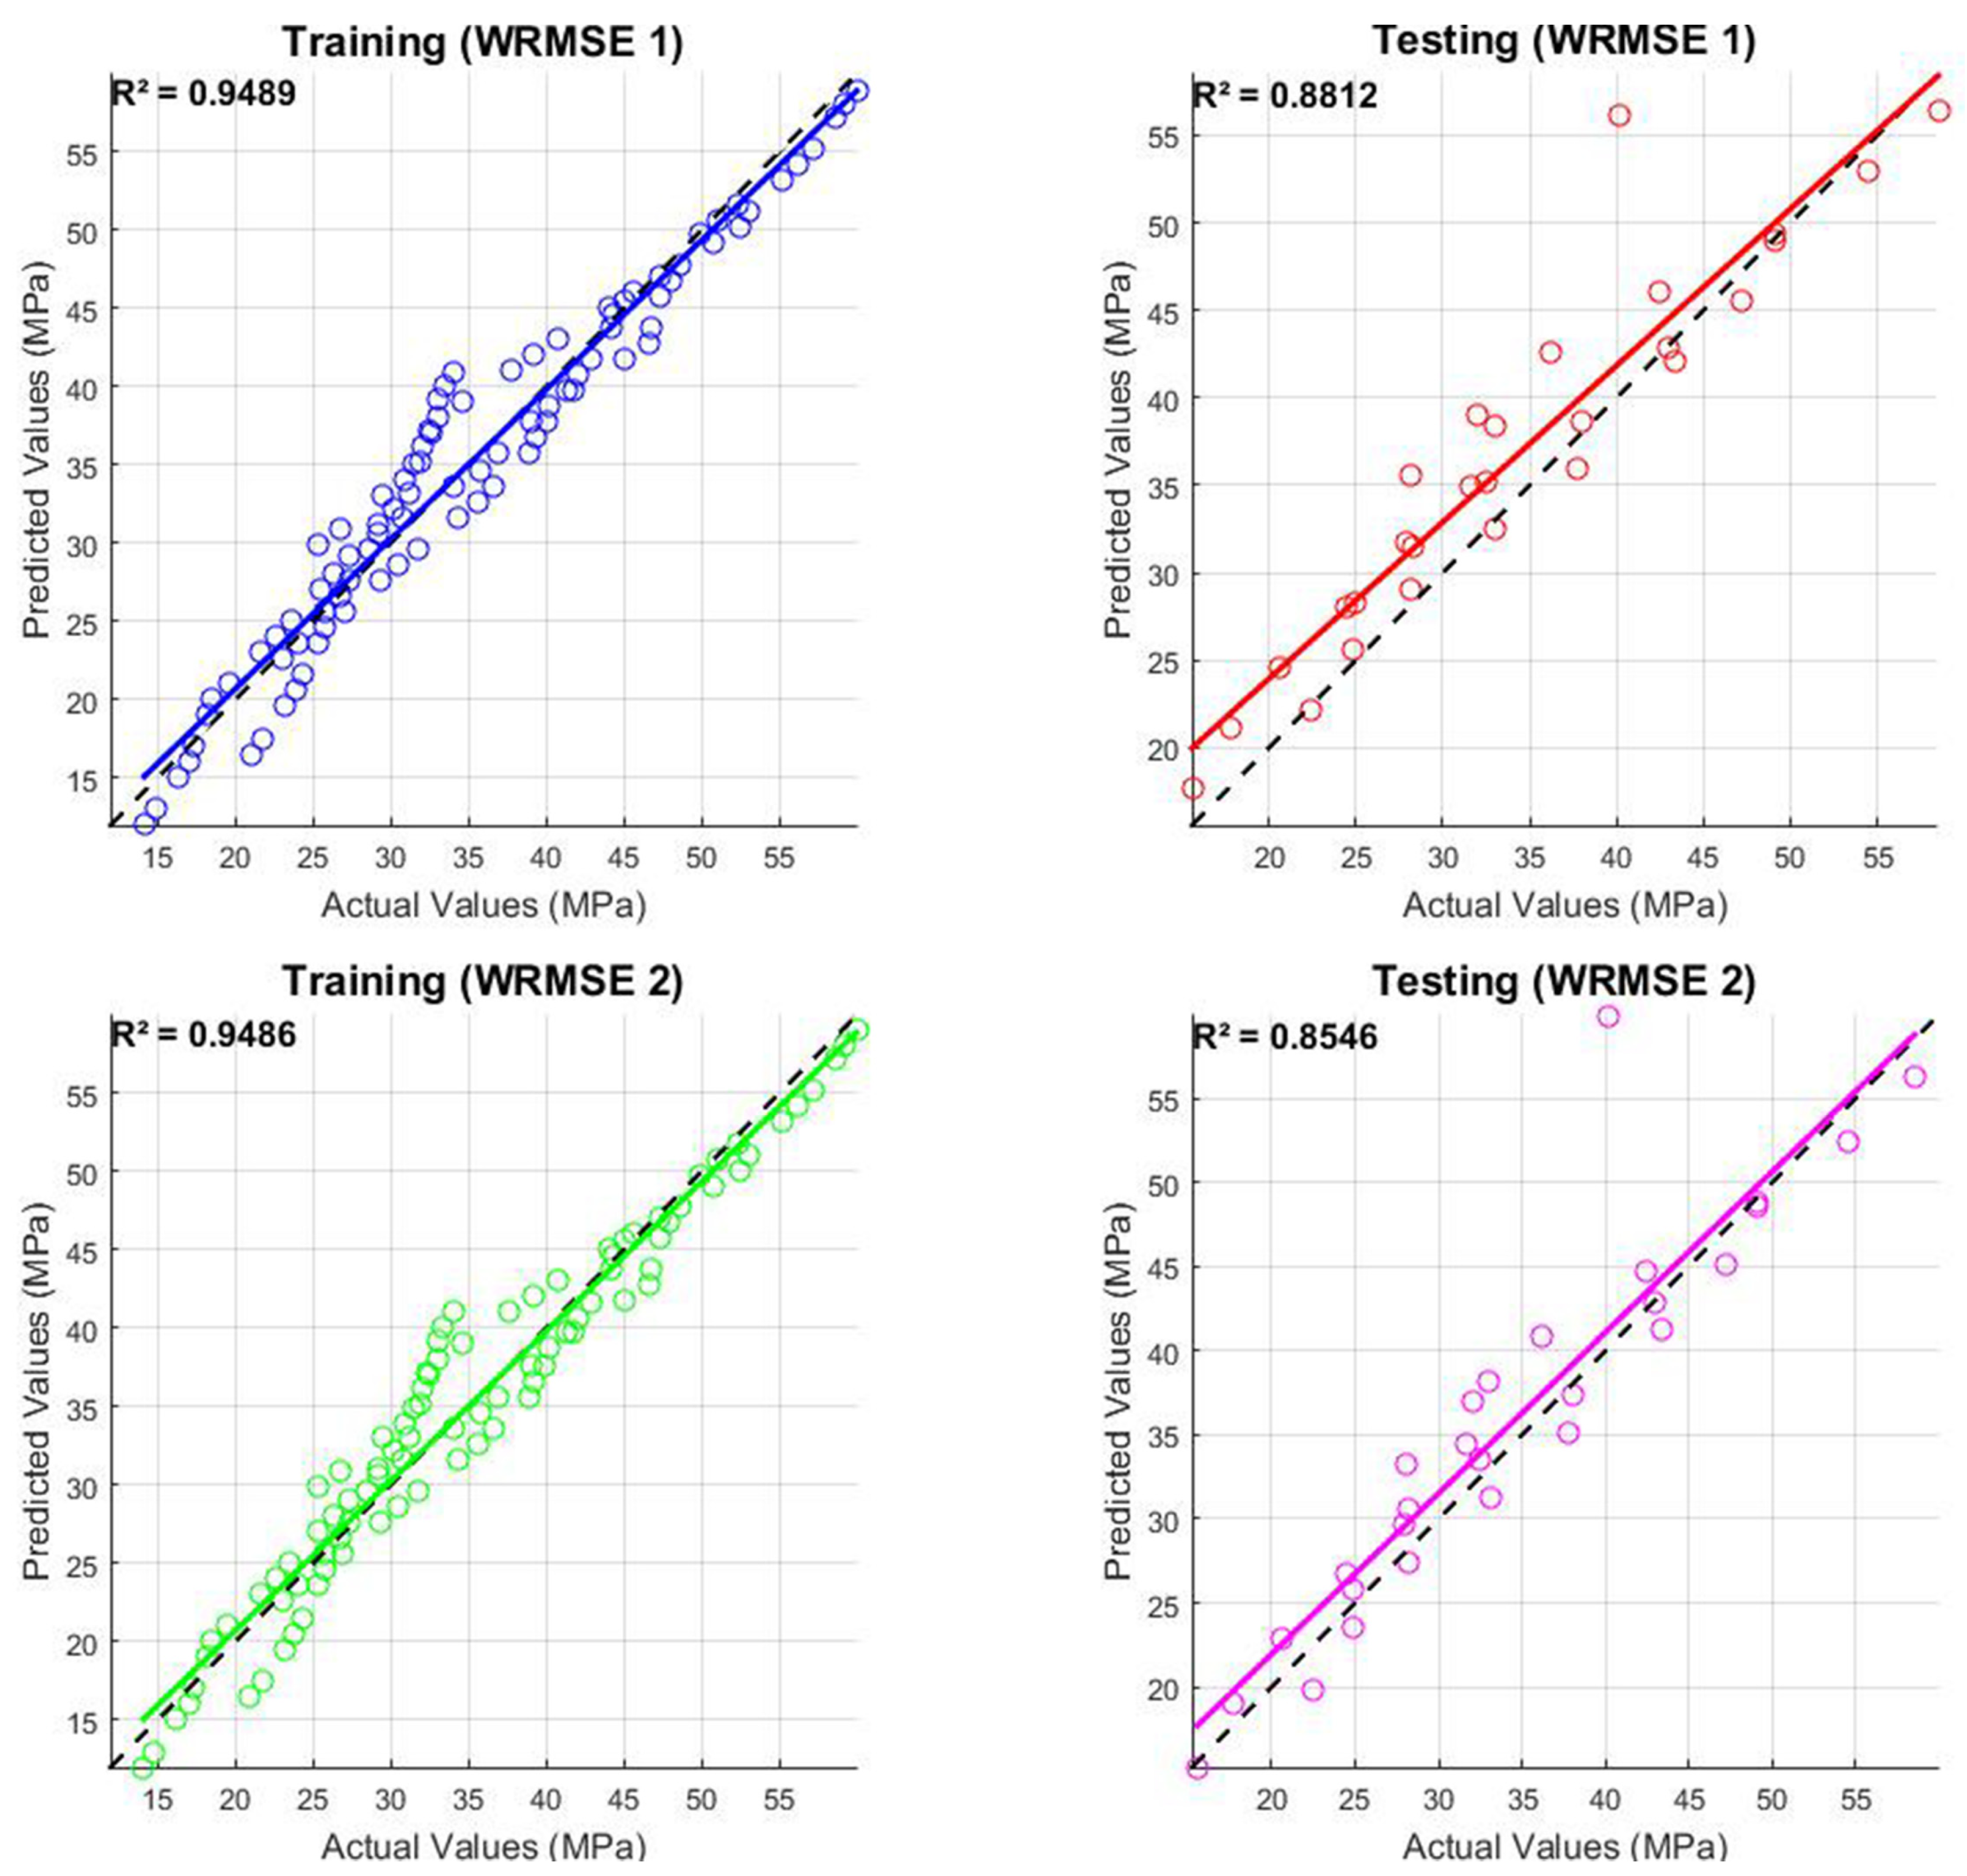
4. Findings and Discussion
5. Conclusions
Funding
Data Availability Statement
Conflicts of Interest
References
- Barbhuiya, S.; Kanavaris, F.; Das, B.B.; Idrees, M. Decarbonising cement and concrete production: Strategies, challenges and pathways for sustainable development. J. Build. Eng. 2024, 86, 108861. [Google Scholar] [CrossRef]
- Nehdi, M.L.; Marani, A.; Zhang, L. Is net-zero feasible: Systematic review of cement and concrete decarbonization technologies. Renew. Sustain. Energy Rev. 2024, 191, 114169. [Google Scholar] [CrossRef]
- Winnefeld, F.; Leemann, A.; German, A.; Lothenbach, B. CO2 storage in cement and concrete by mineral carbonation. Curr. Opin. Green Sustain. Chem. 2022, 38, 100672. [Google Scholar] [CrossRef]
- Oruc, S.; Dikbas, H.A.; Gumus, B.; Yucel, I. The Impact of Climate Change on Construction Activity Performance. Buildings 2024, 14, 372. [Google Scholar] [CrossRef]
- Thomas, C.; Setién, J.; Polanco, J.A. Structural recycled aggregate concrete made with precast wastes. Constr. Build. Mater. 2016, 114, 536–546. [Google Scholar] [CrossRef]
- Atmiş, E.; Yıldız, D.; Erdönmez, C. A different dimension in deforestation and forest degradation: Non-forestry uses of forests in Turkey. Land Use Policy 2024, 139, 107086. [Google Scholar] [CrossRef]
- Solís-Carcaño, R.; Moreno, E.I. Evaluation of concrete made with crushed limestone aggregate based on ultrasonic pulse velocity. Constr. Build. Mater. 2008, 22, 1225–1231. [Google Scholar] [CrossRef]
- Ren, P.; Ling, T.C.; Mo, K.H. Recent advances in artificial aggregate production. J. Clean. Prod. 2021, 291, 125215. [Google Scholar] [CrossRef]
- Westgate, P.; Ball, R.J.; Paine, K. Olivine as a reactive aggregate in lime mortars. Constr. Build. Mater. 2019, 195, 115–126. [Google Scholar] [CrossRef]
- Scott, A.; Oze, C.; Shah, V.; Yang, N.; Shanks, B.; Cheeseman, C.; Marshall, A.; Watson, M. Transformation of abundant magnesium silicate minerals for enhanced CO2 sequestration. Commun. Earth Environ. 2021, 2, 25. [Google Scholar] [CrossRef]
- Saridhe, S.P.; Hareesh, M.; Priya, T.S.; Selvaraj, T. Role of olivine aggregate in lime and cement mortars for the sequestration of atmospheric CO2. Mater. Tehnol. 2023, 57, 135–140. [Google Scholar] [CrossRef]
- Hamada, H.M.; Al-Attar, A.; Abed, F.; Beddu, S.; Humada, A.M.; Majdi, A.; Yousif, S.T.; Thomas, B.S. Enhancing sustainability in concrete construction: A comprehensive review of plastic waste as an aggregate material. Sustain. Mater. Technol. 2024, 40, e00877. [Google Scholar] [CrossRef]
- Gönen, T.; Cemalgil, S. Using the Taguchi Method to Optimize the Compressive Strength of Concrete in Different Aggregates Typology. El-Cezeri J. Sci. Eng. 2023, 10, 90–98. [Google Scholar] [CrossRef]
- Xing, W.; Tam, V.W.; Le, K.N.; Hao, J.L.; Wang, J. Life cycle assessment of recycled aggregate concrete on its environmental impacts: A critical review. Constr. Build. Mater. 2022, 317, 125950. [Google Scholar] [CrossRef]
- Wang, B.; Yan, L.; Fu, Q.; Kasal, B. A Comprehensive Review on Recycled Aggregate and Recycled Aggregate Concrete. Resour. Conserv. Recycl. 2021, 171, 105565. [Google Scholar] [CrossRef]
- Kirthika, S.K.; Singh, S.K.; Chourasia, A. Alternative fine aggregates in production of sustainable concrete—A review. J. Clean. Prod. 2020, 268, 122089. [Google Scholar] [CrossRef]
- Fan, Z.; Lin, J.; Chen, Z.; Liu, P.; Wang, D.; Oeser, M. Multiscale understanding of interfacial behavior between bitumen and aggregate: From the aggregate mineralogical genome aspect. Constr. Build. Mater. 2021, 271, 121607. [Google Scholar] [CrossRef]
- Özel, C.; Nadi Kaplan, A. Kendiliğinden Yerleşen Beton Özellikleri Üzerinde Agrega Özelliklerinin Etkisi. Int. J. Sustain. Eng. Technol. 2017, 1, 1–6. [Google Scholar]
- Solak, A. Classification of rocks in Manisa-Gürle village region and investigation of their usability as concrete aggregate. Niğde Ömer Halisdemir Üniversitesi Mühendislik Bilim. Derg. 2022, 11, 974–981. [Google Scholar] [CrossRef]
- Emiroǧlu, M.; Beycioǧlu, A.; Yildiz, S. ANFIS and statistical based approach to prediction the peak pressure load of concrete pipes including glass fiber. Expert Syst. Appl. 2012, 39, 2877–2883. [Google Scholar] [CrossRef]
- Jiang, G.; Keller, J.; Bond, P.L.; Yuan, Z. Predicting concrete corrosion of sewers using artificial neural network. Water Res. 2016, 92, 52–60. [Google Scholar] [CrossRef] [PubMed]
- Wen, Z.; Zhou, R.; Su, H. MR and stacked GRUs neural network combined model and its application for deformation prediction of concrete dam. Expert Syst. Appl. 2022, 201, 117272. [Google Scholar] [CrossRef]
- Yilmaz, I.; Kaynar, O. Multiple regression, ANN (RBF, MLP) and ANFIS models for prediction of swell potential of clayey soils. Expert Syst. Appl. 2011, 38, 5958–5966. [Google Scholar] [CrossRef]
- Obianyo, I.I.; Anosike-Francis, E.N.; Ihekweme, G.O.; Geng, Y.; Jin, R.; Onwualu, A.P.; Soboyejo, A.B.O. Multivariate regression models for predicting the compressive strength of bone ash stabilized lateritic soil for sustainable building. Constr. Build. Mater. 2020, 263, 120677. [Google Scholar] [CrossRef]
- Chithra, S.; Kumar, S.R.R.S.; Chinnaraju, K.; Alfin Ashmita, F. A comparative study on the compressive strength prediction models for High Performance Concrete containing nano silica and copper slag using regression analysis and Artificial Neural Networks. Constr. Build. Mater. 2016, 114, 528–535. [Google Scholar] [CrossRef]
- Chakali, Y.; Sadok, A.H.; Tahlaiti, M.; Nacer, T. A PSO-ANN Intelligent Hybrid Model to Predict the Compressive Strength of Limestone Fillers Roller Compacted Concrete (RCC) to Build Dams. KSCE J. Civ. Eng. 2021, 25, 3008–3018. [Google Scholar] [CrossRef]
- Li, J.; Yan, G.; Abbud, L.H.; Alkhalifah, T.; Alturise, F.; Khadimallah, M.A.; Marzouki, R. Predicting the shear strength of concrete beam through ANFIS-GA–PSO hybrid modeling. Adv. Eng. Softw. 2023, 181, 103475. [Google Scholar] [CrossRef]
- Kaplanvural, İ. Volumetric water content estimation of concrete by particle swarm optimization of GPR data. Constr. Build. Mater. 2023, 375, 130995. [Google Scholar] [CrossRef]
- Jiang, W.; Xie, Y.; Li, W.; Wu, J.; Long, G. Prediction of the splitting tensile strength of the bonding interface by combining the support vector machine with the particle swarm optimization algorithm. Eng. Struct. 2021, 230, 111696. [Google Scholar] [CrossRef]
- Qi, C.; Fourie, A.; Chen, Q. Neural network and particle swarm optimization for predicting the unconfined compressive strength of cemented paste backfill. Constr. Build. Mater. 2018, 159, 473–478. [Google Scholar] [CrossRef]
- Hanoon, A.N.; Jaafar, M.S.; Hejazi, F.; Aziz, F.N.A.A. Strut-and-tie model for externally bonded CFRP-strengthened reinforced concrete deep beams based on particle swarm optimization algorithm: CFRP debonding and rupture. Constr. Build. Mater. 2017, 147, 428–447. [Google Scholar] [CrossRef]
- Nazari, A.; Sanjayan, J.G. Modelling of compressive strength of geopolymer paste, mortar and concrete by optimized support vector machine. Ceram. Int. 2015, 41, 12164–12177. [Google Scholar] [CrossRef]
- Uzundurukan, S.; Saplıoğlu, K. Konsol İstinat Duvarlarında Yükseklik Maliyet İlişkisinin Parçacık Sürü Algoritması İle İncelenmesi. Düzce Üniversitesi Bilim. Teknol. Derg. 2020, 8, 2544–2554. [Google Scholar]
- Safarzadegan Gilan, S.; Bahrami Jovein, H.; Ramezanianpour, A.A. Hybrid support vector regression–Particle swarm optimization for prediction of compressive strength and RCPT of concretes containing metakaolin. Constr. Build. Mater. 2012, 34, 321–329. [Google Scholar] [CrossRef]
- Mashhadban, H.; Kutanaei, S.S.; Sayarinejad, M.A. Prediction and modeling of mechanical properties in fiber reinforced self-compacting concrete using particle swarm optimization algorithm and artificial neural network. Constr. Build. Mater. 2016, 119, 277–287. [Google Scholar] [CrossRef]
- Altunci, Y.T.; Özkan, Ş. Design Optimization and Statistical Modeling of Compressive Strtength of Cement Mortars Containing Recycled Waste Brick Dust Using Response Surface Methodology. Int. J. Sustain. Eng. Technol. 2023, 2, 88–97. [Google Scholar]
- Hammoudi, A.; Moussaceb, K.; Belebchouche, C.; Dahmoune, F. Comparison of artificial neural network (ANN) and response surface methodology (RSM) prediction in compressive strength of recycled concrete aggregates. Constr. Build. Mater. 2019, 209, 425–436. [Google Scholar] [CrossRef]
- Ray, S.; Haque, M.; Ahmed, T.; Nahin, T.T. Comparison of artificial neural network (ANN) and response surface methodology (RSM) in predicting the compressive and splitting tensile strength of concrete prepared with glass waste and tin (Sn) can fiber. J. King Saud Univ.-Eng. Sci. 2023, 35, 185–199. [Google Scholar] [CrossRef]
- Kursuncu, B.; Gencel, O.; Bayraktar, O.Y.; Shi, J.; Nematzadeh, M.; Kaplan, G. Optimization of foam concrete characteristics using response surface methodology and artificial neural networks. Constr. Build. Mater. 2022, 337, 127575. [Google Scholar] [CrossRef]
- Golafshani, E.M.; Behnood, A.; Arashpour, M. Predicting the compressive strength of normal and High-Performance Concretes using ANN and ANFIS hybridized with Grey Wolf Optimizer. Constr. Build. Mater. 2020, 232, 117266. [Google Scholar] [CrossRef]
- Ahmadi-Nedushan, B. Prediction of elastic modulus of normal and high strength concrete using ANFIS and optimal nonlinear regression models. Constr. Build. Mater. 2012, 36, 665–673. [Google Scholar] [CrossRef]
- Kumar, A.; Arora, H.C.; Kumar, K.; Garg, H. Performance prognosis of FRCM-to-concrete bond strength using ANFIS-based fuzzy algorithm. Expert Syst. Appl. 2023, 216, 119497. [Google Scholar] [CrossRef]
- Madandoust, R.; Bungey, J.H.; Ghavidel, R. Prediction of the concrete compressive strength by means of core testing using GMDH-type neural network and ANFIS models. Comput. Mater. Sci. 2012, 51, 261–272. [Google Scholar] [CrossRef]
- Sobhani, J.; Najimi, M.; Pourkhorshidi, A.R.; Parhizkar, T. Prediction of the compressive strength of no-slump concrete: A comparative study of regression, neural network and ANFIS models. Constr. Build. Mater. 2010, 24, 709–718. [Google Scholar] [CrossRef]
- Vakhshouri, B.; Nejadi, S. Prediction of compressive strength of self-compacting concrete by ANFIS models. Neurocomputing 2018, 280, 13–22. [Google Scholar] [CrossRef]
- Pei, Z.; Wei, Y. Prediction of the bond strength of FRP-to-concrete under direct tension by ACO-based ANFIS approach. Compos. Struct. 2022, 282, 115070. [Google Scholar] [CrossRef]
- Yuan, Z.; Wang, L.N.; Ji, X. Prediction of concrete compressive strength: Research on hybrid models genetic based algorithms and ANFIS. Adv. Eng. Softw. 2014, 67, 156–163. [Google Scholar] [CrossRef]
- Sadrmomtazi, A.; Sobhani, J.; Mirgozar, M.A. Modeling compressive strength of EPS lightweight concrete using regression, neural network and ANFIS. Constr. Build. Mater. 2013, 42, 205–216. [Google Scholar] [CrossRef]
- Akkurt, I.; Başyigit, C.; Kilincarslan, S.; Beycioglu, A. Prediction of photon attenuation coefficients of heavy concrete by fuzzy logic. J. Frankl. Inst. 2010, 347, 1589–1597. [Google Scholar] [CrossRef]
- Cao, Y.; Zandi, Y.; Rahimi, A.; Petković, D.; Denić, N.; Stojanović, J.; Spasić, B.; Vujović, V.; Amine Khadimallah, M.; Assilzadeh, H. Evaluation and monitoring of impact resistance of fiber reinforced concrete by adaptive neuro fuzzy algorithm. Structures 2021, 34, 3750–3756. [Google Scholar] [CrossRef]
- Güler, K.; Demir, F.; Pakdamar, F. Stress–strain modelling of high strength concrete by fuzzy logic approach. Constr. Build. Mater. 2012, 37, 680–684. [Google Scholar] [CrossRef]
- Golafshani, E.M.; Rahai, A.; Sebt, M.H.; Akbarpour, H. Prediction of bond strength of spliced steel bars in concrete using artificial neural network and fuzzy logic. Constr. Build. Mater. 2012, 36, 411–418. [Google Scholar] [CrossRef]
- Moon, J.; Kim, J.J.; Lee, T.H.; Lee, H.E. Prediction of axial load capacity of stub circular concrete-filled steel tube using fuzzy logic. J. Constr. Steel Res. 2014, 101, 184–191. [Google Scholar] [CrossRef]
- Saridemir, M.; Topçu, I.B.; Özcan, F.; Severcan, M.H. Prediction of long-term effects of GGBFS on compressive strength of concrete by artificial neural networks and fuzzy logic. Constr. Build. Mater. 2009, 23, 1279–1286. [Google Scholar] [CrossRef]
- Topçu, I.B.; Saridemir, M. Prediction of compressive strength of concrete containing fly ash using artificial neural networks and fuzzy logic. Comput. Mater. Sci. 2008, 41, 305–311. [Google Scholar] [CrossRef]
- Topçu, I.B.; Saridemir, M. Prediction of rubberized concrete properties using artificial neural network and fuzzy logic. Constr. Build. Mater. 2008, 22, 532–540. [Google Scholar] [CrossRef]
- Tanyildizi, H. Fuzzy logic model for prediction of mechanical properties of lightweight concrete exposed to high temperature. Mater. Des. 2009, 30, 2205–2210. [Google Scholar] [CrossRef]
- Özcan, F.; Atiş, C.D.; Karahan, O.; Uncuoǧlu, E.; Tanyildizi, H. Comparison of artificial neural network and fuzzy logic models for prediction of long-term compressive strength of silica fume concrete. Adv. Eng. Softw. 2009, 40, 856–863. [Google Scholar] [CrossRef]
- Jong, B.; Kim, I.; Kim, D.K. Application of neural networks for estimation of concrete strength. KSCE J. Civ. Eng. 2002, 6, 429–438. [Google Scholar]
- Asteris, P.G.; Skentou, A.D.; Bardhan, A.; Samui, P.; Pilakoutas, K. Predicting concrete compressive strength using hybrid ensembling of surrogate machine learning models. Cem. Concr. Res. 2021, 145, 106449. [Google Scholar] [CrossRef]
- Basaran, B.; Kalkan, I.; Bergil, E.; Erdal, E. Estimation of the FRP-concrete bond strength with code formulations and machine learning algorithms. Compos. Struct. 2021, 268, 113972. [Google Scholar] [CrossRef]
- Congro, M.; de Alencar Monteiro, V.M.; Brandão, A.L.T.; Santos, B.F.D.; Roehl, D.; Silva, F. de A. Prediction of the residual flexural strength of fiber reinforced concrete using artificial neural networks. Constr. Build. Mater. 2021, 303, 124502. [Google Scholar] [CrossRef]
- Felix, E.F.; Carrazedo, R.; Possan, E. Carbonation model for fly ash concrete based on artificial neural network: Development and parametric analysis. Constr. Build. Mater. 2021, 266, 121050. [Google Scholar] [CrossRef]
- Ling, H.; Qian, C.; Kang, W.; Liang, C.; Chen, H. Combination of Support Vector Machine and K-Fold cross validation to predict compressive strength of concrete in marine environment. Constr. Build. Mater. 2019, 206, 355–363. [Google Scholar] [CrossRef]
- Liu, Q.; Iqbal, M.F.; Yang, J.; Lu, X.; Zhang, P.; Rauf, M. Prediction of chloride diffusivity in concrete using artificial neural network: Modelling and performance evaluation. Constr. Build. Mater. 2021, 268, 121082. [Google Scholar] [CrossRef]
- Moradi, M.J.; Daneshvar, K.; Ghazi-nader, D.; Hajiloo, H. The prediction of fire performance of concrete-filled steel tubes (CFST) using artificial neural network. Thin-Walled Struct. 2021, 161, 107499. [Google Scholar] [CrossRef]
- Ramkumar, K.B.; Kannan Rajkumar, P.R.; Noor Ahmmad, S.; Jegan, M. A Review on Performance of Self-Compacting Concrete–Use of Mineral Admixtures and Steel Fibres with Artificial Neural Network Application. Constr. Build. Mater. 2020, 261, 120215. [Google Scholar] [CrossRef]
- Shahmansouri, A.A.; Yazdani, M.; Ghanbari, S.; Akbarzadeh Bengar, H.; Jafari, A.; Farrokh Ghatte, H. Artificial neural network model to predict the compressive strength of eco-friendly geopolymer concrete incorporating silica fume and natural zeolite. J. Clean. Prod. 2021, 279, 123697. [Google Scholar] [CrossRef]
- Xi, X.; Yin, Z.; Yang, S.; Li, C.Q. Using artificial neural network to predict the fracture properties of the interfacial transition zone of concrete at the meso-scale. Eng. Fract. Mech. 2021, 242, 107488. [Google Scholar] [CrossRef]
- Xu, J.; Chen, Y.; Xie, T.; Zhao, X.; Xiong, B.; Chen, Z. Prediction of triaxial behavior of recycled aggregate concrete using multivariable regression and artificial neural network techniques. Constr. Build. Mater. 2019, 226, 534–554. [Google Scholar] [CrossRef]
- Xu, J.; Zhao, X.; Yu, Y.; Xie, T.; Yang, G.; Xue, J. Parametric sensitivity analysis and modelling of mechanical properties of normal- and high-strength recycled aggregate concrete using grey theory, multiple nonlinear regression and artificial neural networks. Constr. Build. Mater. 2019, 211, 479–491. [Google Scholar] [CrossRef]
- Zhao, Y.; Hu, H.; Song, C.; Wang, Z. Predicting compressive strength of manufactured-sand concrete using conventional and metaheuristic-tuned artificial neural network. Measurement 2022, 194, 110993. [Google Scholar] [CrossRef]
- Nazımı, N.; Saplioglu, K. Monthly Streamflow Prediction Using ANN, KNN and ANFIS models: Example of Gediz River Basin. Tek. Bilim. Derg. 2023, 13, 42–49. [Google Scholar] [CrossRef]
- Acar, R.; Saplıoğlu, K. Etkili Girdi Parametrelerinin Çoklu Regresyon ile Belirlendiği Su Sertliğinin ANFIS Yöntemi ile Tahmin Edilmesi. Afyon Kocatepe Üniversitesi Fen Mühendis. Bilim. Derg. 2022, 22, 1413–1424. [Google Scholar] [CrossRef]
- Getahun, M.A.; Shitote, S.M.; Abiero Gariy, Z.C. Artificial neural network based modelling approach for strength prediction of concrete incorporating agricultural and construction wastes. Constr. Build. Mater. 2018, 190, 517–525. [Google Scholar] [CrossRef]
- Dantas, A.T.A.; Batista Leite, M.; De Jesus Nagahama, K. Prediction of compressive strength of concrete containing construction and demolition waste using artificial neural networks. Constr. Build. Mater. 2013, 38, 717–722. [Google Scholar] [CrossRef]
- Tam, V.W.Y.; Butera, A.; Le, K.N.; Silva, L.C.F.D.; Evangelista, A.C.J. A prediction model for compressive strength of CO2 concrete using regression analysis and artificial neural networks. Constr. Build. Mater. 2022, 324, 126689. [Google Scholar] [CrossRef]
- Le, B.A.; Vu, V.H.; Seo, S.Y.; Tran, B.V.; Nguyen-Sy, T.; Le, M.C.; Vu, T.S. Predicting the Compressive Strength and the Effective Porosity of Pervious Concrete Using Machine Learning Methods. KSCE J. Civ. Eng. 2022, 26, 4664–4679. [Google Scholar] [CrossRef]
- Aiyer, B.G.; Kim, D.; Karingattikkal, N.; Samui, P.; Rao, P.R. Prediction of compressive strength of self-compacting concrete using least square support vector machine and relevance vector machine. KSCE J. Civ. Eng. 2014, 18, 1753–1758. [Google Scholar] [CrossRef]
- Fan, Z.; Chiong, R.; Hu, Z.; Lin, Y. A fuzzy weighted relative error support vector machine for reverse prediction of concrete components. Comput. Struct. 2020, 230, 106171. [Google Scholar] [CrossRef]
- Jueyendah, S.; Lezgy-Nazargah, M.; Eskandari-Naddaf, H.; Emamian, S.A. Predicting the mechanical properties of cement mortar using the support vector machine approach. Constr. Build. Mater. 2021, 291, 123396. [Google Scholar] [CrossRef]
- Luo, H.; Paal, S.G. Metaheuristic least squares support vector machine-based lateral strength modelling of reinforced concrete columns subjected to earthquake loads. Structures 2021, 33, 748–758. [Google Scholar] [CrossRef]
- Wen, L.; Li, Y.; Zhao, W.; Cao, W.; Zhang, H. Predicting the deformation behaviour of concrete face rockfill dams by combining support vector machine and AdaBoost ensemble algorithm. Comput. Geotech. 2023, 161, 105611. [Google Scholar] [CrossRef]
- Zhou, Y.; Zhang, Y.; Pang, R.; Xu, B. Seismic fragility analysis of high concrete faced rockfill dams based on plastic failure with support vector machine. Soil Dyn. Earthq. Eng. 2021, 144, 106587. [Google Scholar] [CrossRef]
- Kaloop, M.R.; Kumar, D.; Samui, P.; Hu, J.W.; Kim, D. Compressive strength prediction of high-performance concrete using gradient tree boosting machine. Constr. Build. Mater. 2020, 264, 120198. [Google Scholar] [CrossRef]
- Fu, W.; Sun, B.; Wan, H.P.; Luo, Y.; Zhao, W. A Gaussian processes-based approach for damage detection of concrete structure using temperature-induced strain. Eng. Struct. 2022, 268, 114740. [Google Scholar] [CrossRef]
- Pereira Dias, P.; Bhagya Jayasinghe, L.; Waldmann, D. Machine learning in mix design of Miscanthus lightweight concrete. Constr. Build. Mater. 2021, 302, 124191. [Google Scholar] [CrossRef]
- Saleh, E.; Tarawneh, A.; Naser, M.Z.; Abedi, M.; Almasabha, G. You only design once (YODO): Gaussian Process-Batch Bayesian optimization framework for mixture design of ultra high performance concrete. Constr. Build. Mater. 2022, 330, 127270. [Google Scholar] [CrossRef]
- Ziyad Sami, B.H.; Ziyad Sami, B.F.; Kumar, P.; Ahmed, A.N.; Amieghemen, G.E.; Sherif, M.M.; El-Shafie, A. Feasibility analysis for predicting the compressive and tensile strength of concrete using machine learning algorithms. Case Stud. Constr. Mater. 2023, 18, e01893. [Google Scholar] [CrossRef]
- Ghanbari, S.; Shahmansouri, A.A.; Akbarzadeh Bengar, H.; Jafari, A. Compressive strength prediction of high-strength oil palm shell lightweight aggregate concrete using machine learning methods. Environ. Sci. Pollut. Res. 2023, 30, 1096–1115. [Google Scholar] [CrossRef]
- Xi, B.; Li, E.; Fissha, Y.; Zhou, J.; Segarra, P. LGBM-based modeling scenarios to compressive strength of recycled aggregate concrete with SHAP analysis. Mech. Adv. Mater. Struct. 2023, 31, 5999–6014. [Google Scholar] [CrossRef]
- Al-Taai, S.R.; Azize, N.M.; Thoeny, Z.A.; Imran, H.; Bernardo, L.F.A.; Al-Khafaji, Z. XGBoost Prediction Model Optimized with Bayesian for the Compressive Strength of Eco-Friendly Concrete Containing Ground Granulated Blast Furnace Slag and Recycled Coarse Aggregate. Appl. Sci. 2023, 13, 8889. [Google Scholar] [CrossRef]
- Van Dao, D.; Trinh, S.H.; Ly, H.B.; Pham, B.T. Prediction of compressive strength of geopolymer concrete using entirely steel slag aggregates: Novel hybrid artificial intelligence approaches. Appl. Sci. 2019, 9, 1113. [Google Scholar] [CrossRef]
- Migallón, V.; Navarro-González, F.; Penadés, J.; Villacampa, Y. Parallel approach of a Galerkin-based methodology for predicting the compressive strength of the lightweight aggregate concrete. Constr. Build. Mater. 2019, 219, 56–68. [Google Scholar] [CrossRef]
- Salimbahrami, S.R.; Shakeri, R. Experimental investigation and comparative machine-learning prediction of compressive strength of recycled aggregate concrete. Soft Comput. 2021, 25, 919–932. [Google Scholar] [CrossRef]
- Lin, C.; Sun, Y.; Jiao, W.; Zheng, J.; Li, Z.; Zhang, S. Prediction of Compressive Strength and Elastic Modulus for Recycled Aggregate Concrete Based on AutoGluon. Sustainability 2023, 15, 12345. [Google Scholar] [CrossRef]
- Zhu, W.; Huang, L.; Mao, L.; Esmaeili-Falak, M. Predicting the uniaxial compressive strength of oil palm shell lightweight aggregate concrete using artificial intelligence-based algorithms. Struct. Concr. 2022, 23, 3631–3650. [Google Scholar] [CrossRef]
- García, J.A.; Varón, F.A.P. Neural network-based model to predict compressive strength of concrete incorporating supplementary cementitious materials and recycled aggregates. Rev. Mater. 2022, 27, e13218. [Google Scholar] [CrossRef]
- Suescum-Morales, D.; Salas-Morera, L.; Jiménez, J.R.; García-Hernández, L. A novel artificial neural network to predict compressive strength of recycled aggregate concrete. Appl. Sci. 2021, 11, 11077. [Google Scholar] [CrossRef]
- Kandiri, A.; Sartipi, F.; Kioumarsi, M. Predicting compressive strength of concrete containing recycled aggregate using modified ann with different optimization algorithms. Appl. Sci. 2021, 11, 485. [Google Scholar] [CrossRef]
- Phoeuk, M.; Kwon, M. Accuracy Prediction of Compressive Strength of Concrete Incorporating Recycled Aggregate Using Ensemble Learning Algorithms: Multinational Dataset. Adv. Civ. Eng. 2023, 2023, 5076429. [Google Scholar] [CrossRef]
- Duan, J.; Asteris, P.G.; Nguyen, H.; Bui, X.N.; Moayedi, H. A novel artificial intelligence technique to predict compressive strength of recycled aggregate concrete using ICA-XGBoost model. Eng. Comput. 2021, 37, 3329–3346. [Google Scholar] [CrossRef]
- Bu, L.; Du, G.; Hou, Q. Prediction of the compressive strength of recycled aggregate concrete based on artificial neural network. Materials 2021, 14, 3921. [Google Scholar] [CrossRef]
- Shakr Piro, N.; Mohammed, A.; Hamad, S.M.; Kurda, R. Electrical resistivity-Compressive strength predictions for normal strength concrete with waste steel slag as a coarse aggregate replacement using various analytical models. Constr. Build. Mater. 2022, 327, 127008. [Google Scholar] [CrossRef]
- Afshoon, I.; Miri, M.; Mousavi, S.R. Using the Response Surface Method and Artificial Neural Network to Estimate the Compressive Strength of Environmentally Friendly Concretes Containing Fine Copper Slag Aggregates. Iran. J. Sci. Technol.-Trans. Civ. Eng. 2023, 47, 3415–3429. [Google Scholar] [CrossRef]
- Faraj, R.H.; Mohammed, A.A.; Omer, K.M.; Ahmed, H.U. Soft computing techniques to predict the compressive strength of green self-compacting concrete incorporating recycled plastic aggregates and industrial waste ashes. Clean Technol. Environ. Policy 2022, 24, 2253–2281. [Google Scholar] [CrossRef]
- Zhang, T.; Zhang, Y.; Wang, Q.; Aganyira, A.K.; Fang, Y. Experimental study and machine learning prediction on compressive strength of spontaneous-combustion coal gangue aggregate concrete. J. Build. Eng. 2023, 71, 106518. [Google Scholar] [CrossRef]
- de-Prado-Gil, J.; Palencia, C.; Jagadesh, P.; Martínez-García, R. A Study on the Prediction of Compressive Strength of Self-Compacting Recycled Aggregate Concrete Utilizing Novel Computational Approaches. Materials 2022, 15, 5232. [Google Scholar] [CrossRef]
- Mohammadi Golafshani, E.; Behnood, A.; Hosseinikebria, S.S.; Arashpour, M. Novel metaheuristic-based type-2 fuzzy inference system for predicting the compressive strength of recycled aggregate concrete. J. Clean. Prod. 2021, 320, 128771. [Google Scholar] [CrossRef]
- Liu, X.; Jing, H.; Yan, P. Statistical analysis and unified model for predicting the compressive strength of coarse recycled aggregate OPC concrete. J. Clean. Prod. 2023, 400, 136660. [Google Scholar] [CrossRef]
- Debbarma, S.; Ransinchung, G.D. Using artificial neural networks to predict the 28-day compressive strength of roller-compacted concrete pavements containing RAP aggregates. Road Mater. Pavement Des. 2022, 23, 149–167. [Google Scholar] [CrossRef]
- Falah, M.W.; Hussein, S.H.; Saad, M.A.; Ali, Z.H.; Tran, T.H.; Ghoniem, R.M.; Ewees, A.A. Compressive Strength Prediction Using Coupled Deep Learning Model with Extreme Gradient Boosting Algorithm: Environmentally Friendly Concrete Incorporating Recycled Aggregate. Complexity 2022, 2022, 5433474. [Google Scholar] [CrossRef]
- Wang, C.; Wang, J.; Liu, X.; Cai, Y.F.; Zhang, Y.C. Orthogonal experimental design for compressive strength of recycled coarse aggregate concrete with silica fume-slag-fly ash hybrid micro-powders. Constr. Build. Mater. 2023, 408, 133669. [Google Scholar] [CrossRef]
- Gao, Y.; Li, Z.; Li, Y.; Zhu, Z.; Zhu, J. Development of chemistry-informed interpretable model for predicting compressive strength of recycled aggregate concrete containing supplementary cementitious materials. J. Clean. Prod. 2023, 425, 138733. [Google Scholar] [CrossRef]
- Tipu, R.K.; Batra, V.; Suman; Pandya, K.S.; Panchal, V.R. Efficient compressive strength prediction of concrete incorporating recycled coarse aggregate using Newton’s boosted backpropagation neural network (NB-BPNN). Structures 2023, 58, 105559. [Google Scholar] [CrossRef]
- Huang, P.; Dai, K.; Yu, X. Machine learning approach for investigating compressive strength of self-compacting concrete containing supplementary cementitious materials and recycled aggregate. J. Build. Eng. 2023, 79, 107904. [Google Scholar] [CrossRef]
- Mai, H.V.T.; Nguyen, M.H.; Trinh, S.H.; Ly, H.B. Toward improved prediction of recycled brick aggregate concrete compressive strength by designing ensemble machine learning models. Constr. Build. Mater. 2023, 369, 130613. [Google Scholar] [CrossRef]
- Moghaddas, S.A.; Nekoei, M.; Golafshani, E.M.; Behnood, A.; Arashpour, M. Application of artificial bee colony programming techniques for predicting the compressive strength of recycled aggregate concrete. Appl. Soft Comput. 2022, 130, 109641. [Google Scholar] [CrossRef]
- Sun, Z.; Li, Y.; Li, Y.; Su, L.; He, W. Investigation on compressive strength of coral aggregate concrete: Hybrid machine learning models and experimental validation. J. Build. Eng. 2024, 82, 108220. [Google Scholar] [CrossRef]
- Huang, Y.; Lei, Y.; Luo, X.; Fu, C. Prediction of compressive strength of rice husk ash concrete: A comparison of different metaheuristic algorithms for optimizing support vector regression. Case Stud. Constr. Mater. 2023, 18, e02201. [Google Scholar] [CrossRef]
- Zhang, X.; Dai, C.; Li, W.; Chen, Y. Prediction of compressive strength of recycled aggregate concrete using machine learning and Bayesian optimization methods. Front. Earth Sci. 2023, 11, 1112105. [Google Scholar] [CrossRef]
- Munir, M.J.; Kazmi, S.M.S.; Wu, Y.F.; Lin, X.; Ahmad, M.R. Development of a novel compressive strength design equation for natural and recycled aggregate concrete through advanced computational modeling. J. Build. Eng. 2022, 55, 104690. [Google Scholar] [CrossRef]
- Sheetal Thapa, R.P.; Halder, S. and L. Developing SonReb models to predict the compressive strength of concrete using different percentage of recycled brick aggregate. Can. J. Civ. Eng. 2022, 49, 346–356. [Google Scholar] [CrossRef]
- Lam, N.T.M.; Nguyen, D.L.; Le, D.H. Predicting compressive strength of roller-compacted concrete pavement containing steel slag aggregate and fly ash. Int. J. Pavement Eng. 2022, 23, 731–744. [Google Scholar] [CrossRef]
- Jagadesh, P.; de Prado-Gil, J.; Silva-Monteiro, N.; Martínez-García, R. Assessing the compressive strength of self-compacting concrete with recycled aggregates from mix ratio using machine learning approach. J. Mater. Res. Technol. 2023, 24, 1483–1498. [Google Scholar] [CrossRef]
- Migallón, V.; Penadés, H.; Penadés, J.; Tenza-Abril, A.J. A Machine Learning Approach to Prediction of the Compressive Strength of Segregated Lightweight Aggregate Concretes Using Ultrasonic Pulse Velocity. Appl. Sci. 2023, 13, 1953. [Google Scholar] [CrossRef]
- Babu, B.R.; Thenmozhi, R. Prediction of Compressive Strength of Sintered Fly Ash Aggregate Concrete Using Artificial Neural Networking. Rev. Romana Mater. Rom. J. Mater. 2022, 52, 311–317. [Google Scholar]
- Alyaseen, A.; Poddar, A.; Kumar, N.; Sihag, P.; Lee, D.; Kumar, R.; Singh, T. Assessing the compressive and splitting tensile strength of self-compacting recycled coarse aggregate concrete using machine learning and statistical techniques. Mater. Today Commun. 2024, 38, 107970. [Google Scholar] [CrossRef]
- Qureshi, H.J.; Alyami, M.; Nawaz, R.; Hakeem, I.Y.; Aslam, F.; Iftikhar, B.; Gamil, Y. Prediction of compressive strength of two-stage (preplaced aggregate) concrete using gene expression programming and random forest. Case Stud. Constr. Mater. 2023, 19, e02581. [Google Scholar] [CrossRef]
- de-Prado-Gil, J.; Palencia, C.; Silva-Monteiro, N.; Martínez-García, R. To predict the compressive strength of self compacting concrete with recycled aggregates utilizing ensemble machine learning models. Case Stud. Constr. Mater. 2022, 16, e01046. [Google Scholar] [CrossRef]
- Khan, K.; Ahmad, W.; Amin, M.N.; Aslam, F.; Ahmad, A.; Al-Faiad, M.A. Comparison of Prediction Models Based on Machine Learning for the Compressive Strength Estimation of Recycled Aggregate Concrete. Materials 2022, 15, 3430. [Google Scholar] [CrossRef] [PubMed]
- Chen, M.; Liu, B.; Li, L.; Cao, L.; Huang, Y.; Wang, S.; Zhao, P.; Lu, L.; Cheng, X. Rheological parameters, thixotropy and creep of 3D-printed calcium sulfoaluminate cement composites modified by bentonite. Compos. Part B Eng. 2020, 186, 107821. [Google Scholar] [CrossRef]
- Altuncı, Y.T.; Saplıoğlu, K. Development of Prediction Models for Compressive Strength in Cement Mortar with Development of Prediction Models for Compressive Strength in Cement Mortar with Bentonite using Machine Learning Techniques. Int. J. 3D Print. Technol. Digit. Ind. 2024, 8, 214–224. [Google Scholar] [CrossRef]
- Kumar, R.; Kumar, S.; Rai, B.; Samui, P. Development of hybrid gradient boosting models for predicting the compressive strength of high-volume fly ash self-compacting concrete with silica fume. Structures 2024, 66, 106850. [Google Scholar] [CrossRef]
- Shakya, D.; Deshpande, V.; Safari, M.J.S.; Agarwal, M. Performance evaluation of machine learning algorithms for the prediction of particle Froude number (Frn) using hyper-parameter optimizations techniques. Expert Syst. Appl. 2024, 256, 124960. [Google Scholar] [CrossRef]
- Acar, R.; Saplioglu, K. Using the Particle Swarm Optimization (PSO) Algorithm for Baseflow Separation and Determining the Trends for the Yesilirmak River (North Turkey). Russ. Meteorol. Hydrol. 2024, 49, 40–51. [Google Scholar] [CrossRef]
- Kleiv, R.A.; Thornhill, M. Predicting the neutralisation of acid mine drainage in anoxic olivine drains. Miner. Eng. 2008, 21, 279–287. [Google Scholar] [CrossRef]
- Canpolat, M.; Beycioğlu, A.; Morova, N.; Çetin, S.; Çetin, H.M.; Gündoğan, H. Atık Olivin Mineralinin Asfalt Betonunda Filler Olarak Kullanımı. Düzce Üniversitesi Bilim Ve Teknol. Derg. 2022, 10, 555–566. [Google Scholar] [CrossRef]
- Acar, İ. Sintering properties of olivine and its utilization potential as a refractory raw material: Mineralogical and microstructural investigations. Ceram. Int. 2020, 46, 28025–28034. [Google Scholar] [CrossRef]
- Güçlüer, K.; Yaldız, M.R.; Günaydın, O. An investigation of the high-temperature behavior of basalt, olivine, and pyrophyllite additive mortars. Iran. J. Sci. Technol.-Trans. Civ. Eng. 2023, 47, 1467–1484. [Google Scholar] [CrossRef]
- Atlı, I.; Ipek, M. Investigation of the Mechanical Behaviors of Sustainable Green Reactive Powder Concrete Produced Using Ferrochrome Slag and Waste Fiber. Sustainability 2024, 16, 4714. [Google Scholar] [CrossRef]
- Moon, K.; Park, S.; Kim, S. Compressive Strength of Concrete due to Moisture Conditions of Recycled Coarse Aggregates and Curing Conditions. KSCE J. Civ. Environ. Eng. Res. 2019, 39, 485–492. [Google Scholar]
- Park, J.; Park, C.; Kim, S.J.; Jae, Y. Characterization of Compressive Strength and Elastic Modulus of Recycled Aggregate Concrete with Respect to Replacement Ratios. J. Korean Soc. Civ. Eng. 2006, 26, 213–218. [Google Scholar]
- Sharba, A.A. The Efficiency of Steel Slag and Recycled Concrete Aggregate on the Strength Properties of Concrete. KSCE J. Civ. Eng. 2019, 23, 4846–4851. [Google Scholar] [CrossRef]
- Ge, P.; Huang, W.; Zhang, H.; Quan, W.; Guo, Y. Study on Calculation Model for Compressive Strength of Water Saturated Recycled Aggregate Concrete. KSCE J. Civ. Eng. 2022, 26, 273–285. [Google Scholar] [CrossRef]
- Alyamaç, K.E.; Aydin, A.B. Concrete properties containing fine aggregate marble powder. KSCE J. Civ. Eng. 2015, 19, 2208–2216. [Google Scholar] [CrossRef]
- Tanyildizi, H.; Şengür, A.; Akbulut, Y.; Şahin, M. Deep learning model for estimating the mechanical properties of concrete containing silica fume exposed to high temperatures. Front. Struct. Civ. Eng. 2020, 14, 1316–1330. [Google Scholar] [CrossRef]
- Shariati, M.; Mafipour, M.S.; Mehrabi, P.; Bahadori, A.; Zandi, Y.; Salih, M.N.A.; Nguyen, H.; Dou, J.; Song, X.; Poi-Ngian, S. Application of a Hybrid Artificial Neural Model in Behavior Prediction of Channel Shear Connectors Embedded in Normal and High-Strength Concrete. Appl. Sci. 2019, 9, 5534. [Google Scholar] [CrossRef]
- Huang, X.Y.; Wu, K.Y.; Wang, S.; Lu, T.; Lu, Y.F.; Deng, W.C.; Li, H.M. Compressive Strength Prediction of Rubber Concrete Based on Artificial Neural Network Model with Hybrid Particle Swarm Optimization Algorithm. Materials 2022, 15, 3934. [Google Scholar] [CrossRef]
- Sammen, S.S.; Ghorbani, M.A.; Malik, A.; Tikhamarine, Y.; AmirRahmani, M.; Al-Ansari, N.; Chau, K.W. Enhanced artificial neural network with Harris hawks optimization for predicting scour depth downstream of ski-jump spillway. Appl. Sci. 2020, 10, 5160. [Google Scholar] [CrossRef]
- Ecer, F.; Ardabili, S.; Band, S.S.; Mosavi, A. Training multilayer perceptron with genetic algorithms and particle swarm optimization for modeling stock price index prediction. Entropy 2020, 22, 1239. [Google Scholar] [CrossRef] [PubMed]
- Ibrahim, M.A.; Çamur, H.; Savaş, M.A.; Sabo, A.K.; Mustapha, M.; Abba, S.I. Hybrid Artificial Intelligence Models with Multi Objective Optimization for Prediction of Tribological Behavior of Polytetrafluoroethylene Matrix Composites. Appl. Sci. 2022, 12, 8671. [Google Scholar] [CrossRef]
- Marini, F.; Walczak, B. Particle swarm optimization (PSO). A tutorial. Chemom. Intell. Lab. Syst. 2015, 149, 153–165. [Google Scholar] [CrossRef]
- Acar, R.; Saplıoğlu, K. Akarsulardaki Sediment Taşiniminin YapaSinir Ağlari Ve AnfisYöntemleri KullanilaraTespiti. Ömer Halisdemir Üniversitesi Mühendis. Bilim. Derg. 2020, 9, 437–450. [Google Scholar] [CrossRef]
- Saplıoğlu, K.; Acar, R. K-Means Kümeleme Algoritması Kullanılarak Oluşturulan Yapay Zekâ Modelleri ile Sediment Taşınımının Tespiti. Bitlis Eren Üniversitesi Fen Bilim. Derg. 2020, 9, 306–322. [Google Scholar] [CrossRef]
- Gaidhane, V.H.; Kumar, N.; Mittal, R.K.; Rajevenceltha, J. An efficient approach for cement strength prediction. Int. J. Comput. Appl. 2023, 45, 8–18. [Google Scholar] [CrossRef]
- Nafees, A.; Amin, M.N.; Khan, K.; Nazir, K.; Ali, M.; Javed, M.F.; Aslam, F.; Musarat, M.A.; Vatin, N.I. Modeling of mechanical properties of silica fume-based green concrete using machine learning techniques. Polymers 2022, 14, 30. [Google Scholar] [CrossRef]
- Taylor, K.E. Summarizing multiple aspects of model performance in a single diagram. J. Geophys. Res. Atmos. 2001, 106, 7183–7192. [Google Scholar] [CrossRef]
- Shiru, M.S.; Shahid, S.; Chae, S.T.; Chung, E.S. Replicability of Annual and Seasonal Precipitation by CMIP5 and CMIP6 GCMs over East Asia. KSCE J. Civ. Eng. 2022, 26, 1978–1989. [Google Scholar] [CrossRef]
- Ekwueme, B.N.; Ibeje, A.O. Comparison of Monte Carlo Schemes in the Modeling of Extreme Flood in Tropical Rain Forest Basins. KSCE J. Civ. Eng. 2023, 27, 5175–5189. [Google Scholar] [CrossRef]
- Bian, J.; Huo, R.; Zhong, Y.; Guo, Z. XGB-Northern Goshawk Optimization: Predicting the Compressive Strength of Self-Compacting Concrete. KSCE J. Civ. Eng. 2024, 28, 1423–1439. [Google Scholar] [CrossRef]
- Jumarie, G. Table of some basic fractional calculus formulae derived from a modified Riemann–Liouville derivative for non-differentiable functions. Appl. Math. Lett. 2009, 22, 378–385. [Google Scholar] [CrossRef]


| Research Gaps in the Literature | Research |
|---|---|
| 1, 2, 3 | [37,90,91,92,93,94,95,96,97,98,99,100,101,102,103,104,105,106,107,108,109,110,111,112,113,114,115,116,117,118,119,120,121,122,123,124,125] |
| 2, 3 | [126,127,128,129,130,131] |
| Method | Number of Studies Using the Method | Usage Frequency (%) |
|---|---|---|
| Ada Boost (AB) | 3 | 2.0 |
| Mean Absolute Error (MAE) | 8 | 5.2 |
| Adaptive Neuro-Fuzzy Inference System (ANFIS) | 3 | 2.0 |
| Artificial Neural Network (ANN) | 21 | 13.7 |
| Bagging Regressor (BR) | 5 | 3.3 |
| Cat Boost (CB) | 3 | 2.0 |
| Coefficient of Determination (R2) | 12 | 7.8 |
| Decision Tree (DT) | 4 | 2.6 |
| (Deep Learning Neural Network) DLNN | 1 | 0.7 |
| Extreme Learning Machine (ELM) | 1 | 0.7 |
| Firefly Algorithm (FA) | 1 | 0.7 |
| Fuzzy Logic (FL) | 9 | 5.9 |
| Gene Expression Programming (GEP) | 4 | 2.6 |
| Gradient Boost (GB) | 7 | 4.6 |
| Gray Wolf Optimization (GWO) | 1 | 0.7 |
| K-Nearest Neighbor (KNN) | 7 | 4.6 |
| Light Gradient-Boosting Machine Regressor (LGBM) | 3 | 2.0 |
| Multivariate Adaptive Regression Spline (MARS) | 1 | 0.7 |
| Machine Learning (ML) | 2 | 1.3 |
| Multiple Linear Regression (MLR) | 5 | 3.3 |
| M5P Tree (M5PT) | 3 | 2.0 |
| Random Forest (RF) | 8 | 5.2 |
| Root Mean Square Error (RMSE) | 9 | 5.9 |
| Support Vector Regression (SVR) | 4 | 2.6 |
| Support Vector Machine (SVM) | 4 | 2.6 |
| Weighted Root Mean Square Error (WRMSE) | 14 | 9.2 |
| XG Boost (XGB) | 6 | 3.9 |
| Particle Swarm Optimization (PSO) | 4 | 2.6 |
| Components | CEM II 42.5 R | Olivine |
|---|---|---|
| SiO2 (S) | 25.22 | 30.19 |
| Al2O3 (A) | 8.05 | - |
| Fe2O3 (F) | 3.78 | 14.71 |
| CaO | 52.13 | 6.90 |
| MgO | 1.54 | 44.15 |
| SO3 | 3.35 | 0.02 |
| Na2O | 1.02 | 0.41 |
| K2O | 0.89 | - |
| Cl− | 0.071 | - |
| Loss of ignition | 2.99 | 3.53 |
| Dosage | CEM II 42.5 R (kg) | Aggregate 0–5 mm (kg) | Aggregate 5–15 mm (kg) | Aggregate 15–25 mm (kg) | Water (kg) | Plasticizer (kg) |
|---|---|---|---|---|---|---|
| 180 | 180 | 1241.46 | 334.35 | 500.53 | 120 | 1.26 |
| 185 | 185 | 1238.83 | 333.65 | 499.47 | 120 | 1.30 |
| 190 | 190 | 1236.32 | 332.94 | 498.42 | 120 | 1.33 |
| 195 | 195 | 1233.59 | 332.23 | 497.36 | 120 | 1.37 |
| 200 | 200 | 1230.96 | 331.53 | 496.30 | 120 | 1.40 |
| 205 | 205 | 1228.34 | 330.82 | 495.24 | 120 | 1.44 |
| 210 | 210 | 1225.72 | 330.11 | 494.19 | 120 | 1.47 |
| 215 | 215 | 1223.09 | 329.41 | 493.13 | 120 | 1.51 |
| 220 | 220 | 1220.47 | 328.70 | 492.07 | 120 | 1.54 |
| 225 | 225 | 1217.85 | 327.99 | 491.01 | 120 | 1.58 |
| 230 | 230 | 1215.22 | 327.29 | 489.96 | 120 | 1.61 |
| 235 | 235 | 1212.60 | 326.58 | 488.90 | 120 | 1.65 |
| 240 | 240 | 1209.98 | 325.88 | 487.84 | 120 | 1.68 |
| 245 | 245 | 1207.36 | 325.17 | 486.78 | 120 | 1.72 |
| 250 | 250 | 1204.73 | 324.46 | 485.73 | 120 | 1.75 |
| 255 | 255 | 1202.11 | 323.76 | 484.67 | 120 | 1.79 |
| 260 | 260 | 1199.49 | 323.05 | 483.61 | 120 | 1.82 |
| 265 | 265 | 1196.86 | 322.34 | 482.55 | 120 | 1.86 |
| 270 | 270 | 1194.24 | 321.64 | 481.50 | 120 | 1.89 |
| 275 | 275 | 1191.62 | 320.93 | 480.44 | 120 | 1.93 |
| 280 | 280 | 1188.99 | 320.22 | 479.38 | 120 | 1.96 |
| 285 | 285 | 1186.37 | 319.52 | 478.32 | 120 | 2.00 |
| 290 | 290 | 1183.75 | 318.81 | 477.26 | 120 | 2.03 |
| 295 | 295 | 1181.12 | 318.10 | 476.21 | 120 | 2.07 |
| 300 | 300 | 1178.50 | 317.40 | 475.15 | 120 | 2.10 |
| 305 | 305 | 1175.88 | 316.69 | 474.09 | 120 | 2.14 |
| 310 | 310 | 1173.30 | 316.00 | 473.05 | 120 | 2.17 |
| 315 | 315 | 1170.73 | 315.30 | 472.02 | 120 | 2.21 |
| 320 | 320 | 1170.58 | 315.27 | 471.96 | 120 | 2.24 |
| 325 | 325 | 1170.53 | 315.25 | 471.94 | 120 | 2.28 |
| Day | Dosage (kg) | Aggregate 0–5 mm (kg) | Aggregate 5–15 mm (kg) | Aggregate 15–25 mm (kg) | Plasticizer (kg) | Compressive Strength (MPa) | |
|---|---|---|---|---|---|---|---|
| Average | 45.25 | 253.26 | 1.77 | 1203.36 | 324.09 | 485.17 | 30.4 |
| Standard error | 3.26 | 4.63 | 0.03 | 2.38 | 0.64 | 0.96 | 1.1 |
| Median | 42.00 | 255.00 | 1.79 | 1202.11 | 323.76 | 484.67 | 29.3 |
| Standard deviation | 31.31 | 44.44 | 0.31 | 22.80 | 6.14 | 9.19 | 9.1 |
| Sample variance | 980.34 | 1974.96 | 0.10 | 519.67 | 37.69 | 84.47 | 83.0 |
| Kurtosis | −1.35 | −1.21 | −1.21 | −1.26 | −1.26 | −1.26 | -0.4 |
| Skewness | 0.25 | −0.01 | −0.01 | 0.07 | 0.07 | 0.07 | 0.4 |
| Range | 83.00 | 145.00 | 1.02 | 70.92 | 19.10 | 28.59 | 38.3 |
| Minimum | 7.00 | 180.00 | 1.26 | 1170.53 | 315.25 | 471.94 | 14.1 |
| Maximum | 90.00 | 325.00 | 2.28 | 1241.46 | 334.35 | 500.53 | 52.5 |
| Confidence level (95.0%) | 92 | 92 | 92 | 92 | 92 | 92 | 2.3 |
| Day | Dosage (kg) | Aggregate 0–5 mm (kg) | Aggregate 5–15 mm (kg) | Aggregate 15–25 mm (kg) | Plasticizer (kg) | Compressive Strength (MPa) | |
|---|---|---|---|---|---|---|---|
| Average | 45.25 | 253.57 | 1.75 | 1171.27 | 315.45 | 472.23 | 34.44 |
| Standard error | 5.99 | 9.09 | 0.05 | 0.08 | 0.02 | 0.03 | 2.08 |
| Median | 42.00 | 250.00 | 1.75 | 1171.27 | 315.45 | 472.23 | 32.72 |
| Standard deviation | 31.71 | 48.09 | 0.29 | 0.40 | 0.11 | 0.16 | 11.03 |
| Sample variance | 1005.6 | 2312.70 | 0.08 | 0.16 | 0.01 | 0.03 | 121.65 |
| Kurtosis | −1.36 | 0.73 | −1.26 | −1.26 | −1.26 | −1.25 | −0.47 |
| Skewness | 0.26 | 0.72 | 0.00 | 0.00 | 0.00 | 0.00 | 0.38 |
| Range | 83.00 | 200.00 | 0.84 | 1.18 | 0.32 | 0.48 | 42.94 |
| Minimum | 7.00 | 190.00 | 1.33 | 1170.68 | 315.29 | 472.00 | 15.57 |
| Maximum | 90.00 | 390.00 | 2.17 | 1171.86 | 315.61 | 472.47 | 58.50 |
| Confidence level (95.0%) | 28 | 28 | 28 | 28 | 28 | 28 | 28 |
| Training Data | Testing Data | ||||||||
|---|---|---|---|---|---|---|---|---|---|
| Model | Model No | R2 | WRMSE | RMSE | MAE | R2 | WRMSE | RMSE | MAE |
| WRMSE 1 | A | 0.9489 | 0.3670 | 0.8567 | 6.8073 | 0.8812 | 0.9418 | 1.3725 | 10.1092 |
| WRMSE 2 | B | 0.9486 | 0.3673 | 0.8571 | 6.8101 | 0.8546 | 0.605 | 0.8571 | 8.2265 |
| RMSE 1 | C | 0.9488 | 0.3591 | 0.8475 | 6.7852 | 0.8750 | 0.8824 | 1.3285 | 9.6654 |
| RMSE 2 | D | 0.9486 | 0.3607 | 0.8494 | 6.7956 | 0.8701 | 0.6739 | 1.1610 | 8.0657 |
| MAE 1 | E | 0.9486 | 0.3729 | 0.8636 | 6.6691 | 0.8543 | 0.9116 | 1.3503 | 9.1910 |
| MAE 2 | F | 0.9484 | 0.3733 | 0.8641 | 6.6727 | 0.8579 | 0.8081 | 1.2713 | 8.5771 |
| ANN 9 | G | 0.9994 | 0.0039 | 0.0885 | 0.5709 | 0.5606 | 6.9923 | 3.7396 | 26.8049 |
| ANN 5 | H | 0.9861 | 0.1355 | 0.5206 | 3.6353 | 0.5046 | 6.9242 | 3.7213 | 33.4046 |
Disclaimer/Publisher’s Note: The statements, opinions and data contained in all publications are solely those of the individual author(s) and contributor(s) and not of MDPI and/or the editor(s). MDPI and/or the editor(s) disclaim responsibility for any injury to people or property resulting from any ideas, methods, instructions or products referred to in the content. |
© 2025 by the author. Licensee MDPI, Basel, Switzerland. This article is an open access article distributed under the terms and conditions of the Creative Commons Attribution (CC BY) license (https://creativecommons.org/licenses/by/4.0/).
Share and Cite
Altuncı, Y.T. Predicting the Compressive Strength of Concrete Incorporating Olivine Aggregate at Varied Cement Dosages Using Artificial Intelligence. Processes 2025, 13, 2130. https://doi.org/10.3390/pr13072130
Altuncı YT. Predicting the Compressive Strength of Concrete Incorporating Olivine Aggregate at Varied Cement Dosages Using Artificial Intelligence. Processes. 2025; 13(7):2130. https://doi.org/10.3390/pr13072130
Chicago/Turabian StyleAltuncı, Yusuf Tahir. 2025. "Predicting the Compressive Strength of Concrete Incorporating Olivine Aggregate at Varied Cement Dosages Using Artificial Intelligence" Processes 13, no. 7: 2130. https://doi.org/10.3390/pr13072130
APA StyleAltuncı, Y. T. (2025). Predicting the Compressive Strength of Concrete Incorporating Olivine Aggregate at Varied Cement Dosages Using Artificial Intelligence. Processes, 13(7), 2130. https://doi.org/10.3390/pr13072130