Abstract
Blue-green algae blooms present persistent environmental challenges in freshwater ecosystems, yet ecological interactions within the bacterial communities of Cylindrospermopsis-bloom reservoirs remain poorly understood. In this study, water samples were collected from February to May 2024 from 11 sampling sites in a Cylindrospermopsis-bloom reservoir in western Guangdong province, China. At each sampling point, a water sample was collected every month. High-throughput sequencing was applied to analyze the interaction between Cylindrospermopsis and other bacteria. As shown in our results, the phyla Actinobacteriota, Proteobacteria, Bacteroidota, Verrucomicrobiota, and Cyanobacteria were revealed as dominant phyla. Bacterial communities exhibited significant seasonal differences between flood and non-flood periods (ANOSIM: R = 0.472, p = 0.001). Cylindrospermopsis (dominance index Y = 0.53) acted as the keystone in the co-occurrence network (Zi < 2.5, Pi > 0.62) and closely interacted with other bacteria. For better management of the blue-green algae bloom reservoir, the phyla of Actinobacteriota, Dependentiae, Acidobacteriota, Armatimonadota, Gemmatimonadota, and Desulfobacterota were proposed as microbial indicators for the eutrophic process. This study provides a new insight into the interactions of Cyanobacteria with other bacteria and the management of blue-green algae outbreaks in reservoirs.
1. Introduction
With the rapid development of industrialization and agriculture, excessive inputs of nitrogen and phosphorus have exacerbated eutrophication in aquatic environments. Eutrophication could lead to serious negative ecological effects: for instance, increased microbial biomass, decreased biodiversity, lower efficiency of nutrient use, and accelerated cycles [1,2]. Recently, lakes in China have experienced various degrees of eutrophic pollution during the rapid anthropogenic development period, leading to a series of problems. Le et al.’s study [3] proposed that lake water eutrophication in China has disrupted the drinking water supply. Jin et al. [4] demonstrated that the water quality and lake ecosystems are declining, as many lakes in China commonly undergo eutrophication. Wang et al. [5] indicated that Lake Wuli in Jiangsu Province, China, has experienced an evidently deteriorating trend due to overexploitation. Reservoirs are characterized by slow flow rates and long hydraulic retention times, usually corresponding to eutrophic status and further leading to water quality deterioration, ecosystem instability, and a high frequency of blue-green algal outbreaks. Qin et al.’s study [6] considered that shallow lakes, which are mixed systems without thermal stratification and sediment resuspension, similarly to reservoirs, are commonly related to the loss of control of eutrophication. Jiang et al. [7] found that new reservoirs in China covered by villages and farmlands were easily eutrophic with low biodiversity and self-purification capacity. Rocha et al. [8] assumed that the reservoirs with low water volume corresponded with a higher nutrient level. Except for abnormal ecological responses, Cyanobacterial blooms are of particular concern, with their potential production of toxins, such as cylindrospermopsin, saxitoxin [9], and microcystin [10] produced by Cylindrospermopsis and Microcystis, posing severe threats to aquatic ecosystems and human health [11,12]. With its concentrated distribution in subtropical and tropical areas [13,14] and sensitivity to growth environment factors [15,16], there is relatively less research focusing on Cylindrospermopsis compared with Microcystis and other Cyanobacterial algae, and the mechanism of Cylindrospermopsis bloom needs to be further investigated [17].
The reasons for the outbreak of Cylindrospermopsis are comprehensive and are related not only to abiotic factors but also to biotic factors [18]. There is a complex interaction between Cyanobacteria and other bacteria in aquatic microbial communities, which plays an important role in their respective growth [19,20]. Among the microbes, some bacteria could promote the growth of Cylindrospermopsis by providing some essential compounds [21,22], such as nitrates and phosphates, or enhancing their stress tolerance, and some algicidal bacteria inhibit blue-green algae growth by competing for nutrients or lysing algal cells [23]. The interactions between them are important in shaping aquatic microbial communities’ structure and the development of harmful blue-green algal blooms. Exploring the changes in microbial communities in algal outbreaks is of great significance for the control of Cylindrospermopsis blooms.
However, the understanding of microbial communities’ dynamics in a blue-green algal bloom aquatic environment and the interaction of Cylindrospermopsis and other bacteria is still unclear. For better prevention and the management of algal outbreaks, current studies are mainly focused on bacteria inhibiting the growth of Cyanobacteria, such as Bacilluscereus L7 and Lysobacter sp., which can lyse algal cells [24,25]. Some studies have focused on identifying the microbial indicators in eutrophic water, which were reported to be closely related to eutrophic environmental factors, yet lack a discussion on the interactions with Cyanobacteria. For instance, Thermoanaerobaculum (Acidobacteria), Synechococcus (Cyanobacteria), and Blastocatella (Chlorobi) were mentioned to positively relate with the concentrations of Chla (p < 0.05) in the eutrophic Gehu lake, and it was suggested that the microbial taxa could thrive in nutrient-rich conditions and could be used for monitoring eutrophication progress [26]. Ji et al. [27] applied the ratio of the abundance of Cyanobacteria and Actinobacteria to indicate the early warning of eutrophication in water, which is also based on environmental parameters. In general, taking the relationships between Cyanobacteria and other bacteria into consideration is more comprehensive when identifying microbial indicators. For the better management of blue-green algae blooms, the research of interactions between Cyanobacteria and other bacteria requires further investigation, which can improve the criterion for identifying other bacterial indicators.
A reservoir in western Guangdong province, China, serves multiple functions, including urban and industrial water supply, agricultural irrigation, flood prevention, and ecological environment maintenance. However, due to rapid socioeconomic development and climate change, the reservoir has become severely eutrophic, particularly during flood seasons. In recent years, Cyanobacterial blooms dominated by Cylindrospermopsis have frequently occurred in the reservoir. Similarly, Han et al. [28] reported that most drinking water reservoirs downstream in Guangdong Province are approaching a eutrophic state, as upstream rivers suffer from deteriorating water quality under the pressure of societal development. Lei et al. [29] confirmed the widespread distribution of Cylindrospermopsis in Dongguan city, southern China, observing it in 21 out of 25 reservoirs. Lei et al.’s study [30] indicated that Cylindrospermopsis was present in 19 out of 20 reservoirs, with biomass ranging from 0.0001 to 39.740 mg·L−1. Yang et al. [31] also reported a high abundance of filamentous Cyanobacteria, including Cylindrospermopsis, in tropical urban reservoirs in southern China. To improve the management of Cyanobacterial blooms, it is essential to investigate the dynamics of microbial communities, examine the interactions between Cylindrospermopsis and other bacteria, and identify potential bacterial indicators. In this study, we conducted a four-month monitoring campaign to assess environmental factors and employed 16S rRNA high-throughput sequencing to analyze microbial community shifts across different eutrophic levels. Additionally, we aimed to identify bacterial indicators associated with Cylindrospermopsis blooms. This research provides new insights into the interactions between Cylindrospermopsis and other bacteria, offering potential strategies for controlling Cyanobacterial blooms in eutrophic reservoirs.
2. Materials and Methods
2.1. Study Area
The study reservoir is located in Lianjiang, Zhanjiang, Guangdong Province (21°39′ N, 110°17′ E), in China. It has a total storage capacity of 1.144 billion m3, a maximum water surface area of 122 km2, and a catchment area of 1495 km2. Over the past 60 years, its average annual water yield has been approximately 1.48 billion m3. To ensure representative spatial coverage and sampling efficiency, 11 sampling points were strategically selected across the reservoir. Their distribution is illustrated in Figure 1.
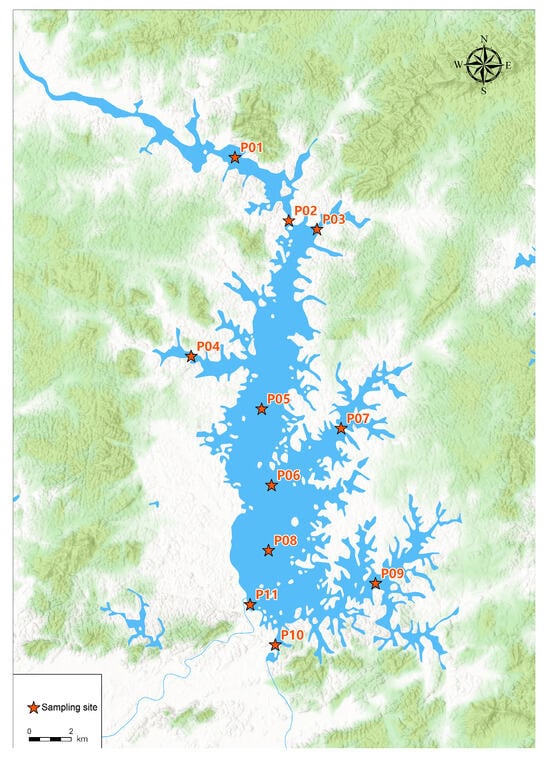
Figure 1.
Sample points’ distribution in the reservoir.
2.2. Sampling and Analysis
Water samples were collected from February to May 2024, covering both non-flood (February–March) and flood (April–May) seasons. To minimize variability, all sampling operations were consistently conducted between 10:00 a.m. and 12:00 noon each month. Samples were collected monthly at each of the 11 sampling points. A total of 44 samples were collected. At each sampling location, 2 L of surface water samples was collected from 0.5 m below the water surface. Samples were immediately transported to the laboratory and stored at 4 °C until analysis. From each sample, 200 mL of water sample was used for water quality analysis. Field measurements of temperature (T), dissolved oxygen (DO), and pH were obtained using a YSI 650MDS multiparameter water quality meter (YSI Incorporated., Yellow Springs, OH, USA). Laboratory analyses included the total nitrogen (TN), total phosphorus (TP), ammonia nitrogen (NH4+-N), and permanganate index (CODMn), performed according to standard methods outlined in the “Water and Wastewater Monitoring and Analysis Method (China)”. Chlorophyll-a (Chla) concentrations were determined using a portable PAM fluorometer AquaPen-CAP-C 100 (PSI, Czech Republic). All physicochemical parameters were analyzed in triplicate to ensure data quality.
Genomic DNA was extracted from filter membranes using Soil DNA Extraction CZ Kit (China) according to the manufacturer’s protocol. DNA purity and concentration were determined using a NanoDrop One spectrophotometer (Thermo Fisher Scientific, MA, USA). For bacterial community analysis, the V3-V4 regions of the 16S rRNA gene were amplified using the universal primer pair 338F (5′-ACTCCTACGGGAGGCAGCCAG-3′) and 806R (5′-GACTACHVGGGTWTCTAAT-3′). PCR amplification was performed using barcoded specific primers and Premix Taq DNA polymerase. The amplification products were verified by 1% agarose gel electrophoresis [32], and only samples exhibiting distinct target bands were selected for subsequent analysis. All high-throughput sequencing procedures, including library construction, quality control, and sequencing, were conducted by Magigene Sequencing (Magigene, Shanghai, China). Data was analyzed on an IlluminaMiseq platform (Guangdong Magigene Biotechnology Co., Ltd., Guangzhou, China). For the absolute quantitation of Cyanobacteria, parallel water samples (50 mL) were collected and immediately preserved with 5 mL of 10% Lugol’s iodine solution. Following 24–48 h of sedimentation for fixation, samples were concentrated and washed with distilled water prior to microscopic examination. Cyanobacterial identification was based on comprehensive morphological characterization, including colony morphology and dimensions, filamentous structure and arrangement, cellular morphology and size, trichome characteristics, and cell wall thickness. Quantitative analysis was performed using an Olympus BX53 light microscope (Olympus Co., Ltd., Japan) at 40× magnification. Cell densities were enumerated and expressed as cells per liter and calculated according to the following standard counting equation [33]:
where C = the number of cells counted, A = the area of the field (mm2), D = the depth of field (mm), and F = the number of fields counted
The dominance Y of blue-green algae was determined by the following equation:
where is the number of x-th species, N is the total number of all species, and is the frequency of the x-th species appearing in each sample.
2.3. Data Processing
The DNA sequencing data were optimized and processed through the Magigene Cloud Platform (http://cloud.magigene.com/ (accessed on 10 February 2025)). After removing low-quality and chimeric sequences, paired-end reads were merged and clustered into operational taxonomic units (OTUs) at a 97% similarity threshold using UPARSE. The most abundant sequence within each OUT was selected as the representative sequence for downstream analysis. We conducted comprehensive microbial community analyses through the Magigene cloud platform, including the following: α-diversity indices (Chao1 richness and Shannon diversity), community richness index, redundancy analysis (RDA), principal coordinate analysis (PCoA), community composition analysis (relative abundance), significant difference testing (one-way ANOVA), and environmental factor correlation analysis (Spearman’s rank correlation). PCoA was employed to visualize sample dissimilarity through a dimensionality reduction in the distance matrix. The distance algorithms of PCoA in this study were Bray–Curtis and Euclidean. Spatial proximity in PCoA plots indicates greater similarity in microbial community composition. Co-occurrence network analysis was performed using the igraph package in R (v 4.42) [34], with network topology determined by the following: number of connections between nodes, correlation coefficients, and betweenness centrality (identifying keystone taxa).
The trophic-level index (TLI, derived from China’s Environmental Monitoring Station) was calculated using five parameters: chlorophyll-a (Chla), total phosphorus (TP), total nitrogen (TN), Secchi depth (SD), and permanganate index (CODMn). The trophic state classification was as follows: TLI < 30, referred to as “Oligotropher”; 30 ≤ TLI ≤ 50, referred to as “Mesotropher”; TLI > 50, referred to as “Eutropher”. All geospatial visualizations were generated using ArcGIS 10.3 software (ESRI, Redlands, CA, USA).
3. Results
3.1. Water Quality and Trophic Status
Environmental parameters (Table 1) differed between flood and non-flood seasons (detailed data in Table S1). Chlorophyll-a (Chla), CODMn, total phosphorus (TP), dissolved oxygen (DO), and NH4+-N increased during the flood season, while transparency (Secchi depth, SD) and total nitrogen (TN) decreased. These changes corresponded to an elevation in the trophic-level index (TLI) from 40.74, indicating progression toward eutrophic conditions during flood periods. Cyanobacterial abundance demonstrated pronounced seasonal variation (Figure 2), with cell densities increasing from 3.87 × 10⁷ cells/L in the non-flood season to 1.09 × 10⁸ cells/L during the flood season. The dominance Y index of Cyanobacteria is shown in Figure 3a, and the main species are Cylindrospermopsis sp. (dominance Y = 0.53), Pseudanabaena sp. (dominance Y = 0.13), and Microcystis sp. (dominance Y = 0.04). Notably, Cylindrospermopsis sp. exhibited increased dominance during the flood season, establishing itself as the reservoir’s primary Cyanobacterial species (complete dominance data in Table S2).

Table 1.
Average of water parameters in the flood and non-flood seasons.
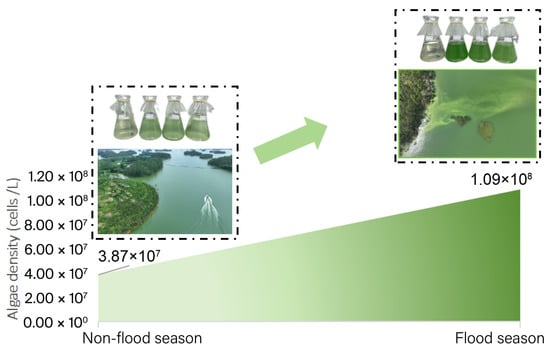
Figure 2.
Average of Cyanobacteria’s density (cells/L) in two seasons.
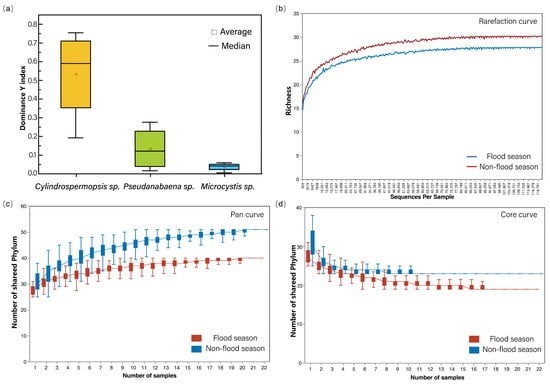
Figure 3.
Dominance Y index of 3 species of Cyanobacteria in the reservoir (a), rarefaction curve (b), pan curve (c), and core curve (d) of OTUs.
3.2. Bacterial Diversity and Composition
A total of 4,688,216 sequences were obtained through high-throughput sequencing, with an average of 106,550 per sample and an average length of 469 bp. High-quality sequences were clustered at 97% similarity, yielding an average of 7384 OTUs per sample. The analysis of OTU diversity revealed that the rarefaction curves, pan curves, and core curves (Figure 3b–d) all approached plateaus. This indicates that the sampling depth was sufficient, and the data were representative.
Bacterial diversity across the 44 samples was compared using Shannon and Chao1 indices. The Shannon index reflects community diversity, while the Chao1 index indicates community richness. As shown in Table 2 (detailed results in Table S3), both the average Chao1 and Shannon indices during the flood season were similar to those in the non-flood season, indicating analogous bacterial diversity and richness between seasons. In addition, ANOSIM similarity analysis revealed significant differences in microbial composition between flood season and non-flood seasons (R = 0.472, p = 0.001).
Table 2.
Average of the alpha-diversity index of Shannon and Chao1.
The relative abundance of bacterial communities at the phylum level during the flood season and the non-flood season is shown in Figure 4a. The bacterial phyla with the highest average relative abundance were Actinobacteriota (41.08%), Proteobacteria (16.92%), Bacteroidota (10.63%), Verrucomicrobiota (9.64%), Cyanobacteria (7.48%), Planctomycetota (3.47%), Chloroflexi (1.45%), and Patescibacteria (1.09%). During the flood season, the dominant phyla were Actinobacteriota and Proteobacteria, accounting for 35.24% and 16.69% of the total sample sequences, respectively. During the non-flood season, the dominant phylum was Actinobacteriota, accounting for 46.92% of the total sample sequences. The proportions of Actinobacteriota and Proteobacteria were higher during the non-flood season than during the flood season, while Bacteroidetes showed higher relative abundance during the flood season.
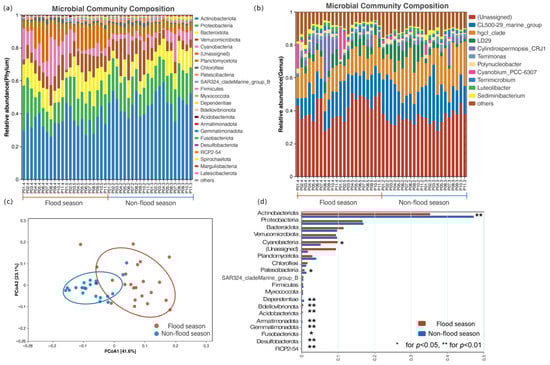
Figure 4.
Relative abundance of bacterial community at the phylum (a) and genus (b) level, principal coordinate analysis (PCoA) (c), and significance test with between-group variation (d) (* for p < 0.05; ** for p < 0.01).
After excluding unclassified genera, 545 genera were annotated (Figure 4b). CL500_ 29_marine_group (17%), hgcI_clade (16.64%), LD29 (5.73%), Cylindrospermopsis_CRJ1 (3.59%), Terrimonas (1.83%), Cyanobium_PCC-6307 (1.63%), and Polynucleatobacter (1.58%) were the dominant bacterial genera. The dominant bacterial genera during the flood season included CL500-29_marine_group (15.26%), hgcI2 clade (14.17%), LD29 (5.41%), and Cylindrospermopsis-CRJ1 (5.26%). The dominant bacterial genera in the non-flood season included hgcI2 clade (19.12%), CL500-29_marine_group (18.74%), and LD29 (6.06%).
From the PCoA (Figure 4c), the explained variance of principal component 1 (PCoA1) and principal component 2 (PCoA2) was 23.1% and 41.6%, respectively. Non-flood season samples were mainly grouped on the negative axis of PCoA1, while flood season samples were grouped on the positive axis side. The microbial community composition during the flood season was distinct from that during the non-flood season. Further intergroup difference significance tests were conducted on the bacterial communities of reservoirs during flood and non-flood seasons (Figure 4d). Actinobacteriota, Patescibacteria, Dependentiae, Armatimonadota, Fusobacteriota, Desulfobacterota, and RCP2-54 showed significantly higher abundances in non-flood seasons than in flood seasons (p < 0.05), while Cyanobacteria, Bdellovibrionota, Acidobacteriota, and Gemmatimonadota showed significantly higher abundances in flood seasons than in non-flood seasons (p < 0.05).
3.3. Microbial–Environmental Correlations
The relationship between bacterial communities and environmental factors was revealed by redundancy analysis (RDA), as shown in Figure 5a. The arrows, dots, and their angles represent environmental factors, samples, and their correlations, respectively. An acute angle indicates a positive correlation between environmental factors and samples, while a blunt angle indicates a negative correlation. Longer arrow lengths denote stronger influences on microbial community composition. The results showed that algal density, permanganate index (CODMn), pH, temperature (T), dissolved oxygen (DO), trophic-level index (TLI), chlorophyll-a (Chla), total phosphorus (TP), and ammonia nitrogen (NH4+-N) were all positively correlated with bacterial communities during flood seasons, while transparency (SD) and total nitrogen (TN) were positively correlated with bacterial communities during non-flood seasons.
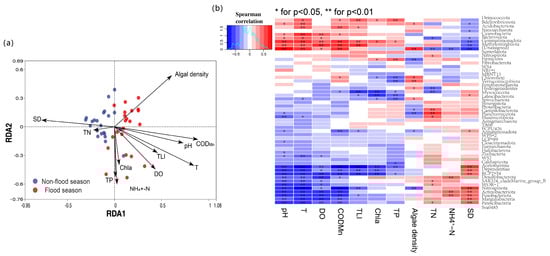
Figure 5.
Redundancy analysis (RDA) (a) and heatmap of the correlation analysis of bacterial community and environmental parameters (b).
The correlation heatmap (Figure 5b) shows the correlation between bacterial and environmental factors. The colors of red and blue represent positive and negative correlations, respectively, and darker colors indicate stronger correlations. Cyanobacteria, Bacteroidota, and Gemmatimonadota show significant positive correlations with dissolved oxygen, while Acidobacteriota, Cyanobacteria, and Gemmatimonadota correlate positively with the permanganate index. Deinococcota, Acidobacteriota, Bdellovibrionota, Cyanobacteria, and Gemmatimonadota exhibit positive correlations with the trophic-level index, while Gemmatimonadota, Deinococcota, and Firmicutes demonstrate positive correlations with the total phosphorus and Chla. Campilobacterota, Planctomycetota, Nitrospirota, and Elusimicrobiota are positively correlated with the total nitrogen, while Desulfobacterota, Fusobacteriota, and Margulisbacteria show positive correlations with ammonia nitrogen.
3.4. Co-Occurrence Network Analysis
Microbial co-occurrence network analyses (Figure 6a,b) serve as a key method for investigating microbial community structure and interactions [35]. By comparing the overall composition, node characteristics, and topological structure of different networks during the non-flood season (node: 369; edge: 2914) and flood season (node: 336; edge: 1824), it was found that the microbial network during the flood season exhibited lower complexity, connectivity, and modularity [36]. In addition, the microbial networks in both seasons were mainly composed of the phyla of Proteobacteria (29.36%), Bacteroidota (20.57%), Actinobacteriota (14.99%), Verrucomicrobiota (6.53%), Cyanobacteria (4.38%), and Planctomycetota (3.83%). Cyanobacteria demonstrated interactions with multiple bacterial groups, including Actinobacteriota, Proteobacteria, Verrucomicrobiota, Bacteroidota, Planctomycetota, Patescibacteria, Firmicutes, Myxococcota, and Chloroflexi. Detailed node and edge information for other bacteria is provided in Tables S4 and S5.
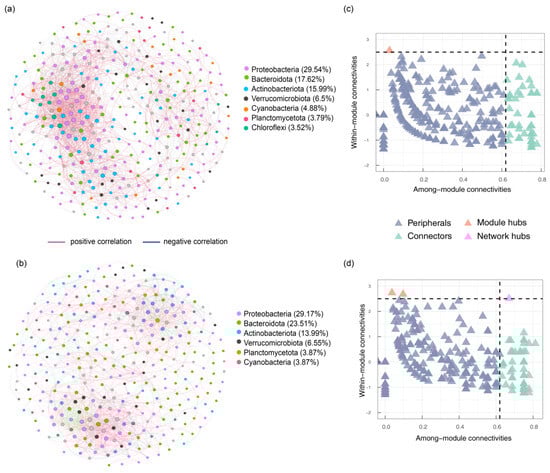
Figure 6.
Co-occurrence network analysis: non-flood season (a), flood season (b), and identification of keystones in the non-flood season (c) and flood season (d).
In co-occurrence networks, those with high node degrees and high betweenness centrality are identified as keystones (Figure 6c,d), and they are categorized as peripheral hubs, connector hubs, module hubs, and network hubs. During the non-flood season, a total of 383 peripheral hubs (Zi < 2.5, Pi < 0.62), 63 connector hubs (Zi < 2.5, Pi > 0.62), and 4 module hubs (Zi > 2.5, Pi < 0.62) were observed in the co-occurrence network. During the flood season, a total of 398 peripherals hubs (Zi < 2.5, Pi < 0.62), 66 connectors hubs (Zi < 2.5, Pi > 0.62), 4 module hubs (Zi > 2.5, Pi < 0.62), and 1 network hub (Zi > 2.5, Pi > 0.62) were identified. The microbial communities’ details of the keystones are presented in Tables S6 and S7.
4. Discussion
4.1. Characteristics of Reservoir Bacterial Communities
The nutritional level of the reservoir gradually increases during flood seasons, coinciding with Cylindrospermopsis blooms (dominance Y = 0.53) and consistent with a previous study [37]. Although nutrient levels increase from non-flood seasons to flood seasons, bacterial community richness and diversity remain similar, which is probably attributed to non-significant differences in trophic indices between periods. Some studies indicated a significant decrease in the richness and diversity of bacterial communities in higher-level eutrophic lakes, where excessive nutrients promote algal proliferation that competitively excludes other bacteria through spatial and resource limitation [38]. In addition, elevated trophic conditions may stimulate toxin production by bloom-forming species, such as Microcystis aeruginosa and Cylindrospermopsis, directly leading to the death of bacteria.
The phyla Actinobacteriota (41.08%), Proteobacteria (16.92%), Bacteroidota (10.63%), Verrucomicrobiota (9.64%), and Cyanobacteria (7.48%) were among the dominant microbial communities in the reservoir, which is consistent with many previous studies, including the study of 21 plateau lakes in China [39], Qionghai Lake in Sichuan [40], and Keruk Lake and Puma Lake in the Qinghai Tibet Plateau [41]. Actinobacteriota and Proteobacteria predominated across tropic states, representing their keystone role in maintaining ecosystem stability [19,42,43,44]. During flood seasons, Cyanobacteria abundance increased significantly (p < 0.05), likely driven by elevated temperature, nutrients, and light availability, intensifying the competition for nutrients and compounds in flood seasons, as reported in [45,46]. The increased abundance of Cyanobacteria exacerbates eutrophication and water quality deterioration [47] while potentially suppressing Actinobacteriota through competitive exclusion under high-nutrient conditions [48,49,50]. This was consistent with the results in this study, where the abundance of Actinobacteriota significantly decreased in the flood season (p < 0.05). Bacteroidota maintained stable abundance throughout sampling. As primary degraders of algal polysaccharides [51], Bacteroidota likely mediate carbohydrate metabolism in this reservoir. Similarly, Verrucomicrobiota also accounted for a stable proportion during periods, and studies indicated that it was a specialist consumer of microalgal sugars during algal bloom [52]. The phylum Verrucomicrobiota possibly helped decompose organic compounds and maintain the ecological balance in the reservoir.
4.2. Investigation of Microbial Interactions and Eutrophic Indicators
By comparing network topology between non-flood (node: 369, edge: 2914) and flood seasons (node: 336; edge: 1824), our results revealed reduced complexity, connectivity, and modularity during the flood season. This suggests that progressive eutrophication may render microbial communities more unstable and susceptible to environmental disturbances [53]. The phyla of Proteobacteria, Bacteroidota, Actinobacteriota, Verrucomicrobiota, and Cyanobacteria were dominant components in the co-occurrence network, indicating their extensive interactions within the microbial community. Notably, Cyanobacteria maintained stable proportions in both seasonal networks, with Cylindrospermopsis identified as a keystone genus. This implies that bloom-forming Cyanobacteria establish complex associations with other bacteria and significantly influence microbial community composition [54,55], consistent with prior studies [49]. Li et al. [56] demonstrated that blue-green algae maintain stable interactions through nutrient exchange, dissolved oxygen regulation, and allelopathic substance secretion, thereby shaping bacterial compositions. Meanwhile, co-occurring bacteria might exert either positive or negative effects on Cylindrospermopsis growth during blooms.
Other keystones in the network also play essential roles in maintaining interspecies interactions. Among the keystone taxa in the network, Bdellovibrionota, Acidobacteriota, Gemmatimonadota, Actinobacteriota, Patescibacteria, Dependentiae, and Armatimonadota were observed with significant abundance changes (p < 0.05) from the non-flood season to the flood season according to the significance test’s between-group variation, consistent with previous studies [57,58]. Notably, Actinobacteriota show direct correlations with Cylindrospermopsis, indicating tight Cyanobacterial associations [59]. These prominent keystone taxa might efficiently respond to nutrient fluctuations by modulating metabolic functions and gene expression preferences [60]. Studies showed that keystone bacteria played important roles in maintaining community stability by driving nutrient cycling through enhanced organic matter decomposition, nutrient conversion, and energy transfer in an eutrophic environment [61]. Zhou et al. [62] demonstrated metabolic shifts during algal blooms: an increase in the gene expression level of carbon fixation, degradation, denitrification, phosphorus acquisition, and sulfur metabolism genes during bloom formation; and transitions to oxidative stress response and protease synthesis during bloom decline. Significantly, these keystone taxa correlated strongly with eutrophic factors (p < 0.05), including the trophic-level index and Chla, indicating high sensitivity to trophic status changes. Considering the high sensitivity to trophic status changes and the pivotal roles of the communities, these bacteria can serve as microbial indicators for monitoring shifts in reservoir nutrient statuses [63]. When the abundance of Actinobacteriota, Dependentiae, Armatimonadota, and Desulfobacterota in the reservoir significantly decreases and the abundance of Acidobacteriota and Gemmatimonadota shows a significant upward trend, there is a risk of eutrophic-level improvement in the reservoir. These bioindicators offer novel insights for monitoring approaches [64,65,66], enabling early warning systems for blue-green algal bloom prevention.
5. Conclusions
This study reveals key dynamics and interactions within the microbial communities of Cylindrospermopsis-bloom reservoirs: Microbial community structures differed significantly between flood and non-flood seasons (ANOSIM: R = 0.472, p = 0.001) alongside shifting trophic conditions. Notably, Cyanobacteria, Bdellovibrionota, Acidobacteriota, and Gemmatimonadota increased significantly during flood seasons (p < 0.05), while Actinobacteriota, Patescibacteria, Patescibacteria, Armatimonadota, and Desulfobacterota decreased (p < 0.05). Despite seasonal variations, Cyanobacteria maintained stable network proportions, with Cylindrospermopsis identified as a keystone genus. This suggests complex associations with other bacteria and a pivotal role in shaping microbial community composition. Other keystone taxa, including Bdellovibrionota, Acidobacteriota, Gemmatimonadota, Actinobacteriota, Patescibacteria, and Armatimonadota, showed significant abundance shifts under eutrophic conditions (p < 0.05) and correlated strongly with eutrophication indicators (p < 0.05), such as the trophic-level index and Chla. These sensitive bacteria serve as effective bioindicators for monitoring eutrophication progression and Cyanobacterial blooms. Their interactions with Cyanobacteria provide a comprehensive framework for identifying indicator species in eutrophic aquatic systems. Future research should elucidate Cylindrospermopsis–bacteria interactions to improve bloom management strategies in global subtropical/tropical reservoirs.
Supplementary Materials
The following supporting information can be downloaded at https://www.mdpi.com/article/10.3390/pr13072129/s1. Table S1: Water parameters of 44 samplings. Table S2. Average of dominance Y index of various blue-green algae in four months. Table S3. Alpha-diversity index of Shannon and Chao1 of each sampling. Table S4. The information of co-occurrence network’ s node and edge in flood season. Table S5. The information of co-occurrence network’ s node and edge in non-flood season. Table S6. The information of co-occurrence network’ s keystones in non-flood season. Table S7. The information of co-occurrence network’ s keystones in flood season.
Author Contributions
Conceptualization, Y.M. and F.Y.; formal analysis, Y.M. and G.X.; funding acquisition, D.L. and C.H.; methodology, Y.M. and S.L.; project administration, Y.M. and C.H.; resources, Y.M. and F.Y.; supervision, D.L. and C.H.; investigation, Y.M., G.X. and F.Y.; writing—original draft, Y.M. and G.X.; visualization, Y.M. and Z.Z.; writing—review and editing, Y.M. and S.L. All authors have read and agreed to the published version of the manuscript.
Funding
This research was funded by the Science and Technology Innovation Program from Water Resources of Guangdong Province, grant numbers 2024-03 and 2025-07, and the Special Fund for Stability Support of Guangdong Provincial Scientific Research Institutions (221016).
Data Availability Statement
The original contributions presented in this study are included in the article/Supplementary Material. Further inquiries can be directed to the corresponding author.
Conflicts of Interest
The authors declare no conflict of interest.
References
- Qin, B.; Gao, G.; Zhu, G.; Zhang, Y.; Song, Y.; Tang, X.; Xu, H.; Deng, J. Lake Eutrophication and Its Ecosystem Response. Chin. Sci. Bull. 2013, 58, 961–970. [Google Scholar] [CrossRef]
- Qin, B.; Yang, L.; Chen, F.; Zhu, G.; Zhang, L.; Chen, Y. Mechanism and Control of Lake Eutrophication. Chin. Chin. Chin. Sci. Bull. 2006, 51, 2401–2412. [Google Scholar] [CrossRef]
- Le, C.; Zha, Y.; Li, Y.; Sun, D.; Lu, H.; Yin, B. Eutrophication of Lake Waters in China: Cost, Causes, and Control. Environ. Manag. 2010, 45, 662–668. [Google Scholar] [CrossRef]
- Jin, X.; Xu, Q.; Huang, C. Current Status and Future Tendency of Lake Eutrophication in China. Sci. China Ser. C Life Sci. 2005, 48, 948–954. [Google Scholar] [CrossRef]
- Wang, J.; Fu, Z.; Qiao, H.; Liu, F. Assessment of Eutrophication and Water Quality in the Estuarine Area of Lake Wuli, Lake Taihu, China. Sci. Total Environ. 2019, 650, 1392–1402. [Google Scholar] [CrossRef]
- Qin, B.; Zhang, Y.; Zhu, G.; Gao, G. Eutrophication Control of Large Shallow Lakes in China. Sci. Total Environ. 2023, 881, 163494. [Google Scholar] [CrossRef]
- Jiang, C.; Zhu, L.; Hu, X.; Cheng, J.; Xie, M. Reasons and Control of Eutrophication in New Reservoirs. In Eutrophication: Causes, Consequences and Control; Ansari, A.A., Singh Gill, S., Lanza, G.R., Rast, W., Eds.; Springer: Dordrecht, The Netherlands, 2011; pp. 325–340. ISBN 978-90-481-9625-8. [Google Scholar]
- da Rocha, C.A.N.; da Costa, M.R.A.; Menezes, R.F.; Attayde, J.L.; Becker, V. Water Volume Reduction Increases Eutrophication Risk in Tropical Semi-Arid Reservoirs. Acta Limnol. Bras. 2018, 30, e106. [Google Scholar]
- Moreira, C.; Azevedo, J.; Antunes, A.; Vasconcelos, V. Cylindrospermopsin: Occurrence, Methods of Detection and Toxicology. J. Appl. Microbiol. 2013, 114, 605–620. [Google Scholar] [CrossRef]
- De Figueiredo, D.R.; Azeiteiro, U.M.; Esteves, S.M.; Gonçalves, F.J.; Pereira, M.J. Microcystin-Producing Blooms—A Serious Global Public Health Issue. Ecotoxicol. Environ. Saf. 2004, 59, 151–163. [Google Scholar] [CrossRef]
- Zhang, Y.; Deng, J.; Zhou, Y.; Zhang, Y.; Qin, B.; Song, C.; Shi, K.; Zhu, G.; Hou, X.; Zhang, Y. Drinking Water Safety Improvement and Future Challenge of Lakes and Reservoirs. Sci. Bull. 2024, 69, 3558–3570. [Google Scholar] [CrossRef]
- Igwaran, A.; Kayode, A.J.; Moloantoa, K.M.; Khetsha, Z.P.; Unuofin, J.O. Cyanobacteria Harmful Algae Blooms: Causes, Impacts, and Risk Management. Water Air Soil Pollut. 2024, 235, 71. [Google Scholar] [CrossRef]
- McGregor, G.B.; Fabbro, L.D. Dominance of Cylindrospermopsis Raciborskii (Nostocales, Cyanoprokaryota) in Queensland Tropical and Subtropical Reservoirs: Implications for Monitoring and Management. Lakes Reserv. Res. Manag. 2000, 5, 195–205. [Google Scholar] [CrossRef]
- Yatigammana, S.; Perera, M. Distribution of Cylindrospermopsis Raciborskii (Cyanobacteria) in Sri Lanka. Ceylon J. Sci. 2017, 46, 65–80. [Google Scholar] [CrossRef]
- Chislock, M.F.; Sharp, K.L.; Wilson, A.E. Cylindrospermopsis Raciborskii Dominates under Very Low and High Nitrogen-to-Phosphorus Ratios. Water Res. 2014, 49, 207–214. [Google Scholar] [CrossRef]
- Bonilla, S.; González-Piana, M.; Soares, M.; Huszar, V.L.; Becker, V.; Somma, A.; Marinho, M.M.; Kokociński, M.; Dokulil, M.; Antoniades, D. The Success of the Cyanobacterium Cylindrospermopsis Raciborskii in Freshwaters Is Enhanced by the Combined Effects of Light Intensity and Temperature. J. Limnol. 2016, 75, 606–617. [Google Scholar] [CrossRef]
- Bhagowati, B.; Ahamad, K.U. A Review on Lake Eutrophication Dynamics and Recent Developments in Lake Modeling. Ecohydrol. Hydrobiol. 2019, 19, 155–166. [Google Scholar] [CrossRef]
- Lan, J.; Liu, P.; Hu, X.; Zhu, S. Harmful Algal Blooms in Eutrophic Marine Environments: Causes, Monitoring, and Treatment. Water 2024, 16, 2525. [Google Scholar] [CrossRef]
- Wang, Y.; Guo, M.; Li, X.; Liu, G.; Hua, Y.; Zhao, J.; Huguet, A.; Li, S. Shifts in Microbial Communities in Shallow Lakes Depending on Trophic States: Feasibility as an Evaluation Index for Eutrophication. Ecol. Indic. 2022, 136, 108691. [Google Scholar] [CrossRef]
- Shao, K.; Yao, X.; Wu, Z.; Jiang, X.; Hu, Y.; Tang, X.; Xu, Q.; Gao, G. The Bacterial Community Composition and Its Environmental Drivers in the Rivers around Eutrophic Chaohu Lake, China. BMC Microbiol. 2021, 21, 179. [Google Scholar] [CrossRef]
- Palacios, O.A.; López, B.R.; de-Bashan, L.E. Microalga Growth-Promoting Bacteria (MGPB): A Formal Term Proposed for Beneficial Bacteria Involved in Microalgal–Bacterial Interactions. Algal Res. 2022, 61, 102585. [Google Scholar] [CrossRef]
- Xiong, X.; Li, Y.; Zhang, C. Cable Bacteria: Living Electrical Conduits for Biogeochemical Cycling and Water Environment Restoration. Water Res. 2024, 253, 121345. [Google Scholar] [CrossRef]
- Jin, Y.; Ren, S.; Wu, Y.; Zhang, X.; Chen, Z.; Xie, B. Microbial Community Structures and Bacteria-Cylindrospermopsis Raciborskii Interactions in Yilong Lake. FEMS Microbiol. Ecol. 2024, 100, fiae048. [Google Scholar] [CrossRef]
- Meyer, N.; Bigalke, A.; Kaulfuß, A.; Pohnert, G. Strategies and Ecological Roles of Algicidal Bacteria. FEMS Microbiol. Rev. 2017, 41, 880–899. [Google Scholar] [CrossRef]
- Coyne, K.J.; Wang, Y.; Johnson, G. Algicidal Bacteria: A Review of Current Knowledge and Applications to Control Harmful Algal Blooms. Front. Microbiol. 2022, 13, 871177. [Google Scholar] [CrossRef]
- Chen, Q.; Liu, Y.; Zhang, M.; Lin, K.; Wang, Z.; Liu, L. Seasonal Responses of Microbial Communities to Water Quality Variations and Interaction of Eutrophication Risk in Gehu Lake. Sci. Total Environ. 2024, 955, 177199. [Google Scholar] [CrossRef]
- Ji, B.; Liang, J.; Ma, Y.; Zhu, L.; Liu, Y. Bacterial Community and Eutrophic Index Analysis of the East Lake. Environ. Pollut. 2019, 252, 682–688. [Google Scholar] [CrossRef]
- Han, B.-P.; Liu, Z.; Dumont, H.J. Water Supply and Eutrophication of Reservoirs in Guangdong Province, South China. In Tropical and Sub-Tropical Reservoir Limnology in China: Theory and Practice; Han, B.-P., Liu, Z., Eds.; Springer: Dordrecht, The Netherlands, 2012; pp. 279–292. ISBN 978-94-007-2007-7. [Google Scholar]
- Lei, L.; Peng, L.; Huang, X.; Han, B.-P. Occurrence and Dominance of Cylindrospermopsis Raciborskii and Dissolved Cylindrospermopsin in Urban Reservoirs Used for Drinking Water Supply, South China. Environ. Monit. Assess. 2014, 186, 3079–3090. [Google Scholar] [CrossRef]
- Lei, M.-T.; Peng, L.; Han, B.-P.; Lei, L.-M. Distribution and Factors Affecting Cylindrospermopsis Raciborskii in Guangdong Reservoirs. Huan Jing Ke Xue 2018, 39, 5523–5531. [Google Scholar]
- Yang, Y.; Zheng, X.; Tang, Q.; Gu, J.; Lei, L.; Han, B.-P. Species Diversity and Seasonal Dynamics of Filamentous Cyanobacteria in Urban Reservoirs for Drinking Water Supply in Tropical China. Ecotoxicology 2020, 29, 780–789. [Google Scholar] [CrossRef]
- Knebelsberger, T.; Stöger, I. DNA Extraction, Preservation, and Amplification. In DNA Barcodes: Methods and Protocols; Humana Press: Totowa, NJ, USA, 2012; pp. 311–338. [Google Scholar]
- Harper, D.A.; Owen, A.W. Quantitative and Morphometric Methods in Taxonomy; Wiley: Hoboken, NJ, USA, 1999. [Google Scholar]
- Csardi, G.; Nepusz, T. The Igraph Software. Complex. Syst. 2006, 1695, 1–9. [Google Scholar]
- Paver, S.F.; Hayek, K.R.; Gano, K.A.; Fagen, J.R.; Brown, C.T.; Davis-Richardson, A.G.; Crabb, D.B.; Rosario-Passapera, R.; Giongo, A.; Triplett, E.W. Interactions between Specific Phytoplankton and Bacteria Affect Lake Bacterial Community Succession. Environ. Microbiol. 2013, 15, 2489–2504. [Google Scholar] [CrossRef]
- Zhang, H.; Yang, L.; Li, Y.; Wang, C.; Zhang, W.; Wang, L.; Niu, L. Pollution Gradients Shape the Co-Occurrence Networks and Interactions of Sedimentary Bacterial Communities in Taihu Lake, a Shallow Eutrophic Lake. J. Environ. Manag. 2022, 305, 114380. [Google Scholar] [CrossRef]
- Hou, P.; Chang, F.; Duan, L.; Zhang, Y.; Zhang, H. Seasonal Variation and Spatial Heterogeneity of Water Quality Parameters in Lake Chenghai in Southwestern China. Water 2022, 14, 1640. [Google Scholar] [CrossRef]
- Feng, C.; Jia, J.; Wang, C.; Han, M.; Dong, C.; Huo, B.; Li, D.; Liu, X. Phytoplankton and Bacterial Community Structure in Two Chinese Lakes of Different Trophic Status. Microorganisms 2019, 7, 621. [Google Scholar] [CrossRef]
- Liao, J.; Cao, X.; Zhao, L.; Wang, J.; Gao, Z.; Wang, M.C.; Huang, Y. The Importance of Neutral and Niche Processes for Bacterial Community Assembly Differs between Habitat Generalists and Specialists. FEMS Microbiol. Ecol. 2016, 92, fiw174. [Google Scholar] [CrossRef]
- Liu, Q.; Zhang, H.; Chang, F.; Xie, P.; Zhang, Y.; Wu, H.; Zhang, X.; Peng, W.; Liu, F. eDNA Revealed in Situ Microbial Community Changes in Response to Trapa Japonica in Lake Qionghai and Lake Erhai, Southwestern China. Chemosphere 2022, 288, 132605. [Google Scholar] [CrossRef]
- Long, Q.; Feng, X.; Liu, J.; Zhang, X.; Shen, G.; Zhu, D. Microbial Diversity of Keluke-Tuosu Lake Wetland Reserve in Qinghai-Tibet Plateau. Earth Environ. 2017, 4, 399–407. [Google Scholar]
- Liu, S.; Yu, H.; Yu, Y.; Huang, J.; Zhou, Z.; Zeng, J.; Chen, P.; Xiao, F.; He, Z.; Yan, Q. Ecological Stability of Microbial Communities in Lake Donghu Regulated by Keystone Taxa. Ecol. Indic. 2022, 136, 108695. [Google Scholar] [CrossRef]
- Dong, X.; Greening, C.; Rattray, J.; Chakraborty, A.; Chuvochina, M.; Mayumi, D.; Dolfing, J.; Li, C.; Brooks, J.; Bernard, B. Metabolic Potential of Uncultured Bacteria and Archaea Associated with Petroleum Seepage in Deep-Sea Sediments. Nat. Commun. 2019, 10, 1816. [Google Scholar] [CrossRef]
- Zhou, Z.; Tran, P.Q.; Kieft, K.; Anantharaman, K. Genome Diversification in Globally Distributed Novel Marine Proteobacteria Is Linked to Environmental Adaptation. ISME J. 2020, 14, 2060–2077. [Google Scholar] [CrossRef]
- McMahon, K.D.; Read, E.K. Microbial Contributions to Phosphorus Cycling in Eutrophic Lakes and Wastewater. Annu. Rev. Microbiol. 2013, 67, 199–219. [Google Scholar] [CrossRef]
- Chen, Z.; Zhang, J.; Li, R.; Tian, F.; Shen, Y.; Xie, X.; Ge, Q.; Lu, Z. Metatranscriptomics Analysis of Cyanobacterial Aggregates during Cyanobacterial Bloom Period in Lake Taihu, China. Environ. Sci. Pollut. Res. 2018, 25, 4811–4825. [Google Scholar] [CrossRef]
- Cao, X.; Wang, J.; Liao, J.; Gao, Z.; Jiang, D.; Sun, J.; Zhao, L.; Huang, Y.; Luan, S. Bacterioplankton Community Responses to Key Environmental Variables in Plateau Freshwater Lake Ecosystems: A Structural Equation Modeling and Change Point Analysis. Sci. Total Environ. 2017, 580, 457–467. [Google Scholar] [CrossRef]
- Haukka, K.; Kolmonen, E.; Hyder, R.; Hietala, J.; Vakkilainen, K.; Kairesalo, T.; Haario, H.; Sivonen, K. Effect of Nutrient Loading on Bacterioplankton Community Composition in Lake Mesocosms. Microb. Ecol. 2006, 51, 137–146. [Google Scholar] [CrossRef]
- Lan, C.; Sun, L.; Hu, Y.; Zhang, Y.; Xu, J.; Ding, H.; Tang, R.; Hou, J.; Li, Y.; Wu, X. Diversity and Their Response to Environmental Factors of Prokaryotic Ultraplankton in Spring and Summer of Cihu Lake and Xiandao Lake in China. Sustainability 2023, 15, 11532. [Google Scholar] [CrossRef]
- Shen, M.; Li, Q.; Ren, M.; Lin, Y.; Wang, J.; Chen, L.; Li, T.; Zhao, J. Trophic Status Is Associated with Community Structure and Metabolic Potential of Planktonic Microbiota in Plateau Lakes. Front. Microbiol. 2019, 10, 2560. [Google Scholar] [CrossRef]
- Chen, J.; Robb, C.S.; Unfried, F.; Kappelmann, L.; Markert, S.; Song, T.; Harder, J.; Avcı, B.; Becher, D.; Xie, P. Alpha-and Beta-mannan Utilization by Marine Bacteroidetes. Environ. Microbiol. 2018, 20, 4127–4140. [Google Scholar] [CrossRef]
- Orellana, L.H.; Francis, T.B.; Ferraro, M.; Hehemann, J.-H.; Fuchs, B.M.; Amann, R.I. Verrucomicrobiota Are Specialist Consumers of Sulfated Methyl Pentoses during Diatom Blooms. ISME J. 2022, 16, 630–641. [Google Scholar] [CrossRef]
- Hu, A.; Ju, F.; Hou, L.; Li, J.; Yang, X.; Wang, H.; Mulla, S.I.; Sun, Q.; Bürgmann, H.; Yu, C. Strong Impact of Anthropogenic Contamination on the Co-occurrence Patterns of a Riverine Microbial Community. Environ. Microbiol. 2017, 19, 4993–5009. [Google Scholar] [CrossRef]
- Faust, K.; Raes, J. Microbial Interactions: From Networks to Models. Nat. Rev. Microbiol. 2012, 10, 538–550. [Google Scholar] [CrossRef]
- Zhao, D.; Shen, F.; Zeng, J.; Huang, R.; Yu, Z.; Wu, Q.L. Network Analysis Reveals Seasonal Variation of Co-Occurrence Correlations between Cyanobacteria and Other Bacterioplankton. Sci. Total Environ. 2016, 573, 817–825. [Google Scholar] [CrossRef]
- Li, S.-N.; Zhang, C.; Li, F.; Ren, N.-Q.; Ho, S.-H. Recent Advances of Algae-Bacteria Consortia in Aquatic Remediation. Crit. Rev. Environ. Sci. Technol. 2023, 53, 315–339. [Google Scholar] [CrossRef]
- Yue, Y.; Yang, Z.; Wang, F.; Chen, X.; Huang, Y.; Ma, J.; Cai, L.; Yang, M. Effects of Cascade Reservoirs on Spatiotemporal Dynamics of the Sedimentary Bacterial Community: Co-Occurrence Patterns, Assembly Mechanisms, and Potential Functions. Microb. Ecol. 2024, 87, 18. [Google Scholar] [CrossRef]
- Wang, H.; Wang, Z.; Yu, J.; Ma, C.; Liu, L.; Xu, D.; Zhang, J. The Function and Keystone Microbiota in Typical Habitats under the Influence of Anthropogenic Activities in Baiyangdian Lake. Environ. Res. 2024, 247, 118196. [Google Scholar] [CrossRef]
- Zhang, Z.; Lu, J.; Zhang, S.; Tian, Z.; Feng, C.; Liu, Y. Analysis of Bacterial Community Structure, Functional Variation, and Assembly Mechanisms in Multi-Media Habitats of Lakes during the Frozen Period. Ecotoxicol. Environ. Saf. 2024, 284, 116903. [Google Scholar] [CrossRef]
- Xie, G.; Zhang, Y.; Gong, Y.; Luo, W.; Tang, X. Extreme Trophic Tales: Deciphering Bacterial Diversity and Potential Functions in Oligotrophic and Hypereutrophic Lakes. BMC Microbiol. 2024, 24, 348. [Google Scholar] [CrossRef]
- Mikhailov, I.S.; Zakharova, Y.R.; Bukin, Y.S.; Galachyants, Y.P.; Petrova, D.P.; Sakirko, M.V.; Likhoshway, Y.V. Co-Occurrence Networks among Bacteria and Microbial Eukaryotes of Lake Baikal during a Spring Phytoplankton Bloom. Microb. Ecol. 2019, 77, 96–109. [Google Scholar] [CrossRef]
- Zhou, J.; Lao, Y.; Song, J.; Jin, H.; Zhu, J.; Cai, Z. Temporal Heterogeneity of Microbial Communities and Metabolic Activities during a Natural Algal Bloom. Water Res. 2020, 183, 116020. [Google Scholar] [CrossRef]
- Ghai, R.; Mizuno, C.M.; Picazo, A.; Camacho, A.; Rodriguez-Valera, F. Key Roles for Freshwater A Ctinobacteria Revealed by Deep Metagenomic Sequencing. Mol. Ecol. 2014, 23, 6073–6090. [Google Scholar] [CrossRef]
- Carlson, R.E. A Trophic State Index for Lakes 1. Limnol. Oceanogr. 1977, 22, 361–369. [Google Scholar] [CrossRef]
- Liang, D.; Wang, Q.; Wei, N.; Tang, C.; Sun, X.; Yang, Y. Biological Indicators of Ecological Quality in Typical Urban River-Lake Ecosystems: The Planktonic Rotifer Community and Its Response to Environmental Factors. Ecol. Indic. 2020, 112, 106127. [Google Scholar] [CrossRef]
- Adamovich, B.; Medvinsky, A.; Nikitina, L.; Radchikova, N.; Mikheyeva, T.; Kovalevskaya, R.; Veres, Y.K.; Chakraborty, A.; Rusakov, A.; Nurieva, N. Relations between Variations in the Lake Bacterioplankton Abundance and the Lake Trophic State: Evidence from the 20-Year Monitoring. Ecol. Indic. 2019, 97, 120–129. [Google Scholar] [CrossRef]
Disclaimer/Publisher’s Note: The statements, opinions and data contained in all publications are solely those of the individual author(s) and contributor(s) and not of MDPI and/or the editor(s). MDPI and/or the editor(s) disclaim responsibility for any injury to people or property resulting from any ideas, methods, instructions or products referred to in the content. |
© 2025 by the authors. Licensee MDPI, Basel, Switzerland. This article is an open access article distributed under the terms and conditions of the Creative Commons Attribution (CC BY) license (https://creativecommons.org/licenses/by/4.0/).