Article

A Fault Recovery Scheme for Active Distribution Networks Based on the Chaotic Binary Sparrow Search Algorithm Considering Operational Risks

1
Jiangmen Power Supply Bureau, Guangdong Power Grid Company Ltd., Jiangmen 529030, China
2
Electrical Engineering, Nanhua University, Hengyang 421001, China
*
Author to whom correspondence should be addressed.
Processes 2025, 13(7), 2128; https://doi.org/10.3390/pr13072128
Submission received: 4 April 2025 / Revised: 20 June 2025 / Accepted: 28 June 2025 / Published: 4 July 2025
(This article belongs to the Special Issue Smart Optimization Techniques for Microgrid Management)

Abstract

In order to improve the reliability of power systems with high penetration of distributed generation (DG), this paper proposes a fault recovery scheme for active distribution networks based on the chaotic binary sparrow search algorithm, taking into account the operational risks. First, the connection line is equivalent to the virtual DG, which simplifies the comprehensive power supply recovery problem to a generalized DG-based islanding problem. Secondly, to adequately quantify the risk of islanding during the fault period, the islanding operation risk index is defined from the perspective of power balance and voltage stability. Next, a generalized dynamic islanding strategy for distribution networks considering operational risks is proposed. This strategy can dynamically adjust the island range according to the risk factors, such as DG output, the change of load, and node voltage levels. Then, the multi-objective function is established by comprehensively considering the factors of restoring important loads, the number of switch actions, and the network loss. The binary sparrow search algorithm is used to solve the problem and outputs the optimal fault recovery strategy for the active distribution network. Finally, the simulation experiments and analysis are carried out based on an IEEE40 node distribution network. The simulation experiments and analysis show that the solution speed of the proposed algorithm reaches the second level, which is 10 s to 70 s faster than that of the heuristic and genetic algorithms, and the load recovery rate of the fault recovery strategy is also higher.

1. Introduction

The distribution network, serving as the bridge connecting the transmission end and the user end, plays a crucial role in the power system, and its safe and stable operation is vital for ensuring reliable power supply to end-users. With the increasing proportion of distributed generation (DG), represented by wind power and photovoltaics, the distribution network is rapidly evolving towards an active distribution network centered around DG [1,2,3]. This significantly alters the power source characteristics and network structure of the distribution network, transforming the traditional radial distribution network into a multi-source, multi-terminal system. Consequently, the operation and protection of the distribution network have become more complex [4]. Furthermore, renewable energy sources inherently possess strong volatility and randomness. Their fluctuating output characteristics introduce greater uncertainty into the system’s operation [5]. The integration of new types of equipment also significantly expands the scale of the distribution network and increases the complexity of its topological structure. Considering that power outages caused by distribution network faults can lead to substantial economic losses and severely disrupt social production and daily life, in-depth research and development of more efficient distribution network fault recovery methods hold significant theoretical importance and practical value.
Distribution network fault restoration refers to the process of reconfiguring the system’s network topology by controlling switches on normal feeders and tie-lines after a distribution line fault occurs and is isolated, thereby restoring power supply to downstream de-energized loads. In their study [6] from 2022, Baviskar et al. focused on active distribution networks (ADNs) capable of effectively integrating dispatchable resources within the network to enhance distribution system flexibility and reliability. However, it neglects network reconfiguration under transmission grid power supply and employs an oversimplified computational model. In their study [7] from 2023, Tong et al. integrated DG generation with network reconfiguration for fault restoration, combining active islanding and network reconfiguration. While the above studies considered both DG support capabilities and network topology modification as restoration methods, they overlook the uncertainty introduced by DG. Given the large number of lines/switches and diverse connected equipment in ADNs, computational models inevitably become highly complex [8,9]. Consequently, when distribution network faults occur, a critical challenge for improving power supply reliability is how to fully utilize diverse in-network devices and resources, leverage the flexibility of the distribution network’s active-response capability, and achieve rapid, large-scale load restoration [10].
To address the aforementioned issues, numerous studies employ soft open points (SOPs) combined with network reconfiguration for load restoration. The primary research approach involves calculating the optimal restoration strategy based on optimization methods. Other common methods include heuristic search algorithms, expert systems, mathematical optimization algorithms, and hybrid algorithms [11,12,13,14]. In their study [15] from 2022, Dai verified that SOPs and network reconfiguration can effectively reduce power losses, balance loads, and increase DG penetration levels by establishing a multi-objective optimization model. In their study [16] from 2020, Ding et al. replaced the upper and lower limits of the microgrid connected by the SOP with the capacity constraints of the SOP. At the same time, the line loss in the trend equation was ignored, and a mixed integer linear model for maintenance personnel, mobile battery vehicles, SOPs, and network reconstruction to recover load was established. In their study [17] from 2023, Zhang et al. proposed a multi-stage load recovery model using SOPs and network reconfiguration, considering switching operations and recovery sequences. Except for reference [16] above, the recovery models established in the above studies are mixed-integer second-order cone programming optimization models. Although the solution is accurate, the calculation fee is longer, and it is difficult to meet the fast needs of recovery when the fault occurs. Reference [16] simplifies the recovery model into a hybrid integer linear model, which simplifies the recovery model to a mixed integer linear model. Although it reduces the model complexity, the model simplification introduces errors, and the calculation results are inaccurate.
With the rapid development of artificial intelligence technology, a large number of intelligent methods are used in the research of fault recovery, mainly ant colony algorithms [18], genetic algorithms [19], particle swarm optimization [20], etc. In their study [19], Molaali et al. used a genetic algorithm to construct a fault recovery model with an objective function of minimizing the lost power load and finally formed a fault recovery strategy. In their study [20], Wang et al. proposed a fault recovery method based on the particle swarm optimization algorithm and completed the output of the optimal solution under the condition of constraints. In their study [21], Zhou et al. proposed a two-step optimization method for fault recovery in distribution networks, and the results show that the constructed model was able to reduce the lost load and improve the power supply reliability of the power system. Although the above research has achieved certain results, there are still some problems in the distribution network accessed by DG: (1) facing the distribution network of large-scale access to distributed power supply, the particle swarm algorithm is slow in computation, and it cannot recover the non-fault areas in time, resulting in a long time of load loss. (2) When dealing with complex distribution networks, the accuracy of the current algorithm cannot meet the requirements, and the network loss in the process of restoring the power supply is large.
The sparrow search algorithm (SSA) has been applied to many research aspects such as system scheduling [22], path planning [23], and deep learning [24], and has shown strong search ability and high search accuracy in solving mathematical models and can search for the optimal solution of complex functions faster. The SSA has the characteristics of strong optimization ability, fast convergence, high stability, and robustness [25]. In this algorithm, the behavior of sparrows searching for food can be regarded as the process of finding the optimal solution in a specific range of space, and the goal of sparrow search is to search for the global optimal value in this process.
Therefore, this paper proposes a fault recovery method based on a chaotic binary sparrow search algorithm for active distribution networks.
The innovative work of this scheme is as follows:
(1) A dynamic model of distributed power generation and load characteristics is established, and an islanded division strategy after a fault is formed, which can initially give priority to the recovery of important loads.
(2) The islanding operation risk in the fault period is fully quantified, and the islanding operation risk index is defined from the perspective of power balance and voltage stability, so as to realize the dynamic adjustment of the islanding range and improve the fault recovery power.
(3) The fault recovery model for the distribution network is built, and the optimal solution of the complex function can be searched faster by using the powerful search ability and high search accuracy of the SSA, which can meet the solution efficiency and effectiveness.

2. Methods & Materials

2.1. DG Equivalent for Contact Line and Comprehensive Power Restoration Model

2.1.1. Secondary System Structure

After the power distribution network fault, the two problems of power supply restoration decision-making and island division are coupled with each other, and it is difficult to separate them into independent calculations; otherwise, the global optimal solution will not be obtained. Therefore, in order to simplify the comprehensive optimization problem, this paper first processes the spare contact line with DG equivalence, as shown in Figure 1.
The equilibrated contact line can be regarded as a virtual DG that can supply the capacity in [ S out , max , S in , max ] , under the control of V/f. This virtual DG can output stable voltage and frequency, but due to the timing of network load requirements in the network and outside of the fault period, the capacity that is available to the outward or inward supply will change in real time during the failure period. The specific relationship between the available capacity of the virtual DG, load demand, and the DG output of the distribution network is expressed as Equations (1) and (2):
S in , t = S in , max t = 1 T C P load , t out
S out , t = S out , max t = 1 T C ( P EF , max + P DG , t in P load , t in )
where TC is the fault duration; S in , t is the available capacity supplied by the virtual DG to the internal distribution network at time t; S in , max is the maximum capacity that can be supplied by the virtual DG to the internal distribution network; P load , t out is the load demand of the external grid at time t; S out , t is the available capacity of the virtual DG to absorb the power of the distribution network at time t; S out , max is the maximum capacity of the virtual DG to absorb the power of the distribution network; P EF , max is the maximum input power of the power feeder in the distribution network; P DG , t in is the sum of the output power of the internal DG of the distribution network at time t; and P load , t in is the total load demand of the internal distribution network at time t. The available reactive power capacity of the virtual DG is the same.

2.1.2. Integrated Power Supply Restoration Model Based on Generalized Islanding

An example of integrated power restoration using contact lines and DG is shown in Figure 2. Suppose a substation fault occurs, and the 10 kV busbar loses power. Feeder 1 can restore power through the independent operation of the internal wind, photovoltaic, and gas turbines, and Feeder 2 can close the contact switch with the external network and restore power through the contact line of Feeder 3. By equating the contact line to the virtual DG shown in Figure 1, the power outage area can be divided into a real island, based on the restoration of the power supply from the DG of the distribution network, and a virtual island, based on the restoration of the power supply from the contact line, which makes the comprehensive optimization problem unified and simplified into a generalized islanding problem, based on the DG.

2.2. Risk Constraint Method Based on Opportunity Constraints

2.2.1. Islanding Operation Risk Characteristics

During the operation of the island, when the volume of the load and the uncontrollable DG power, and the level of the node voltage beyond the regulation range of the main power supply of the island, islanding collapse accidents are prone to occur. The continuous interruption of the load supply due to the frequent start and stop of switches will exacerbate the degree of fault loss.
In addition, the uncertainty of the source–load power prediction error will further limit the adjustment ability of the main power supply. Therefore, the operational risk of islanding is closely related to the real-time changing source–load power and needs to be dynamically constrained. Specifically, in this paper, the islanding risk, such as power balance, number of switching starts and stops, and node voltage level, is limited by opportunity constrained planning. The uncertainty of source–load power can generally be represented by a normal distribution [21,22], whose probability density function can be specifically expressed as Equation (3):
f ( ε t ; μ t , σ t 2 ) = 1 2 π σ t 2 e [ ( ε t μ t ) 2 σ t 2 ]
where ε t is the random variable of the predicted power; μ t is the time-series expectation value of the power prediction; and σ t 2 is the variance, which indicates the degree of deviation in the predicted data.

2.2.2. Dynamic Restraint Method of Operating Risk During Fault Period

(1) Opportunity constraint planning.
The opportunity constrained planning method is based on the uncertainty of the predicted value. Given that the operation decision-making does not need to meet the constraints in real time, but rather to meet the probability value of the opportunity constraint, it cannot be lower than the set confidence level. Therefore, it can dynamically restrict operational risks and ensure the safe operation of islands while maximizing the use of restoration resources. The main influencing factors for the value of the confidence level are the regulation capability of the main power source, the discrete degree of scenery output and load demand, the network structure, and the decision conservatism of the decision maker. The generalized expression is expressed as Equations (4) and (5):
max x X f ( x )
s . t . H i ( x ) = 0 i = 1 , 2 , G j ( x ) 0 j = 1 , 2 , P r g k ( x ) 0 β   k = 1 , 2 ,
where f ( x ) is the objective function; x is the decision variable; X is the set of states of the decision variable x; H i ( x ) and G j ( x ) are the ith deterministic and jth inequality constraints, respectively; g k ( x ) is the opportunity constraint of the first k; β is the confidence level of the opportunity; and P r · is the probability of the event · to meet the constraint conditions.
(2) Islanding power balance risk index.
In order to fully ensure the stability of the island’s power, it is necessary to restrict the dynamic power balance of the island during the whole fault period. Based on the operating risks of the load and the DG power in real time during the fault period, this paper proposes the risk indicator of the island power balance. The definition of the power balance risk indicator of the island at time t is expressed as Equation (6):
R p , t = P r P load total , t P slave total , t + P master , max t P error t
where P load total , t is the total active demand for the load in the island at the time of t; P slave total , t is the active output of the slave power source at time t; P master , max t is the maximum active output of the main power source at time t; P error t is the total power prediction error of the power and load at the time t. The power balance risk indicator Rp,t reflects the probability value that the total output of the DG in the island cannot satisfy the load demand even if the main power source is at its maximum output, and the volatility of the load and the DG is taken into account at the same time, as the higher the indicator is, the lower the safety of the island is.
(3) Island voltage overrun risk indicator.
In order to ensure the safety of the voltage during the operation of the island, the risk of voltage overruns at power distribution grid nodes needs to be fully restrained. The risk indicator for islanding voltage overruns at time t is defined as Equation (7):
R V , t = 1 1 N n = 1 N P r V n min V n , t V n max
where N is the number of loads in the island; Vn,t is the voltage amplitude of the node n in time period t; and V n min and V n max are the upper and lower limits of the voltage amplitude in node N, respectively.

2.3. Model of Generalized Dynamic Island Division Considering Operational Risks

In this paper, the scope of islanding is dynamically adjusted based on the timing demand of the DG output and the load during the fault time period, and the risk of islanding operation is used as an opportunity constraint to guarantee the stable operation of islanding during the whole recovery time period. This dynamic islanding takes the total amount of recovery in the whole recovery time period as the optimization objective, and its objective function is expressed as Equation (8):
max F E = t = 1 T C n = 1 N ( ω n P load , n t C load , n t )
where F E is the total amount of recovery in the whole recovery time period; T C is the power outage time of fault; ω n is the important degree of the n-th load; P is the power demand of the nth load in time period t; and C load , n t represents whether the n-th load has recovered power at moment t, when recovery is 1, but otherwise it is 0. The objective function takes into account the importance of load and load power demand at each moment, and takes the recovery power in the whole recovery time period as the optimization objective. By abandoning the traditional practice of maximizing the recovery power within the faulted section, island dynamic adjustment can be achieved, ensuring the maximum recovery of the power supply volume during the entire recovery period.
The constraints of the dynamic island division model mainly include the following:
(1) The island opportunity constraint for the operational risk is expressed as Equation (9):
R p , t ( 1 β p ) R v , t ( 1 β v )
where βp and βv are the confidence levels to be met for the power balance and voltage overrun risk indicators, respectively.
(2) The constraint on the number of switch actions is expressed as Equation (10):
max s = 1 S t = 2 T C o s t o s t 1 S max
where S is the set of segmented switches in the distribution network; Smax is the upper limit of the number of each segment switch actions; and o s t represents the start–stop state of the sectionalized switch s at time t. When the switch is closed, it is 1; otherwise, it is 0.
(3) The constraint of the switch minimum action time is expressed as Equation (11):
min s S   g G ( T b , g s T a , g s ) T min
where G is the set of switch operations; T sb,g and T sa,g are the g-th closing and opening moments of the s-th switch, respectively; and Tmin is the shortest action time interval of the switch.
(4) The flow constraint and node phase angle constraint are expressed as Equation (12):
I a n n I a n n max δ a n δ a δ a n δ a max
where an is the parent node of node n; I a n n and I a n n max are the actual current amplitude and the upper limit of the allowed current amplitude of the branch a n n , respectively; and δ a n δ a and δ a n δ a max are the actual phase angle difference and the upper limit of the allowed phase angle difference between node a n and n, respectively.
(5) The power balance constraints are expressed as Equation (13):
P grid , t = P load total , t + i = 1 N D G P P D G , i t P loss , t Q grid , t = Q load total , t + i = 1 N D G Q Q D G , i t Q loss , t
where P grid , t and Q grid , t are the active and reactive power inputs to the power feeder of the distribution network at time t, respectively; P D G , i t and Q D G , i t are the active and reactive power outputs of the i-th DG at time t, respectively; N D G P and N D G Q are the number of DGs that can output the active and reactive power t, respectively; and P loss , t and Q loss , t are the total active and reactive power losses of the distribution network at time t, respectively.

2.4. The Model of the Fault Recovery

2.4.1. The Objective Function

The fault recovery of the power distribution takes into account factors that prioritize the recovery of important loads, minimize network damage, and minimize the number of switching actions. The objective function is expressed as Equation (14):
min F = λ 1 i N ω i P i y i + λ 2 d M ( 1 Z d ) + d J Z d + λ 3 i H I l 2 R l
where F is the objective function, where a lower value of F indicates better fault recovery, and λ 1 , λ 2 , and λ 3 are the weights of restoring important loads, the number of switching actions, and the network loss, respectively. In this paper, λ 1 , λ 2 , and λ 3 are taken as 0.6, 0.3, and 0.1. According to the classification of important loads, the load of I, II, and III levels are selected with weights of 0.6, 0.3, and 0.1, respectively. M is the segmented switch set; J is the liaison switch set; Z d is the state of the switch d, where when the value is 1, it means the switch is closed, and the switch is disconnected when the value is 0; H is the set of the branch road circuit; I l is the current of the l-th branch circuit; and R l is the resistance of the l-th branch.

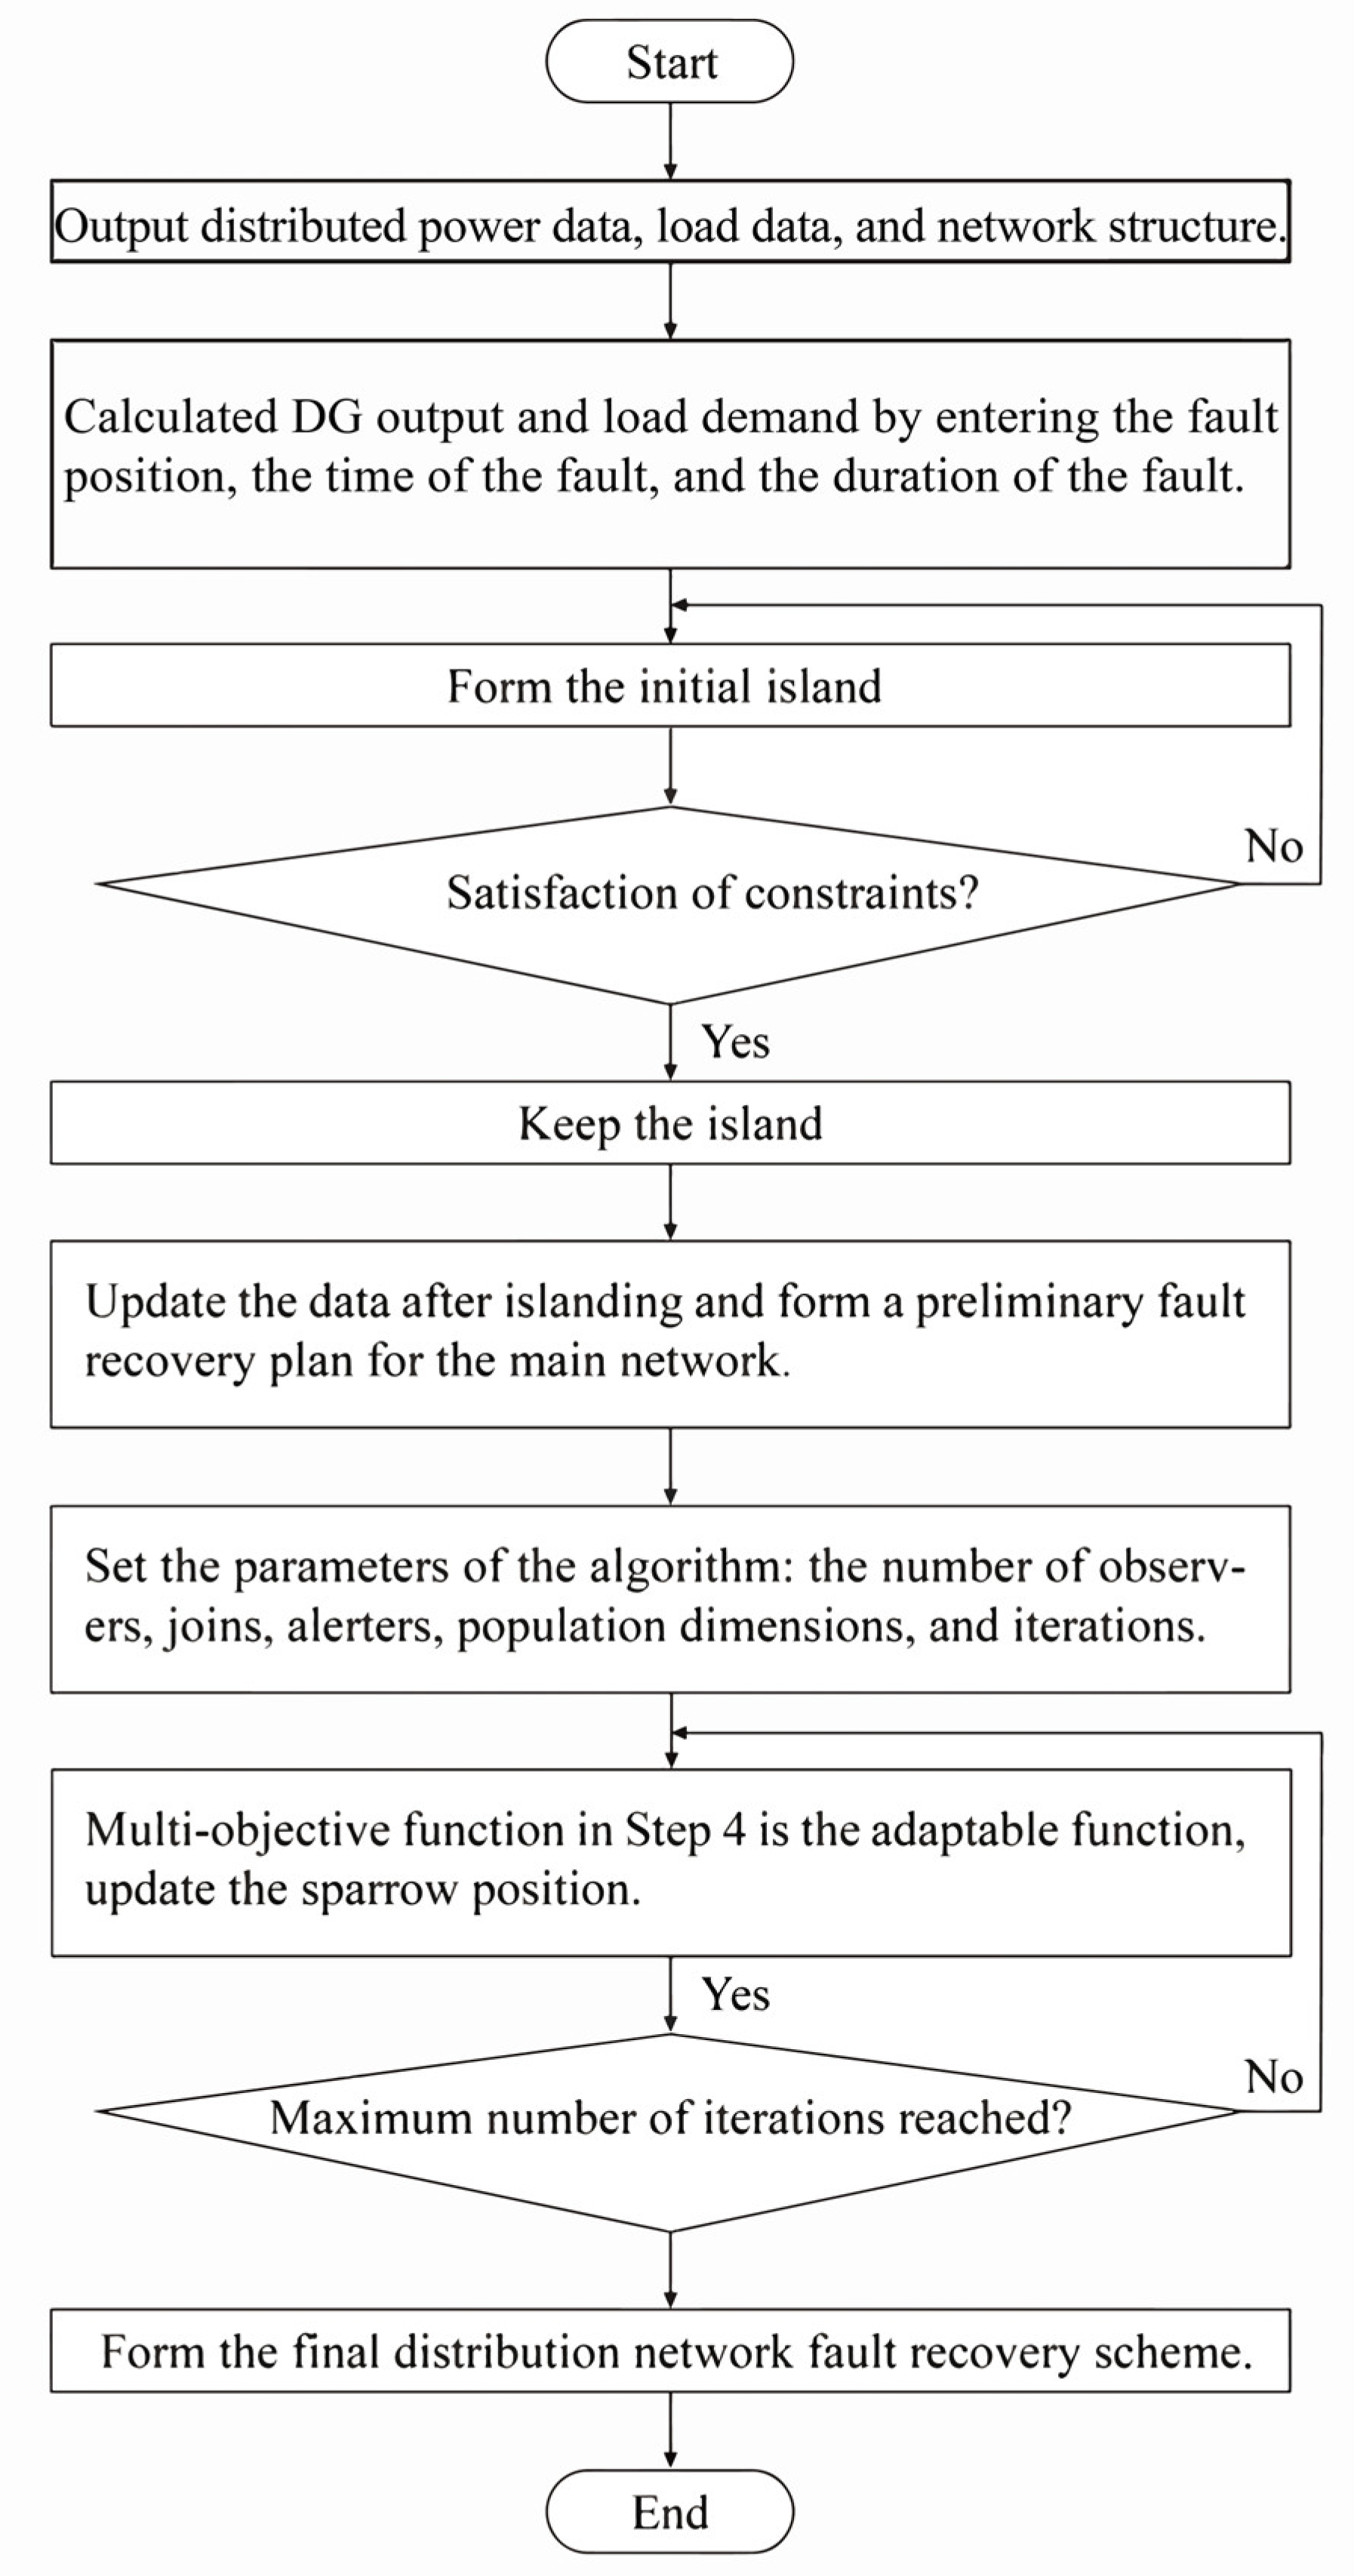
2.4.2. Chaotic Binary Sparrow Search Algorithm

In response to the problem that traditional sparrow search algorithms cannot deal with discrete data, this paper applies the binary sparrow search algorithm to distribution network fault recovery, utilizing its advantages of fast convergence speed, high accuracy, and good stability to convert the fault recovery strategy into a feature selection problem with binary values 0 or 1.
(1) Sparrow search algorithm.
Each sparrow in the sparrow search algorithm represents a solution to the problem.
The population of m sparrows is expressed as Equation (15):
x 11 x 12 x 1 n x 21 x 22 x 2 n x m 1 x m 2 x m n
where m is the number of species and n is the dimension of the variable.
The matrix elements consist mainly of observers, joiners, and alerters. The observer position is updated as in Equation (16):
x i j t + 1 = x i j t exp ( i α T M a x ) ,   R 2 < T S x i j t + Q L , R 2 T S
where x i j is the j-th dimension position value of the i-th sparrow; t is the current iteration number; α is a random number between 0 and 1; R 2 is the warning value, with a range between 0 and 1; T M a x is the maximum number of iterations; T S is the safety value, ranging from 0.5 to 1; Q is a random number, obeying a normal distribution; and L is a matrix with all values of 1, and the dimension of the matrix is 1 × d. If R 2 < T S shows that there are no predators around, the discoverers searched the population in a better adaptation direction. If R 2 T S , it means that the alerters found that the surrounding predators were present, warning the other sparrows to fly towards a safe area. The location update of this joining is expressed in Equation (17):
x i j t + 1 = Q exp ( x w j t x i j t i 2 ) , i > n 2 x b j t + 1 + x i j t x b j t A + L ,   else  
where x b j t is the position of the sparrow with the best adaptation in the t-th iteration; x w j t is the position of the sparrow with the worst adaptation; and A is a matrix of 1 × d, where the value is randomly taken as −1 or 1, and there is A + = A T ( A A T ) 1 . The location update of the alerter position is expressed as Equation (18):
x i j t + 1 = x i j t + β x i j t x b j t , f i > f b x b j t + K x i j t x b j t ( f i f w ) + ε , f i = f b
where β is the step–length parameter, which is a random number obeying the N(0,1) normal distribution; K is the direction of sparrow movement, which is a random number between −1 and 1; ε is a small constant avoiding the denominator at 0; f i is the individual fitness of the sparrows at this time; and f b and f w are the current optimal and worst fitness values, respectively. If f i > f b , it means that the sparrow is located on the edge and is easily threatened by predators. If f i = f b , it means that the middle sparrow feels a threat, and the possibility of being predated by other sparrows recently reduces the possibility of being preferred.
(2) Binary sparrow search algorithm.
The binary sparrow search algorithm uses the sparrow’s predation and anti-predation behavior to update the sparrow position. The transmission function represents the probability of the sparrow value from 0 to 1. The sparrow position transformation is expressed as Equations (19) and (20):
x i j t + 1 = 0 ,     r < S ( x i j t + 1 )   1 ,     r S ( x i j t + 1 )
S ( x i j t + 1 ) = 1 1 + e x i j t + 1
where r is a random number between 0 and 1.
(3) Initialization of chaos.
The good or bad of the initial solution for the population directly determines the speed and cost of the algorithm. The population of the sparrow search algorithm at initialization is randomly generated, which brings a lot of uncertain factors. To this end, the traversal and diversity of the initial group should be added. This paper uses chaotic mapping to initialize the population, instead of the previous random initialization, increasing the richness of the population and making the population search more comprehensive, thereby improving the speed and accuracy of the algorithm. The initialized population is obtained as Equations (21) and (22):
x i d = l i d + G i d ( u i d l i d )
G t + 1 = G t β 1 G t 1 β ,     1 t M
where β is the chaos parameter, which is a random number between 0 and 1, and M is the maximum number of iterations.
(4) Fault recovery scheme for active distribution network, based on chaotic binary sparrow search algorithm.
The flowchart of the active distribution network fault recovery scheme based on the chaotic binary sparrow search algorithm is shown in Figure 3, and the steps are as follows:
(1) Update the distribution network data after islanding, such as the network topology, load, and switching information.
(2) Set the parameters of the algorithm: the number of observers, the number of joins, the number of alerters, the number of population dimensions, and the number of iterations.
(3) Initialize sparrow populations using chaotic mapping.
(4) The multi-objective function that combines the priority recovery of important loads, minimum network loss, and minimum switching actions is used as an adaptation function for the chaotic binary sparrow search algorithm.
(5) Update the sparrow position with (16)–(20), and return to (3) to determine a new adaptation function.
(6) Determine whether the whole algorithm has reached the maximum number of iterations. If it is reached, then the sparrow is considered to have found the optimal position and proceeds to the next step; otherwise, return to Step 4, where the sparrows continue to search for a better position.
(7) Based on the output solution, the final distribution network fault restoration scheme is formed.

3. Results and Discussion

3.1. Simulation Parameters

This paper builds an IEEE40 node distribution system in MATLAB/SIMULINK to simulate and verify the proposed scheme. In terms of hardware, the study is based on Intel(R) i5-13490F CPU AND NVIDIA GeForce RTX 4060 Ti 16G GPU to accelerate the training of neural networks. The simulation environment is based on Python 3.11.7. As shown in Figure 4, all nodes and switches are numbered, including 40 nodes and 5 contact branches. The contact branches are numbered as S33, S34, S35, S36, and S37.
The rated voltage of the system is 10 kV. The photovoltaic energy storage system is connected to nodes 6 and 20, and the wind power storage system is connected to nodes 24 and 30, respectively. Assuming the faults occur at 09:00, and the fault locations are at node 0. Table 1 shows the parameters of the connected PV, wind power (WT), and energy storage devices, and Table 2 shows the load level, load type, and load weight of each node.
Set the population size of the chaotic binary sparrow search algorithm to 60, where the number of joiners is 40, the number of observers is 10, the number of alerters is 10, and the number of iterations is 100.

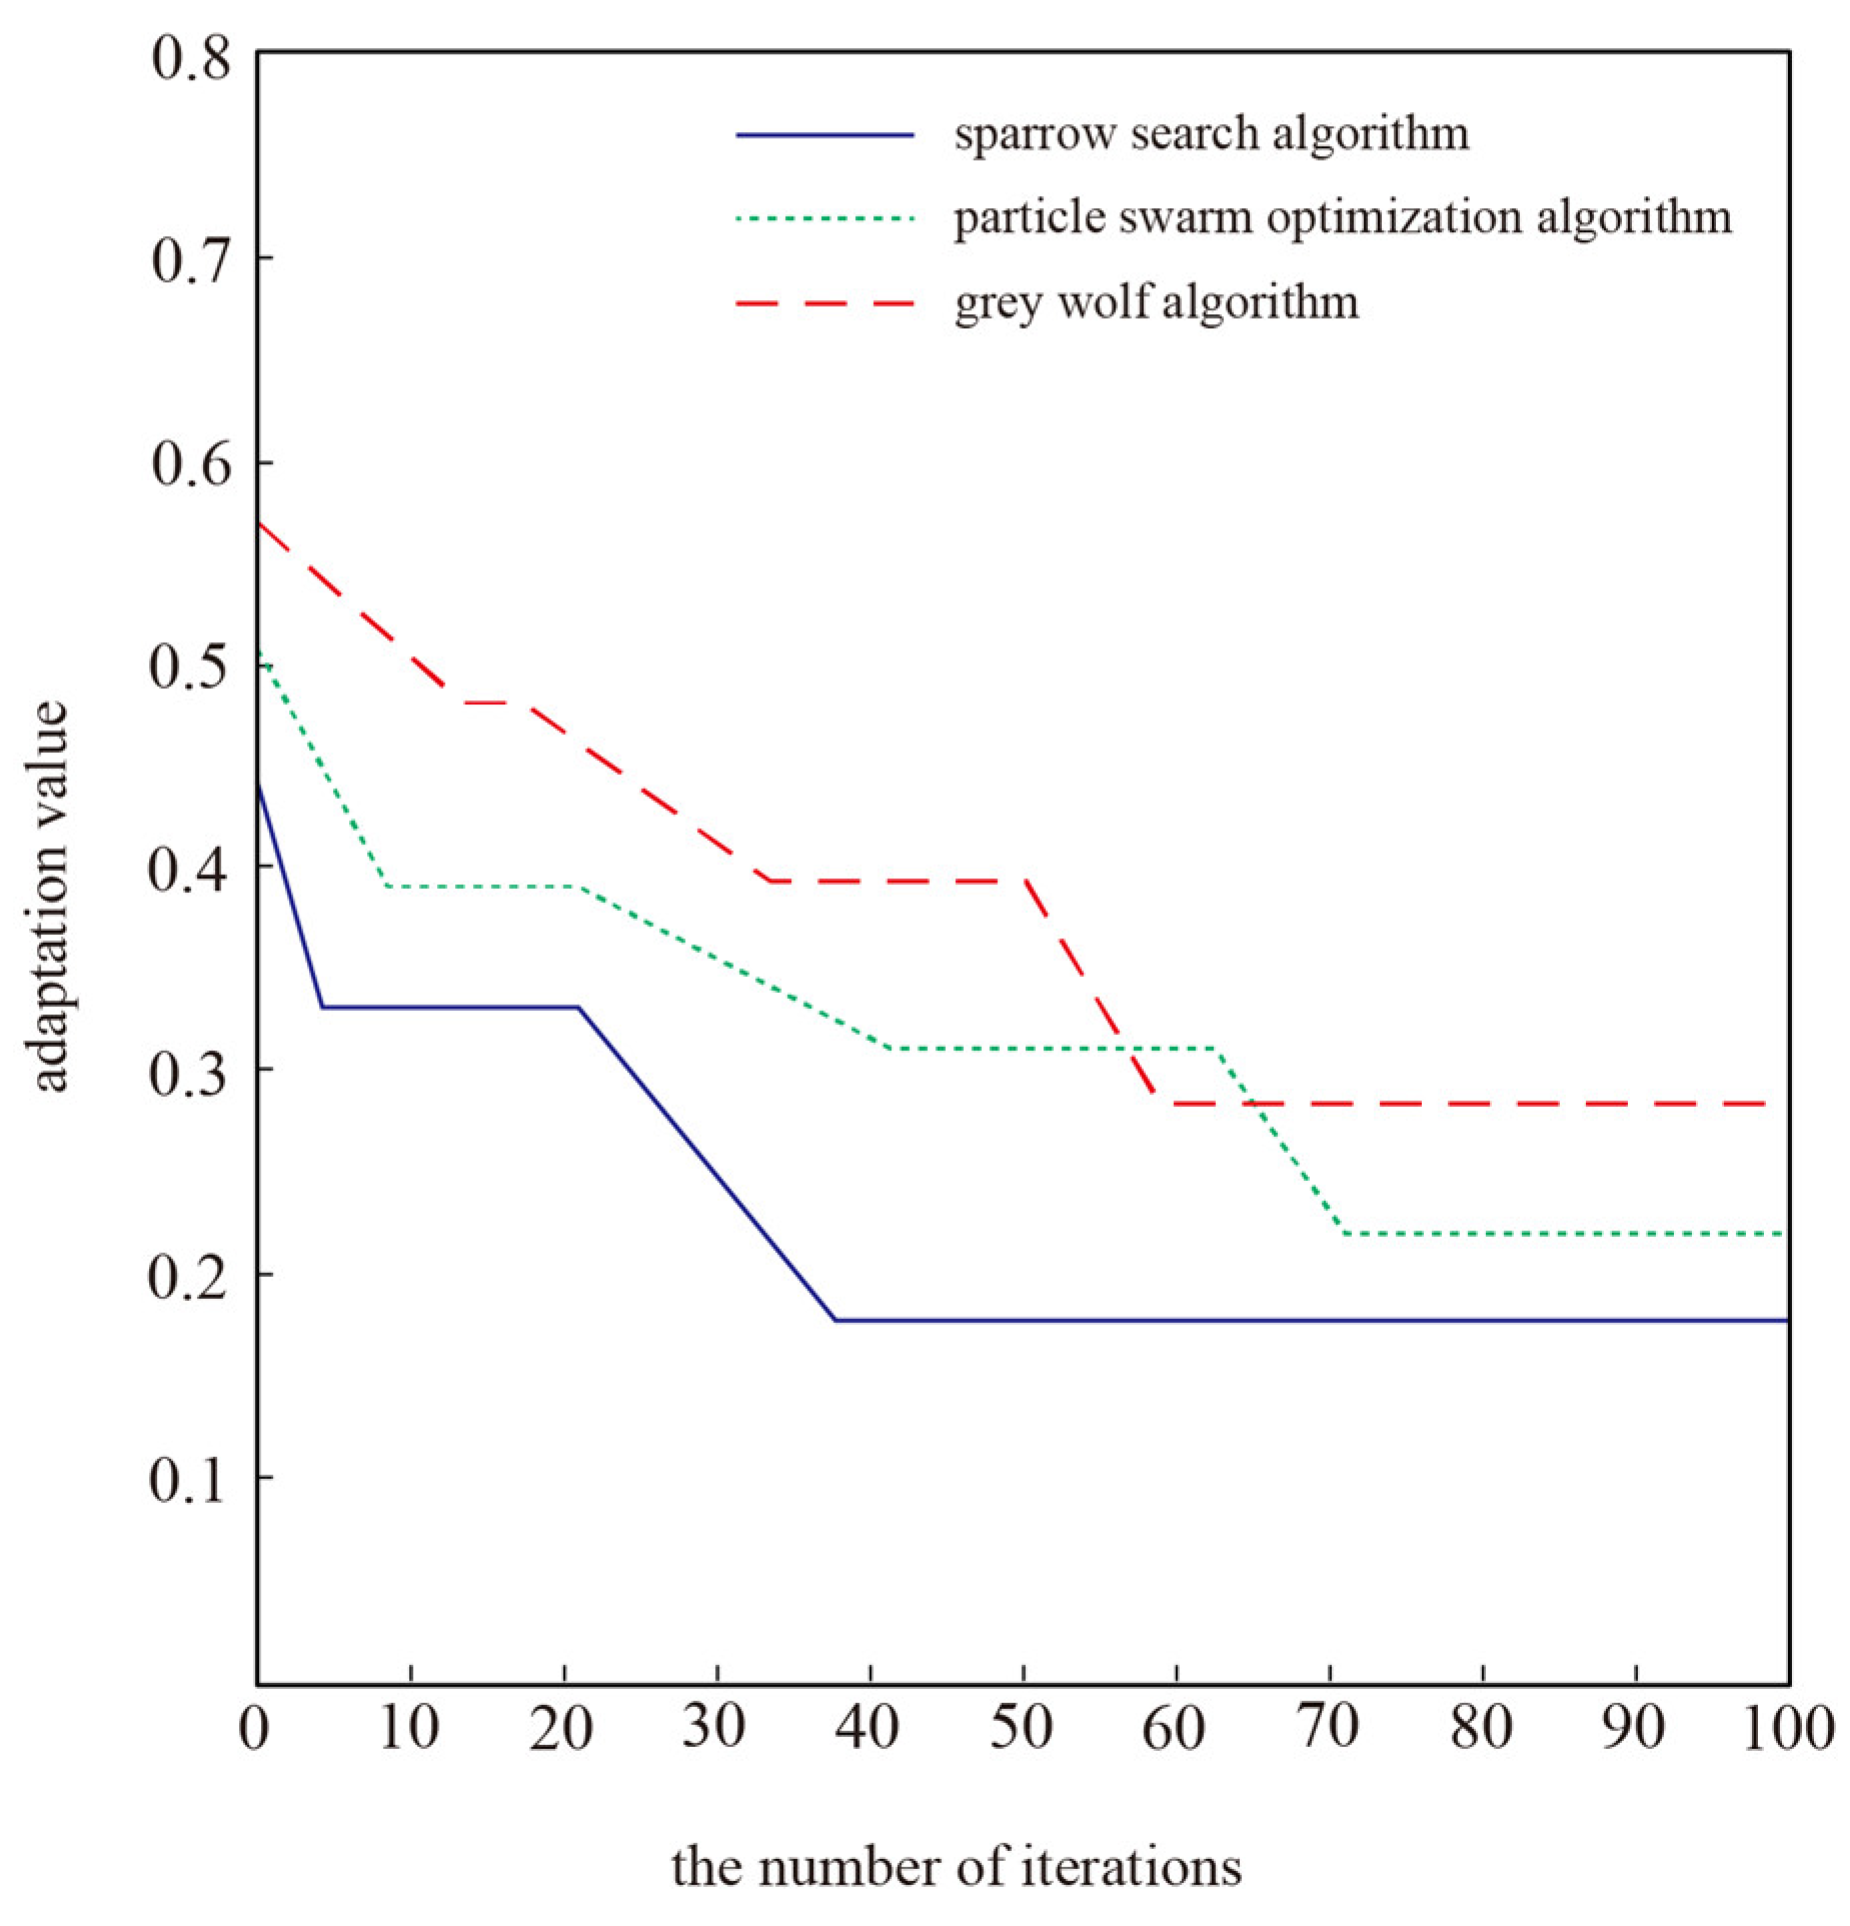
3.2. Results Analysis

Suppose the transformer fault at node 0 starts at 9:00 am on a certain day, and the system’s predicted faulty power outage time is about 1 h. Firstly, the faulty branch is disconnected, and then the island division strategy is used to divide the entire distribution network. The remaining network is recovered.
The total load power recovery curves within the island under the static island division scheme and the scheme in this paper are shown in Figure 5 and Figure 6. The comparison of the division results is shown in Table 3.
Figure 5 shows that the disadvantage of the static island division scheme is that once its range is determined, it must be maintained until the end of the island. If during the period of load recovery, due to changes in environmental factors, the output of unprepared DG is sharply reduced, this may lead to insufficient load supply and even cause the island to collapse.
Under the dynamic island scheme in this paper, the load power recovery curve is shown in Figure 6. This scheme allows for the distribution network to optimize the islanding range when wind and light are in surplus or in short supply, improving the utilization rate of wind and light resources, while guaranteeing the load demand to a large extent, with a higher total load recovery compared with static islanding.
When the risk of islanding operation is limited by the opportunity constraints, the total amount of load recovery is increased, compared to that without consideration of the constraints. In addition, according to Table 3, the maximum values of the islanding power balance risk index Rp and voltage crossing risk index Rv are only 1.6% and 4.3%. Compared with the static islanding scheme based on the “one-time” section data, the generalized dynamic islanding scheme in this paper improves the total power recovery of the whole network by 8.6%, while ensuring the safe operation of the islanding.
In order to further verify the advantages of this scheme, the algorithm in this paper is compared with the common grey wolf algorithm and particle swarm optimization algorithm, and the fault recovery is performed on the same day at 09:00. The results of the adaptation value are shown in Figure 7, and with the increase in the iteration number, the three algorithms tend to stabilize. The adaptation value is the error, which is ranked from smallest to largest. Each iteration is 30 ms. The number of iterations required for the algorithm in this paper is less, and the adaptation value is lower. This shows that the method in this paper is better in terms of search capabilities and convergence.
The number of iterations is set to 100, and the three different algorithms are trained with the objectives of minimizing network loss, minimizing the number of switching actions, and maximizing the amount of restored load power. The fault recovery is still carried out at 09:00, and the results are shown in Table 4. From Table 4, it can be seen that the sparrow search algorithm based on the chaotic binary proposed in this paper has less network loss, fewer switching actions, more restored loads, and a shorter solution time than the ant colony algorithm or grey wolf algorithm, Refs. [18,19,20], which indicates that the proposed scheme not only improves the reliability of the power supply but also improves the speed of restoration, which is of more practical significance. The network loss was reduced by 59.87 kW, 95.93 kW, 148.74 kW, 83.55 kW, and 28.94 kW, the number of switching actions was reduced by 4, 1, 3, 1, and 2, and the solution time was shortened by 10.2 S, 13.4 S, 26.1 S, 33.5 S, and 74.4 S, respectively. The load recovery rate of the fault recovery strategy is also higher.

4. Conclusions

In view of the low efficiency of the traditional active distribution network fault recovery algorithm, the difficulty of traditional reinforcement learning methods in achieving effective exploration, and prior knowledge utilization in complex active distribution networks under the background of increasing proportions of new energy access, this paper designs an active distribution network fault recovery strategy based on the chaotic binary sparrow search algorithm, considering the operation risk through experimental verification in an IEEE40 node distribution network system. The method proposed in this paper aims to solve the fault recovery strategy of a distribution network with online DG, including the specific operation switches and operation sequences. The solution strategy has a high fault recovery rate, a short solution time, and takes into account the quality and speed of the solution. Compared with the traditional reinforcement learning method, this method has a higher fault recovery success rate, and the solution time is much lower than that of the traditional active distribution network fault recovery algorithm, having a better fault recovery effect and topological adaptability in different degrees of active distribution network faults, which effectively realizes the balance between solution quality and computing efficiency.
However, there are still some limitations to this study. In this paper, the complex solution scenario caused by DG and load uncertainty is considered, but the source load output used in the solution is the actual value at the time of failure, not the predicted value, and does not take into account the “time difference” between the solution time and the action execution time caused by the action execution or instruction issuance. In this paper, the optical or wind storage system formed by energy storage and DG has not been considered, so the fault recovery scheme does not involve these forms of islanding power supply. A fault recovery control strategy that supports a form of joint power supply from the main network and the island will be studied in the future. In this paper, the simulation experiments are carried out on an IEEE40 node network, and the experiments are not carried out on other typical node networks. In further studies, the authors will consider validating this. The authors add this as a limitation of the proposed scheme in this conclusion.

Author Contributions

Conceptualization, W.H., G.C., X.J., X.X., Y.C. and C.L.; Methodology, W.H., G.C., X.J., X.X., Y.C. and C.L.; Software, W.H., G.C., X.J., X.X., Y.C. and C.L.; Writing—original draft, W.H., G.C., X.J., X.X., Y.C. and C.L. All authors have read and agreed to the published version of the manuscript.

Funding

This work was supported by Jiangmen Power Supply Bureau, Guangdong Power Grid Company Ltd., under Grant 030700KC23040010.

Data Availability Statement

The original contributions presented in this study are included in the article. Further inquiries can be directed to the corresponding author.

Conflicts of Interest

Authors Weijie Huang, Gang Chen, Xiaoming Jiang, Xiong Xiao, and Yiyi Chen are employed by the Jiangmen Power Supply Bureau, Guangdong Power Grid Company Ltd. The authors declare that the research was conducted in the absence of any commercial or financial relationships that could be construed as potential conflicts of interest.

References

  1. Jiang, S.; Cheng, J.; Pan, K.; Qiu, F.; Yang, B. Data-Driven Chance-Constrained Planning for Distributed Generation: A Partial Sampling Approach. IEEE Trans. Power Syst. 2023, 38, 5228–5244. [Google Scholar] [CrossRef]
  2. Zhou, K.; Fei, Z.; Lu, X. Optimal Energy Management of Internet Data Center with Distributed Energy Resources. IEEE Trans. Cloud Comput. 2023, 11, 2285–2295. [Google Scholar] [CrossRef]
  3. Li, J.; Zhou, X.; Zhou, Y.; Han, A. Optimal Configuration of Distributed Generation Based on an Improved Beluga Whale Optimization. IEEE Access 2024, 12, 31000–31013. [Google Scholar] [CrossRef]
  4. Igder, M.A.; Liang, X.; Mitolo, M. Service restoration through microgrid formation in distribution networks: A review. IEEE Access 2022, 10, 46618–46632. [Google Scholar] [CrossRef]
  5. Song, Z.; Lv, Z.; Yan, H.; Bai, J.; Zhou, S. Coordinated Control Method for Low Voltage Ride through and Anti-islanding Protection of Distributed PV Generation Based on Interharmonic Impedance. In Proceedings of the IEEE 14th International Symposium on Power Electronics for Distributed Generation Systems (PEDG), Shanghai, China, 9–12 June 2023; pp. 1132–1136. [Google Scholar]
  6. Baviskar, A.; Das, K.; Koivisto, M.; Hansen, A.D. Multi-Voltage Level Active Distribution Network with Large Share of Weather-Dependent Generation. IEEE Trans. Power Syst. 2022, 37, 4874–4884. [Google Scholar] [CrossRef]
  7. Tong, X.; Wang, Y.; Qiu, Z.; Huang, Y. Data-driven multi period operation optimization of active distribution networks. In Proceedings of the IEEE 3rd International Conference on Data Science and Computer Application (ICDSCA), Dalian, China, 27–29 October 2023; pp. 1295–1300. [Google Scholar]
  8. Hu, S.; Xiang, Y.; Liu, J.; Gu, C.; Zhang, X.; Tian, Y.; Liu, Z.; Xiong, J. Agent-Based Coordinated Operation Strategy for Active Distribution Network with Distributed Energy Resources. IEEE Trans. Ind. Appl. 2019, 55, 3310–3320. [Google Scholar] [CrossRef]
  9. Fathabad, A.M.; Cheng, J.; Pan, K.; Qiu, F. Data-driven planning for renewable distributed generation integration. IEEE Trans. Power Syst. 2020, 35, 4357–4368. [Google Scholar] [CrossRef]
  10. Ehsan, A.; Yang, Q. Optimal integration and planning of renewable distributed generation in the power distribution networks: A review of analytical techniques. Appl. Energy 2018, 210, 44–59. [Google Scholar] [CrossRef]
  11. Liang, X.; Saaklayen, M.A.; Igder, M.A.; Shawon, S.M.R.H.; Faried, S.O.; Janbakhsh, M. Planning and service restoration through microgrid formation and soft open points for distribution network modernization: A review. IEEE Trans. Ind. Appl. 2022, 58, 1843–1857. [Google Scholar] [CrossRef]
  12. Saaklayen, M.A.; Liang, X.; Faried, S.O.; Martirano, L.; Sutherland, P.E. Soft Open Point-Based Service Restoration Coordinated with Distributed Generation in Distribution Networks. IEEE Trans. Ind. Appl. 2024, 60, 2554–2566. [Google Scholar] [CrossRef]
  13. Ke, Y.L. Distribution feeder reconfiguration for load balancing and service restoration by using G-nets inference mechanism. IEEE Trans. Power Deliv. 2004, 19, 1426–1433. [Google Scholar] [CrossRef]
  14. Ji, H.; Wang, C.; Li, P.; Song, G.; Wu, J. SOP-based islanding partition method of active distribution networks considering the characteristics of DG, energy storage system and load. Energy 2018, 155, 312–325. [Google Scholar] [CrossRef]
  15. Dai, B. Multi-objective Optimization Model of Distribution Network Reconfiguration Considering Soft Open Point. In Proceedings of the China International Conference on Electricity Distribution (CICED), Changsha, China, 7–8 September 2022; pp. 468–472. [Google Scholar]
  16. Ding, T.; Wang, Z.; Jia, W.; Chen, B.; Chen, C.; Shahidehpour, M. Multiperiod Distribution System Restoration with Routing Repair Crews, Mobile Electric Vehicles, and Soft-Open-Point Networked Microgrids. IEEE Trans. Smart Grid 2020, 11, 4795–4808. [Google Scholar] [CrossRef]
  17. Zhang, T.; Yu, X.; Mu, Y.; Jia, H.; Hou, K.; Jin, X. Multiple sources restoration for soft open points in distribution networks with a two-stage accelerated algorithm. IEEE Trans. Sustain. Energy 2023, 14, 892–905. [Google Scholar] [CrossRef]
  18. Qiang, X.; Haibin, G.; Xugang, F.; Zhenzhi, C. Research on self-healing strategy of smart distribution grid based on improved ant colony algorithm. In Proceedings of the Chinese Control and Decision Conference (CCDC), Yinchuan, China, 28–30 May 2016; pp. 390–395. [Google Scholar]
  19. Molaali, M.; Abedi, M. A New Heuristic Method for Distribution Network Restoration and Load Elimination Using Genetic Algorithm. In Proceedings of the Electrical Power Distribution Conference (EPDC), Tehran, Iran, 9–10 May 2018; pp. 46–51. [Google Scholar]
  20. Yu, X.; Wang, B.; Fu, J.; Liu, Y.; Yi, J. Research on Distribution Network Fault Recovery Algorithms with Distributed Generation. In Proceedings of the IEEE 3rd Advanced Information Management, Communicates, Electronic and Automation Control Conference (IMCEC), Chongqing, China, 11–13 October 2019; pp. 1425–1429. [Google Scholar]
  21. Zhou, Z.; Zhang, J.; Liu, P.; Li, Z.; Georgiadis, M.; Pistikopoulos, E. A two-stage stochastic programming model for the optimal design of distributed energy systems. Appl. Energy 2013, 103, 135–144. [Google Scholar]
  22. Cheng, Y.; Jiang, W. AUV 3D Path Planning Based on Improved Sparrow Search Algorithm. In Proceedings of the 2024 7th International Conference on Advanced Algorithms and Control Engineering (ICAACE), Shanghai, China, 1–3 March 2024; pp. 1592–1595. [Google Scholar]
  23. Liu, Q.; Zhang, Y.; Li, M.; Cao, Z.Z.N.; Shang, J. Multi-UAV path planning based on fusion of sparrow search algorithm and improved bioinspired neural network. IEEE Access 2021, 9, 124670–124681. [Google Scholar] [CrossRef]
  24. Yin, S.; Li, H.; Laghari, A.A.; Gadekallu, T.R.; Sampedro, G.A.; Almadhor, A. An anomaly detection model based on deep auto-encoder and capsule graph convolution via sparrow search algorithm in 6G Internet of Everything. IEEE Internet Things J. 2024, 11, 29402–29411. [Google Scholar] [CrossRef]
  25. Yin, H.; Lyu, Y.; Xu, L.; Gulliver, T.A. Intelligent optimization algorithm for green IoV networks based on SSA. IEEE Trans. Veh. Technol. 2025, 74, 2251–2260. [Google Scholar] [CrossRef]
Figure 1. DG equivalent schematic diagram of backup contact lines.
Processes 13 02128 g001
Figure 2. Example of power supply restoration based on generalized islanding.
Processes 13 02128 g002
Figure 3. Flowchart of fault recovery scheme process.
Processes 13 02128 g003
Figure 4. IEEE40 node simulation system.
Processes 13 02128 g004
Figure 5. The static load power recovery curve.
Processes 13 02128 g005
Figure 6. The dynamic load power recovery curve.
Processes 13 02128 g006
Figure 7. The results of the adaptation value.
Processes 13 02128 g007
Table 1. Parameters of distributed generation.
DGNode NumberDG Rated Power/kWEnergy Storage Rated Capacity
PV6600100
PV20600100
WT24800100
WT31800100
Table 2. Division of the load of each node.
Load LevelNode NumberLoad Weight of Each Node
17, 9, 10, 11, 20, 26, 33, 37, 39100
28, 17, 27, 34, 35, 4010
3other1
Table 3. Comparison of results under different islanding operation strategies.
Island Division SchemeTotal Load Power Recovery/kW·hLoad Recovery Rate/%Rp/%Rv/%
static7622.578.63.15.8
dynamic8456.587.21.64.3
Table 4. The results of the different algorithms.
ParametersAnt Colony AlgorithmGrey Wolf AlgorithmRef. [18]Ref. [19]Ref. [20]This Paper
network loss/kW143.56179.62232.43167.24112.6383.69
switch actions635342
solution time/S19.322.535.242.683.59.1
Disclaimer/Publisher’s Note: The statements, opinions and data contained in all publications are solely those of the individual author(s) and contributor(s) and not of MDPI and/or the editor(s). MDPI and/or the editor(s) disclaim responsibility for any injury to people or property resulting from any ideas, methods, instructions or products referred to in the content.

