Article

Experimental Adsorption Study of Pure CH4 and CO2 on Organic-Rich Shales from the Cesar-Ranchería Basin, Colombia

by
Olga Patricia Ortiz Cancino
* and
Nicolas Santos Santos
Petroleum Engineering School, Universidad Industrial de Santander, Bucaramanga 680002, Santander, Colombia
*
Author to whom correspondence should be addressed.
Processes 2025, 13(7), 2108; https://doi.org/10.3390/pr13072108
Submission received: 8 May 2025 / Revised: 23 June 2025 / Accepted: 24 June 2025 / Published: 3 July 2025

Abstract

This study presents a comprehensive experimental evaluation of pure methane (CH4) and carbon dioxide (CO2) adsorption on organic-rich shale samples from the Cesar-Ranchería Basin, Colombia. Adsorption isotherms were measured at two temperatures (50 °C and 80 °C) and up to 3 MPa using a manometric method. The data were fitted using the Langmuir model. The samples exhibit high total organic carbon (TOC) contents, ranging from 33.44% to 69.63%, but surprisingly low BET surface areas (1–7 m2/g), an uncommon combination in shale systems. Despite these low surface areas, the samples showed notable adsorption capacities, particularly for CO2, which consistently outperformed CH4 across all conditions. Maximum CO2 adsorption capacities reached up to 1.6 mol/kg, while CH4 values peaked at 0.49 mol/kg. The Langmuir parameters reflect a stronger affinity and greater capacity for CO2, supporting its potential role in enhanced gas recovery and CO2 sequestration. These findings contribute to understanding gas–shale interactions in thermally immature and highly organic-rich formations and highlight the importance of mineralogy and organic matter characteristics beyond surface area alone. This work provides novel insights into the adsorption behavior of Colombian shales and serves as a valuable reference for future gas in-place estimations and shale reservoir evaluations in similar geological contexts.

1. Introduction

The increasing global energy demand, paired with the urgent need to reduce greenhouse gas emissions, has driven a significant shift toward cleaner and more sustainable energy sources. In this context, natural gas—mainly composed of methane (CH4)—has gained prominence as a transitional fuel due to its lower carbon intensity compared to coal and oil [1]. Unconventional gas reservoirs, particularly organic-rich shales, have become a strategic target for energy development in numerous countries, including Colombia, where sedimentary basins such as Cesar-Ranchería offer promising exploration opportunities [2,3].
Shale gas is predominantly stored through adsorption mechanisms on organic matter (kerogen) and fine-grained mineral surfaces [4]. This mode of storage becomes increasingly relevant in formations characterized by high total organic carbon (TOC) content, nanoporous structures, and low permeability [5,6]. A critical aspect in evaluating these systems is understanding how various geochemical and mineralogical features—such as specific surface area, maturity, and mineral composition—influence gas adsorption behavior under reservoir-like conditions [7].
Experimental studies have shown that both methane and carbon dioxide exhibit strong affinities for organic-rich matrices, with CO2 typically displaying higher adsorption capacities than CH4 due to its quadrupolar nature and greater polarizability [8,9]. This makes shale formations relevant not only for gas production but also as potential candidates for CO2 geological storage [10,11]. However, adsorption performance can vary significantly depending on the textural and compositional heterogeneity of the shale, as well as the prevailing pressure and temperature conditions [12].
A growing body of research has addressed adsorption behavior in shales from North America and parts of Europe and Asia [13,14,15]. Nonetheless, detailed experimental data for South American shales—particularly those from Colombia—remain scarce. Previous investigations in the Cesar-Ranchería Basin have primarily focused on hydrocarbon potential, thermal maturity, and TOC distributions [16,17,18], with limited attention given to the adsorption behavior of greenhouse gases or the implications for both energy and climate strategies.
There are ongoing debates regarding the dominant adsorption sites in shales. While some authors argue that organic matter is the primary adsorption phase [19], others highlight the significant role of clay minerals, particularly illite and kaolinite, to gas uptake [20]. Additionally, the influence of thermal maturity on adsorption remains debated; higher maturity often correlates with increased microporosity but may also reduce adsorption due to changes in kerogen structure [21,22].
This study addresses these gaps by presenting an experimental investigation of pure CH4 and CO2 adsorption on shallow shale samples from the Cesar-Ranchería Basin. These samples are characterized by unusually high TOC values (33.44–69.63 wt%) combined with low specific surface areas (1–7 m2/g), a combination rarely reported in the literature. By integrating adsorption isotherms with geochemical and mineralogical analyses, this work aims to clarify how these contrasting properties affect gas storage. The findings contribute to a deeper understanding of gas–shale interactions in tropical basins and provide valuable data for future gas in-place estimations, energy exploitation, and carbon management initiatives in the region.

2. Materials and Methods

2.1. Sample Characterization

In this study, four core samples were used for obtain original experimental data for CH4 and CO2 adsorption, from ANH-La Loma-1 and ANH-Carretalito-1 wells in the Cesar-Ranchería Basin (CRB). The samples analyzed in this study were obtained from shallow depths ranging between 45 and 150 m.
The CRB is a foreland sedimentary basin located in northeastern Colombia, extending across the southern part of the La Guajira department and the northeastern sector of the Cesar department. It is geographically bounded to the northwest by the pre-Cretaceous rocks of the Sierra Nevada de Santa Marta, to the north by the Oca Fault, to the southeast by the pre-Cretaceous outcrops of the Serranía de Perijá, and to the southwest by the Bucaramanga-Santa Marta Fault system. The basin covers an approximate area of 11,668 km2 and is characterized by a complex tectonic history resulting from the interaction between the South American Plate and the Caribbean Plate [23,24]. The basin’s structural configuration and stratigraphic succession make it a geologically attractive region for the exploration of both conventional and unconventional hydrocarbons [17,24].
In the laboratory, samples were crushed using a mechanical grinder to obtain a fine and homogeneous powder with an estimated particle size below 250 µm. All analyses were conducted on dried samples, prepared under controlled conditions to preserve their physicochemical properties. The samples are named S1 and S2 (ANH-La Loma-1) and S3 and S4 (ANH-Carretalito-1).

2.2. Mineralogical and Geochemical Characterization

The mineralogical composition of the samples was determined by X-ray diffraction (XRD) using a Bruker D8 Advance diffractometer with Cu-Kα radiation in the DRX Laboratory of Universidad Industrial de Santander.
The dominant mineral phases are summarized in Table 1. Quartz and kaolinite were the most abundant constituents in samples S1 and S2, while sample S3 exhibited high contents of whewellite and dickite. Several secondary minerals, including pyrite, natrojarosite, and lizardite, were also detected. No XRD results were available for sample S4.
Geochemical properties of the shale samples were evaluated to determine their hydrocarbon generation potential, thermal maturity, and organic richness. Total organic carbon (TOC) content was measured to assess the quantity of organic matter present in the rock matrix, with values ranging from 33.44 wt% to 69.63 wt%, indicating exceptionally high organic richness. Pyrolysis parameters, including S1 (free hydrocarbons), S2 (hydrocarbons generated through pyrolysis), and S3 (CO2 from kerogen oxidation), were obtained using standard Rock-Eval techniques. Derived indices such as the hydrogen index (HI), oxygen index (OI), and production index (PI) were used to characterize the type and maturity of organic matter. The samples exhibit low Tmax values (420–425 °C), suggesting immature to early mature stages of thermal evolution. The low PI values are consistent with a limited level of hydrocarbon generation, while the HI and OI values indicate a predominance of Type II and mixed Type II/III kerogen. Vitrinite reflectance (Ro%) was also measured and corroborates the Rock-Eval Tmax data, supporting the interpretation of early maturity. These geochemical characteristics confirm that the analyzed shales possess a high organic content but have undergone limited thermal alteration, which may influence their adsorption behavior and gas storage potential. The most important measurements are summarized in Table 2.

2.3. Gas Adsorption Experiments

Adsorption experiments were performed using a home-made high-pressure (HP) manometric device. Before each measurement, samples were degassed at 110 °C under vacuum for at least 12 h to ensure the complete removal of pre-adsorbed gases and moisture. The adsorption isotherms were measured at two temperatures (50 °C and 80 °C) and up to 3 MPa to simulate typical subsurface reservoir conditions in shallow to intermediate-depth formations and to explore the temperature-dependent behavior of gas uptake. These temperature values have also been widely used in similar experimental studies for evaluating physisorption in shale systems [10,13,25]. All experiments were performed in duplicate to ensure reproducibility, and the results were corrected for system void volume. Equilibrium was assumed once pressure fluctuations were less than 0.001 over 45 min, for S2 it took about 90 min. The claimed uncertainty is better than 3% [26].
The amount of gas is measured by monitoring the pressure drop of a fixed, known volume containing the adsorbent sample. For the manometric method, the measuring device consists of a dosing cell (31.5 cm3), and an adsorption cell (16.78 cm3) with calibrated volumes, equipped with a high-precision pressure transducer. The entire system must be maintained under constant temperature conditions. Three two-way valves allow the separation of the dosing cell from the adsorption cell. Isothermal conditions are ensured by a PID regulator (Eurotherm 3208, Eurotherm Automation, Dardilly, France), monitored through the use of two thermocouples placed on each of the cells. This equipment can operate over broad ranges of pressure (0–3.0 MPa) and temperature (303.15 K–423.15 K).
The adsorption isotherms were fitted using the Langmuir adsorption model, widely applied to describe CH4 and CO2 adsorption on organic-rich shales due to its simplicity and ability to provide reliable estimates of monolayer adsorption capacity under subsurface conditions. The mathematical formulation followed the three-parameter Langmuir model as described by Gensterblum et al. [27].
Parameter estimation was carried out using the Solver add-in in Microsoft Excel, applying the generalized reduced gradient (GRG) nonlinear algorithm to minimize the sum of squared residuals (SSE) between experimental and modeled adsorption values. This approach ensures robust optimization for nonlinear regression with continuous variables. To assess the uncertainty of the fitted parameters, confidence intervals were determined by individually varying either nL or pL while keeping the other fixed at its optimum value, until a 5% increase in SSE was achieved compared to the minimum SSE of the fit. This method provides a quantitative measure of parameter sensitivity and reliability.

2.4. Surface Area and Pore Structure Characterization by N2 Adsorption–Desorption

Textural properties of the shale samples were evaluated by N2 adsorption–desorption at 77 K using a Micromeritics 3FLEX™ instrument. Before analysis, samples were degassed at 110 °C under vacuum for 12 h using a VacPrep 061 (Micromeritics, Micromeritics, Miami, FL, USA) to remove moisture and volatiles. The specific surface area was determined using the Brunauer–Emmett–Teller (BET) method. Pore size distributions were derived from the desorption branches of the isotherms using the Barrett–Joyner–Halenda (BJH) method, as recommended for slit-shaped pore analysis. N2 adsorption–desorption isotherms were measured over a relative pressure (P/P0) range of 0.01–0.99.

3. Results

3.1. Mineralogical Composition and Its Role in Adsorption

X-ray diffraction (XRD) analysis revealed diverse mineralogical compositions among the samples. S1 and S2 were rich in quartz (45.07% and 43.84%, respectively) and kaolinite, with minor phases such as pyrite, natrojarosite, and lizardite. S3 showed a dominant presence of whewellite (57.1%) and dickite (23.55%), while mineralogical data were not available for S4. Despite repeated attempts, including additional XRD and exploratory XRF analyses, no reliable data could be obtained for S4, likely due to sample alteration or contamination during handling or storage. No additional material from S4 is available for further analysis.
Clays such as kaolinite and dickite can enhance adsorption through increased surface area and the development of active sites [28]. However, the low BET values observed—even in samples with substantial clay content—suggest that mineralogy alone does not account for the differences in gas uptake. This indicates a complex interplay between mineral phases, thermal maturity, and the structure of the organic matrix [29,30]. The notable adsorption capacity of S4, despite the lack of mineralogical data, may be partly explained by a mineralogical composition similar to that of S3, as both samples originate from the same well. This possibility, along with potential structural features favoring gas uptake, highlights the need for further study.

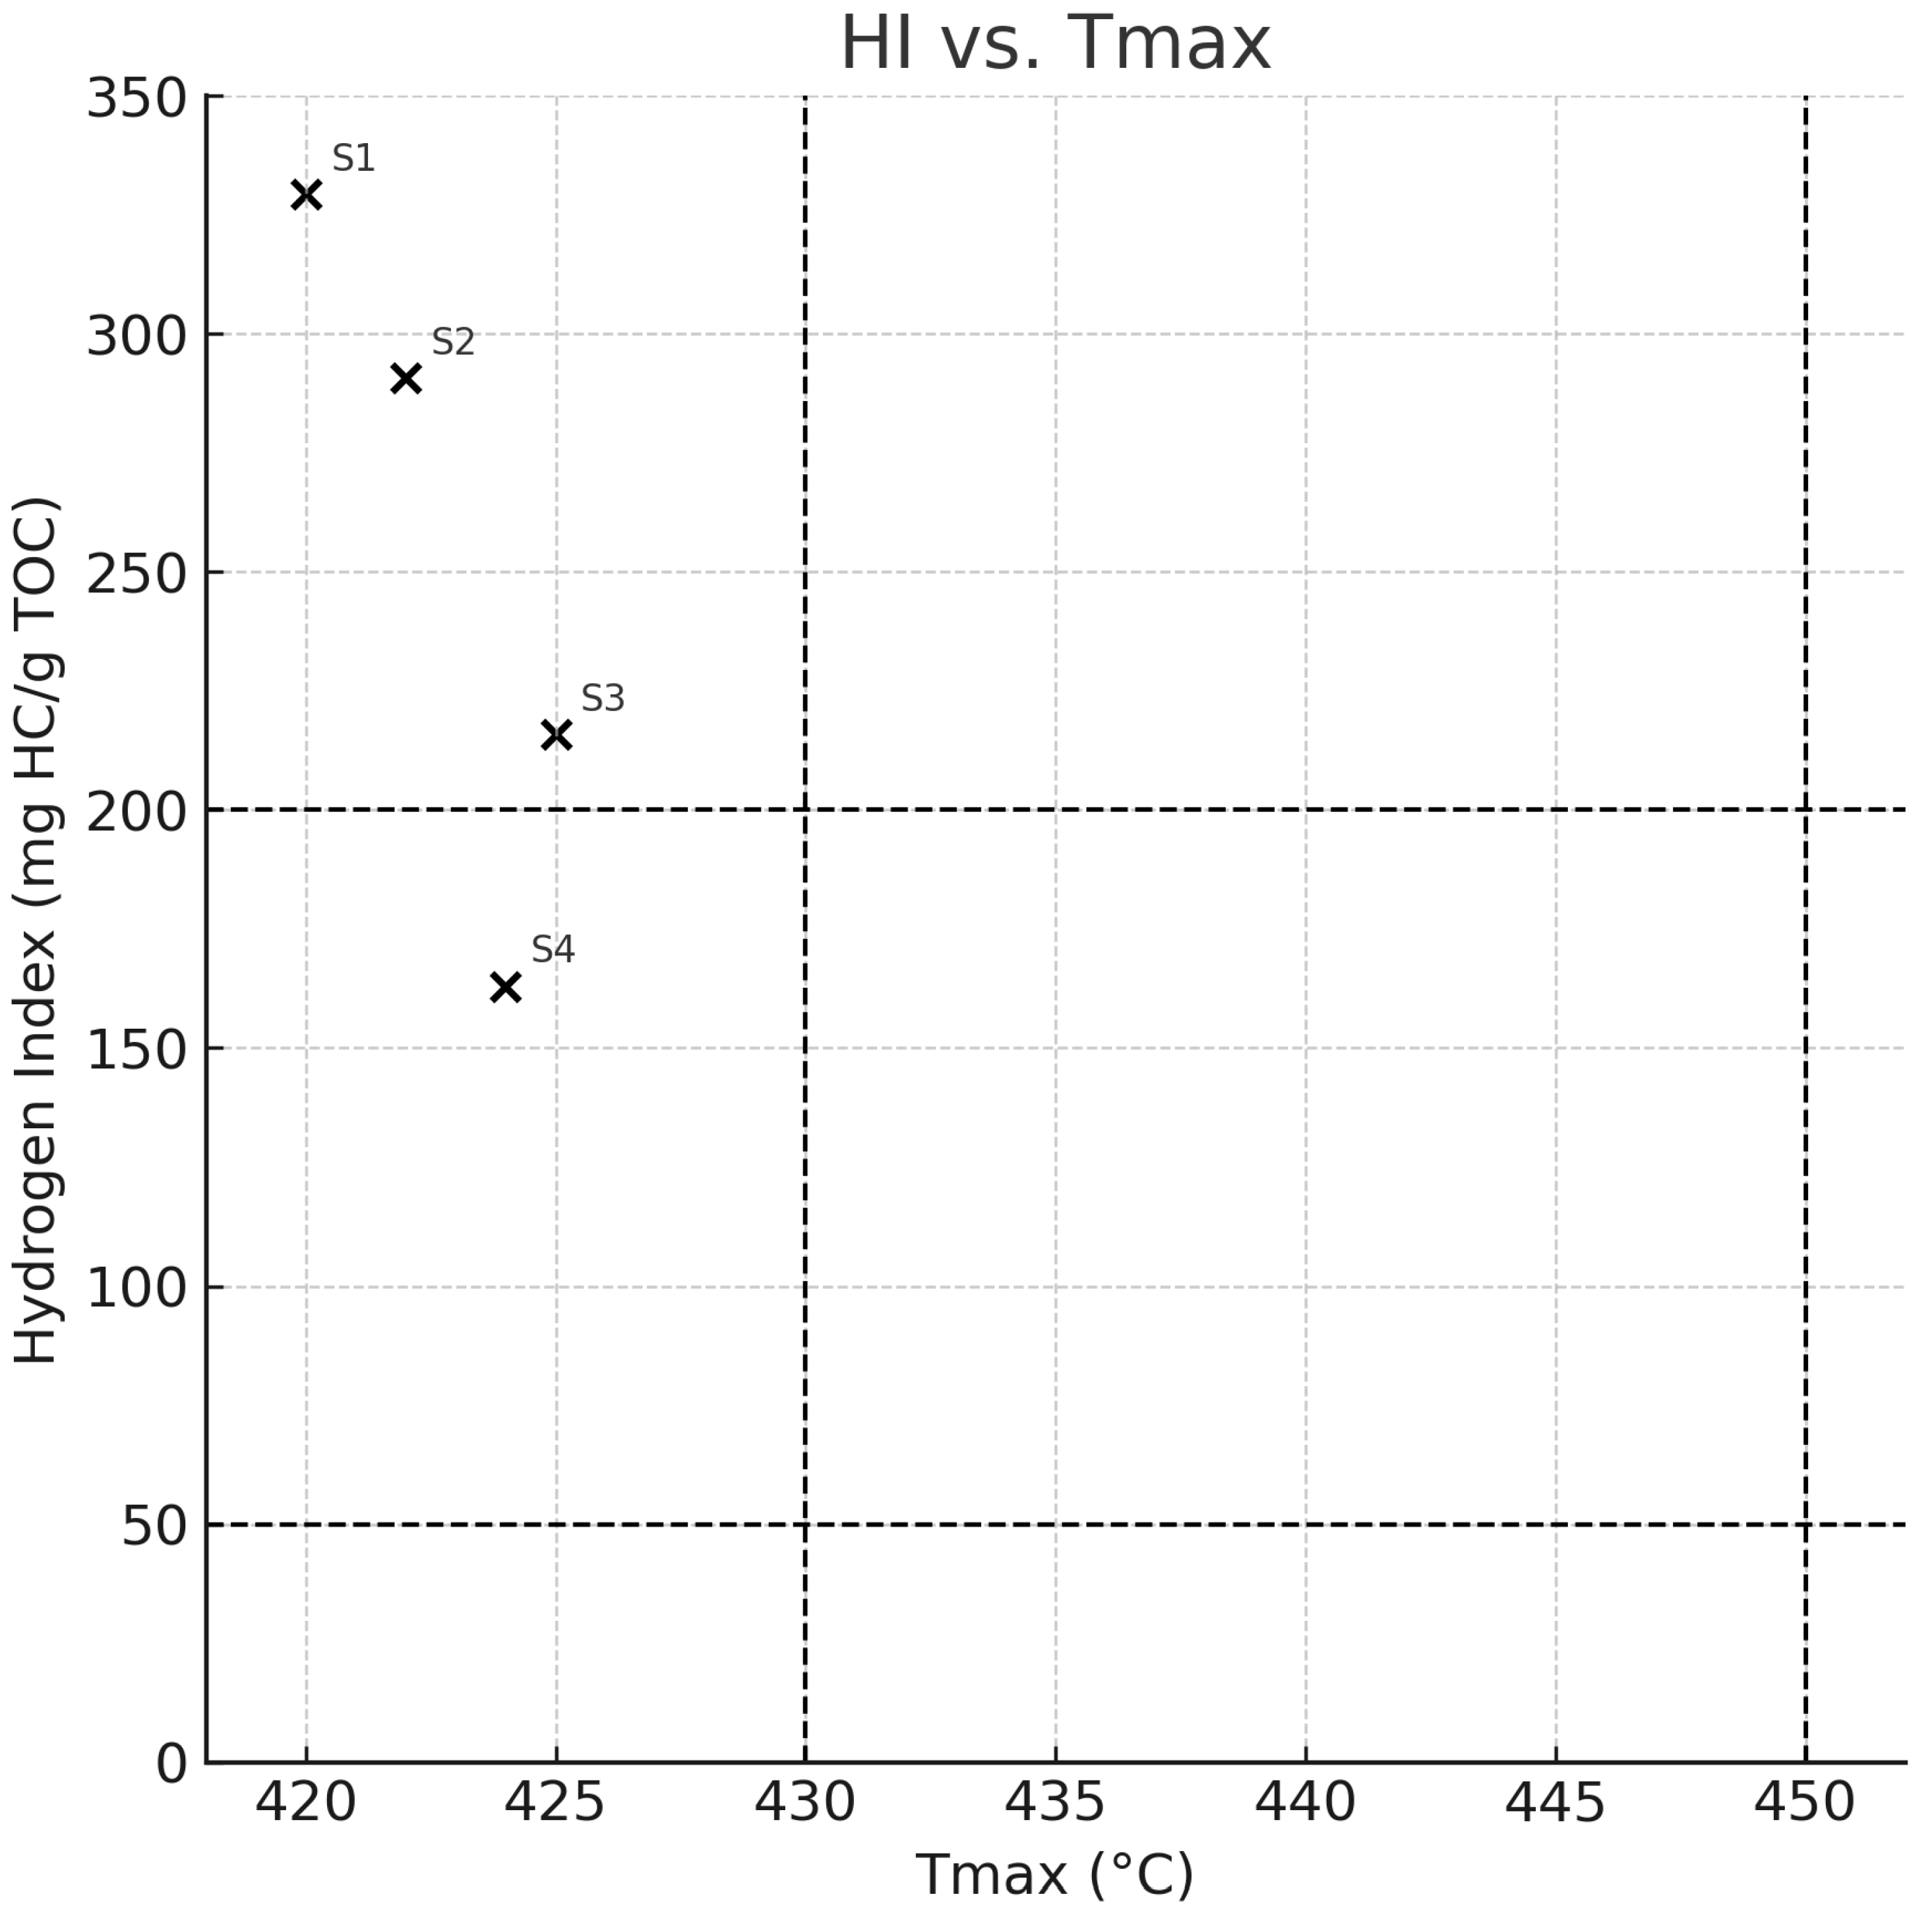
3.2. Geochemical Properties and Thermal Maturity

Total organic carbon (TOC) contents ranged from 33.44 to 69.63 wt%, with particularly high values in samples S3 and S4. Nevertheless, the specific surface areas (BET) were relatively low (1–7 m2/g), suggesting a predominance of non-porous or poorly connected organic domains, likely due to the immature thermal state. This has been reported in other studies where high TOC did not correlate with higher surface area or adsorption when the pore network within the kerogen was poorly developed [31,32].
Tmax values ranged from 420 to 425 °C and vitrinite reflectance (Ro) values from 0.36 to 0.53%, placing all samples in the immature to early stage. According to the extended HI classification, S1 to S3 are associated with Type II/III kerogen and S4 with Type III kerogen. Figure 1 shows a plot of hydrogen index (HI) versus Tmax for samples S1 to S4. The dashed horizontal lines indicate the boundaries between kerogen types according to the extended HI classification: Type II/III (200–400 mg HC/g TOC), Type III (50–200 mg HC/g TOC), and Type IV (<50 mg HC/g TOC) [33]. Vertical dashed lines indicate thermal maturity stages at 430 °C (onset of maturity) and 450 °C (transition to postmature stage). The samples are primarily in the immature to early mature window, with kerogen types ranging from Type II/III to Type III.
These results are consistent with previous studies showing that high TOC in immature shales does not necessarily imply higher adsorption capacity due to the lack of developed microporosity in the organic matrix [31,32]. This geochemical profile provides essential context for interpreting the adsorption behavior presented in the following sections.

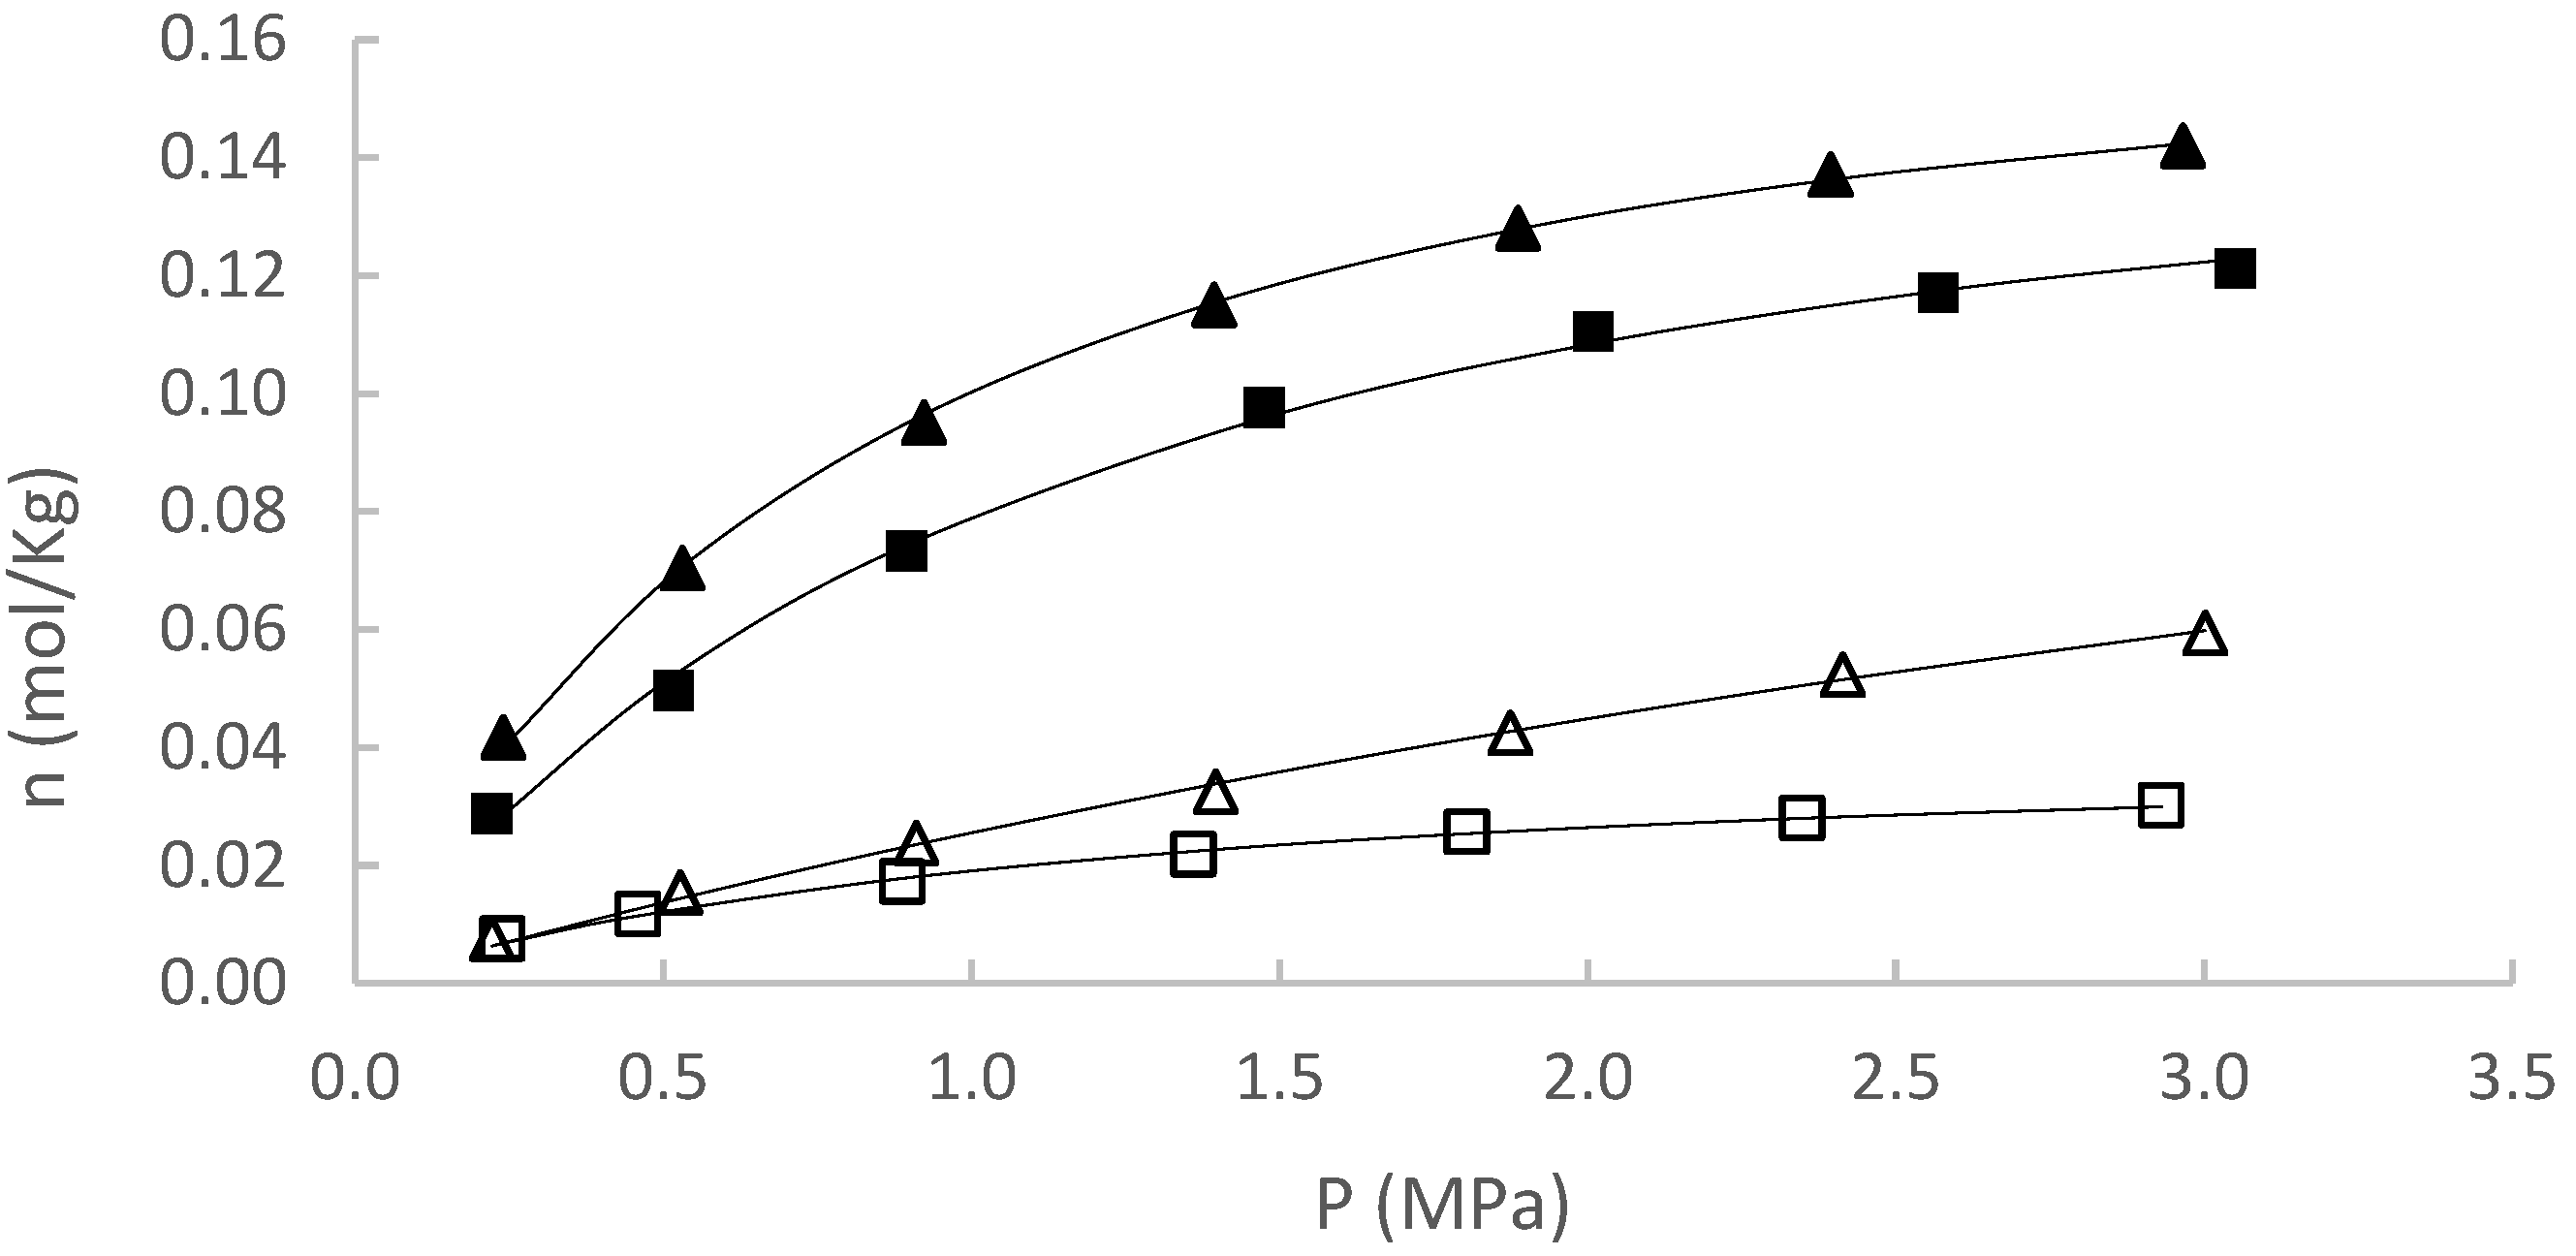
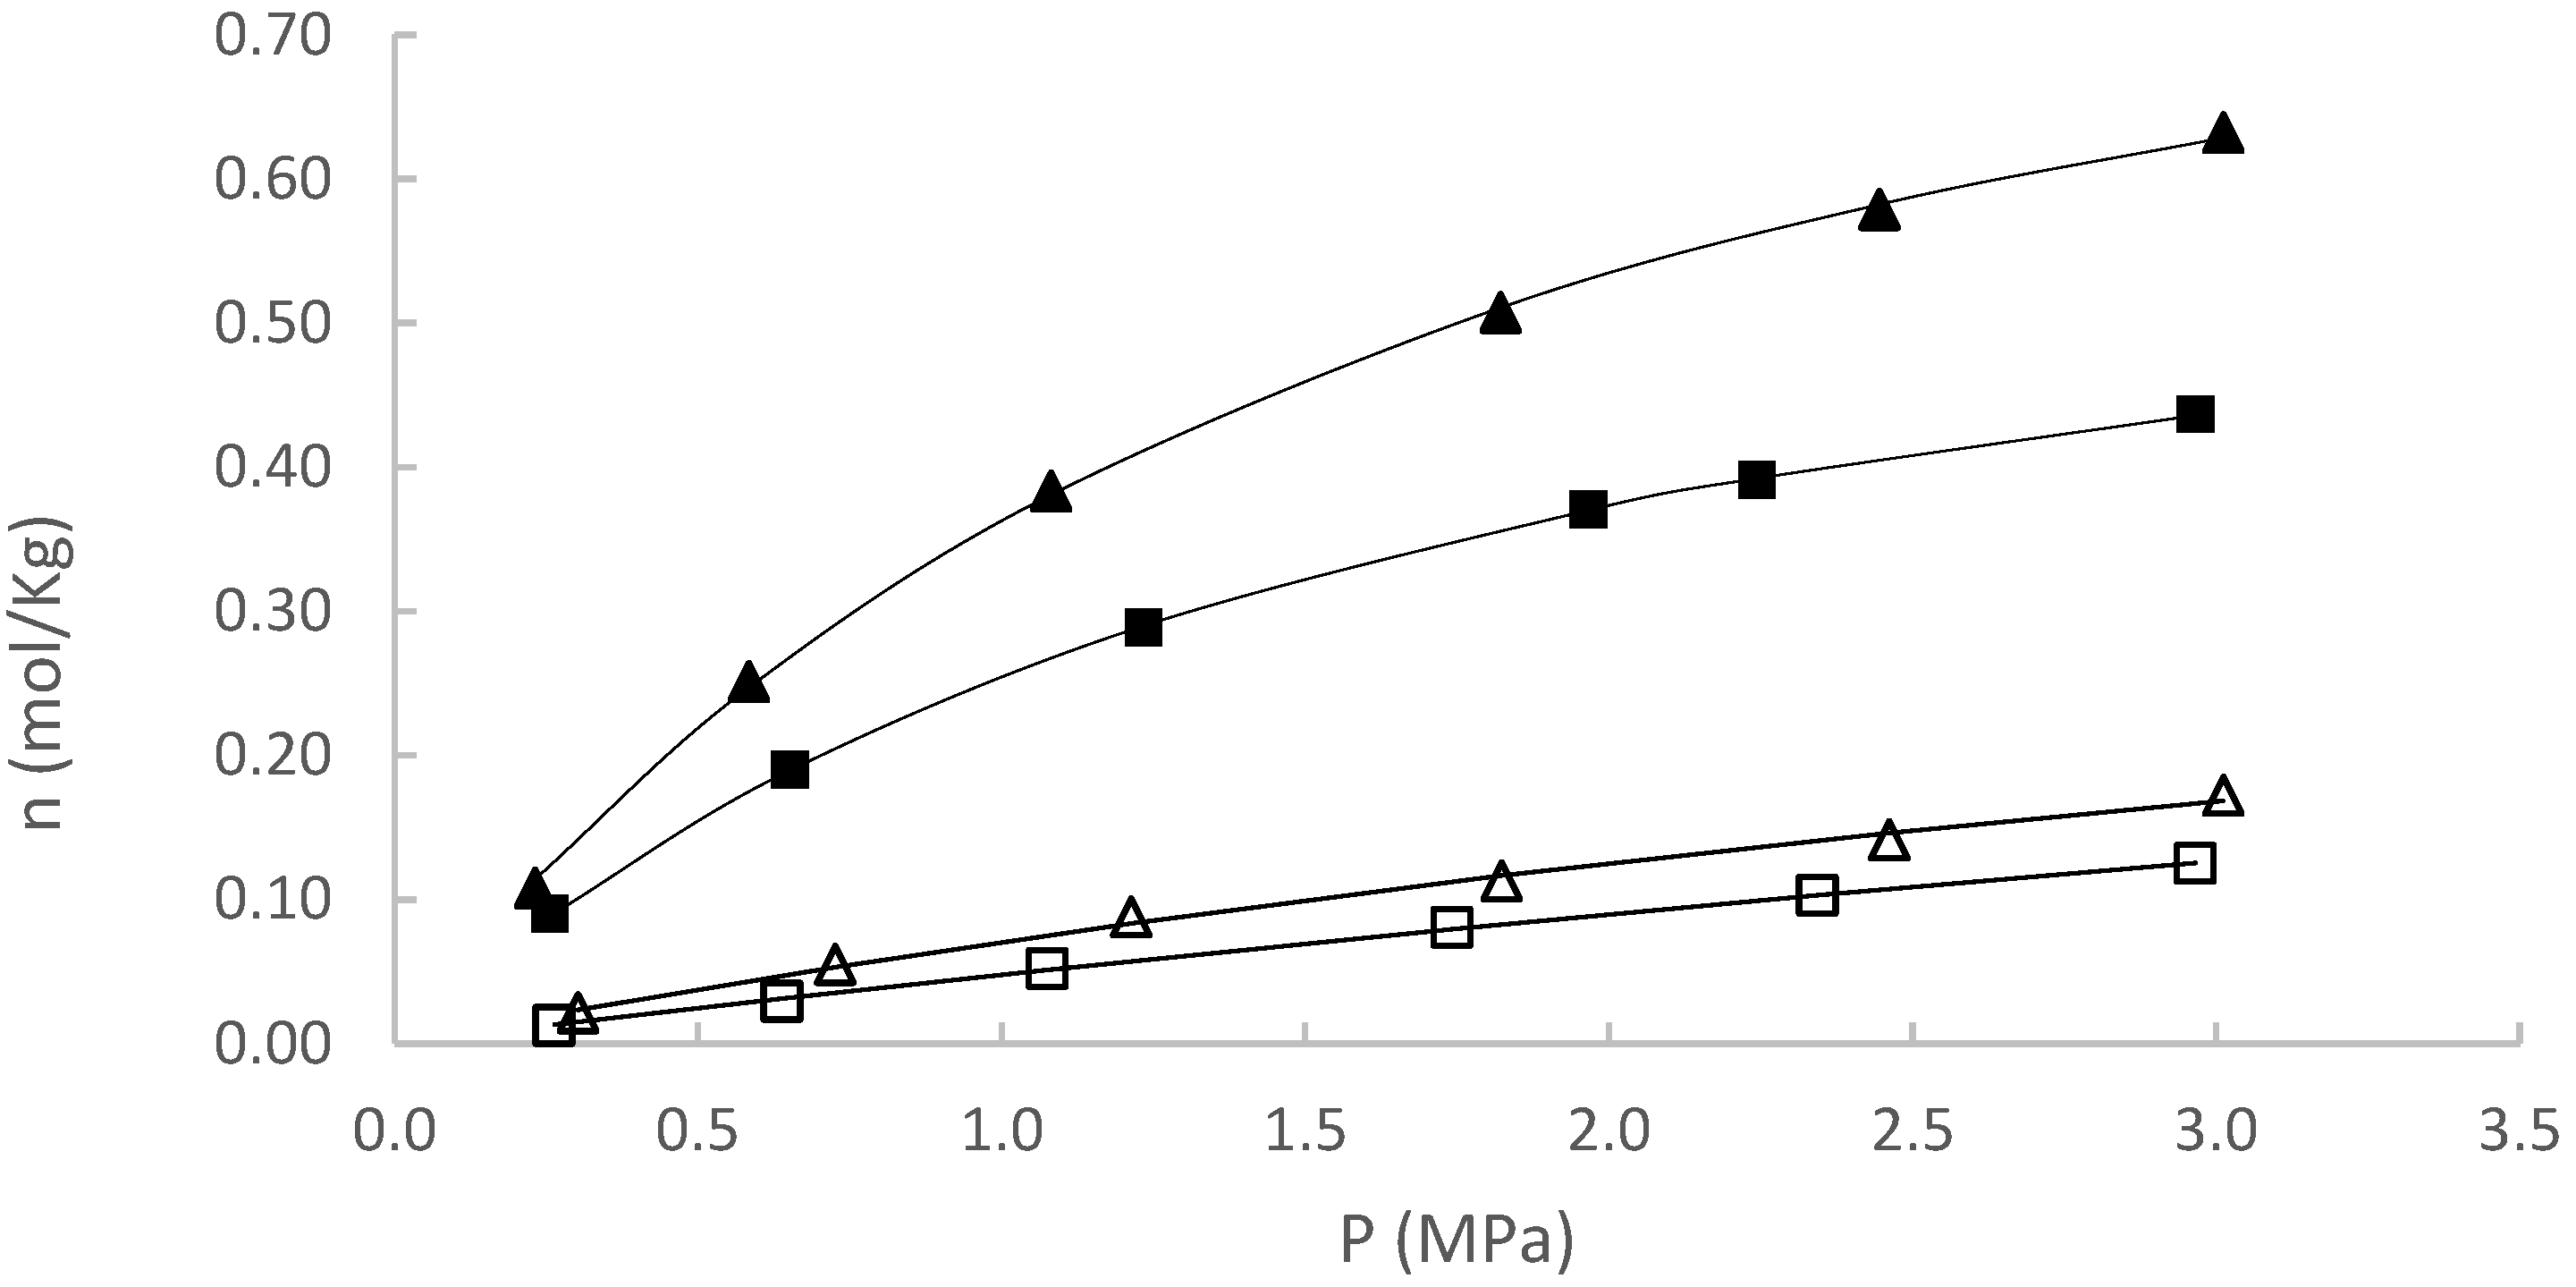
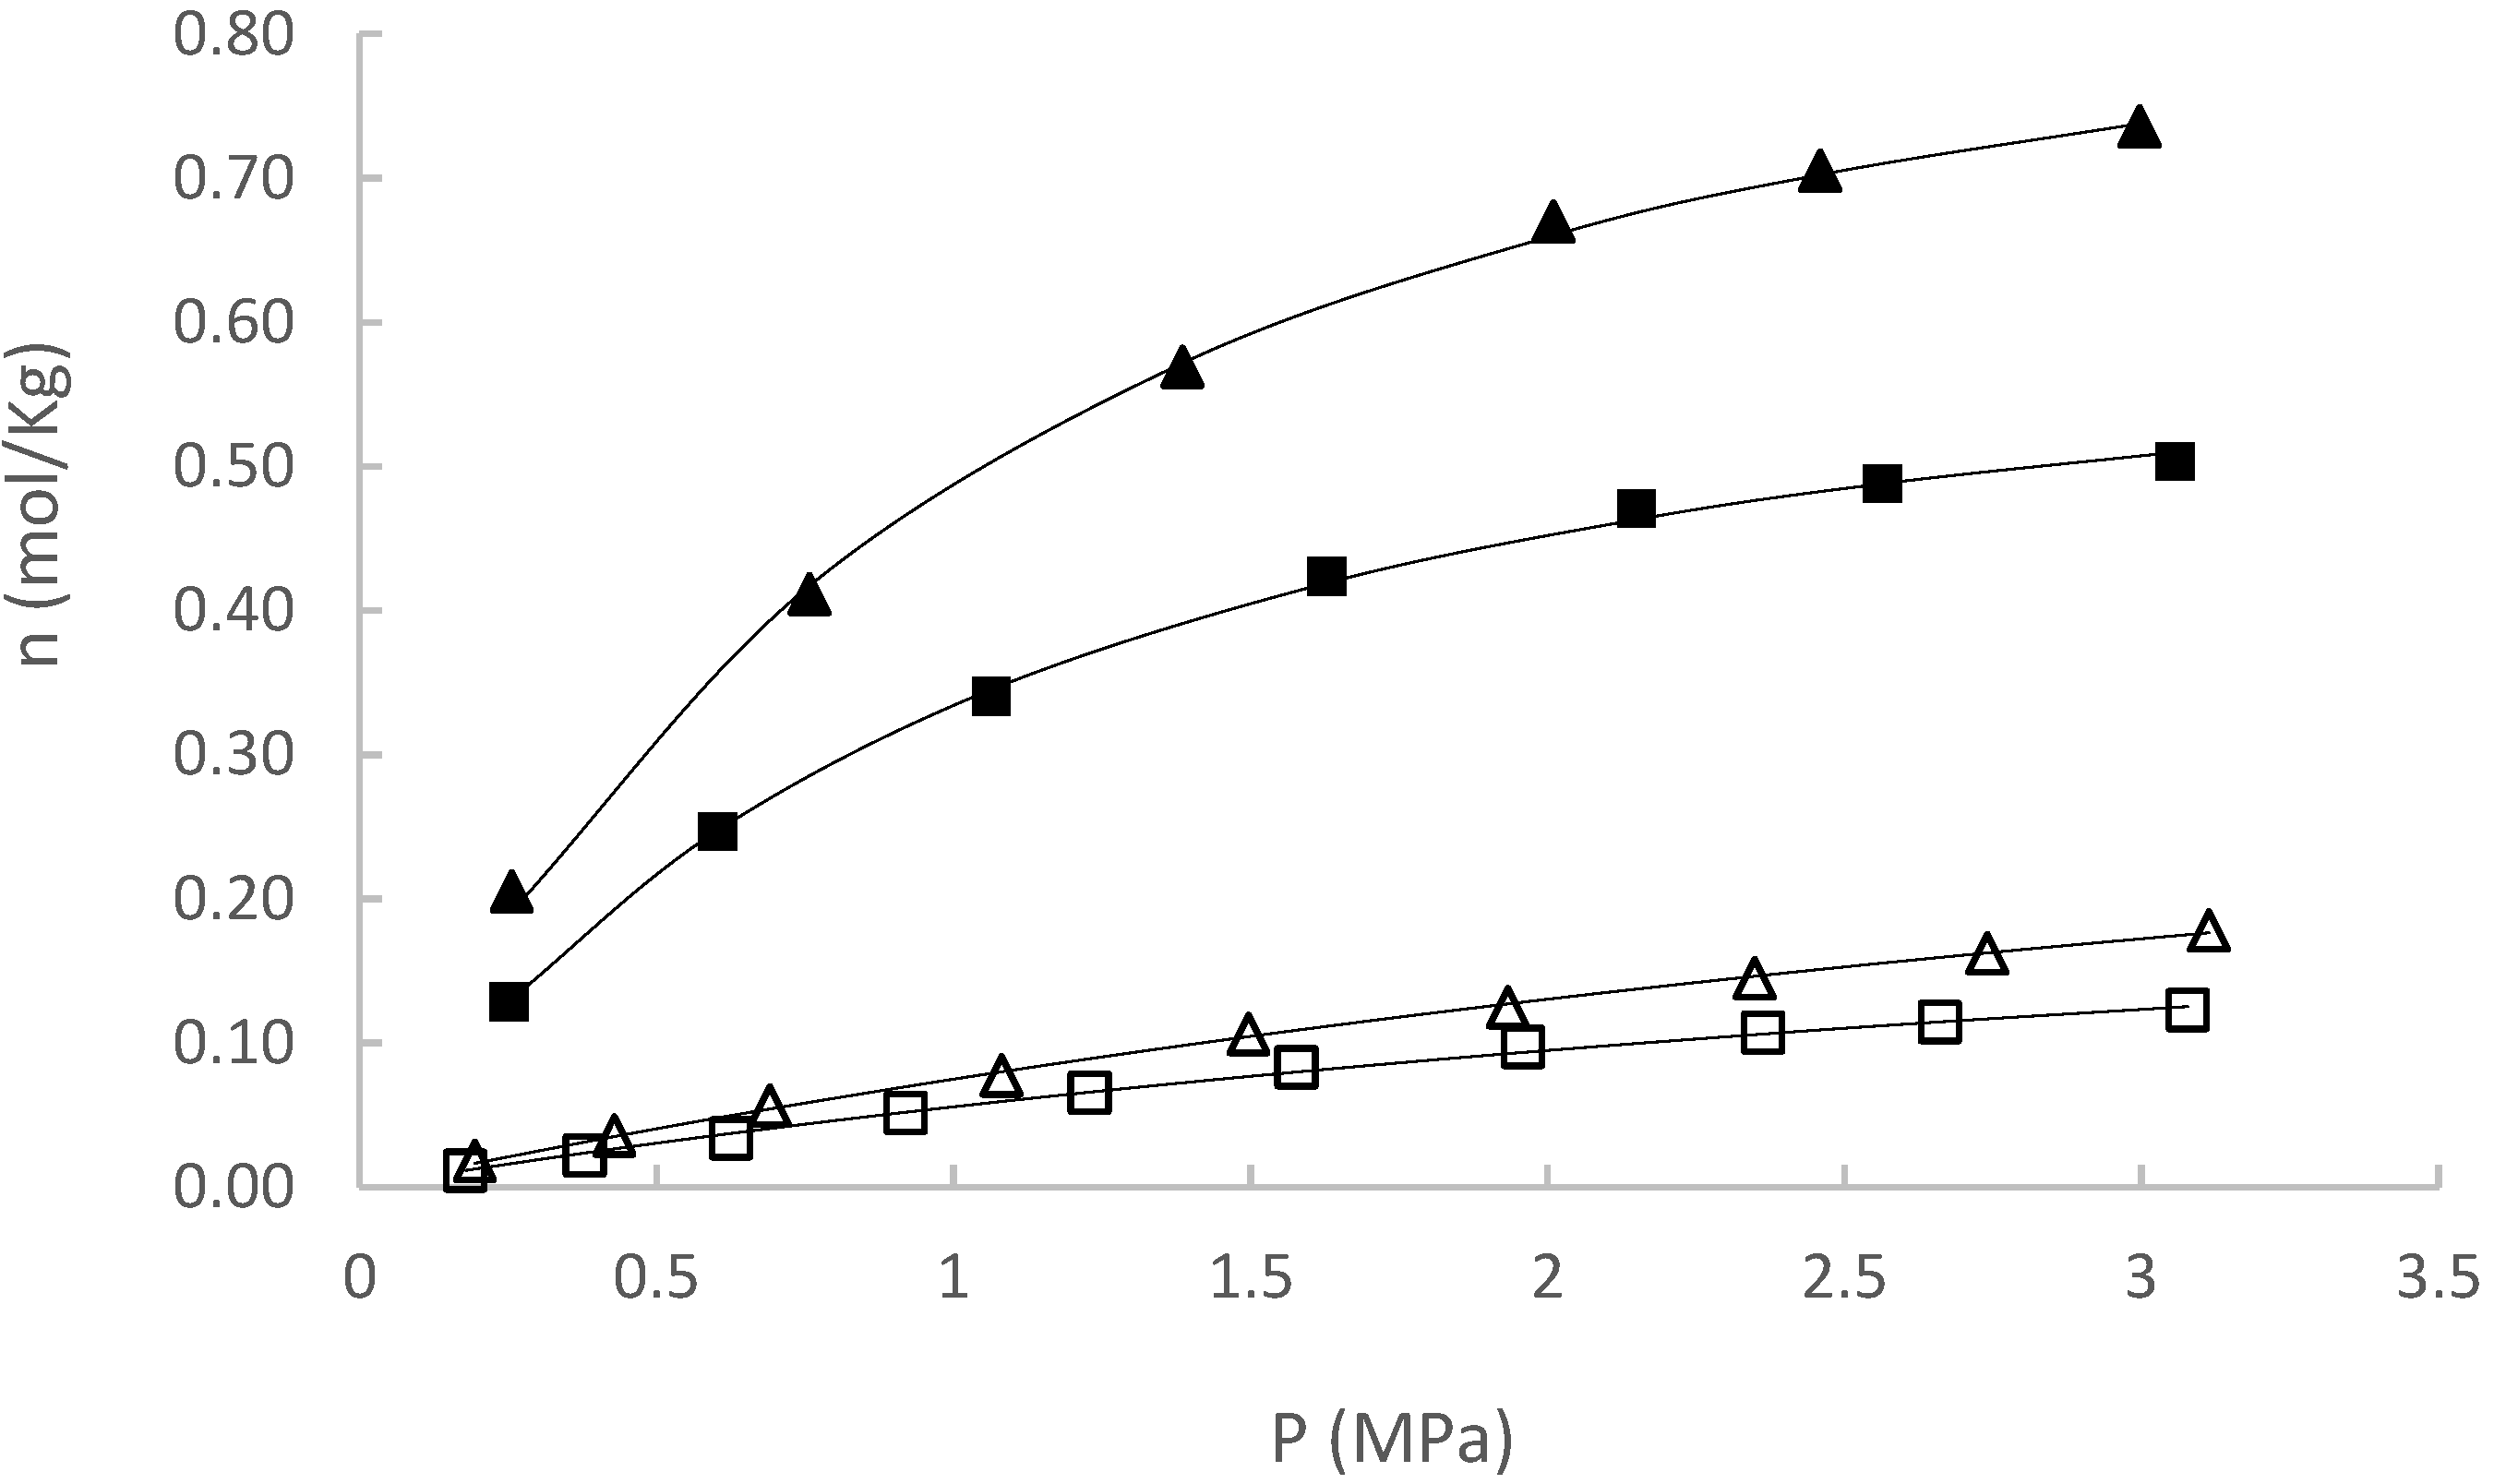
3.3. Adsorption Behavior of CH4 and CO2

The adsorption isotherms of pure methane (CH4) and carbon dioxide (CO2) were measured at 50 and 80 °C for all samples. In every case, CO2 displayed higher adsorption capacity than CH4 across the entire pressure range (0–3 MPa), consistent with its higher molecular polarizability and stronger affinity for organic matter [25,34].
The highest overall adsorption capacity was observed in sample S4, followed by S3, S2, and S1. This ranking only partially correlates with BET surface area, which ranged from 1 m2/g (S2) to 7 m2/g (S4). The fact that this trend does not strictly follow TOC values indicates that additional factors—such as pore accessibility and mineral structure—also play a key role in controlling gas uptake [5,29,31].
The complete set of adsorption data is presented in Figure 2, Figure 3, Figure 4 and Figure 5. Each figure displays the experimental data points together with the fitted Langmuir model curves, allowing for a clear visual assessment of fit quality. The corresponding Langmuir parameters and coefficients of determination (R2) are summarized in Table 3, Table 4, Table 5 and Table 6, confirming the strong agreement between experimental data and model predictions and supporting the applicability of the Langmuir model to these organic-rich shale samples. The data point symbols are coded as follows: filled triangles represent CO2 adsorption at 50 °C, filled squares represent CO2 adsorption at 80 °C, open triangles represent CH4 adsorption at 50 °C, open squares represent CH4 adsorption at 80 °C, and solid lines represents Langmuir model fit. This consistent coding applies across Figure 2, Figure 3, Figure 4 and Figure 5 and facilitates the direct comparison of gas behavior across temperatures and samples.
These results provide a robust basis for the detailed discussion of adsorption mechanisms and controlling factors presented in Section 4.
Experimental data were correlated using the three-parameter Langmuir model described by Gensterblum et al. [27] and applied by Gasparik et al. [35], which is given as follows:
n ads excess = n L p p + p L 1 ρ g p , T ρ ads = n ads absolute 1 ρ g p , T ρ ads  
where n ads excess is the adsorbed amount of gas (mol/kg) at pressure p (MPa), p L is the Langmuir pressure (the pressure at which half of the Langmuir volume is adsorbed), n L is the amount adsorbed (mol/kg) when the monolayer is completely filled (Langmuir maximum capacity), ρ g is the gas density (kg/m3) to a p and T , and ρ ads is the adsorbed phase density, which was assumed as a fixed value of 421 kg/m3 for CH4 [36] and 1027 kg/m3 por CO2 [37].
The standard deviation was calculated according to Pozo et al. [38] as follows:
n = 1 N 1 N   n e x p n f i t 2
where N is the number of data points; n exp is the experimental adsorption value; and n fit is the calculated value at each adsorption pressure.
The parameters of the Langmuir model obtained from nonlinear regression are presented in Table 3, Table 4, Table 5 and Table 6 for each sample, gas, and temperature condition. The fitting results include the maximum adsorption capacity (nL), Langmuir pressure (PL), and the fitting parameter (∆n). The values of ∆n indicate that the Langmuir model provides a good fit to the experimental data, supporting its applicability to describe CH4 and CO2 adsorption on these organic-rich shales. Differences in nL and PL across the samples reflect variations in adsorption affinity and capacity, which are influenced by geochemical maturity, mineralogy, and surface area.
The parameter estimation was carried out using the Solver add-in in Microsoft Excel, applying the generalized reduced gradient (GRG) nonlinear algorithm to minimize the sum of squared residuals between experimental and modeled values. This method is widely used for nonlinear regression problems involving continuous variables and constraints. The consistency of the results and the low ∆n values across all fits confirm the robustness of the approach.
To assess the uncertainty in the Langmuir parameters, confidence intervals were estimated by varying each parameter individually while keeping the other fixed at its optimum value. Solver (Microsoft Excel version 1808 Build 10417.20020, GRG Nonlinear) was used to identify the range of nL and PL values that resulted in an increase of 5% in the sum of squared errors (SSE) compared to the minimum SSE obtained in the fit. The resulting upper and lower bounds reflect the sensitivity of the parameters to the model fit and provide a measure of the reliability of the estimated values.
In addition to the standard deviation (∆n), the goodness of fit was quantitatively assessed by calculating the sum of squared errors (SSE) for each isotherm. The SSE values were found to be consistently low across all samples and conditions, supporting the adequacy of the Langmuir model in describing the adsorption behavior. Although advanced statistical tests such as the Fisher test were not applied in this study, the robustness of the results is demonstrated by the combination of low SSE values, high coefficients of determination (R2 > 0.99 in most cases), and narrow confidence intervals. Together, these metrics provide strong evidence for the reliability of the fitted parameters. Values in brackets in Table 3, Table 4, Table 5 and Table 6 represent the 95% confidence intervals, estimated by varying one parameter at a time while holding the others fixed, until the SSE increased by 5% relative to the minimum SSE of the best fit.

3.4. Textural Analysis by N2 Adsorption–Desorption

N2 adsorption–desorption analyses provided additional insight into the pore structure of the shale samples. The isotherms (Figure 6) display Type IV behavior with H3–H4 hysteresis loops, characteristic of mesoporous materials with slit-shaped or layered pore structures.
Among the samples, S4 exhibited the highest N2 uptake, consistent with its larger BET surface area (7 m2/g), while S1 and S2 showed the lowest adsorbed volumes, reflecting their more limited pore development. S3 presented intermediate characteristics, with modest N2 adsorption compared to S4.
The pore size distribution curves (Figure 7), derived from the desorption branches using the Barrett–Joyner–Halenda (BJH) method, revealed that the samples are dominated by mesopores (2–50 nm). S4 displayed a broader mesopore distribution and greater cumulative pore volume, which may partially explain its superior CH4 and CO2 adsorption performance. In contrast, S1 and S2 showed narrower distributions concentrated in the 3–10 nm range, while S3 featured a more uniform distribution across the mesopore region.
These textural features, combined with geochemical and mineralogical data, highlight that gas storage capacity in these thermally immature, organic-rich shales is not solely determined by organic content, but is strongly influenced by pore structure, connectivity, and mesopore development.

4. Discussion

4.1. Influence of Organic Matter and Thermal Maturity

The organic-rich nature of the studied shales, with TOC values ranging from 33.44 to 69.63 wt%, suggests high hydrocarbon generation potential. However, the low BET surface areas observed (1–7 m2/g) confirm that organic content alone does not account for the observed adsorption capacities. This decoupling between TOC and adsorption potential has been reported in other studies, where immature or poorly porous organic matter contributes little to gas storage due to limited internal pore development [29,31].
The limited pore accessibility in these thermally immature samples (Tmax 420–425 °C; Ro 0.36–0.53%) likely arises not only from underdeveloped kerogen porosity but also from the structural characteristics of the macromolecular organic matrix. As recent studies have shown, immature shales often exhibit poorly connected pore systems and low internal surface areas despite high TOC levels [39,40]. Furthermore, adsorption may be modulated by the type and morphology of kerogen, which influence the distribution and nature of sorption sites [41,42]. Interactions between organic matter and mineral phases—such as kaolinite, dickite, and whewellite identified in our samples—may also alter surface chemistry and pore accessibility [43].
The weak correlation observed between TOC and adsorption capacity in our data, along with the mesopore distributions revealed by N2 adsorption–desorption analyses, highlights that gas uptake in these shales reflects a complex interplay between organic structure, maturity, pore network development, and matrix composition.

4.2. Role of Mineralogy in Gas Storage

Mineralogical composition played a significant role in differentiating adsorption behavior among the samples. S1 and S2 exhibited high quartz and kaolinite contents, while S3 was dominated by whewellite and dickite. Although clays such as kaolinite and dickite are often linked to increased surface area and sorption sites, in this study their presence did not correspond to elevated BET values or superior gas uptake. This finding reinforces previous reports that mineral composition alone does not control adsorption unless accompanied by suitable textural development and pore network connectivity [30].
The presence of secondary minerals such as natrojarosite and lizardite in S1 may partially obstruct pore accessibility or modify gas interactions through their polar surfaces. Conversely, S3’s mineralogy, combined with its more uniform mesopore distribution, likely contributed to its intermediate adsorption performance.
For S4, no XRD data could be obtained despite repeated measurements, including supplementary XRF analyses, likely due to sample alteration or contamination during handling or storage. No additional material was available for further analysis. Nevertheless, the superior adsorption performance of S4 and its broad mesopore distribution observed in N2 adsorption–desorption analyses suggest that its pore structure compensated for the lack of specific mineralogical data. This highlights the importance of textural properties in gas storage, beyond mineralogy alone. Future work will focus on obtaining new core material to complete its mineralogical characterization.

4.3. Textural Properties and Pore Structure

The N2 adsorption–desorption isotherms and pore size distribution analyses provided further insights into the textural characteristics of the studied samples. All isotherms exhibited Type IV-like behavior with H3 hysteresis loops, indicative of slit-shaped pores, limited pore connectivity, and layered structures, which are typical of immature or poorly developed organic matrices. The pore size distributions, derived using the BJH method, revealed that the dominant pores fell within the mesopore range (2–50 nm), with incremental pore volumes peaking between approximately 4 and 20 nm depending on the sample.
Among the samples, S4 displayed the highest cumulative pore volume and BET surface area, which aligns with its superior adsorption performance for both CH4 and CO2. S3 exhibited an intermediate cumulative pore volume with a relatively uniform mesopore distribution, contributing to its noteworthy adsorption despite its low BET value. In contrast, S1 and S2 presented the lowest cumulative pore volumes and narrower pore size distributions, consistent with their lower gas uptake.
These results emphasize that pore accessibility and connectivity—rather than TOC or mineralogy alone—are key determinants of adsorption behavior in these shales. The relatively low microporosity observed across all samples reflects their immature thermal state, as significant micropore development is typically associated with advanced kerogen transformation [33].
Overall, the textural evidence supports the interpretation that gas storage capacity in these organic-rich shales is governed by a complex interplay of organic matter content, mineralogy, and pore structure, with the latter exerting a decisive influence. These findings underscore the relevance of detailed pore structure characterization in evaluating shale gas potential and CO2 sequestration capacity.

4.4. Performance and Langmuir Interpretation

The experimental isotherms and Langmuir modeling confirm that CO2 exhibits higher adsorption capacity and affinity than CH4 across all samples and temperatures, which is consistent with its higher polarizability and quadrupole moment [25,27]. The Langmuir parameters show that CO2 not only achieves greater maximum adsorption (nL) but also requires lower equilibrium pressure (PL) to reach saturation, indicating more efficient sorption dynamics and stronger interactions with the shale matrix.
The increase in adsorption capacity at the lower temperature (50 °C) compared to 80 °C reinforces the dominance of physisorption mechanisms [13]. Sample S4 consistently exhibited the highest adsorption capacities for both gases, in agreement with its larger BET surface area, higher cumulative pore volume, and elevated TOC. In contrast, S3 showed remarkable adsorption performance despite its modest BET value, likely due to the favorable contribution of its unique mineralogy (e.g., whewellite and dickite), relatively uniform mesopore distribution, and intermediate maturity level. This reinforces the view that adsorption capacity is governed by the complex interplay of textural, mineralogical, and geochemical properties rather than any single parameter alone [32,33].
Although several isotherm models—including Sips, Toth, Freundlich, and Dubinin–Radushkevich—could be applied to describe gas adsorption on shale, the Langmuir model was selected in this study due to its simplicity, theoretical clarity, and well-documented applicability to organic-rich formations. Previous studies have shown that the Langmuir model provides sufficiently accurate fits for CH4 and CO2 adsorption in shale systems, particularly under the moderate pressure conditions (0–3 MPa) typical of early-stage reservoir evaluations [10,13,27,30]. The Langmuir parameters—maximum capacity (nL) and Langmuir pressure (PL)—are physically meaningful and facilitate inter-sample and inter-study comparisons, adding practical value for resource assessment.
The consistently low fitting residuals (∆n), narrow confidence intervals, and high coefficients of determination (R2 > 0.99 in most cases) across all samples support the robustness of the Langmuir fits. While alternative models might better capture surface heterogeneity, the Langmuir model proved adequate for the objectives of this study. Future research could explore multi-model fitting and advanced statistical analyses to provide deeper insights into the heterogeneous adsorption behavior of these complex shale matrices.

4.5. Implications for Shale Gas Potential

The findings of this study highlight that high TOC alone is not a reliable predictor of adsorption capacity in organic-rich shales. Instead, shale gas potential should be assessed through a holistic understanding of organic maturity, mineralogical framework, and pore structure. The results show that even samples with exceptionally high TOC can exhibit limited adsorption if the pore network is poorly developed, as seen in the thermally immature samples of this study. Samples S1 to S3, dominated by Type II/III kerogen, may achieve enhanced adsorption performance with further maturation, as thermal evolution is known to promote the development of microporosity and improve pore connectivity within the organic matrix. In contrast, S4, despite its immature state, demonstrates significant adsorption capacity, likely reflecting a combination of favorable pore structure and mineralogical characteristics.
These observations are consistent with recent studies emphasizing the dynamic interplay between geochemical, mineralogical, and textural factors in controlling gas sorption behavior in shale formations [25,34,35]. The pore size distributions, mesoporosity, and cumulative pore volumes measured in this study further illustrate the critical role of textural properties in determining adsorption potential—underscoring that gas storage capacity results from the combined effects of composition and structure rather than individual parameters.
It is important to note that this study is based on four samples from shallow depths within two wells and therefore may not fully capture the heterogeneity of the Cesar-Ranchería Basin. Future investigations incorporating a broader spatial, stratigraphic, and maturity range will be essential to validate these findings and support more comprehensive resource assessments for this basin. Such studies should also explore the evolution of pore systems with increasing thermal maturity and diagenetic alteration to better predict shale gas potential over geological timescales.

5. Conclusions

This study presents a comprehensive experimental assessment of CH4 and CO2 adsorption on thermally immature, organic-rich shale samples from the Cesar-Ranchería Basin in Colombia. Based on the integrated analysis of adsorption behavior, geochemical properties, mineralogy, and pore structure, the following conclusions can be drawn.
CO2 consistently exhibited higher adsorption capacity and stronger affinity than CH4 under all tested conditions, due to its greater polarizability and quadrupole moment. This confirms the potential of these shales for CO2 geological storage in addition to gas production.
The adsorption capacity varied among the samples, with S4 showing the highest performance. This result is partly explained by its larger BET surface area and cumulative pore volume. However, the correlation with TOC was weak, underscoring that gas uptake is governed by a complex interplay of organic content, thermal maturity, mineralogy, and especially pore structure.
Despite their exceptionally high TOC contents (33.44–69.63 wt%), the samples exhibited low BET surface areas (1–7 m2/g) and limited microporosity, consistent with their immature to early mature thermal state (Tmax: 420–425 °C; Ro: 0.36–0.53%). This highlights that TOC alone is not a reliable predictor of adsorption capacity in thermally immature shales.
Pore structure, as revealed by N2 adsorption–desorption and BJH analysis, played a decisive role in adsorption performance. S4 showed the broadest mesopore distribution and highest cumulative pore volume, aligning with its superior gas uptake. In contrast, S1 and S2 exhibited narrower mesopore ranges and lower pore volumes, which limited their adsorption.
The Langmuir model provided an excellent fit to the experimental data, as demonstrated by low residuals, narrow confidence intervals for fitted parameters, and high coefficients of determination (R2 > 0.99 in most cases). This supports its continued use for early-stage evaluations, although future studies could benefit from multi-model comparisons to account for surface heterogeneity.
Overall, these findings emphasize the need for integrated evaluation of shale gas potential, considering not just TOC or mineral content but also textural characteristics and thermal maturity. Such holistic assessments are essential for accurately estimating gas in-place and designing CO2 sequestration strategies in the Cesar-Ranchería Basin and similar geological settings.

Author Contributions

Conceptualization, O.P.O.C. and N.S.S.; data curation, O.P.O.C.; formal analysis, O.P.O.C.; investigation, O.P.O.C.; methodology, O.P.O.C.; project administration, N.S.S.; resources, N.S.S.; supervision, O.P.O.C.; validation, O.P.O.C. and N.S.S.; visualization, O.P.O.C.; writing—original draft, O.P.O.C.; writing—review and editing, O.P.O.C. and N.S.S. All authors have read and agreed to the published version of the manuscript.

Funding

This research was funded under Contract No. FP44842-454-2017 (UIS-MINCIENCIAS), derived from Agreement 730/327 of 2016 (ANH-MINCIENCIAS).

Data Availability Statement

The data presented in this study are available on request from the corresponding author; the data are not publicly available due to privacy restrictions.

Acknowledgments

Authors acknowledge the GIT of Universidad Industrial de Santander for their support of this work.

Conflicts of Interest

The authors declare no conflicts of interest.

References

  1. U.S. Energy Information Administration. International Energy Outlook 2023; U.S. EIA: Washington, DC, USA, 2023.
  2. Aguilera, R.F. Assessing shale gas potential globally: Energy return on investment (EROI) and other challenges. Energy Policy 2014, 64, 701–710. [Google Scholar]
  3. Agencia Nacional de Hidrocarburos (ANH). Potencial de Recursos en Yacimientos No Convencionales de Colombia; ANH: Bogotá, Colombia, 2020.
  4. Chalmers, G.R.L.; Bustin, R.M. The organic matter distribution and gas adsorption capacity of the Lower Cretaceous shales of northeastern British Columbia, Canada. Int. J. Coal Geol. 2007, 70, 223–239. [Google Scholar] [CrossRef]
  5. Ross, D.J.K.; Bustin, R.M. Characterizing the shale gas resource potential of Devonian–Mississippian shales in western Canada. AAPG Bull. 2008, 92, 87–125. [Google Scholar] [CrossRef]
  6. Curtis, M.E.; Sondergeld, C.H.; Rai, C.S. Structural characterization of gas shales on the nanoscale. Microsc. Microanal. 2012, 18, 694–695. [Google Scholar]
  7. Wang, C.; Liu, H.H. A review on gas adsorption in shale nanopores: Modeling advances and challenges. J. Nat. Gas Sci. Eng. 2021, 94, 104127. [Google Scholar]
  8. Gasparik, M.; Ghanizadeh, A.; Gensterblum, Y.; Krooss, B.M.; Littke, R. CO2 and CH4 adsorption capacity of European shales. Energy Procedia 2013, 37, 5243–5252. [Google Scholar]
  9. Busch, A.; Alles, S.; Gensterblum, Y.; Prinz, D.; Dewhurst, D.N.; Raven, M.D.; Stanjek, H.; Krooss, B.M. Carbon dioxide storage potential of shales. Int. J. Greenh. Gas Control 2008, 2, 297–308. [Google Scholar] [CrossRef]
  10. Heller, R.; Vermylen, J.; Zoback, M. Experimental investigation of gas adsorption in shales. Fuel 2014, 115, 378–393. [Google Scholar]
  11. Rexer, T.F.T.; Benham, M.J.; Aplin, A.C.; Thomas, K.M. Methane adsorption on shale under simulated geological temperature and pressure conditions. Energy Fuels 2013, 27, 3099–3109. [Google Scholar] [CrossRef]
  12. Zhang, T.; Ellis, G.S.; Ruppel, S.C.; Milliken, K.; Yang, R. Effect of organic matter properties on methane sorption in shales. Int. J. Coal Geol. 2012, 103, 89–98. [Google Scholar]
  13. Pan, Z.; Connell, L.D. Comparative adsorption of CH4, CO2 and N2 on organic–inorganic shales. J. Nat. Gas Sci. Eng. 2015, 27, 82–95. [Google Scholar]
  14. Liu, X.; Zhou, Y.; Hu, Q.; Zhang, Y. Pore structure and CH4/CO2 adsorption capacity of high-TOC shales. Fuel 2018, 226, 125–135. [Google Scholar]
  15. Wang, S.; Liu, H.; Yang, R.; Zhang, L.; Li, Y. Adsorption of CO2 and CH4 in gas shale nanopores: Insights from molecular simulations. Langmuir 2014, 30, 13960–13968. [Google Scholar]
  16. Ríos-Reyes, C.A.; Buitrago, H.; Pulido, J.C. Thermal maturity and organic geochemistry of shales from the Cesar-Ranchería Basin. J. South Am. Earth Sci. 2017, 76, 283–297. [Google Scholar]
  17. Buitrago, H.; Arango, M.; De La Parra, M. Evaluation of unconventional resource potential in northern Colombia. In Proceedings of the AAPG International Conference and Exhibition, Cartagena, Colombia, 4–17 September 2014. [Google Scholar]
  18. Agencia Nacional de Hidrocarburos (ANH). Atlas Geológico de Colombia, Volumen IV: Cuenca Cesar-Ranchería; ANH: Bogotá, Colombia, 2015.
  19. Tang, X.; Ripepi, N.; Liu, B.; Liu, Z. Methane adsorption in shales: Influence of organic matter vs. clay content. Fuel 2016, 174, 560–570. [Google Scholar]
  20. Clarkson, C.R.; Bustin, R.M. Variation in permeability and storage capacity of shale gas reservoirs with mineralogy. Int. J. Coal Geol. 2000, 38, 33–45. [Google Scholar]
  21. Bustin, R.M.; Chalmers, G.R. Gas adsorption capacity and chemical composition of thermally mature shales. Int. J. Coal Geol. 2010, 82, 235–248. [Google Scholar]
  22. Guo, X.; Bustin, R.M.; Ning, Z. Impact of maturity and pore structure on methane adsorption in organic-rich shales. Mar. Pet. Geol. 2020, 117, 104399. [Google Scholar]
  23. Agencia Nacional de Hidrocarburos (ANH). Ronda Colombia 2021: Cuenca Cesar-Ranchería. 2021. Available online: https://www.anh.gov.co/es/ (accessed on 20 April 2025).
  24. Silva, C.; Toro, J.; Martínez, J.D. Integrated structural and basinal analysis of the Cesar–Ranchería Basin, Colombia: Implications for its tectonic history and petroleum systems. In Petroleum Basins and Hydrocarbon Potential of the Andes of Peru and Bolivia; AAPG Memoir 117; American Association of Petroleum Geologists: Tulsa, OK, USA, 2020; pp. 349–374. [Google Scholar]
  25. Busch, A.; Gensterblum, Y.; Krooss, B.M.; Littke, R. Methane and carbon dioxide adsorption–diffusion in organic-rich shales. Int. J. Coal Geol. 2008, 76, 89–101. [Google Scholar] [CrossRef]
  26. Pino, D.; Plantier, F.; Bessieres, D. Experimental determination of the adsorption isotherms in gas mixtures under extended pressure and temperature range. J. Therm. Anal. Calorim. 2014, 117, 1469–1477. [Google Scholar] [CrossRef]
  27. Gensterblum, Y.; Bode, M.; de Weireld, G.; Prinz, D.; Littke, R.; Busch, A.; Krooss, B.M. European inter-laboratory comparison of high-pressure CO2 sorption isotherms. I: Activated carbon. Carbon 2009, 47, 2958–2969. [Google Scholar] [CrossRef]
  28. Curtis, M.E.; Ambrose, R.J.; Sondergeld, C.H.; Rai, C.S. Structural characterization of gas shales on the micro- and nano-scales. J. Nat. Gas Sci. Eng. 2012, 8, 28–39. [Google Scholar] [CrossRef]
  29. Heller, R.; Zoback, M. Adsorption of methane and carbon dioxide on gas shale and pure mineral samples. J. Unconv. Oil Gas Resour. 2014, 8, 14–24. [Google Scholar] [CrossRef]
  30. Guo, X.; Bustin, R.M. Pore structure evolution and fluid flow in thermally matured organic-rich shales. Mar. Pet. Geol. 2020, 117, 104399. [Google Scholar] [CrossRef]
  31. Tang, X.; Ripepi, N.; Liu, B.; Liu, Z. Quantitative evaluation of the relationship between surface area and methane adsorption in organic-rich shales. Fuel 2016, 182, 107–114. [Google Scholar] [CrossRef]
  32. Liu, X.; Zhou, Y.; Hu, Q.; Zhang, Y. Relationship between TOC and methane adsorption in shales: Experimental evidence from different formations. Fuel 2018, 226, 125–135. [Google Scholar] [CrossRef]
  33. Peters, K.E.; Walters, C.C.; Moldowan, J.M. The Biomarker Guide, 2nd ed.; Cambridge University Press: Cambridge, UK, 2005; Volume 1. [Google Scholar]
  34. Gasparik, M.; Ghanizadeh, A.; Gensterblum, Y.; Krooss, B.M.; Littke, R. Geological controls on the methane storage capacity of European shales. Energy Procedia 2013, 40, 511–520. [Google Scholar] [CrossRef]
  35. Gasparik, M.; Ghanizadeh, A.; Bertier, P.; Gensterblum, Y.; Bouw, S.; Krooss, B.M. High-pressure methane sorption isotherms of black shales from the Netherlands. Energy Fuels 2012, 26, 4995–5004. [Google Scholar] [CrossRef]
  36. Weniger, P.; Kalkreuth, W.; Busch, A.; Krooss, B.M. High pressure methane and carbon dioxide sorption on coal and shale samples from the Paraná Basin, Brazil. Int. J. Coal Geol. 2010, 84, 190–205. [Google Scholar] [CrossRef]
  37. Gensterblum, Y.; Merkel, A.; Busch, A.; Krooss, B.M. High-pressure CH4 and CO2 sorption isotherms as a function of coal maturity and the influence of moisture. Int. J. Coal Geol. 2013, 118, 45–57. [Google Scholar] [CrossRef]
  38. Pozo, M.; Pino, D.; Bessieres, D. Effect of thermal events on maturation and methane adsorption of Silurian black shales (Checa, Spain). Appl. Clay Sci. 2017, 136, 208–218. [Google Scholar] [CrossRef]
  39. Wei, L.; Liu, D.; Pan, Z.; Chen, J.; Liu, H. Pore structure evolution of organic matter in immature shales and its effect on methane adsorption. Fuel 2023, 344, 128180. [Google Scholar] [CrossRef]
  40. Zhang, H.; Song, Y.; Han, J.; Zhao, S. Thermal maturity controls on nanopore development and gas storage in lacustrine shales. Int. J. Coal Geol. 2022, 253, 104123. [Google Scholar]
  41. Wang, Y.; Tang, X.; Ripepi, N. Influence of kerogen type and morphology on methane adsorption in immature shales: An experimental and modeling approach. Energy Fuels 2023, 37, 10567–10580. [Google Scholar] [CrossRef]
  42. Li, Y.; Sun, Z.; Zhou, Y.; Bai, Y.; He, H. Kerogen-hosted nanopores and their control on gas adsorption in early-mature shale: Insights from FIB-SEM and gas adsorption techniques. J. Nat. Gas Sci. Eng. 2024, 119, 105571. [Google Scholar]
  43. Zhou, W.; Hu, Q.; Liu, X.; Lu, S. Organic–inorganic interactions and their role in controlling pore accessibility and gas sorption in immature marine shales. Mar. Pet. Geol. 2022, 143, 105821. [Google Scholar] [CrossRef]
Figure 1. Tmax−HI graph. Source: own elaboration.
Processes 13 02108 g001
Figure 2. Adsorption isotherms and Langmuir fit for S1, ▲ CO2 adsorption at 50 °C; ■ CO2 adsorption at 80 °C; △ CH4 adsorption at 50 °C; □ CH4 adsorption at 80 °C; solid lines: Langmuir model fit.
Processes 13 02108 g002
Figure 3. Adsorption isotherms and Langmuir fit for S2, ▲ CO2 adsorption at 50 °C; ■ CO2 adsorption at 80 °C; △ CH4 adsorption at 50 °C; □ CH4 adsorption at 80 °C; solid lines: Langmuir model fit.
Processes 13 02108 g003
Figure 4. Adsorption isotherms and Langmuir fit for S3, ▲ CO2 adsorption at 50 °C; ■ CO2 adsorption at 80 °C; △ CH4 adsorption at 50 °C; □ CH4 adsorption at 80 °C; solid lines: Langmuir model fit.
Processes 13 02108 g004
Figure 5. Adsorption isotherms and Langmuir fit for S4, ▲ CO2 adsorption at 50 °C; ■ CO2 adsorption at 80 °C; △ CH4 adsorption at 50 °C; □ CH4 adsorption at 80 °C; solid lines: Langmuir model fit.
Processes 13 02108 g005
Figure 6. N2 adsorption–desorption isotherms at 77 K for shale samples S1, S2, S3, and S4. Filled symbols represent adsorption branches, and open symbols represent desorption branches.
Processes 13 02108 g006
Figure 7. Pore size distribution curves of samples (S1–S4) derived from N2 desorption using the BJH method. dV/dw differential pore volume plotted against pore width.
Processes 13 02108 g007
Table 1. Mineralogical composition of samples from CRB (XRD results).
Mineral% in S1% in S2% in S3
Quartz45.0743.8419.35
Natrojarosite14.80
Lizardite-1T13.89
Pyrite11.396.34
Gypsum1.72
Barite1.60
Spinel1.38
Kaolinite9.1345.37
Chamosite-1MIIb1.02
Jarosite 2.77
Anatase 1.68
Whewellite 57.1
Dickite 23.55
Table 2. Geochemical parameters.
Sample IDTOC (wt%)Tmax (°C)S1
(mg HC/g Rock)
S2
(mg HC/g Rock)
S3
(mg CO2/g Rock)
HI
(mg HC/g TOC)
OI
(mg CO2/g TOC)
PI
(S1/(S1 + S2))
Ro (%)
S133.444202.45110.101.70329.225.080.020.36
S253.674222.11155.982.65290.624.940.010.39
S366.584251.45143.7010.78215.8416.190.010.51
S469.634241.05113.4910.44162.9914.990.010.53
TOC: total organic carbon; Tmax: temperature at maximum pyrolysis yield; S1: free hydrocarbons; S2: hydrocarbons generated through pyrolysis; S3: CO2 released during pyrolysis; HI: hydrogen index; OI: oxygen index; PI: production index; Ro: vitrinite reflectance. These parameters indicate high organic richness and early thermal maturity across the analyzed samples.
Table 3. Langmuir model fitting parameters and 95% confidence intervals for S1.
Experiment n L (mol/kg)
[95% CI]
p L (MPa)
[95% CI]
n R2
CH4 at 50 °C0.2134
[0.2149–0.2118]
7.2346
[7.3029–7.1672]
0.00050.9970
CH4 at 80 °C0.0456
[0.0454–0.0458]
1.3625
[1.3492–1.3760]
0.00020.9951
CO2 at 50 °C0.1986
[0.1990–0.1982]
0.9486
[0.9533–0.9438]
0.00040.9928
CO2 at 80 °C0.1837
[0.1845–0.1830]
1.2885
[1.3015–1.2756]
0.00070.9976
Table 4. Langmuir model fitting parameters and 95% confidence intervals for S2.
Experiment n L (mol/kg)
[95% CI]
p L (MPa)
[95% CI]
n R2
CH4 at 50 °C0.6390
[0.6436–0.6345]
7.9081
[7.9806–7.8366]
0.00140.9945
CH4 at 80 °C0.9517
[0.9491–0.9544]
18.6652
[18.6195–18.7132]
0.00040.9997
CO2 at 50 °C1.1090
[1.1112–1.1068]
2.0109
[2.0109–2.0030]
0.00160.9974
CO2 at 80 °C0.7515
[0.7521–0.7510]
1.9051
[1.9077–1.9026]
0.00040.9972
Table 5. Langmuir model fitting parameters and 95% confidence intervals for S3.
Experiment n L (mol/kg)
[95% CI]
p L (MPa)
[95% CI]
n R2
CH4 at 50 °C0.5756
[0.5776–0.5736]
6.5794
[6.6096–6.5493]
0.00060.9991
CH4 at 80 °C0.3553
[0.3575–0.3531]
5.3011
[5.3473–5.2560]
0.00070.9989
CO2 at 50 °C1.0938
[1.0976–1.0899]
1.2038
[1.2145–1.1932]
0.00370.9970
CO2 at 80 °C0.7467
[0.7486–0.7447]
1.2004
[1.2083–1.1927]
0.00170.9954
Table 6. Langmuir model fitting parameters and 95% confidence intervals for S4.
Experiment n L (mol/kg)
[95% CI]
p L (MPa)
[95% CI]
n R2
CH4 at 50 °C0.8306
[0.8326–0.8287]
2.0418
[2.0535–2.0349]
0.00110.9962
CH4 at 80 °C0.6608
[0.6619–0.6598]
2.4018
[2.4087–2.3950]
0.00050.9968
CO2 at 50 °C1.9964
[1.9991–1.9937]
1.4314
[1.4360–1.4267]
0.00220.9929
CO2 at 80 °C1.2662
[1.2718–1.2607]
1.2371
[1.2508–1.2235]
0.00400.9923
Disclaimer/Publisher’s Note: The statements, opinions and data contained in all publications are solely those of the individual author(s) and contributor(s) and not of MDPI and/or the editor(s). MDPI and/or the editor(s) disclaim responsibility for any injury to people or property resulting from any ideas, methods, instructions or products referred to in the content.

