Abstract
This study assessed the effect of ultrafiltration (UF) on the quality of soft white cheese made from goat skim milk (GSM) and aimed to identify the optimal UF parameters for protein concentration while minimizing energy consumption. UF was applied to pasteurized GSM by altering transmembrane pressure (TMP) and permeate flux density (J) while monitoring the volume reduction factor (VRF). The acidity, viscosity, dry extract, proteins and Ca, Na, K, Mg and Fe contents increased significantly during concentration. Post-ultrafiltration, both UF and non-UF GSMs were coagulated using modified rennet doses (150, 200 and 300 µL/L). The resulting cheeses underwent chemical analysis, yield calculation and textural property assessment. The findings highlighted that milk protein concentration was the primary limiting factor for coagulation, with rennet dose having a lesser impact. The UF-GSM produced the best results, yielding approximately 30% cheese with a soft texture and greater nutritional value (proteins, Ca, Mg and Fe).
1. Introduction
Membrane methods for skim milk processing offer a novel approach to dairy production challenges by reducing raw material consumption, creating new dairy products with milk protein. Advances such as UF have significantly enhanced dairy ingredient production [1]. These innovations demonstrate the industry’s adaptability to consumer demands for diverse, high-quality dairy products, while also promoting production efficiency and sustainability. Unit operations serve as the backbone of food processing facilities, providing a standardized framework. UF has also been suggested as an effective method for concentrating skimmed milk before rennet addition and for producing low-moisture pre-cheese without compromising nutritional properties through heat treatment [2,3]. Ultrafiltrated milk has been successfully used in various cheeses, including Halloumi [4], Iranian Feta [5] and Parmesan [6], without compromising their texture or nutritional properties. The UF process typically follows skimming at 50 °C to prevent column clogging [4]. During UF, skimmed milk proteins, including caseins and whey proteins, are concentrated to 42–85% (dry basis) [7,8] enhancing profitability by increasing cheese yield and reducing losses like acid whey generated during cheese production. Optimizing operational parameters—such as temperature, transmembrane pressure (TMP) and permeation flux—is crucial, as they influence retentate composition, physical functionality [9,10] and operating costs associated with mechanical energy losses (e.g., membrane systems, pumps and plant design). A high VRF enables greater protein concentration but incurs economic costs, necessitating a trade-off between process performance and energy expenses. This study will examine the technological transformation of UF-GSM for industrial innovation, leveraging the unique properties of (GSM). GSM is widely recognized for its higher nutritional value and health benefits compared to cow’s milk. It has lower allergenic properties and is easier to digest. Additionally, GM features larger protein micelles (260 nm vs. 200 nm) and smaller fat globules (1.5 µm) than cow’s milk. Moreover, short and medium-chain fatty acids (caproic, caprylic and capric acids) are present in higher concentrations in goat’s milk, being twice that of cow’s milk [11]. While the composition of GM has been well-researched, the effects of physical processes, such as ultrafiltration (UF), on its properties and the cheese-making process remain underexplored. This study aims to assess how UF affects (GSM) properties and the cheese production process, examining the changes that occur during UF and its influence on the resulting cheese.
2. Materials and Methods
2.1. Origin of Goat’s Milk
The raw milk was collected from a herd of 14 goats (local and crossbred Alpine and Damascene breeds) belonging to the Animal Husbandry and Wildlife Laboratory of the Institute of Arid Regions of Medenine, Tunisia. The goats were milked manually. The collected milk was stored in sterile cans and transported to the laboratory at 4 °C. After collecting 35 L of raw GM all fractions were cooled and homogenized.
2.2. Preparation of Milk for Ultrafiltration
The raw milk was brought to 45–50 °C in a water bath and it had been skimmed using a cream separator (Elecrem SCR, N°: S176265, TYPE: 125, 230 V 50/60 Hz 65 W, Fresnes, France) that yields skimmed milk and cream which contains the milk fat. This step prevents later clogging of the column during UF. The obtained skimmed milk was immediately pasteurized at 72 °C for 15 s, according to the protocol followed in the Food Technology Hall.
2.3. Ultrafiltration Assay
Pasteurized GSM was ultrafiltered at 55–60 °C by using an UF pilot (MP350B, Deltalab, Carcassone, France) provided with a ceramic tubular membrane (MEMBRALOX 1P19–40 GL, with 19 channels of 4 mm, area 0.24 m2, a cutoff threshold of 50 nm to 100 nm, Φ < 0.006 μm). The cross-flow membrane module was pre-treated with hot water, according to manufacturer’s instructions (MP350B/N°14), in order to avoid membrane compaction during UF operation.
The filtration unit was equipped with two 30 L stainless steel storage tanks, a feed pump/centrifugal pump (HILGE HYGIANA SUPER I-3 38/38/2.2/3 (2 m3/h under 5 bars) (2.2 kW—230/400 V tri—4.7 A), a circulation pump/centrifugal pump (HILGE EUROHYGIA BLOC I 38/38/2.2/2 (6 m3/h under 2.5 bars) (2.2 kW—230/400 V tri—4.55 A)), pressure gauges to monitor inlet and outlet pressure and flow-restriction valves to control transmembrane pressure.
The UF process starts with rinsing the membrane and fixing the various operating settings. The pressure at the inlet of the membrane is always greater than that of the output. At this stage, several parameters are fixed, such as the permeability of the membrane, the hydraulic resistance Rℎ and the permeate. The VRF, in turn, provides insight into both the performance of the process flux density J and TMP. This pressure is influenced by the feed rate; it varies from 2 to 8 bars according to [12] and the level of protein retention achieved by comparing the initial milk volume to the volume of the outgoing permeate. The transmembrane pressure was about 1 bar, with separate recovery of the permeate. The UF treatment was performed twice, depending on the level of concentration to be achieved.
2.4. Technical Characterization of Ultrafiltration Parameters
2.4.1. Transmembrane Pressure (TMP)
The TMP was determined as the average pressure in the pores of the membrane during tangential filtration. This measure is expressed by the following formula:
P1: liquid pressure at the module inlet in (Pa)
P0: retentate pressure at the module outlet in (Pa)
Pp: permeate outlet pressure in (Pa)
2.4.2. Flux Density (J)
The permeate flow rate was measured using a graduated container associated with a timer by using the following formula:
J: flux density (m3/s. m2 or in the usual unit l/h.m2);
Q: permeate flow rate (m3/s or in usual unit l/h);
S: surface of the membrane (m2).
Under the action of TMP, the solvent selectively transports solutes across the membrane. The solvent flux across the membrane is proportional to the transmembrane pressure according to Darcy’s law. Lp is defined as the hydraulic permeability that applies to all membranes.
Lp: hydraulic permeability (m/Pa.s or in usual unit l/h. m2.bar);
TMP: transmembrane pressure (Pa or in usual bar units).
In case of a porous membrane (in our case), Lp is no longer an intrinsic characteristic of the membrane because it depends on the solvent via the viscosity of the permeate which is a function of both temperature and fluid.
µwater: dynamic viscosity of water (Pa.s) at T = 20 °C;
TMP: transmembrane pressure in (Pa);
J: flux density (m/s);
Rh: hydraulic resistance of the membrane (m−1).
2.4.3. Volume Reduction Factor (VRF)
The VRF is the ratio of feed flow to retentate flow. This parameter was calculated using the following formula:
2.5. Physicochemical Analysis of GSM and UF-GSM Cheeses
The specific gravity of GSM was determined at 20 °C following the procedure described in ISO 2449 [13]. The pH and acidity were determined in accordance with AFNOR standards. The acid butyrometric Gerber method was used to determine the milk fat content. Meanwhile, the fat content of the GSM and UF-GSM cheeses was determined using the Soxhlet method as described in [14].
The protein content was determined via the Kjeldahl method according to the procedure described in ISO 8968-1 [15]. The ash content was determined by heating samples at 550 °C for 6 h. The resulting ash was dissolved in 1 mL of hydrochloric acid, transferred to a 50 mL volumetric flask and diluted to volume with ultrapure water. Mineral identification and quantification were then performed using an atomic absorption spectrophotometer (AA-6800, Atomic Absorption Spectrophotometer, Shimadzu, Kyoto, Japan).
Instrumental color assessment was performed using a chroma meter (Konica Minolta Chroma Meter CR-400/410 from Minolta Co., Ltd., Osaka, Japan). The CIE Lab color parameters (L*, a*, b*) were determined according to the guidelines of the International Commission on Illumination using illuminant D65 (standard daylight) for accurate measurements.
The total difference (∆E) in color between the GSM (designated with an index 0) and UF-GSM samples was the parameter considered for the overall color change evaluation, and was evaluated using the following formula:
2.6. Cheese Manufacturing
Two different types of cheese were produced in duplicate with three different doses of animal rennet (150, 200 and 300 µL). The cheeses were produced according to the general standard for cheeses CXS 283-1978. Different goat milks for the UF-GSM (VRF: 2.6) and GSM were pasteurized (63 °C, 30 min) and cooled in a water bath to 37 °C, followed by the addition of CaCl2 (0.2 g/L) and different doses of rennet. The mixture was incubated at room temperature (25 °C) until a curd was formed. The resulting gel was then carefully cut into cubes for further dehydration by syneresis. The curds were placed in perforated circular containers (approximately 250 g capacity) containing a cloth. The cheeses were stored at 4 °C for later analysis. The physicochemical and textural parameters were studied only for the cheese samples made with the highest amount of animal rennet (300 µL/L).
2.6.1. Cheese Yield
The milk and the resulting cheeses from the different categories were carefully weighed and the cheese yield was determined using the following calculation:
2.6.2. Texture Determination
Texture profile analysis (TPA) was performed using a TAXT2 texture analyzer (Lloyd Instruments, Fareham, UK) at 25 °C, as previously described [16]. Samples (control and UF cheese) were compressed at 50% of the original height (30 mm) using a cylindrical probe (25 mm diameter) at a speed of 40 mm/min. Texture parameters (strength, cohesion, tackiness and elasticity) were calculated using the texture software ‘Nexygen plot’ 4.15 version (Lloyd Instruments) connected to the instrument.
2.7. Statistical Analysis
Statistical analysis was performed using SPSS 20.0 (SPSS INC., Chicago, IL, USA) and an analysis of variance (ANOVA) was performed using Tukey’s test at a significance level of 0.05.
3. Results
3.1. Optimization of the Operational Parameters During UF Process
3.1.1. Transmembrane Pressure Evolution
The transmembrane pressure (TMP) was calculated based on the pressure differences across the filtration membrane as shown in Table 1. The liquid pressure at the module inlet was set at 1.5 bar, the permeate side pressure was set at 0.4 bar and the retentate pressure at the module outlet at 0 bar; the resulting TMP was determined to be 0.95 bar. This TMP value is the driving force behind the filtration process and represents the pressure gradient across the membrane. The calculated TMP of 0.95 bar shows a significant pressure difference, highlighting the effectiveness of this pressure configuration in facilitating solvent passage across the membrane for the UF process and confirming that the membrane is clean and ready to receive the product.

Table 1.
Optimization of ultrafiltration operation.
3.1.2. Milk Flow Density
As shown in Table 1, an investigation of flux density using GSM sheds light on the intricate relationship between permeate flow, membrane surface area and the effect of TMP. The measurement of the permeate flow rate using a graduated vessel in conjunction with a timer showed that GSM selectively transported solutes across the membrane under the influence of TMP. This phenomenon correlated directly with the pressure gradient, as indicated by Darcy’s law, highlighting the dependence of solute flux on applied pressure. The study showed that GSM crossed the membrane proportionally to the applied pressure, significantly influencing the overall flow dynamics. However, this effect was found to be transient, as an increase in transmembrane pressure initially maintained flow and increased solute transport. Subsequently, an escalation in product concentration contributed to clogging phenomena, manifested as the accumulation of retained solutes in a confined liquid layer near the membrane, leading to potential membrane blockage.
3.1.3. Hydraulic Resistance to the Flow of Milk (Rh)
Assessment of Rh (Table 1) provides critical insight into the membrane’s ability to facilitate fluid transfer, particularly in the context of milk filtration. Measuring Rh with water allows an assessment of the condition of the membrane in terms of water transfer and helps to identify any residual substances after washing. Essentially, Rh is the inverse of the water permeability of the membrane and serves as a metric to measure the resistance of the membrane to fluid flow. This characterization not only verifies the performance of the membrane but also identifies any residual elements that may affect subsequent filtration processes.
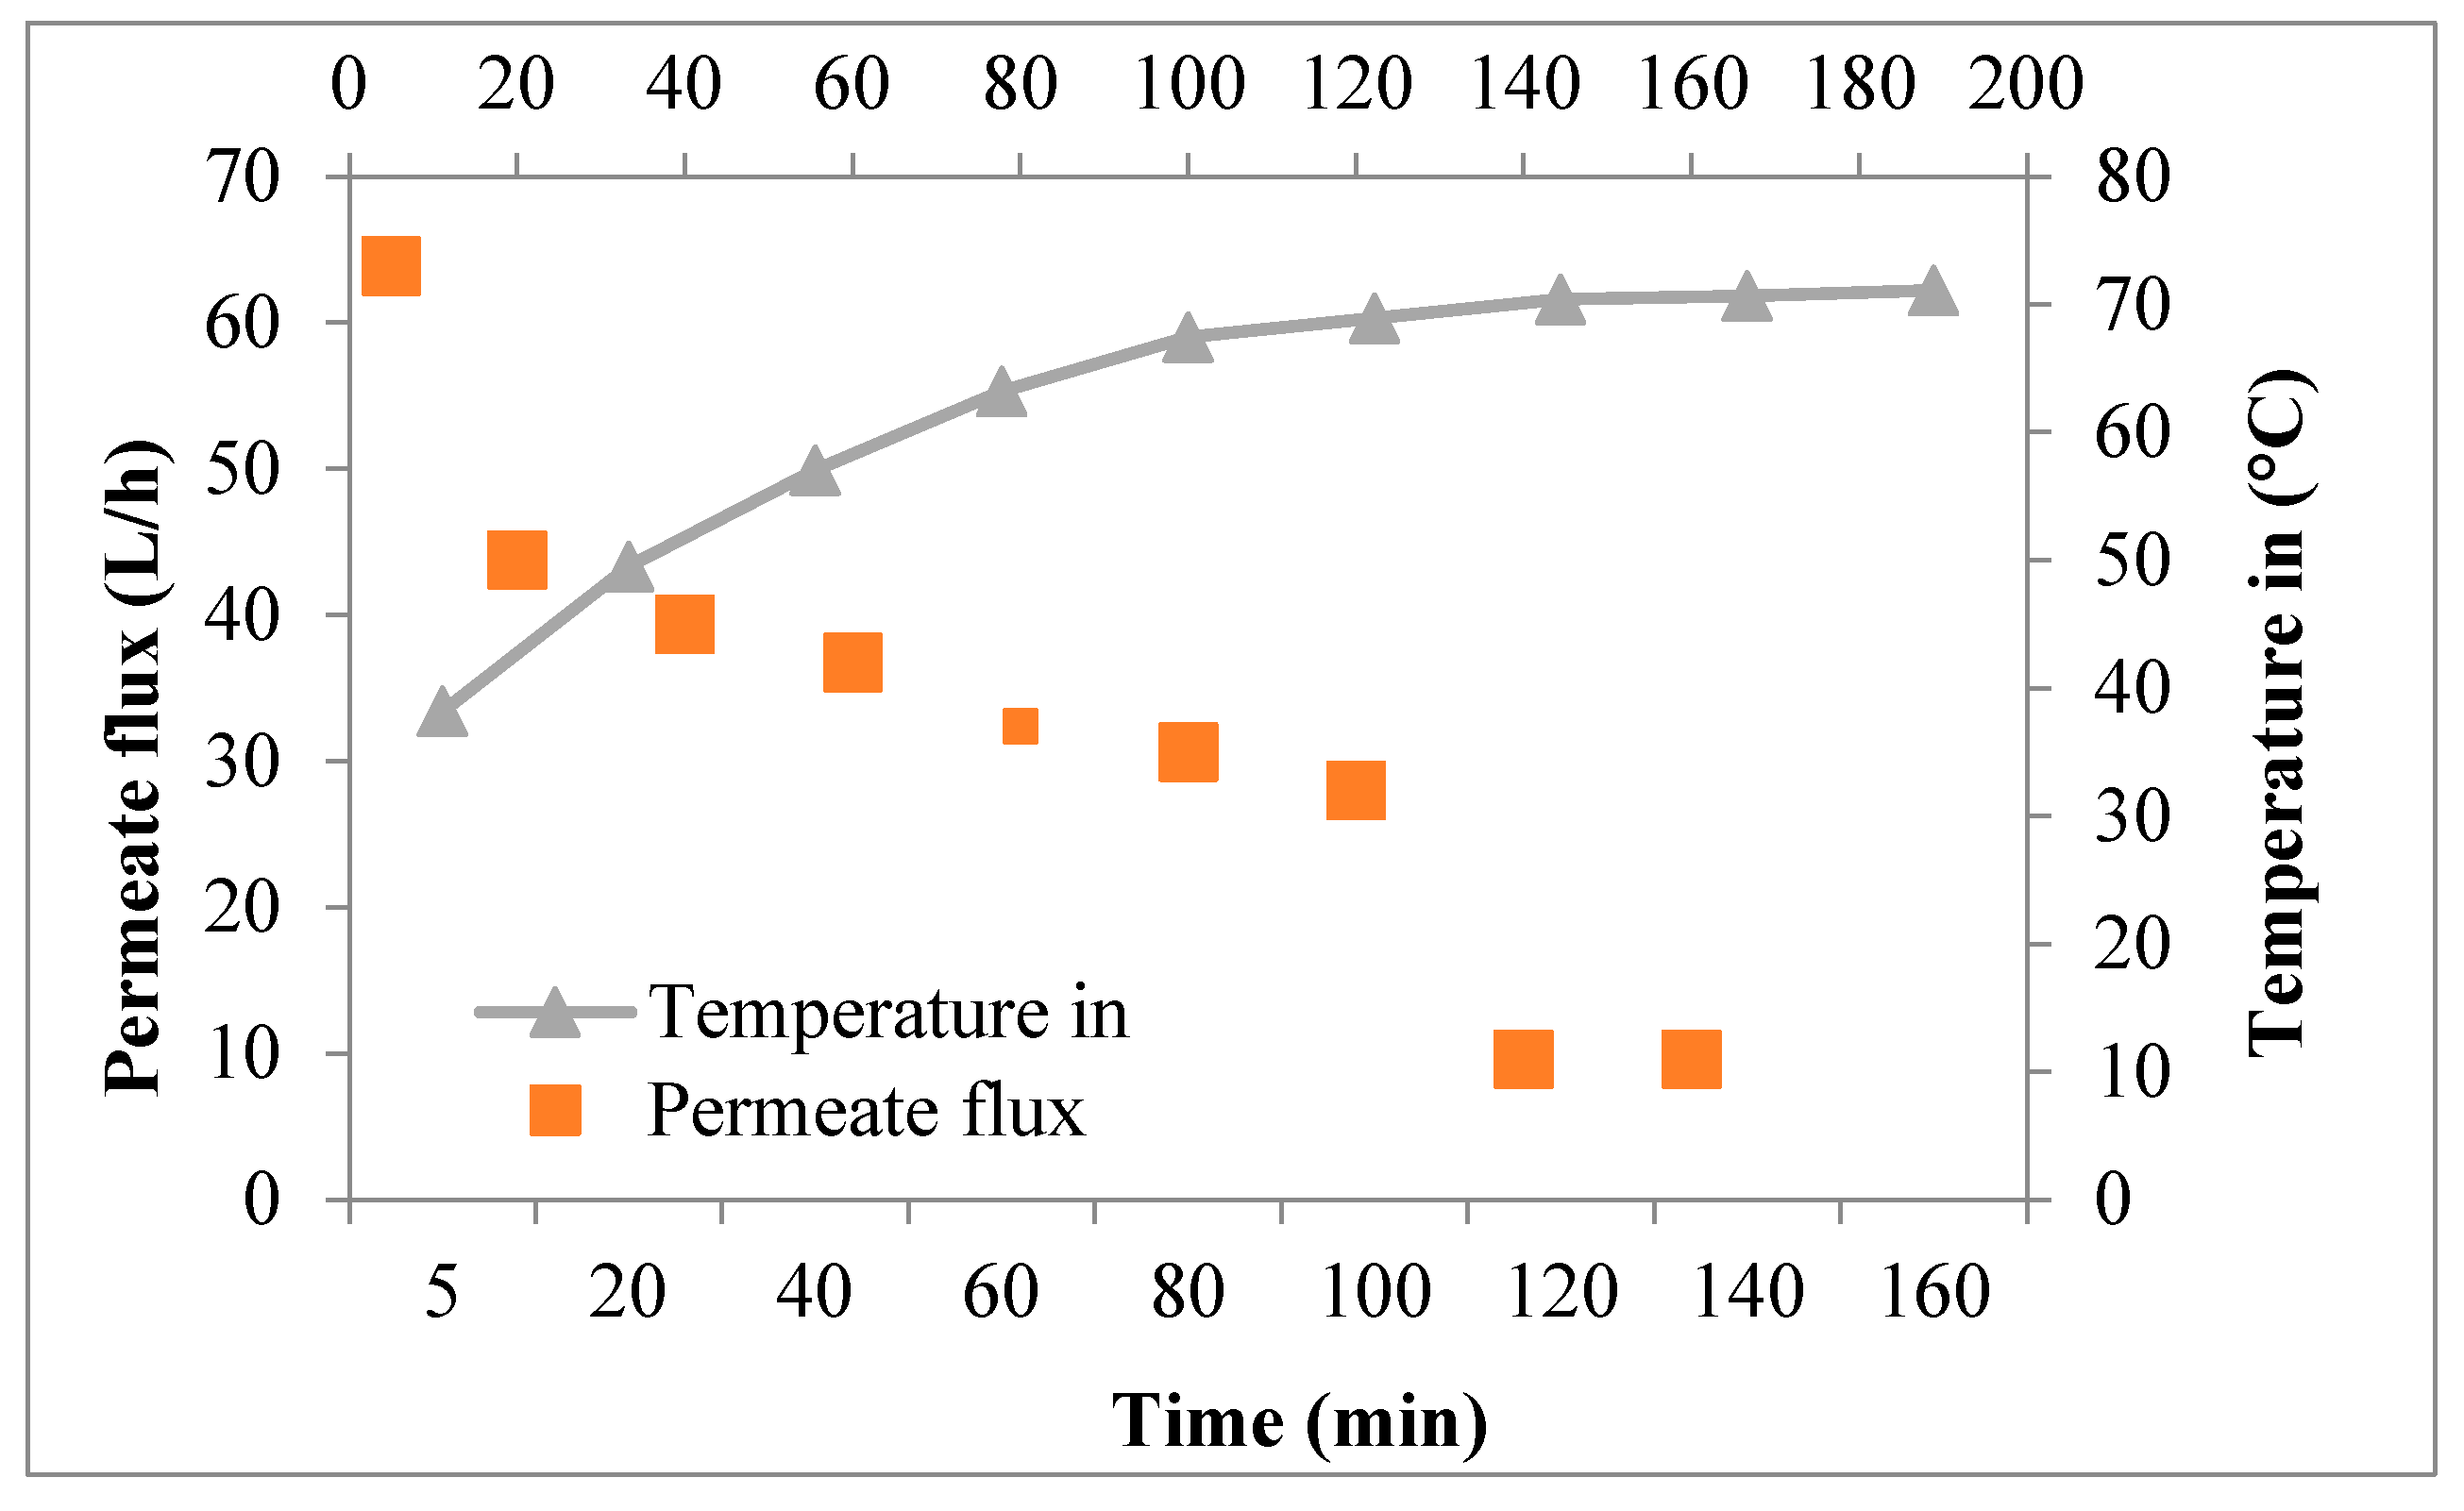
3.1.4. Evolution of Temperature and Permeate Flux
Figure 1 shows a process over 160 min, tracking temperature and permeate flux. Over time, the temperature rises steadily from 33.4 °C at 5 min to 62.2 °C at 160 min. However, the permeate flux, which starts relatively high at 73 L/h, gradually decreases. There is a noticeable correlation between temperature and permeate flux, indicating a negative relationship: as the temperature increases, the permeate flux decreases. A notable drop occurs around the 60 min mark where, despite a modest increase in temperature, the flux drops significantly from 42 L/h to 11 L/h at 140 and 160 min, respectively. This trend suggests a threshold beyond which further temperature increases could negatively affect flux. In addition, there is a consistent decrease in permeate flux throughout the duration, suggesting that factors other than temperature may be contributing to this decrease.

Figure 1.
Evolution of temperature and permeate flux over 160 min.
3.1.5. Evolution of VRF and GSM Permeate Volume
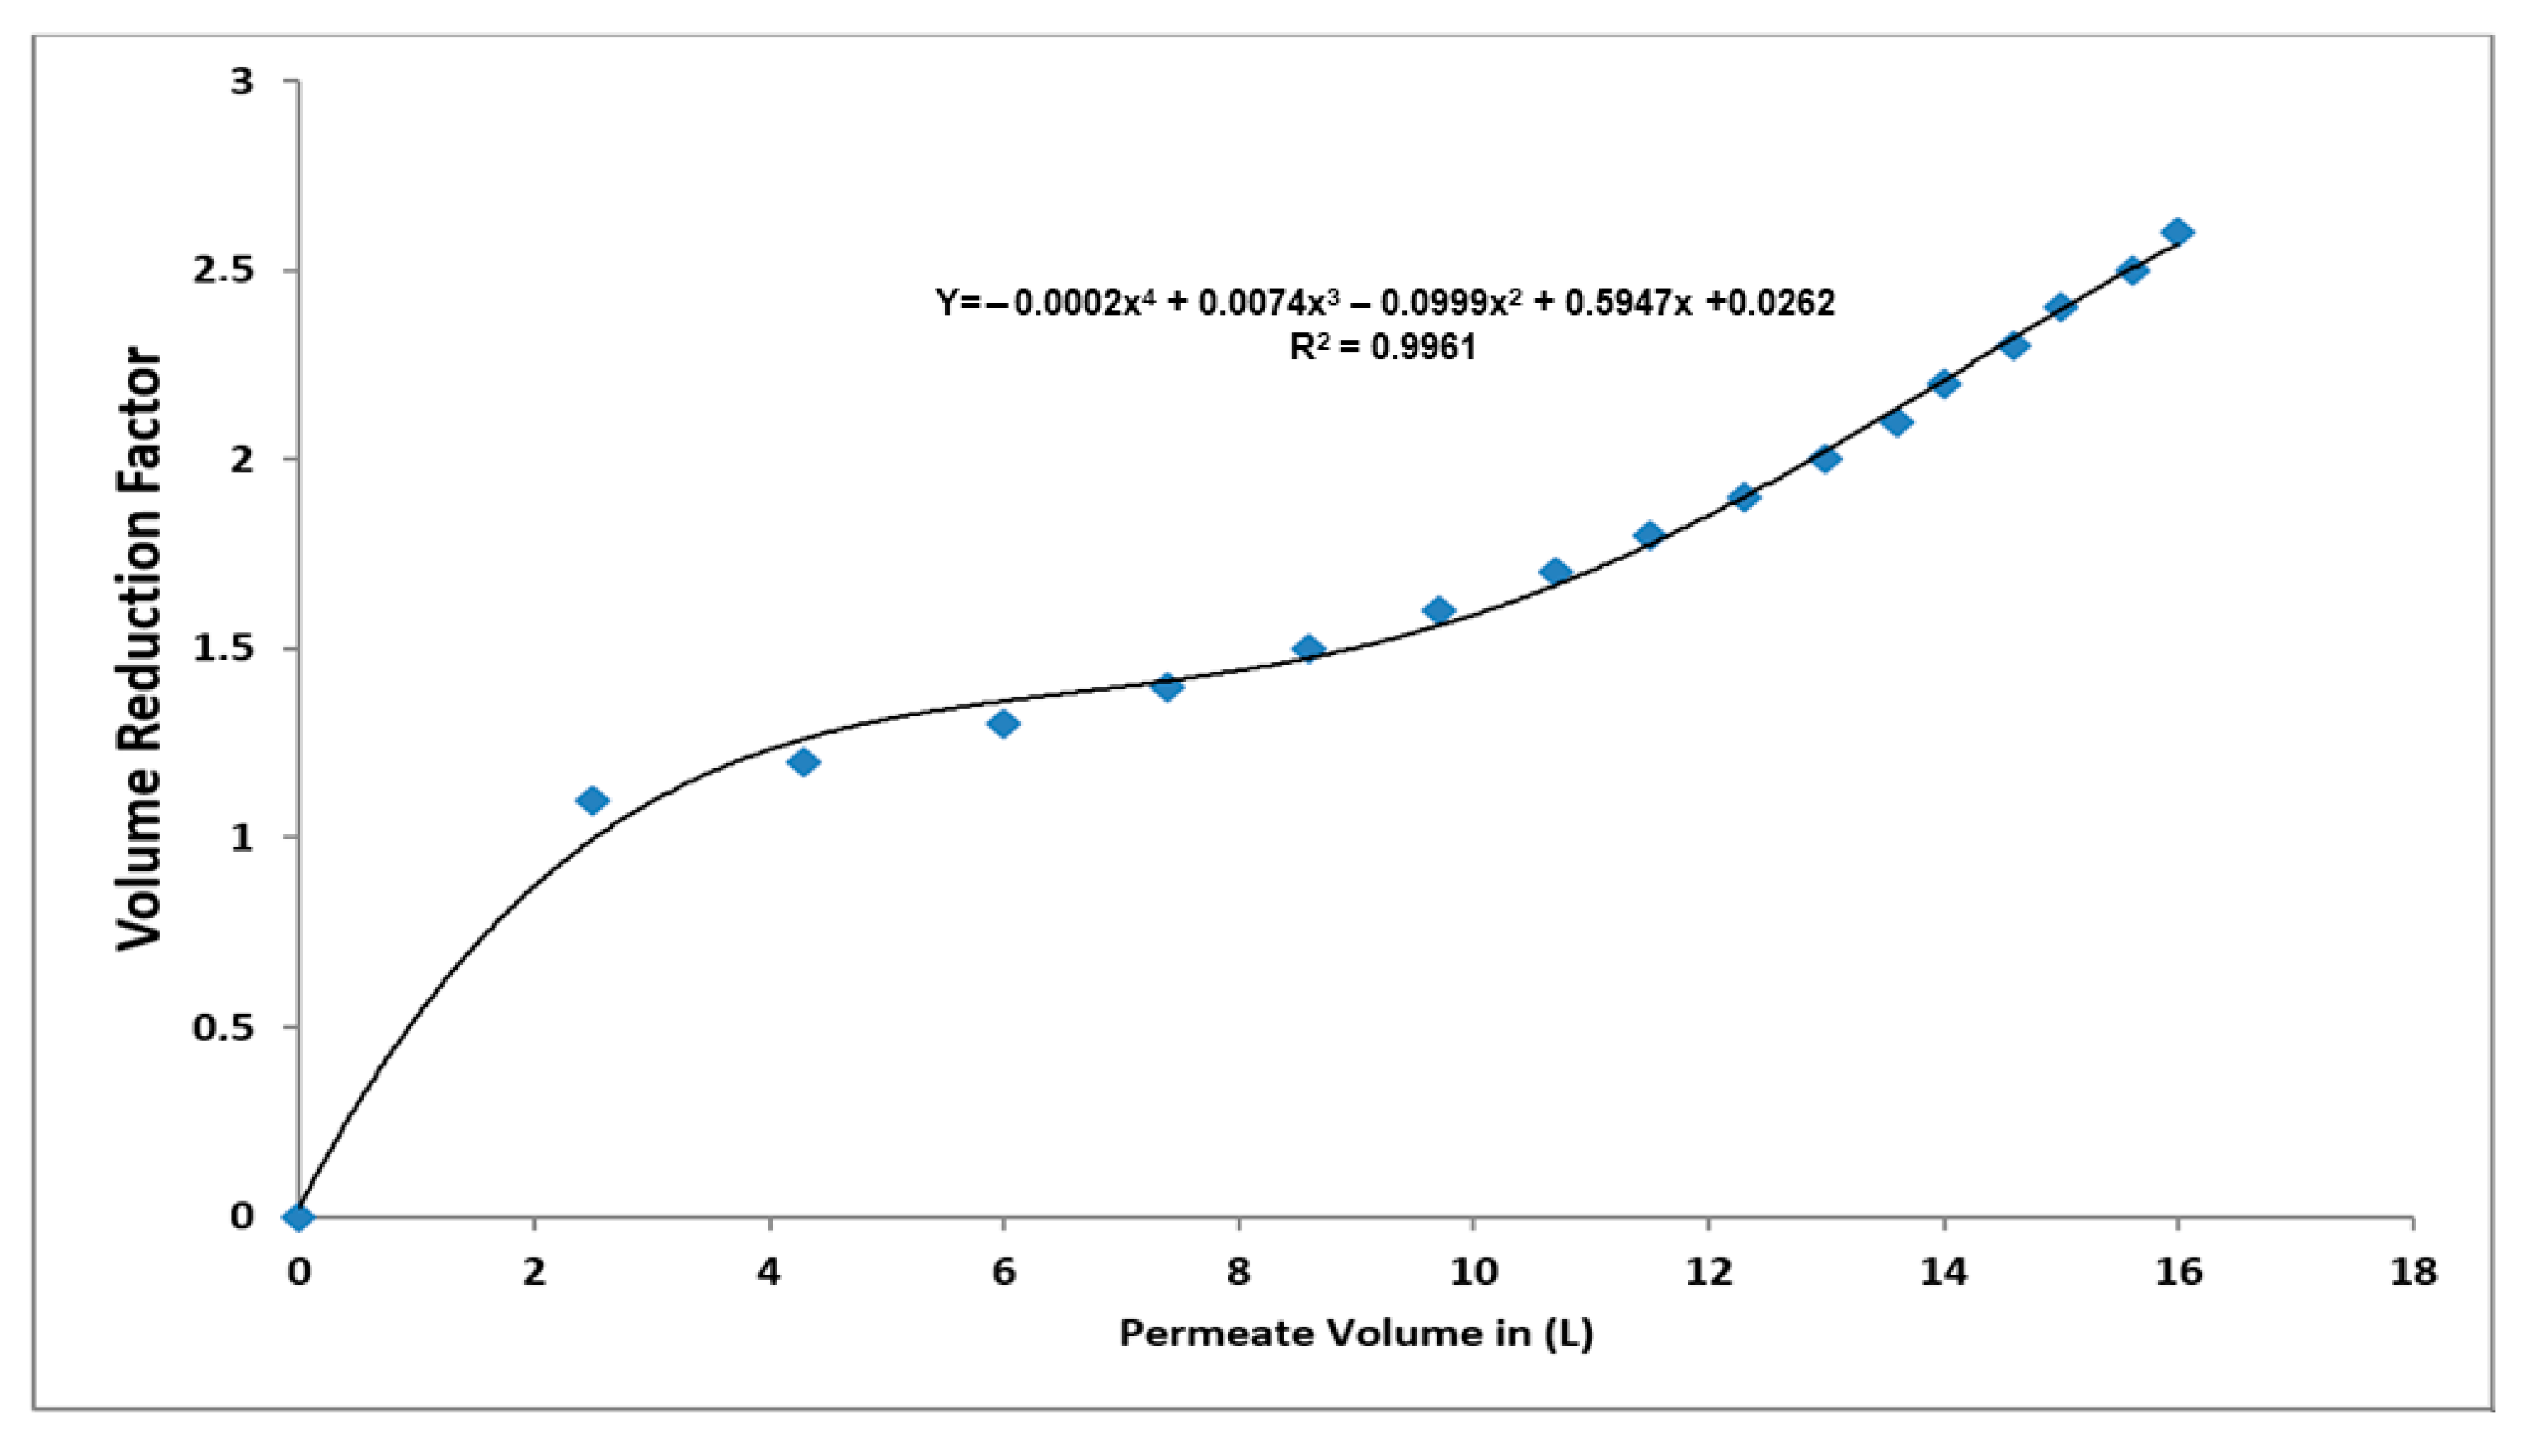
The results showing the VRF values and the resulting permeate volume are presented in Figure 2. Overall, it was observed that there was a direct correlation between VRF and the volume of milk permeate. The VRF values generally increased with increasing milk permeate volume, indicating increased milk concentration. This relationship means that higher VRF values correspond to more efficient concentrations, resulting in greater milk permeate production. The linear increase in permeate volume up to 16 L at a VRF of 2.6 underlines the importance of concentration factors in maximizing milk permeate yield and establishes a clear and direct relationship between VRF values and the resulting permeate volume.

Figure 2.
Correlation between VRF and milk permeate volume.
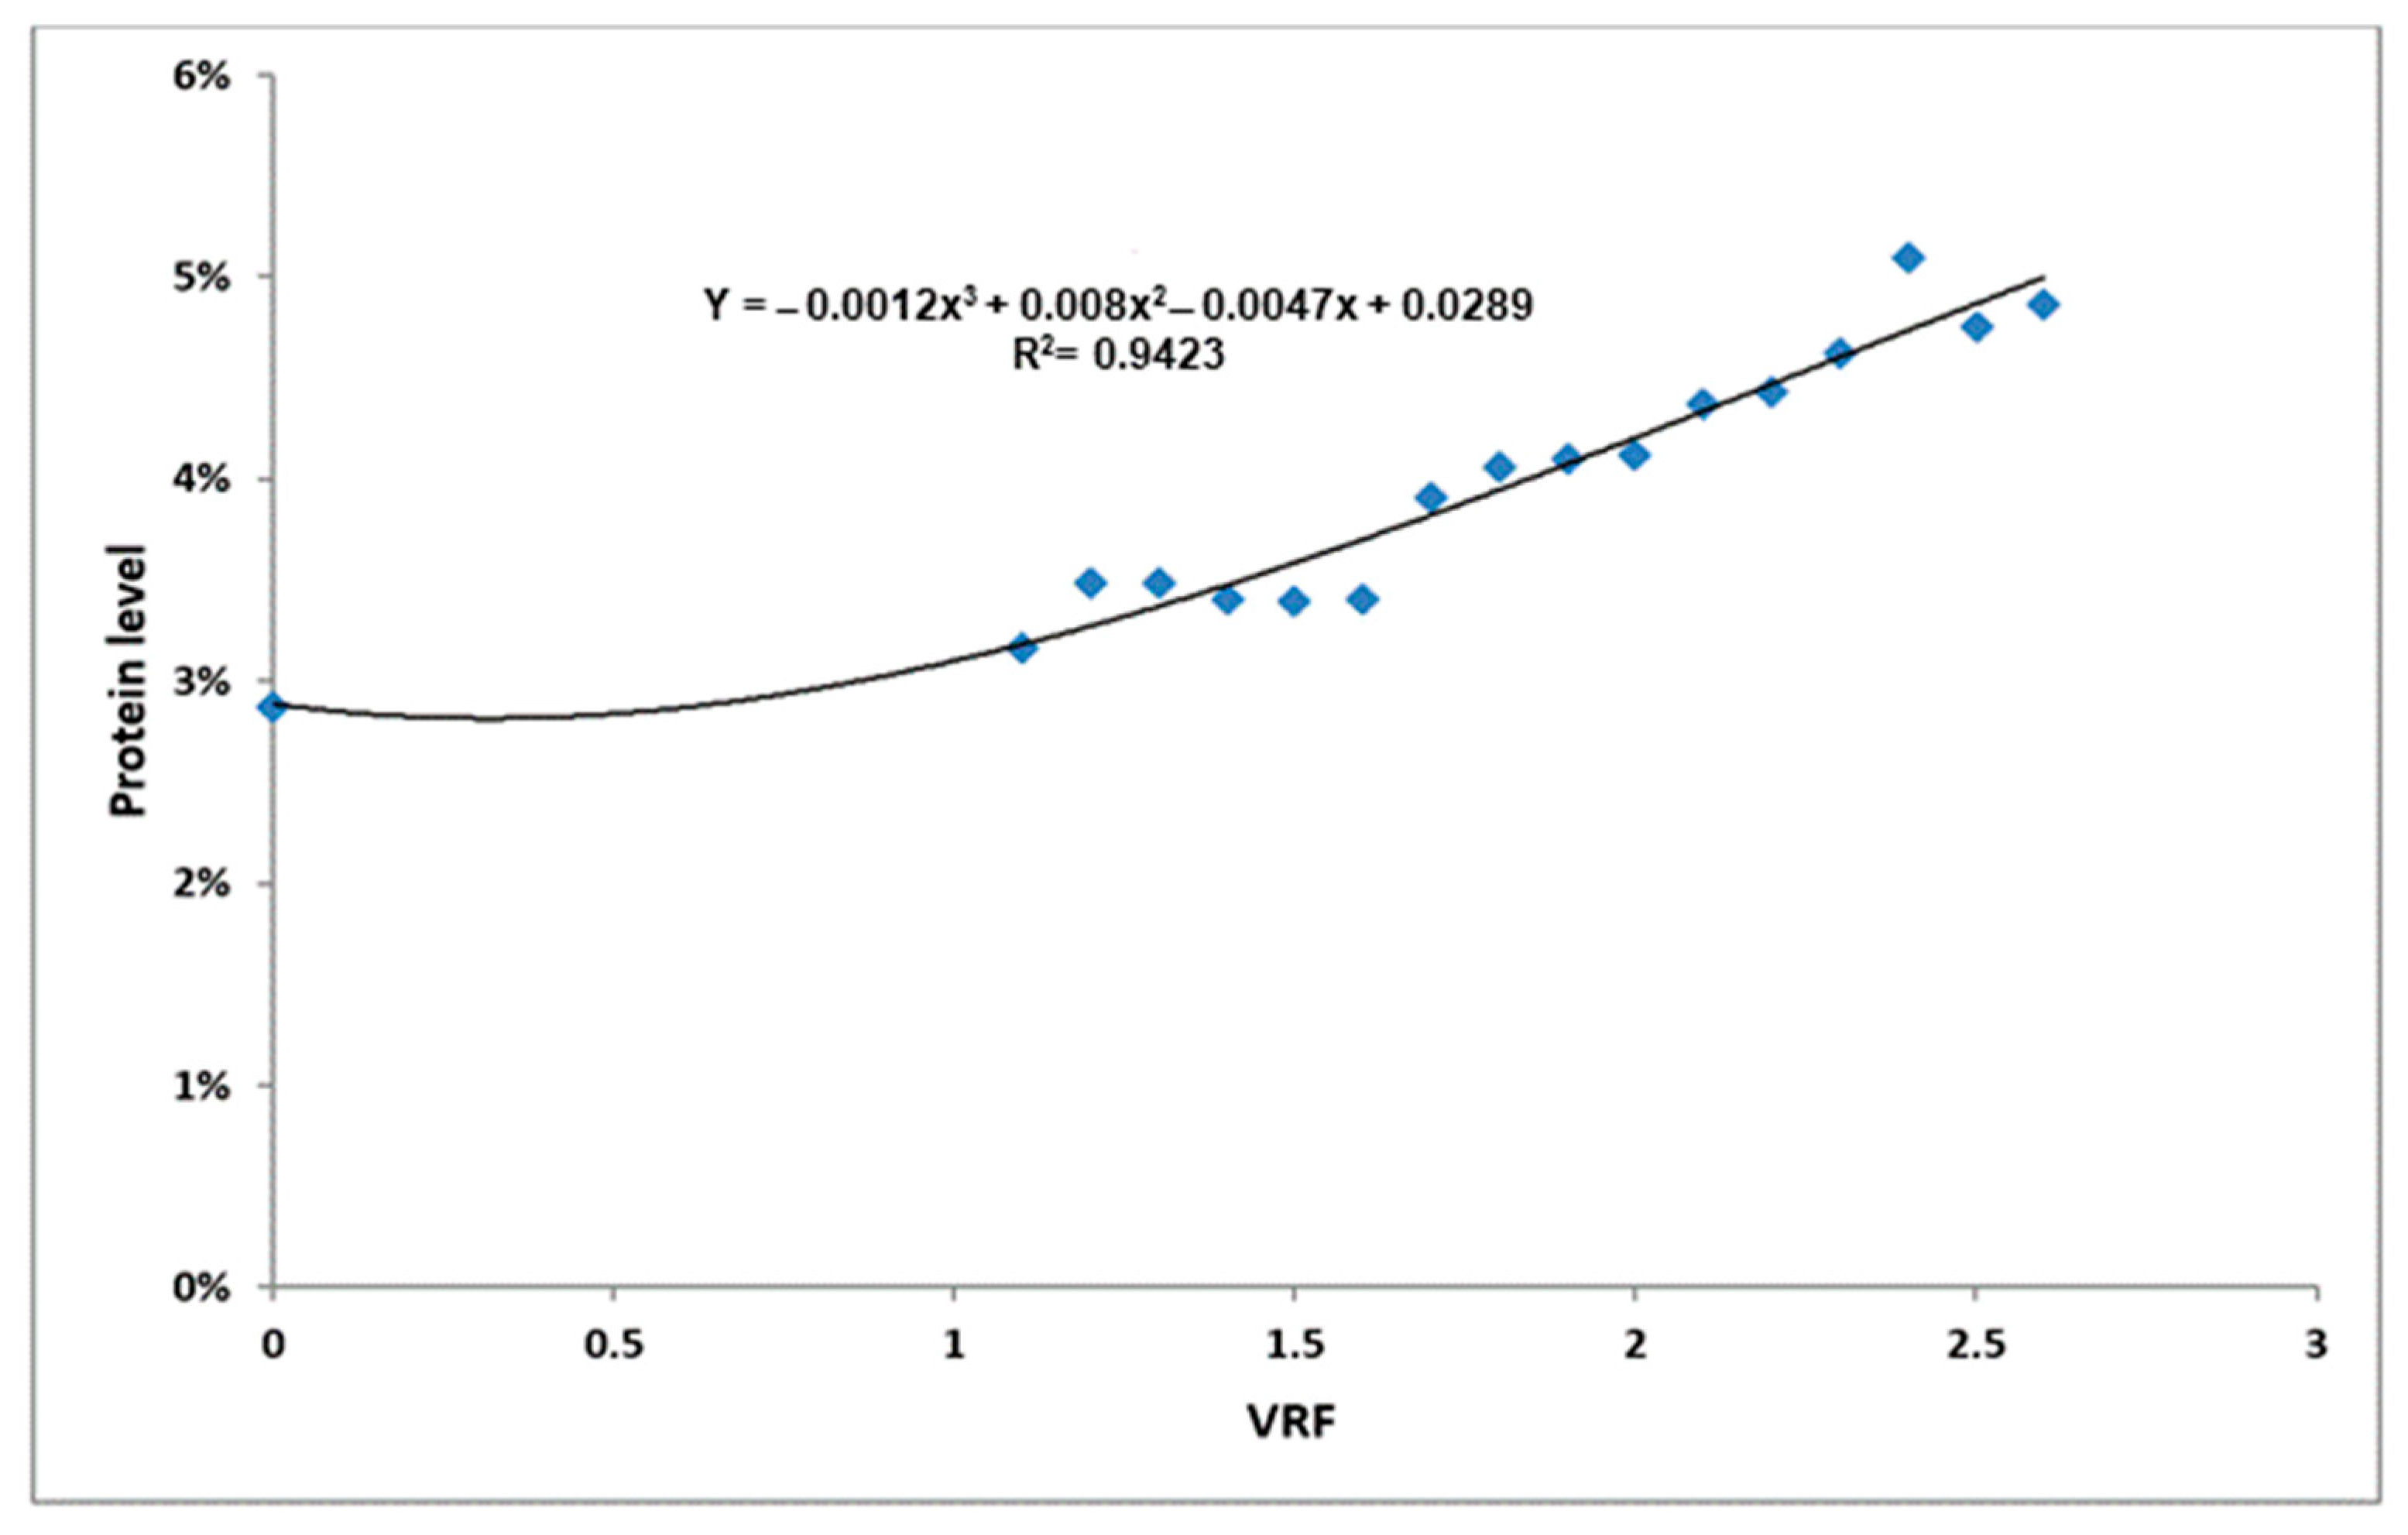
3.1.6. Effect of Volume Concentration Factor on Protein Content of GSM
Figure 3 represents a relationship between the VRF and the protein content of the GSM. The VRF, which ranges from 0 to 2.6, appears to represent a treatment or concentration process applied to the milk. The protein content in the milk shows non-linear fluctuations, starting at 2.88% at VRF 0 and peaking at 5.10% at VRF 2.4. Interestingly, an initial increase in VRF does not result in a consistent increase in protein content until around VRF 1.8, after which a more noticeable increase becomes apparent. This suggests a possible threshold effect, indicating an optimized range of VRF values (around 1.7 to 2.6) where treatment has a significant effect on protein concentration. Despite fluctuations, protein content stabilized within a range of 3.39% to 5.10% at higher VRF values.
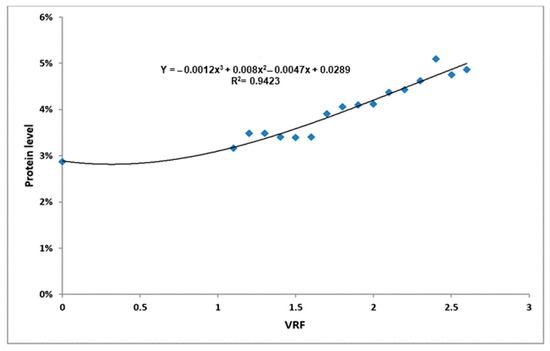
Figure 3.
Relationship between VRF and GSM protein content.
3.2. Physicochemical Parameters of GSM During Ultrafiltration and Effect of Volume Reduction Factors
Table 2 shows the changes in the physicochemical properties of GSM at different VRFs during UF. GSM’s density remains stable across all stages, indicating a minimal effect of UF. However, the pH values of GSM gradually decreased from 6.46 (VRF 0) to 5.44 (VRF 2.6), indicating increased acidity as filtration progresses (21.25–35 °D, at VRF 0–2.6). At the same time, the viscosity increased from 3.62 to 4.70 cP (VRF 0–2.6), indicating increased thickness and resistance to flow. These results showed that as the VRF increases, there are changes in the characteristics of GSM. The observed decrease in pH with a simultaneous increase in acidity (°D) and viscosity suggests a progressive concentration of GSM constituents during UF. This concentration process probably leads to more acidic and viscous milk with an increased resistance to flow. Observations showed a significant increase in dry extract, protein and ash as VRF escalates, indicating a concentration effect caused by UF. Dry extract increases from 7.73% to 8.47% at VRFs between 0 and 2.6, while proteins increase from 3.14% to 4.86% over the same ultrafiltration stage.
Table 2.
Variation of physicochemical properties of GSM during ultrafiltration (UF) process in relation to VRF.
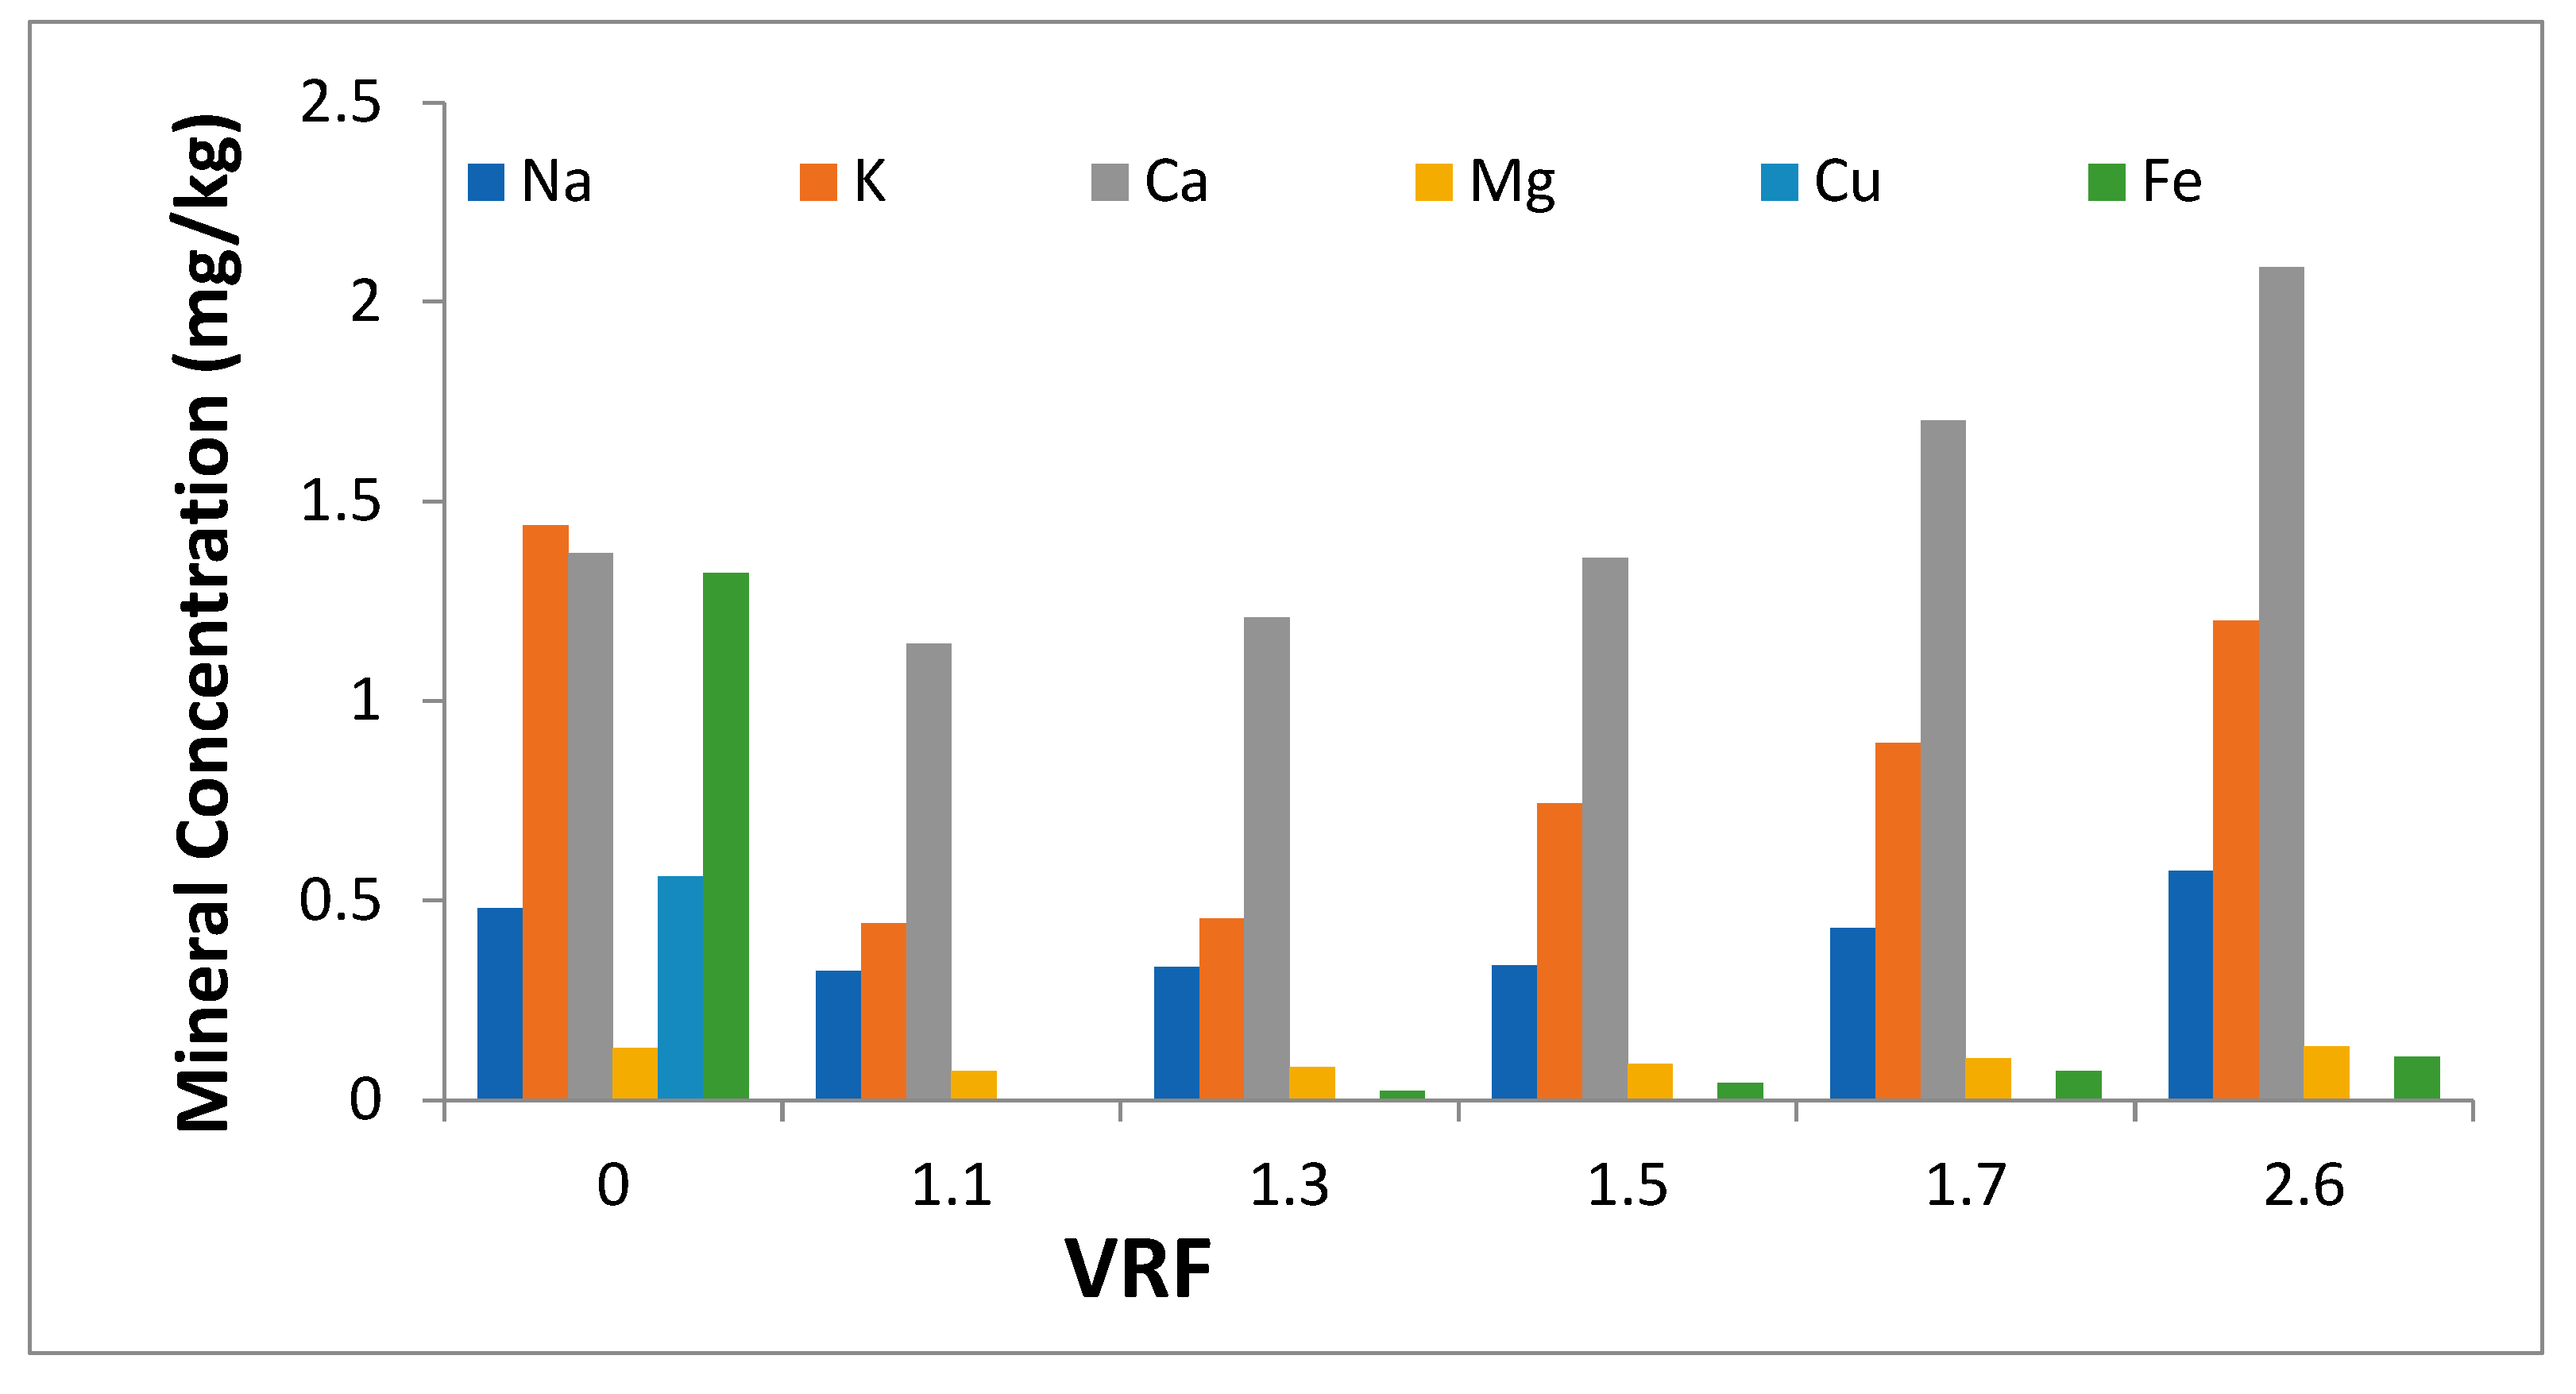
3.3. Evolution of Mineral Levels in GSM During Ultrafiltration
Figure 4 shows the evolution of the mineral concentration in GSM during UF. It shows that the mineral contents increase under the effect of UF, especially calcium, potassium and sodium. However, the disappearance of copper was noted, which could have occurred during heat treatments preceding UF. The iron level also increased slightly while remaining lower than that of raw goat’s milk. However, the magnesium content remains low, unaffected by UF.

Figure 4.
Mineral contents in ultrafiltered GSM (UF-GSM) and GSM for VRF of zero (Na: Sodium, K: Potassium, Ca: Calcium, Mg: Magnesium, Cu: Copper, Fe: Iron).
3.4. Colorimetric Analysis of GSM
Table 3 presents the colorimetric variation of GSM during UF. The L*, a* and b* values correspond to different aspects of color perception. A higher value in the L* coordinate was attributed to GSM (66.45) compared to UF-GSM (55), indicating a reduction in lightness after UF. The GSM possessed a more negative a* value (−2.74) and more yellowness (b* = 13.13) than UF-GSM (a* = −1.39; b* = 8.94), indicating a shift towards less greenness and a decrease in yellowness in the UF-GSM.
Table 3.
Evolution of colorimetric parameters GSM and ultrafiltered GSM (UF-GSM).
A higher ΔE value, which represents the total color difference, indicates greater dissimilarity. The substantial difference in ΔE (61.8 for raw GSM and 42.95 for UF-GSM) indicates a significant change in overall color between GSM and UF-GSM. These results confirm that UF appears to affect the GSM color, resulting in a decrease in brightness, yellowness and a shift away from green, reflecting notable changes in the perceived color attributes between GSM and UF-GSM.
3.5. Effect of Ultrafiltration on GSM Cheese-Making Properties
3.5.1. Effect on Cheese Yield
The effect of different rennet amounts on cheese production using two types of milk, UF-GSM and GSM, was evaluated. Higher rennet doses (200 µL/L and 300 µL/L) consistently produced greater cheese yields than the lowest dose (150 µL/L) in both milk types. In particular, with UF-GSM, the yield peaks at 27% at 200 µL/L and reaches 30% at 300 µL/L, in contrast to the maximum yield of 18% with GSM regardless of dose. Coagulation time remains relatively stable at around 2 min for both GSM and UF-GSM, but a slight reduction is observed at the 200 µL/L dose compared to 150 µL/L, suggesting potential efficiency gains with higher rennet concentrations in the cheese-making process.
3.5.2. Effect on Physicochemical and Textural Parameters
The physicochemical characteristics, mineral composition and textural properties of the cheeses made with 300 µL/L of animal rennet are shown in Table 4. The evaluation of colorimetric parameters including L*, a*, b* and ΔE values represented marginal differences between the cheeses; UF-GSM cheese has a slightly higher lightness (L*) than the control, indicating a slightly lighter appearance after UF, but this difference in the value of the L* parameter between the cheeses was not significant. Both cheeses show similar values for a* (redness/greenness) and b* (yellowness/blueness), suggesting minimal variation in these color aspects. The ΔE values, which reflect the overall color difference, showed a subtle increase from the control to the UF-GSM cheese, indicating little overall color variation between the two cheeses. Overall, although UF-GSM cheese has a slightly lighter appearance, the color differences between the cheeses remain relatively small, suggesting consistent color attributes with minimal perceptible changes after UF.
Table 4.
Comparison of physicochemical, mineral composition and textural properties of control and UF-GSM cheese.
Moreover, due to the concentration process, the protein, dry matter and ash contents were much higher in the UF-GSM cheeses (12.4%, 15.12% and 1.85%, respectively) than that observed for the control (10.6%, 11.23% and 1.10%, respectively). The drop in pH (~5.37 for UF cheese vs. ~6.62 for the control) and acidity values (~72.50 °D for UF cheese vs. ~43 °D for the control) indicated an improvement in the milk acidification during the UF process. Overall, UF causes significant compositional changes in GSM, concentrating proteins and non-water components while increasing acidity and altering pH, resulting in distinct characteristics between the two types of cheese.
The cheese texture analysis, as shown in Table 4, highlighted distinct differences between the UF-GSM cheese and the control. It distinguishes itself by having relatively lower hardness and adhesion. Conversely, the dough from UF-GSM cheese demonstrates a softer, lumpier texture with higher particle cohesion, which effectively prevents the cheese from becoming overly crumbly.
Table 4 showed the main milk minerals retained in the cheeses (the control and UF-GSM cheese). Cheese made with UF-GSM is about six times richer in calcium and potassium than that produced with GSM (the control). However, magnesium and iron are found in trace amounts after the transformation of milk into cheese. Copper, in turn, is always absent. In cheese, the levels of calcium, potassium and sodium retain their levels found in UF-GSM.
4. Discussion
This study was focused on the calculation of the TMP as a crucial parameter influencing filtration efficiency. The obtained TMP of 0.95 bar represented a remarkable pressure variance, indicating the effectiveness of the established pressure configuration in facilitating solvent passage across the membrane during UF. It also validated the cleanliness of the membrane, confirming its readiness to receive the product. Comparative analysis with the existing literature showed slight discrepancies. The calculated TMP of 0.95 bar is slightly lower than the reported value of 0.98 bar for GSM [4]. However, this variance confirms the cleanliness of the membrane and its suitability for product reception, as it closely matches the reported TMP values for similar milk types. On the other hand, our study provides a comprehensive investigation of the dynamics of permeate flow using GSM, revealing the intricate interplay between membrane surface area, TMP and solute transport. The investigation, using a graduated vessel and timer, demonstrates how GSM selectively transports solutes across the membrane under the influence of the TMP. This transport showed a direct correlation with the pressure gradient, confirming the relevance of Darcy’s law and the direct relationship between solute flux and applied pressure [17]. Temperature proved to be a key factor in this process, with an increase to 60 °C improving retentate flux by reducing viscosity without denaturing soluble proteins and vitamins. However, prolonged operation beyond three hours resulted in the gradual deposition of insoluble calcium phosphate. This compound, associated with casein micelles and phospho-serine or colloidal calcium phosphate, led to significant membrane blockage, encouraging the use of a collimator system. The observations are consistent with previous findings by Gavazzi-April et al. [18], highlighting the dependence of permeate flow on membrane permeation characteristics, including surface area and porosity. Indeed, our results highlighted the complex nature of pressure-driven solute transport in UF-GSM, emphasizing the transient effects of pressure and temperature.
The assessment of Rh in milk filtration is a key indicator of a membrane’s effectiveness at facilitating liquid transfer. Measuring Rh with water not only assesses the water transfer capacity of the membrane but also helps to detect any residual substances after washing. This characterization not only validated the performance of the membrane but also identified any residual elements that may interfere with subsequent filtration processes. In line with the previous findings of Lu et al. [19], the recorded Rh value of 6.77 × 10¹³ m−1 denotes the hydraulic resistance of the membrane in the absence of solutes. This parameter depends in a complex manner on various membrane factors such as porosity, thickness, mean pore diameter and the viscosity of the solvent (water) at the filtration temperature. The Rh value obtained in the present study, although slightly lower, is in the same order of magnitude (1013 m−1) as the value mentioned in the literature [20,21]. This alignment indicates a consistent trend in the hydraulic resistance of the membrane, further underlining its performance consistency, albeit with a slight deviation from the established values. Furthermore, understanding and monitoring hydraulic resistance not only validates membrane performance but also helps identify potential factors that could affect subsequent filtration processes. It acts as a critical quality check to ensure consistent and optimal membrane performance, thereby safeguarding the integrity and efficiency of milk filtration processes [22].
In this study, on the other hand, we focused on the VRF in membrane filtration, which plays a pivotal role in the concentration of the permeate and, consequently, in the concentration of certain components in milk, particularly the protein content. As the permeate volume expands via mechanical separation within the porous membrane, the VRF increases proportionally, reaching values of 2.5 for milk in general [9] and even up to a concentration factor of 4 in cow’s milk [12]. The relationship between the VRF and permeate volume obeys a polynomial law of order 4, providing a theoretical framework for predicting their correlation. In particular, the effect of the volume concentration factor on protein levels shows that the optimum range of VRF values is between 2.3 and 2.6. Within this range, the level of protein concentration remains optimal, constrained by the inherent physicochemical properties of milk and the operational capacity of the membrane to prevent clogging. Previously, the importance of balancing energy consumption while achieving the desired protein concentration levels, emphasizing the complex interplay between VRF, membrane performance and milk properties in optimizing protein concentration during membrane filtration processes was underlined [23].
The physicochemical transformation of GSM during UF assessment in our study reveals interesting changes at different VRFs. The density values for all samples were within the typical range for bovine milk [24], although slightly higher values have been reported for GSM in previous studies [25]. In particular, the density values differed between non-ultrafiltered and UF-GSM samples, with the UF ones having the highest density due to the concentration of GSM constituents. The decrease in pH, accompanied by a significant increase in acidity due to the concentration of casein micelles and soluble proteins during UF, placed the average pH values of all milk samples below the typical range for GSM, as reported by Sotillo and Méndez [24]. Furthermore, the acidity in UF-GSM exceeded that reported for GSM [26] and raw cow’s milk [27], demonstrating the profound effect of UF on milk properties. The milk viscosity showed a direct correlation with VRFs, with a 23% increase at VRF 2.6 compared to GSM. This increase in viscosity highlighted the condensing effect of UF on milk properties, emphasizing its thicker consistency and increased resistance to flow. A possible explanation of the viscosity increase is the increase in casein micelles, appearing as hard spheres at lower or moderate protein concentrations of less than 15% [28].
The dynamic changes observed in the composition of GSM during UF provide interesting insights into the effects of the process on the various components. This study showed a clear progression in the composition of the retentate as VRF increases. The gradual increase in dry matter and protein contents underlines the concentration effect achieved by filtration. This observed behavior was coupled with a reduction in the fat content to 0.16%. This targeted modification of GSM constituents held promise for a variety of applications in industries dependent on specific milk constituents for their products [29]. Thus, in the dairy industry itself, such modifications enable the production of specialized dairy products with improved nutritional profiles. For example, the concentration of proteins and essential nutrients through UF can lead to the creation of protein-rich dairy products or fortified dairy products for health-conscious consumers [30]. While the observed reduction in fat content is intriguing, the reappearance of a low fat content at the end of the process, possibly due to the phenomenon of bursting and the behavior of certain milk lipids, needs to be investigated. As suggested by Kuzdzal-Savoie and Moal [31], the escape of a fraction of fat globules due to mechanical skimming sheds light on the complexities of GSM composition and separation techniques. Changes in mineral concentration in GSM during UF provide valuable insights into the alteration of mineral profiles during this process, with the notable increase in minerals such as calcium, potassium and sodium suggesting a concentration effect facilitated by UF. The marginal increase in iron, although still lower than in GSM, suggests the complex behavior of minerals during UF. On the other hand, the low and constant levels of magnesium throughout the process suggest a resistance to alteration by UF. In this context, Moreno-Montoro et al. [3] elucidate variations in calcium and magnesium concentrations, particularly in UF samples, showing that higher mineral levels in UF-GSM cheese are due to their binding to caseins, resulting in increased concentrations when caseins are concentrated via UF. The change in mineral distribution during UF of GSM, with a reduction in the percentages of calcium and magnesium bound to protein, suggests a reconfiguration of mineral distribution due to the process [32].
A significant decrease in brightness and yellowness and a shift away from green in UF-GSM compared to the GSM variant was observed. Similar observations were previously reported by Milovanovic et al. and Lucas et al. [33,34], who found interesting parallels between the color of GSM and deer milk, particularly in terms of brightness. In addition, the central role of carotenoids in GSM coloration has been previously described, in particular the effect of the β-carotene in milk on its a* and b* parameters. These observations can be linked to thermal processes that affect the protein structures and, consequently, the brightness of the GSM [33]. The effect of different rennet doses on cheese production using GSM and UF-GSM reveals interesting trends in cheese yield. Higher rennet doses consistently lead to increased cheese production in both milk types. UF-GSM shows a remarkable increase in cheese yield compared to GSM across all rennet doses. When comparing the yields obtained with those in the literature for GSM (15.7% to 33.1%), it is important to consider the reduction in GSM volume due to ultrafiltration [35]. Cheese yield is affected by GSM composition, especially the concentration and types of caseins, fat, pH and calcium [36]. Given that the UF-GSM used in this study had a very low fat content, it appears that the improvement in yield is primarily due to the higher casein content resulting from the UF process, which enhanced casein recovery. Moreover, these membranes permit the retention of the main whey proteins, which include β-lactoglobulin and α-lactalbumin [37]. In fact, it was proposed that the addition of whey proteins to casein micelle gels would increase the yield of cheese [13]. The low pH value of UF-GSM significantly enhanced cheese yield, as its pH before coagulation of 5.44 was optimal for uniform acidification. This condition prevented localized and isoelectric casein aggregation, while also increasing the surface charge of casein micelles, which thickened the solvation shell and improved inter-micellar interactions. The results obtained in the current study underlined the significant influence of UF on cheese texture by modifying the micellar structure and altering the interactions between its components. Deviations in textural characteristics from conventionally produced cheeses made from GSM highlight the complex relationship between processing methods and the resulting textural characteristics in cheese production. The observed divergence in texture between UF-GSM cheeses and conventionally produced GSM cheese can be explained by the instability of caseins during the UF process. This process alters the surface charges of the caseins, inducing repulsion between the components and contributing to the softer, lumpier texture with increased particle cohesion in the UF-GSM cheese [38].
In addition, UF leads to a reduction in micelle hydration due to the extraction of the aqueous phase. This reduction affects the structural integrity and interactions within the cheese matrix. In particular, the initial water binding by κ-caseins, which provides a protective shell against negative charges and hydrophilicity, is compromised, resulting in the reduced adhesion observed in UF-GSM cheeses [39].
The comparison of L*, a* and b* values and ΔE between the two cheeses showed marginal variations, indicating relatively consistent color profiles despite the UF process. In comparison, the observations of Milovanovic et al. [33] highlight the particularly intense white color of GSM cheese, characterized by an average luminance (L*) of 87.1 ± 14.8, which is significantly higher than in our results. This discrepancy could be attributed to various factors influencing the GSM characteristics, in particular the heat treatment during cheese production. The increase in the a* and b* parameters in UF-GSM cheese is mainly due to the concentration of cheese constituents as a result of dehydration during the GSM-UF process. This trend is consistent with the slight shift observed in the brightness of UF-GSM cheese [40].
The comparative analysis of the physicochemical parameters of cheeses made from GSM and the same GSM after UF revealed significant differences, indicating profound compositional changes induced by the UF process. In particular, the most pronounced changes were observed in the pH and acidity of the UF-GSM cheeses. The decrease in pH combined with a marked increase in acidity observed in the UF-GSM cheese stands out. These shifts appear to be related to an increased retention of the serum fraction during the draining phase of the curd, which gives the distinct sour taste reminiscent of cottage cheese [41].
Texture analysis of the cheeses produced shows significant variation. This divergence in texture is attributed to the instability of caseins during UF, altering their surface charges and causing repulsion. Furthermore, UF leads to reduced micelle hydration due to the extraction of the aqueous phase. Initially, water bound by κ-caseins forms a protective envelope against negative charges and hydrophilicity, contributing to the observed low adhesion generated by UF. Overall, these findings suggest that the UF process significantly impacted cheese texture by modifying the micellar structure and the interactions between its components, resulting in unique textural attributes compared to traditionally produced cheese made from GSM.
UF concentrates GSM constituents by selectively extracting water and smaller molecules while retaining larger constituents such as proteins and minerals. Consequently, this concentration effect results in increased levels of non-water components and minerals in the UF-GSM cheese, which in turn affects acidity due to the concentrated serum fraction present in the curd [42].
UF-GSM cheeses show a staggering six-fold increase in calcium and potassium contents compared to cheeses made from GSM. However, traces of magnesium and iron are detected after the GSM has been processed into cheese, while copper is consistently absent. Importantly, the levels of calcium, potassium and sodium in the cheeses retain a retention pattern similar to that found in UF-GSM. Similar results also reported that a significant increase in calcium and potassium levels in UF-GSM cheeses reflects the efficiency of UF at concentrating these minerals during the cheese-making process [43]. The altered mineral distribution from UF, combined with the increased casein concentration, likely accounts for the improved curd formation. Moreover, the salt equilibrium between the aqueous and dispersed phases of GSM influences both rennet coagulability and the curd’s physical properties. This enhanced curd may boost the mineral bioavailability of the final dairy product.
5. Conclusions
This study extensively investigated the effect of UF process on GSM and cheese production and the effect of different rennet doses on cheese production. Measurement of the permeate flow rate using a graduated vessel in conjunction with a timer showed that GSM selectively transported solutes across the membrane under the influence of the TMP. This phenomenon correlated directly with the pressure gradient, as indicated by Darcy’s law, highlighting the dependence of solute flux on applied pressure. The study showed that GSM crossed the membrane proportionally to the applied pressure, significantly influencing the overall flow dynamics. The observed decrease in pH with a simultaneous increase in acidity (°D) and viscosity suggests a progressive concentration of GSM constituents during UF. This concentration process probably leads to more acidic and viscous milk with increased resistance to flow. Our observations showed a significant increase in dry extract, protein and ash as the VRF escalates, indicating a concentration effect of UF. Dry extract increases from 7.73% to 8.47% at VRFs between 0 and 2.6, while proteins increase from 3.14% to 4.86% over the same ultrafiltration stage. Consequently, the concentration of protein in GSM directly influences this milk’s ability to be transformed into cheese with better yield, which goes from 18% to 30% with a dose of 300 µL of animal rennet per L GSM or UF-GSM with a VRF of 2.6. Moreover, cheese made with UF-GSM is about six times richer in calcium and potassium than that produced with GSM (the control). On the other hand, the research findings indicate that UF affects the color of GSM but not of UF-GSM cheese. Finally, the texture of the cheeses highlighted distinct differences between UF-GSM cheese and the control. It distinguishes itself by having relatively lower hardness and adhesion. Conversely, the dough from UF-GSM cheese demonstrates a softer, lumpier texture with higher particle cohesion, which effectively prevents the cheese from becoming overly crumbly. In perspective, the application of this technique of UF of GSM requires a sensory study of the obtained cheeses to be able to affirm that this product will be accepted by the consumer before being industrialized and put on the market.
Author Contributions
Conceptualization, A.C. and Z.J.; methodology, A.C., Z.J. and R.J.; software, R.J.; validation, Z.J. and R.J.; formal analysis, A.C. and H.E.H.; investigation, A.C., Z.J., H.E.H. and E.A.; resources, E.A.; data curation, R.J. and A.C.; writing—original draft preparation, A.C., R.J. and Z.J.; writing—review and editing, A.C., H.E.H. and E.A.; visualization, R.J.; supervision, H.E.H. and Z.J.; project administration, H.E.H.; funding acquisition, Z.J.; A.C. performed the experiments, analyzed the data and wrote the original draft. All authors have read and agreed to the published version of the manuscript.
Funding
This research was funded by the livestock and wildlife laboratory (LR16IRA04) and the APC was funded by the Research and Innovation in the Mediterranean Area, PRIMA (Section 2—Multi-topic 2022) Project, PAS-AGRO-PAS (The Making of Fragile Agro-ecosystems Productive, Adaptive and Sustainable: Multifunctional).
Data Availability Statement
The data that support the findings of this study are available from the corresponding authors upon reasonable request.
Conflicts of Interest
The authors declare no conflicts of interest.
Abbreviations
The following abbreviations are used in this manuscript:
| UF | Ultrafiltration |
| TMP | Transmembrane pressure |
| TPA | Texture profile analysis |
| GSM | Goat skimmed milk |
| UF-GSM | Ultrafiltered goat skimmed milk |
| VRF | Volume reduction factor |
| Rh | Hydraulic resistance |
References
- Soltani, M.; Saremnezhad, S.; Faraji, A.R.; Hayaloglu, A.A. Perspectives and Recent Innovations on White Cheese Produced by Conventional Methods or Ultrafiltration Technique. Int. Dairy J. 2022, 125, 105232. [Google Scholar] [CrossRef]
- Jeewanthi, R.K.C.; Lee, N.-K.; Lee, K.A.; Yoon, Y.C.; Paik, H.-D. Comparative Analysis of Improved Soy-Mozzarella Cheeses Made of Ultrafiltrated and Partly Skimmed Soy Blends with Other Mozzarella Types. J. Food Sci. Technol. 2015, 52, 5172–5179. [Google Scholar] [CrossRef] [PubMed]
- Moreno-Montoro, M.; Olalla, M.; Giménez-Martínez, R.; Bergillos-Meca, T.; Ruiz-López, M.D.; Cabrera-Vique, C.; Artacho, R.; Navarro-Alarcón, M. Ultrafiltration of Skimmed Goat Milk Increases Its Nutritional Value by Concentrating Nonfat Solids Such as Proteins, Ca, P, Mg, and Zn. J. Dairy Sci. 2015, 98, 7628–7634. [Google Scholar] [CrossRef] [PubMed]
- Deshwal, G.K.; Ameta, R.; Sharma, H.; Singh, A.K.; Panjagari, N.R.; Baria, B. Effect of Ultrafiltration and Fat Content on Chemical, Functional, Textural and Sensory Characteristics of Goat Milk-Based Halloumi Type Cheese. LWT 2020, 126, 109341. [Google Scholar] [CrossRef]
- Karami, M.; Ehsani, M.R.; Mousavi, S.M.; Rezaei, K.; Safari, M. Changes in the Rheological Properties of Iranian UF-Feta Cheese during Ripening. Food Chem. 2009, 112, 539–544. [Google Scholar] [CrossRef]
- Govindasamy-Lucey, S.; Jaeggi, J.J.; Bostley, A.L.; Johnson, M.E.; Lucey, J.A. Standardization of Milk Using Cold Ultrafiltration Retentates for the Manufacture of Parmesan Cheese. J. Dairy Sci. 2004, 87, 2789–2799. [Google Scholar] [CrossRef]
- Liu, D.; Zhang, J.; Yang, T.; Liu, X.; Hemar, Y.; Regenstein, J.M.; Zhou, P. Effects of Skim Milk Pre-Acidification and Retentate PH-Restoration on Spray-Drying Performance, Physico-Chemical and Functional Properties of Milk Protein Concentrates. Food Chem. 2019, 272, 539–548. [Google Scholar] [CrossRef]
- Jrad, Z.; Oussaief, O.; Bouhemda, T.; Khorchani, T.; EL-Hatmi, H. Potential Effects of Ultrafiltration Process and Date Powder on Textural, Sensory, Bacterial Viability, Antioxidant Properties and Phenolic Profile of Dromedary Greek Yogurt. Int. J. Food Sci. Technol. 2019, 54, 854–861. [Google Scholar] [CrossRef]
- Méthot-Hains, S.; Benoit, S.; Bouchard, C.; Doyen, A.; Bazinet, L.; Pouliot, Y. Effect of Transmembrane Pressure Control on Energy Efficiency during Skim Milk Concentration by Ultrafiltration at 10 and 50 C. J. Dairy Sci. 2016, 99, 8655–8664. [Google Scholar] [CrossRef]
- Dushkova, M.; Kodinova, S. Reduction of Energy Demand during Ultrafiltration of Goat’s Milk. In Proceedings of the E3S Web of Conferences, 25th Scientific Conference on Power Engineering and Power Machines (PEPM’2020), Sozopol, Bulgaria, 19–21 September 2020; EDP Sciences: Les Ulis, France, 2020; Volume 207, p. 1016. [Google Scholar]
- Castelló, E.; Braga, L.; Fuentes, L.; Etchebehere, C. Possible Causes for the Instability in the H2 Production from Cheese Whey in a CSTR. Int. J. Hydrogen Energy 2018, 43, 2654–2665. [Google Scholar] [CrossRef]
- Kodinova, S.; Dushkova, M. Optimization of Energy Demand during Ultrafiltration of Cow’s Milk with Different Membranes. In Proceedings of the E3S Web of Conferences, 25th Scientific Conference on Power Engineering and Power Machines (PEPM’2020), Sozopol, Bulgaria, 19–21 September 2020; EDP Sciences: Les Ulis, France, 2020; Volume 207, p. 1017. [Google Scholar]
- ISO 2949; Lait et produits laitiers liquides—Aréomètres à masse volumique pour utilisation dans les produits ayant une tension superficielle d’environ 45 mN/m. International Organization for Standardization: Geneva, Switzerland, 1974.
- El Hatmi, H.; Jrad, Z.; Mkadem, W.; Chahbani, A.; Oussaief, O.; Zid, M.B.; Zaidi, S.; Khorchani, S.; Belguith, K.; Mihoubi, N.B. Fortification of Soft Cheese Made from Ultrafiltered Dromedary Milk with Allium Roseum Powder: Effects on Textural, Radical Scavenging, Phenolic Profile and Sensory Characteristics. LWT 2020, 132, 109885. [Google Scholar] [CrossRef]
- ISO 8968-1; Lait et Produits Laitiers—Détermination de la Teneur en Azote. Partie 1: Méthode Kjeldahl et Calcul de la Teneur en Protéines Brutes. International Organization for Standardization: Geneva, Switzerland, 2014.
- Bekele, B.; Hansen, E.B.; Eshetu, M.; Ipsen, R.; Hailu, Y. Effect of Starter Cultures on Properties of Soft White Cheese Made from Camel (Camelus Dromedarius) Milk. J. Dairy Sci. 2019, 102, 1108–1115. [Google Scholar] [CrossRef] [PubMed]
- Quezada, C.; Estay, H.; Cassano, A.; Troncoso, E.; Ruby-Figueroa, R. Prediction of Permeate Flux in Ultrafiltration Processes: A Review of Modeling Approaches. Membranes 2021, 11, 368. [Google Scholar] [CrossRef]
- Gavazzi-April, C.; Benoit, S.; Doyen, A.; Britten, M.; Pouliot, Y. Preparation of Milk Protein Concentrates by Ultrafiltration and Continuous Diafiltration: Effect of Process Design on Overall Efficiency. J. Dairy Sci. 2018, 101, 9670–9679. [Google Scholar] [CrossRef]
- Lu, P.; Liang, S.; Zhou, T.; Xue, T.; Mei, X.; Wang, Q. Layered Double Hydroxide Nanoparticle Modified Forward Osmosis Membranes via Polydopamine Immobilization with Significantly Enhanced Chlorine and Fouling Resistance. Desalination 2017, 421, 99–109. [Google Scholar] [CrossRef]
- Grandison, M.K.; Boudinot, F.D. Age-Related Changes in Protein Binding of Drugs: Implications for Therapy. Clin. Pharmacokinet. 2000, 38, 271–290. [Google Scholar] [CrossRef]
- Seyed Shahabadi, S.I.; Kong, J.; Lu, X. Aqueous-Only, Green Route to Self-Healable, UV-Resistant, and Electrically Conductive Polyurethane/Graphene/Lignin Nanocomposite Coatings. ACS Sustain. Chem. Eng. 2017, 5, 3148–3157. [Google Scholar] [CrossRef]
- Ng, K.S.Y.; Haribabu, M.; Harvie, D.J.E.; Dunstan, D.E.; Martin, G.J.O. Mechanisms of Flux Decline in Skim Milk Ultrafiltration: A Review. J. Memb. Sci. 2017, 523, 144–162. [Google Scholar] [CrossRef]
- Cunha-Vaz, J. Mechanisms of Retinal Fluid Accumulation and Blood-Retinal Barrier Breakdown. Dev. Ophthalmol. 2017, 58, 11–20. [Google Scholar]
- Sotillo, A.Q.; Méndez, M.L.H. La Leche de Cabra; EDITUM: Murcia, Spain, 1994; Volume 2, ISBN 8476845472. [Google Scholar]
- Park, B.Y.; Yoon, K.Y. Biological Activity of Enzymatic Hydrolysates and the Membrane Ultrafiltration Fractions from Perilla Seed Meal Protein. Czech J. Food Sci. 2019, 37, 180–185. [Google Scholar] [CrossRef]
- Park, Y.W.; Haenlein, G.F.W. Goat Milk, Its Products and Nutrition. Handb. food Prod. Manuf. 2007, 2, 449–488. [Google Scholar]
- GÜLER-AKIN, M.B.; Serdar Akin, M.; Korkmaz, A. Influence of Different Exopolysaccharide-producing Strains on the Physicochemical, Sensory and Syneresis Characteristics of Reduced-fat Stirred Yoghurt. Int. J. Dairy Technol. 2009, 62, 422–430. [Google Scholar] [CrossRef]
- Luo, J.; Meyer, A.S.; Mateiu, R.V.; Pinelo, M. Cascade Catalysis in Membranes with Enzyme Immobilization for Multi-Enzymatic Conversion of CO2 to Methanol. New Biotechnol. 2015, 32, 319–327. [Google Scholar] [CrossRef] [PubMed]
- Charcosset, C. Classical and Recent Applications of Membrane Processes in the Food Industry. Food Eng. Rev. 2021, 13, 322–343. [Google Scholar] [CrossRef]
- Da Cunha, T.M.P.; Canella, M.H.M.; Haas, I.C.d.S.; Amboni, R.D.d.M.C.; Prudencio, E.S. A Theoretical Approach to Dairy Products from Membrane Processes. Food Sci. Technol. 2022, 42, e12522. [Google Scholar] [CrossRef]
- Dons, T.; Kirkensgaard, J.J.; Candelario, V.; Andersen, U.; Ahrné, L. Structural and physical-chemical properties of milk fat globules fractionated by a series of silicon carbide membranes. Food Res. Int. 2024, 192, 114680. [Google Scholar] [CrossRef]
- Boutrou, R.; Coirre, E.; Jardin, J.; Léonil, J. Phosphorylation and Coordination Bond of Mineral Inhibit the Hydrolysis of the β-Casein (1− 25) Peptide by Intestinal Brush-Border Membrane Enzymes. J. Agric. Food Chem. 2010, 58, 7955–7961. [Google Scholar] [CrossRef]
- Milovanovic, B.; Djekic, I.; Miocinovic, J.; Djordjevic, V.; Lorenzo, J.M.; Barba, F.J.; Mörlein, D.; Tomasevic, I. What Is the Color of Milk and Dairy Products and How Is It Measured? Foods 2020, 9, 1629. [Google Scholar] [CrossRef]
- Lucas, A.; Rock, E.; Agabriel, C.; Chilliard, Y.; Coulon, J.B. Relationships between Animal Species (Cow versus Goat) and Some Nutritional Constituents in Raw Milk Farmhouse Cheeses. Small Rumin. Res. 2008, 74, 243–248. [Google Scholar] [CrossRef]
- Pazzola, M.; Stocco, G.; Dettori, M.L.; Bittante, G.; Vacca, G.M. Effect of Goat Milk Composition on Cheesemaking Traits and Daily Cheese Production. J. Dairy Sci. 2019, 102, 3947–3955. [Google Scholar] [CrossRef]
- Fox, P.F.; Guinee, T.P.; Cogan, T.M.; McSweeney, P.L.H.; Fox, P.F.; Guinee, T.P.; Cogan, T.M.; McSweeney, P.L.H. Processed Cheese and Substitute/Imitation Cheese Products. In Fundamentals of Cheese Science; Springer: Boston, MA, USA, 2017; pp. 589–627. [Google Scholar]
- Walstra, P. The Roles of Proteins and Peptides in Formation and Stabilisation of Emulsions. Spec. Publ. Soc. Chem. 2002, 278, 237–244. [Google Scholar]
- Broyard, C.; Gaucheron, F. Modifications of Structures and Functions of Caseins: A Scientific and Technological Challenge. Dairy Sci. Technol. 2015, 95, 831–862. [Google Scholar] [CrossRef]
- Corredig, M.; Nair, P.K.; Li, Y.; Eshpari, H.; Zhao, Z. Invited Review: Understanding the Behavior of Caseins in Milk Concentrates. J. Dairy Sci. 2019, 102, 4772–4782. [Google Scholar] [CrossRef]
- Serna-Hernandez, S.O.; Escobedo-Avellaneda, Z.; García-García, R.; Rostro-Alanis, M. de J.; Welti-Chanes, J. High Hydrostatic Pressure Induced Changes in the Physicochemical and Functional Properties of Milk and Dairy Products: A Review. Foods 2021, 10, 1867. [Google Scholar] [CrossRef] [PubMed]
- Carrillo-Lopez, L.M.; Garcia-Galicia, I.A.; Tirado-Gallegos, J.M.; Sanchez-Vega, R.; Huerta-Jimenez, M.; Ashokkumar, M.; Alarcon-Rojo, A.D. Recent Advances in the Application of Ultrasound in Dairy Products: Effect on Functional, Physical, Chemical, Microbiological and Sensory Properties. Ultrason. Sonochem. 2021, 73, 105467. [Google Scholar] [CrossRef]
- Aydogdu, T.; O’Mahony, J.A.; McCarthy, N.A. PH, the Fundamentals for Milk and Dairy Processing: A Review. Dairy 2023, 4, 395–409. [Google Scholar] [CrossRef]
- Barone, G.; Yazdi, S.R.; Lillevang, S.K.; Ahrné, L. Calcium: A Comprehensive Review on Quantification, Interaction with Milk Proteins and Implications for Processing of Dairy Products. Compr. Rev. Food Sci. Food Saf. 2021, 20, 5616–5640. [Google Scholar] [CrossRef]
Disclaimer/Publisher’s Note: The statements, opinions and data contained in all publications are solely those of the individual author(s) and contributor(s) and not of MDPI and/or the editor(s). MDPI and/or the editor(s) disclaim responsibility for any injury to people or property resulting from any ideas, methods, instructions or products referred to in the content. |
© 2025 by the authors. Licensee MDPI, Basel, Switzerland. This article is an open access article distributed under the terms and conditions of the Creative Commons Attribution (CC BY) license (https://creativecommons.org/licenses/by/4.0/).