Article

Use of Insect Meals in Dry Expanded Dog Food: Impact of Composition and Particulate Flow Characteristics on Extrusion Process and Kibble Properties

Department of Grain Science & Industry, Kansas State University, Manhattan, KS 66506, USA
*
Authors to whom correspondence should be addressed.
Processes 2025, 13(7), 2083; https://doi.org/10.3390/pr13072083
Submission received: 1 April 2025 / Revised: 3 June 2025 / Accepted: 5 June 2025 / Published: 1 July 2025
(This article belongs to the Special Issue Feature Papers in the "Food Process Engineering" Section)

Abstract

This study explored the potential of insect proteins as an alternative to traditional meat and bone meals in nutritionally balanced dry expanded dog food. Four formulations containing black soldier fly larvae meal (BSFL), cricket flour (CF), poultry meal (PM), or fish meal (FM) at 30% inclusion were evaluated using powder rheology, extrusion trials, and analyses of kibble expansion and texture. BSFL and FM had lower specific basic flow energy (<13 mJ/kg) compared to PM and CF (>14 mJ/kg), leading to better flowability and improved extrusion stability and product consistency. High fat and chitin contents in CF and BSFL, respectively, resulted in higher bulk densities (328–382 g/L) than meat-and-bone-meal-based products (304–306 g/L). The insect-meal-based kibbles also had either a fragile (peak crushing force < 7 kg for BSFL) or very hard texture (force > 13 kg for CF). Results from a second experiment showed that including BSFL meal at lower levels (10%) alongside poultry meal mitigated the negative effects on kibble quality while improving process stability. Overall, the study suggests that defatting and partial, rather than complete, replacement of traditional proteins with insect meal could be more viable strategies for producing consistent, high-quality extruded pet food.

1. Introduction

The rise in pet ownership has led to a significant increase in the demand for sustainable pet food. There are over 170 million dogs and 190 million cats in the U.S., with a comparable population in the European Union and rapid growth in several other regions worldwide [1,2,3,4,5]. Insect protein can help meet this demand while potentially reducing environmental impact, including land usage, water consumption, and CO2 emissions [6,7]. However, palatability and negative pet owner perception of insect-based ingredients could present challenges [8,9,10]. Research has shown that producing 1 g of edible poultry protein requires 2–3 times more land and 50% more water than mealworms, while beef requires 8–14 times more land and 5 times more water [6,11,12]. These studies also found that broiler chickens produce 32–167% higher and beef cattle 6–12 times more global-warming-causing emissions (CO2-eq) than mealworms. Similarly, poultry production in Thailand was found to have 121% higher emissions than crickets when compared on a protein basis [13]. Insects also have better feed conversion efficiency, especially if they can be raised on underused or waste organic substrates [6,9,14]. This is especially relevant given the quantity of agricultural produce wasted annually, but having the potential of upcycling as substrates for rearing insects.
Although insect production systems have inherent sustainability advantages, the associated life cycle assessment studies present several complications and knowledge gaps [15]. Metabolic and respiration-related emissions from insect rearing need to be better understood, and the poikilothermic physiology of insects has to be taken into account. The latter necessitates greater energy inputs for temperature control of facilities in colder regions while maintaining high feed conversion efficiency [15]. Also, for the use of insect proteins in pet food, the benchmark for comparison is not animal meats but by-products, such as poultry meal, meat and bone meal, etc., but related studies are scarce. Studies comparing the sustainability of insect production to that of meat by-products used in dry expanded pet food are limited. A consulting group estimated that 2 kg CO2-eq of emissions are produced for every 1 kg of poultry meal, which was lower than the 3 kg CO2-eq emissions for black soldier fly larvae [16]. The high lipid content of many insects makes it challenging for pet food extrusion. Defatting insect meals can entail additional processing and energy input [7]. Nevertheless, there is room for optimizing the sustainability of insect proteins vis-à-vis animal meals used in pet food through substrate and production efficiency improvements, and even genetic selection [6,9,17].
The nutritional content and quality of insects, however, have been shown to be favorable in general. Inter- and intra-species variability in nutrient composition exists, but insects contain 35–61% crude protein based on dry matter [7]. Insect proteins have amino acid profiles comparable to common ingredients used in aquatic and animal feed, such as fish meal and soybean meal [18]. Partial or complete replacement of fish meal with insect meals has been shown to be feasible for various farmed fish species with limited adverse effects on growth [6]. The in vitro nitrogen digestibility of various insect meals and also in vivo fecal nitrogen digestibility values in dogs and cats are similar to conventional protein sources such as poultry meal [9]. A very recent study reported that partial or complete replacement of poultry meal with locust meal in diets did not lead to major negative consequences on the health status and overall performance of dogs, including dry and organic matter digestibility, body weight, and fecal quality [19].
Limited research exists on the impact of insect meal incorporation on extrusion performance and physical quality attributes of extruded pet food, such as kibble structure, expansion, and texture, which are attributes that relate directly to palatability and acceptance of the product. According to a current market study, pet food brands using black soldier fly as an ingredient far outnumber other insect meals, and dog food products utilize insects much more than cat food [10]. Hence, the focus of this study was on the incorporation of black soldier fly larvae (BSFL) meal in extruded dog food products. Cricket flour was also investigated as another insect meal for comparison. A study on extruded aquatic feed showed that higher BSFL inclusion negatively impacted pellet expansion [20]. On the contrary, another study reported the inclusion of BSFL as a substitute for fish meal in extruded shrimp feed without any adverse effect on pellet quality [18]. The use of BSFL flour has also been shown to cause dark brown color in extrudates [21]. Exploratory research by the authors of the current study using a bench-top screw-based feeding system indicated that a binary mix of BSFL meal with corn flour had up to a 16% higher flow rate and less impact of hopper fill level (thus lower compressibility) as compared to a similar binary mix of pet food grade poultry meal with corn flour. Bench-top extrusion of these mixes pointed to improved process stability and higher specific mechanical energy with BSFL meal as compared to poultry meal. Based on these data, it was hypothesized that flowability, functionality, and extrusion performance of insect protein meals during extrusion of dry expanded pet food will differ substantially from the traditionally used poultry meal due to differences in composition and other properties, such as inter-particulate adhesion. These physico–chemical and performance characteristics of insect proteins will be important to study in the context of actual pet food formulations used in a standard extrusion process. The objective of this study was to evaluate particulate flow characteristics, functionality, and pilot-scale extrusion performance of cricket flour and BSFL meal when incorporated in nutritionally complete and balanced dog food diets, in comparison with typical animal protein sources such as poultry meal and fish meal. The impact of using insect protein meals on the physical quality of extruded kibbles was also studied.

2. Materials and Methods

2.1. Materials

Black soldier fly larvae meal was sourced from Prezero US (Jurupa Valley, CA, USA) and cricket flour from Entomo Farms (Norwood, ON, Canada), while poultry meal and fish meal were obtained from Fairview Mills (Seneca, KS, USA). The proximate compositions of these four animal protein meals are shown in Table 1 as per supplier specifications. A base pet food mix, excluding the animal protein meals, was sourced from Fairview Mills. For nutritionally balancing the diets based on the differences in proximate composition of the meals, additional corn and corn gluten meal were sourced from Mid Kansas Cooperative (Manhattan, KS, USA). Chicken fat and dry digest flavor were sourced from International Dehydrated Foods (Monett, MO, USA) and AFB International (St. Charles, MO, USA), respectively.

2.2. Experimental Design

Two experiments were conducted focusing on the inclusion of different animal protein meals in dog food diets (Experiment 1) and the replacement of poultry meal with different levels of BSFL meal (Experiment 2). In Experiment 1, diets were formulated to have 30% fish meal, poultry meal, BSFL meal, or cricket flour on a coated kibble basis. These diets were labeled as FM, PM, BSFL, and CF, respectively, and their target post-coating nutrient content is described in Table 2. The diets included chicken fat (2.0–6.1%) and animal digest (1%) that were coated post-extrusion, so the actual formulations that were extruded for production of the dry expanded dog food kibbles had a different composition (Table 3) than the complete diets. In Experiment 2, four diets were formulated with incrementally higher levels of BSFL meal (0, 10, 20, and 30%) replacing poultry meal, while the total level of animal protein meals was constant at 30% on a coated kibble basis. These diets were labeled as 0BSFL, 10BSFL, 20BSFL, and 30BSFL, respectively, and their target post-coating nutrient content (Table 4) was similar to Experiment 1. The diets included chicken fat (6%) and animal digest (1%) that were coated post-extrusion. The composition of the corresponding formulations that were extruded is provided in Table 5. In both experiments, crude protein content in the coated product (~32.5%) was balanced by varying the amount of corn flour and corn gluten meal. All diets were formulated to be nutritionally complete for dogs at maintenance [22]. All formulations were mixed in a double-ribbon batch blender (Wenger Manufacturing, Sabetha, KS, USA) for 3 min prior to raw material analyses and extrusion as described in the following sections.

2.3. Rapid Visco Analysis

The pasting properties of formulations were studied using a Rapid Visco Analyzer (RVA 4500, Perten Instruments, Waltham, MA, USA) by measuring viscosity changes in slurry form during a controlled heating and cooling process with the application of moderate shear. AACC standard method 76-21.02 was followed for the test [23]. Briefly, ~3 g of each sample was combined with 25 mL deionized water to create a 14% (w/v basis) suspension and placed in the RVA. Stirring was carried out throughout the test as specified in the standard. The temperature cycle involved holding at 50 °C for 1 min, heating 95 °C at 12.2 °C per min, followed by holding again at 95 °C for 2.5 min, and cooling to 50 °C at 11.8 °C per min before a final holding period for 2 min. Parameters such as pasting temperature and peak viscosity were recorded using the pasting profiles that were generated from each test. RVA analyses were conducted in duplicate for each formulation.

2.4. Particulate Rheology

The flow properties and compressibility of individual animal protein meals and mixed formulations were measured using a powder rheometer (FT4, Freeman Technologies, Tewkesbury, UK). Detailed description of the equipment, characterization procedures, and relevance to extrusion can be found elsewhere [24,25,26]. However, brief methodology is described below.
The total energy required per unit mass to establish a specific flow pattern in the powder column during confined flow (downward test) after conditioning is called the specific basic flow energy (SBFE). It was calculated using the following equation.
S B F E m J g = 0 x T θ + F v x v x 1 d x m
where T is torque experienced by the test blade (N.m), F is the vertical force experienced by the blade (N), Θ is the angular speed of the blade (rad/sec), vx is the vertical speed of the blade (m/s), ∆x is the vertical distance traveled by the blade, and m is the mass of test sample (g).
Specific energy (SE) is the energy per unit mass needed to displace the conditioned powder during unconfined flow (upward test). It was calculated as follows.
S E m J g = ( F E 6 + F E 7 ) / 2 m
where FE6 and FE7 are the upward flow energies (mJ) required during test cycles 6 and 7, respectively.
Compressibility is the measure of change in volume (or bulk density) as a function of applied normal stress. The FT4 was also used for compression testing of the powders after initial conditioning. Increasing force levels of 0.5, 1, 2, 4, 6, 8, 10, 12, and 15 kPa were exerted on the sample via a piston. Compressibility was calculated as percentage change in volume at each force, based on the distance traveled by the piston. The conditioned bulk density of the samples was also measured as part of this procedure. All tests were conducted in triplicate.

2.5. Extrusion Processing

Prior to extrusion, flow rate of each formulation delivered by the volumetric feeding system of the extruder was calibrated at two feeder screw speeds, 8 and 12 rpm. Measurements were performed in duplicate and averaged over both high and low fill levels of the live-bottom feed hopper. Formulations were processed using a 37.3 kW (50 hp) pilot-scale single-screw extruder (X-20, Wenger Manufacturing, Sabetha, KS, USA) with a screw diameter of 82.6 mm (3.25 in) and L/D ratio of 10:1. The extruder barrel consisted of 6 heads divided into 3 heating zones, with the inlet head having a smooth liner and rest of the heads having spiral liners. The screw profile (Figure 1) had single-flighted full-pitch screws in the feed intake section, transitioned to double-flighted half-pitch screws for creating compression, and ended with a cone screw at the discharge for directing flow into the die opening. Four steam locks were interspersed between the screw elements to provide resistance to flow, increase material fill, and lead to desired mechanical energy input.
During the extrusion experiments, raw material mash in the feed hopper was maintained at medium fill level. The feeder screw speed was set at 13 rpm, which corresponded to a dry mash feed rate of 115–123 kg/h, as obtained from the calibration for each formulation. The mash was conditioned to 96–98 °C in a Wenger model 2 DDC preconditioner, with water and steam injection at 5–7 kg/h and 15–16 kg/h, respectively. Water was injected into the extruder barrel at an average rate of 9 kg/h to achieve an in-barrel moisture of 28–29% wb. The extruder barrel temperatures were set at 50, 70, and 90 °C from inlet to discharge, and the screw speed at 375 rpm. A single circular cross-section die with 7.07 mm diameter was used to shape the dog food product exiting the extruder, which was cut at a speed of 1335 rpm using a rotary knife system with 6 hard blades. A thermocouple probe was inserted into the material stream immediately downstream of the discharge screw to measure the die temperature. Each formulation was extruded for 60 min. Process data were recorded using a computerized data acquisition system, with the exception of die temperature and extruder motor power consumption data, which were recorded using a video camera and transcribed every two minutes. The extruded kibbles were conveyed using a negative-pressure pneumatic system to a pilot-scale Wenger series 4800 two-pass gas-fired continuous dryer and single-pass cooling system. Drying temperature and time were 104.4 °C (220 °F) and 16 min, while cooling was conducted with room temperature air for 6.6 min.

2.6. Extrusion Process Analyses

2.6.1. Specific Mechanical Energy

Specific mechanical energy (SME) transferred from the screw to the material during the extrusion process was calculated as described below from the power consumed by the extruder motor, measured using a wattmeter.
S M E k J k g = W W 0 m f
where W is the power consumed during processing (kW), W0 is power consumed at no load with the screw running and no material flowing through (kW), and mf is the dry feed rate or rate of material delivered by the feeder screw in kg/sec, as determined using volumetric feed delivery calibration.

2.6.2. Specific Thermal Energy

Specific thermal energy (STE) input during the extrusion process was calculated for selected treatments from net heat transferred to the material due to steam absorbed during preconditioning, as follows.
S T E k J k g = Q t h e r m a l m f
where Qthermal is the net rate of thermal energy or heat absorbed from steam (kJ/s), which was calculated using the equation below from the enthalpies of steam injected and unabsorbed steam lost to atmosphere at the preconditioner discharge.
Q t h e r m a l k J s = m s · h s · m s · 4.18 · T r m s l · h s l m s l · 4.18 · T r
where hs and hsl are enthalpies of steam injected and steam lost to atmosphere (kJ/kg), respectively, as obtained from the steam tables; ms and msl are rates of steam injection and loss (kg/s), respectively; the constant 4.18 is the specific heat of water at room temperature in kJ/kg°C; and Tr is room temperature (°C). The rate of steam loss from the preconditioner was calculated using mass balance, as described below.
m s l k g s = m f + m s + m w m f 1 X w f 1 X w p c
where mw is the water injection rate into the preconditioner (kg/s), and the second term on the right of the equation is the rate of conditioned mass exiting the preconditioner, with Xwf and Xwpc representing the fractional wet basis (or as is) moisture contents of the feed material and the conditioned mass, respectively, measured using the oven drying method (135 °C, 2 h).

2.6.3. Extruder Visualization Test

The previously described Wenger X-20 pilot-scale single-screw extruder used for production of dog food kibbles was adapted for conducting in-line particulate flow visualization tests. The extruder barrel was replaced by another one that had a plexiglass window covering one-third of the circumference throughout its length. The screw profile was the same as that used for dog food production (Figure 1). The discharge of the barrel had a circular opening 38.1 mm (1.5 in) in diameter instead of a regular die. During the visualization trials, flowing material accumulated at the extruder discharge due to the moderate restriction at the opening and at the steam locks along the barrel length where material peaks were generated. This phenomenon was subjectively assessed to determine flowability of dry formulations (without water and steam injection) with different animal protein meals (Experiment 1) at an extruder screw speed of 400 rpm, while the feeder screw was set at 13 rpm. These conditions mirrored those used for dog food production.

2.7. Kibble Macrostructure

2.7.1. Bulk Density

Extruded product bulk density (g/L) was measured by recording the mass of kibbles filling a 1 L cup to the brim. Three replicate measurements were made for both the wet product directly off the extruder discharge and dry product after the dryer.

2.7.2. Piece Measurements

For each treatment, ten bags of kibble samples were collected, evenly spaced in time during extrusion, and numbered. From each bag, ten kibbles were randomly selected, and their individual mass, diameters at two perpendicular axes, and thickness were measured. These data were used for calculating the average sectional expansion ratio (ER), specific length (Lsp), and piece density (ρ), as described below [27]. The overall standard deviation and coefficient of variation was also calculated for each treatment based on these measurements.
E R = d k 2 d d i e 2
where dk is the average of the two kibble diameter measurements (cm), and ddie is the extruder die diameter (cm).
L s p c m g = l k m k
where lk is the kibble thickness (cm), and mk is the kibble mass (g).
ρ g c m 3 = m k π 4 d k 2 · l k
where the denominator on the right of the equation is the kibble volume, assuming a cylindrical shape, and all symbols are as defined above.

2.8. Texture Analysis

The peak force of compression for dried kibbles was measured using a TA-XT2 Texture Analyzer (Texture Technologies Corp., Scarsdale, NY, USA). A 25 mm diameter cylindrical probe with an automatic trigger force of 100 g and test speed of 2.0 mm/s was used for the tests. Kibbles were compressed along the direction of extrusion for a distance of 2.5 mm. For each test, two equally sized kibbles were placed on the instrument platform close to each other, centered under the probe and compressed together. Due to high variability, a total of 60 replicate tests were conducted for each treatment using an equal number of dried kibbles collected at the beginning, middle, and end of production.

2.9. Statistical Analyses

Statistical analyses were performed on SAS Studio 3.8 software (SAS Institute, Inc, Cary, NC, USA). One-way ANOVA (α = 0.05) using the general linear model was employed to determine statistical difference between treatment means. Tukey’s post-hoc test (α = 0.05) was performed for pairwise comparison between means after a significant ANOVA result.

3. Results and Discussion

3.1. Rapid Visco Analysis of Formulations

The average RVA pasting profiles for formulations with different animal protein meals (Experiment 1) are shown in Figure 2a, and the corresponding pasting temperature and peak viscosity data are presented in Table 6. The BSFL formulation had the lowest peak viscosity of 190 cP, as compared to FM, PM, and CF (220–274 cP). This was not surprising, as the least amount of corn flour (36.7%) was used in formulating the former with the goal of keeping all the diets iso-nutritional, and consequently, the lower starch amount led to less viscosity, as gelatinization increased during the hydrothermal treatment. Also, BSFL meal had a high amount of crude fiber (9.5%), which was not very conducive to viscosity development. The order Diptera to which the black soldier fly belongs is known to have one of the highest fiber contents among all edible insects [7]. The fiber is typically in the form of chitin, which is insoluble in nature. CF had the highest amount of corn flour (49.7%), yet had a relatively low peak viscosity of 220 cP, possibly due to the high fat content of cricket flour (18.1%). The hydrophobic lipids interfered with the proper hydration of various components in CF, including the starch in corn flour, and inhibited viscosity. PM and FM had the highest peak viscosity due to a moderately high level of corn flour and fewer hydrophobic interactions associated with the lower fat in poultry meal and fish meal. The pasting temperatures of all four formulations were in a narrow range (78.5–80.1 °C), but the subtle differences could have an impact on functionality. For example, PM had the lowest pasting temperature, pointing to easier initiation of starch transformations for the same reasons that contributed to its highest peak viscosity. The presence of non-starch components can impact starch gelatinization and pasting temperature [28]. This was seen in the case of FM, where starch transformations were the most delayed (highest pasting temperature), possibly due to its gelatin content. The highest ash content of fish meal (20.0%) indicated an increased presence of bone material that is usually associated with gelatin, which in turn can interact with water and interfere with starch hydration and swelling.
The average RVA pasting profiles for formulations with different BSFL meal levels (Experiment 2) are shown in Figure 2b, while Table 6 also shows the corresponding pasting temperature and peak viscosity data. The 0BSFL formulation with 30% poultry meal and no BSFL meal had a peak viscosity of 274.0 cP, while formulations with 10–30% BSFL meal had lower peak viscosity (154.0–190.0) due to a reduction in corn flour content from 45.6% to 39.5–43.7%, respectively. The insoluble chitin in BSFL meal might have also contributed to the lowering of peak viscosity for the latter, with respect to 0BSFL. The decrease in corn flour in the formulations with the increase in BSFL meal content from 0 to 30% also led to delayed initiation of starch hydration and swelling, as represented by an increase in the pasting temperature from 78.5 to 80.7 °C. Similar changes in peak viscosity and pasting temperature were observed with the addition of up to 10% grasshopper flour to corn flour, and this was attributed to the fact that components in the former did not contribute to gel formation [29]. It is obvious that the RVA pasting profile can be useful in understanding interactions between various parts of any raw material. Although this tool has not been widely used for analyzing pet food formulations, characteristics such as pasting temperature corresponded well with data reported by our group (pasting temperature of 76.6 °C) for a cat food formulation with a similar composition as the PM treatment [30].

3.2. Particulate Rheology

3.2.1. Flow Energy

Particulate flow in extrusion processing is important from the point of view of conveying in the feeding system, preconditioner, and also the feed section of the extruder barrel, as the material is still granular in nature in these parts of the system prior to being transformed into a dough-like consistency due to the action of the extruder screw [24,25]. Consistency of flow in extruders, or lack thereof, is an important factor that impacts operational stability and product consistency. This is especially important in the case of a single-screw extruder, like the one used in this study and almost universally employed for pet food production [31]. As opposed to twin-screw systems that have self-wiping ability leading to consistent flow and consequently higher operational flexibility, extruders with only one screw are very sensitive to the flow behavior of ingredients.
Data for particulate flow energy parameters, SE and SBFE, for individual insect protein meals are summarized in Table 7. SE ranging from 4.95 to 7.55 mJ/g was much lower than SBFE, which varied from 11.50 to 15.10 mJ/g, depending on the insect meal being tested. This general trend was also observed for data collected for various formulations used in Experiments 1 and 2, as provided later in this section, and was expected because confined flow is against a resistance and requires more energy as opposed to unconfined flow. Granular material flows in the feeder screw that delivers ingredients to the preconditioner, and also in the feed zone of the extruder barrel, typically experience resistance from upstream sections, either due to the physical design of equipment or the pressure developed in the barrel. Therefore, specific basic flow energy trends are more relevant, on which most of the discussion will focus. The type of animal protein had a significant effect on SE and SBFE of meals (p < 0.0001). The highest SBFE was observed for cricket flour (15.10 mJ/g), indicating it had the poorest flowability. The high fat content of 18.1% in this ingredient (Table 1) might lead to greater cohesion between particles, thus requiring higher energy for flow. The SBFE of poultry meal, which also had a relatively high fat content of 11.6% as compared to the other two animal protein meals, was high as well (14.06 mJ/g), although lower than cricket flour. The lowest SBFE was observed for BSFL meal that not only had the least fat content of 8.7% but also a high level of chitin. The latter might have contributed to decreased cohesion and improved flow characteristics. SBFE of fish meal was also low, possibly due to higher bone content coupled with relatively low fat. Although not tested in this study, differences in the particle size of animal protein meals might also influence their flowability [24,25]. It should be noted that, similar to specific basic flow energy, SE for BSFL meal was also lowest for all animal protein meals.
Particulate flow energy data for formulations with different animal protein meals used in Experiment 1 are shown in Table 8. Both SBFE and SE were lower for the formulations (10.34–12.84 mJ/g and 5.68–6.92 mJ/g, respectively) than for the corresponding individual protein meals. Thus, it is obvious that mixing the protein meals with ingredients having low cohesion, such as corn flour, corn gluten meal, and beet pulp, improved the flowability. This trend was also observed with respect to flow energy data for formulations with different levels of BSFL meal used in Experiment 2, as shown later in this section. The type of animal protein meal used had a significant effect on both SE and SBFE of formulations (p < 0.0001). SBFE for the four formulations closely followed the same trends as SBFE for the individual protein meals that were described previously; however, the differences between treatments were less pronounced due to the improvement of flow caused by the other ingredients. CF had the poorest flowability with the highest SBFE (12.84 mJ/g), followed by PM (11.99 mJ/g); while BSFL had the least SBFE (10.34 mJ/g). The reasons for this trend were discussed earlier in the context of flow energy and flowability of individual protein meals. Again, similar to specific basic flow energy, SE for the BSFL formulation was the lowest for all animal protein meals.
BSFL meal level had a significant effect on both SE and SBFE of formulations (p < 0.0001), as can be seen in Table 8. Both flow energies had a decreasing trend as the level of black soldier fly larvae meal increased from 0 to 30%, and correspondingly, poultry meal decreased from 30 to 0%. Despite this trend, SE and SBFE (5.68–5.87 mJ/g and 10.34–10.76 mJ/g, respectively) for 10BSFL, 20BSFL, and 30BSFL formulations were not statistically different from each other but were significantly lower than that for 0BSFL (6.92 mJ/g and 11 mJ/g, respectively). The decrease in specific basic flow energy with the incorporation of BSFL meal in the formulations at the expense of poultry meal indicated an improvement in flowability in the extrusion system. This was a direct result of the lowest SBFE and better flowability of the former, as discussed previously.
SBFE of formulations can also depend on the speed of testing on the FT4 powder rheometer, and this relationship (flow rate index) was also determined in this study. It should suffice to mention that substantial differences can lead to a variation in the flow behavior of powders with a change in process variables, such as extruder screw speed or feeder screw speed. The relationships between the SBFE of formulations and their flowability in the extrusion system are described next.

3.2.2. Extruder Flow Visualization

The highest resistance of the CF formulation to confined flow and poorest flowability, as evident from SBFE data (Table 8), was confirmed subjectively from the visualization trials on the pilot-scale single-screw extruder (Figure 3). The most buildup of powders at the discharge end (on the right) or the highest barrel fill was observed for CF, indicating poor flowability. The PM formulation also had high build-up and thus low flowability. The BSFL formulation with the least resistance to confined flow (lowest SBFE) had a low barrel fill, indicating good flowability, similar to FM. Similar relationships between SBFE and extruder flow have been reported by our group in earlier studies, although in the context of other materials [24,25]. Interestingly, the feeder screw calibration data trends mirrored the extruder flow visualization results. At the speed of 13 rpm, the feeder screw delivered a lower rate of CF and PM formulations (114.9–118.4 kg/h) relative to FM and BSFL (121.3–123.1 kg/h), as calculated by extrapolation from experimental data. Besides the role of flow energy or SBFE, the bulk density of formulation probably had an impact as well, as it was lower for CF and PM (0.58–0.61 g/mL) as compared to FM and BSFL (0.78–0.91 g/mL). Particulate materials with higher bulk density will naturally have a higher mass flow rate for a given volumetric capacity of the screw. The barrel fill trends seen from the flow visualization tests were probably a compounded effect of flow in both the feeder screw and extruder screw. It is noteworthy that for all formulations, a substantial amount of barrel fill was also observed at the four locations of steam locks due to the higher flow resistance offered by them, as compared to the regular screw elements.
For formulations with different levels of BSFL meal, feeder screw calibration data indicated that 30BSFL formulation had a higher flow rate at a speed of 13 rpm (121.3 kg/h) as compared to 0BSFL, 10BSFL, and 20BSFL formulations (114.8–118.4 kg/h), which also corresponded with the SBFE trends described in Table 8 and the increasing bulk density with a higher level of BSFL meal (0.58–0.91 g/mL).

3.2.3. Compressibility

Compressibility analysis of individual animal protein meals showed consistent reduction in volume with an increase in applied normal stress from 0.5 to 15 kPa. This general trend was also seen in compressibility data for various formulations, which are discussed later. Cricket flour was most susceptible to compaction with the highest compressibility of 38.3% at 15 kPa, while BSFL meal had the lowest compressibility of 15.8%. Poultry meal and fish meal had intermediate compressibility. Multiple factors can influence compressibility, including particle shape and size distribution, surface chemistry, cohesion, hardness, density, etc. [24,25,32]. Although particle size and shape were not measured in this study, the impact of particle cohesion is evident from these data. As mentioned earlier in the particulate flow energy discussion, higher cohesion due to high lipid content in the case of cricket flour and lowest cohesion due to low lipid and high chitin content in the case of BSFL meal were the reasons for this trend. The low cohesive BSFL meal particles tend to flow freely and occupy as much of a given volume as possible, resulting in very little void space or free volume available for compression when force is applied [25]. The opposite was true for cricket flour particles.
Compressibility versus applied data normal stress for formulations with different animal protein meals used in Experiment 1 are shown in Figure 4a. Trends between the formulations were similar to those between corresponding individual animal protein meals discussed above, except the differences were less substantial due to the incorporation of the low-cohesion ingredients such as corn flour, corn gluten meal, and beet pulp. The low cohesion of these other ingredients was also discussed earlier in the context of particulate flow energy of formulations versus individual animal protein meals. At the maximum normal stress of 15 kPa, the CF formulation had the highest compressibility (30.5%) and BSFL the lowest (23.7%), while PM and FM had intermediate compressibility (27.3% and 26.9%, respectively). These data confirmed the key role of cohesion in particulate rheology. Compressibility is also an important factor in the variability of raw material flow rate delivered by the feeder screw during extrusion, in the absence of a gravimetric feeding system. Variation in the feeding bin fill level compacts the material at the bottom to different degrees, which in turn leads to changes in the feed rate as the bin empties out during the course of processing. Extruder feeder screw calibration data indirectly confirmed these trends, with the feed rate at an average of 9.7% greater with the feeding bin filled to the top versus almost empty, in the case of the more compressible CF formulation, while this difference was reduced to 7.0% in the case of BSFL formulation.
As expected, the compressibility of formulations used in Experiment 2, incorporating different ratios of BSFL meal and poultry meal, followed the trends seen for the individual meals, ranging between 23.7% and 27.8% at the maximum applied normal stress of 15 kPa (Figure 4b). Although differences were not very pronounced, compressibility was lower for the 20–30% BSFL meal in the formulation and increased as more poultry meal replaced the BSFL meal in the 10BSFL and 0BSFL formulations. This was due to the higher compressibility of poultry meal as compared to BSFL meal. Similarly, calibration data showed a 7.7% higher feed rate at an average with higher bin fill in the case of 0BSFL, while this difference was reduced to 7.0% for 30BSFL due to lower compressibility.

3.3. Extrusion Process Parameters

3.3.1. Specific Thermal Energy and Steam Loss

The rate of steam loss or unabsorbed steam in the preconditioner, using mass balance procedures, and the specific thermal energy input in the preconditioner, using energy balance, were calculated for the most distinct formulations in both experiments from the point of view of flowability, viz., CF and BSFL for Experiment 1 and 0BSFL and 30BSFL for Experiment 2 (Table 9).
The proportion of steam lost to the atmosphere during preconditioning or the unabsorbed steam was found to be very high (50.2–54.1%). To the best knowledge of the authors, such data have rarely been reported in the literature; however, steam generation costs are usually substantial. It can be critical for industry, from the point of view of process efficiency, economics, and sustainability, to optimize the hardware and process to increase preconditioning efficiency and reduce energy input and wastage.
When comparing formulations with different animal protein meals (Experiment 1), a slightly higher steam loss (54.1%) was observed for BSFL as compared to CF (52.4%). Two factors might have contributed to this trend: one, the capacity of steam absorption or water sorption due to differences in surface chemistry and particle size distribution, and two, the degree of fill and residence time in the preconditioner. While the former was not investigated in this study, the latter is likely a contributing factor. The higher flowability of BSFL led to a lower fill or bed depth of the material in the preconditioner, thus reducing contact with steam being injected from the bottom. Higher flowability also lowers the residence time of the material in the preconditioner, leading to less opportunity for steam absorption. The net result was a lower specific thermal energy input for BSFL (201.6 kJ/kg) as compared to CF (216.7 kJ/kg), and consequently, small but perceptible differences in the preconditioner discharge temperature (96.2 °C and 98.1 °C, respectively). This might have led to differences in starch gelatinization and other transformations, which are critical factors in downstream processing in the extruder barrel and final product quality [33]. An increase in the BSFL level from 0 to 30% at the expense of poultry meal (Experiment 2) also had the effect of slightly increasing steam loss from 50.2 to 54.1%, reducing STE from 216.2 to 201.6 kJ/kg and the preconditioner discharge temperature from 98.1 to 96.2 °C. Similar to the reasoning offered above, the higher flowability of 30BSFL as compared to 0BSFL was a likely reason for these trends.
Studies that report STE in the extrusion processing of dog or cat food are few [30,33,34]. Compared with the data from this work, STE in the previous studies had a wider range from 161 to 430 kJ/kg, depending on raw material characteristics and variables such as feed rate, mash moisture content, and target discharge temperature. Preconditioner steam loss up to 37% has been previously observed by our group for a cat food extrusion study [30]. For the formulations investigated in this study, the total specific energy input in the process, including the mechanical energy, which is described in the next section, ranged from 447.7 to 466.3 kJ/kg. The proportion of STE as compared to total specific energy input was substantial and ranged from 43.7 to 48.4%, which highlighted the important role of thermal energy in pet food extrusion.

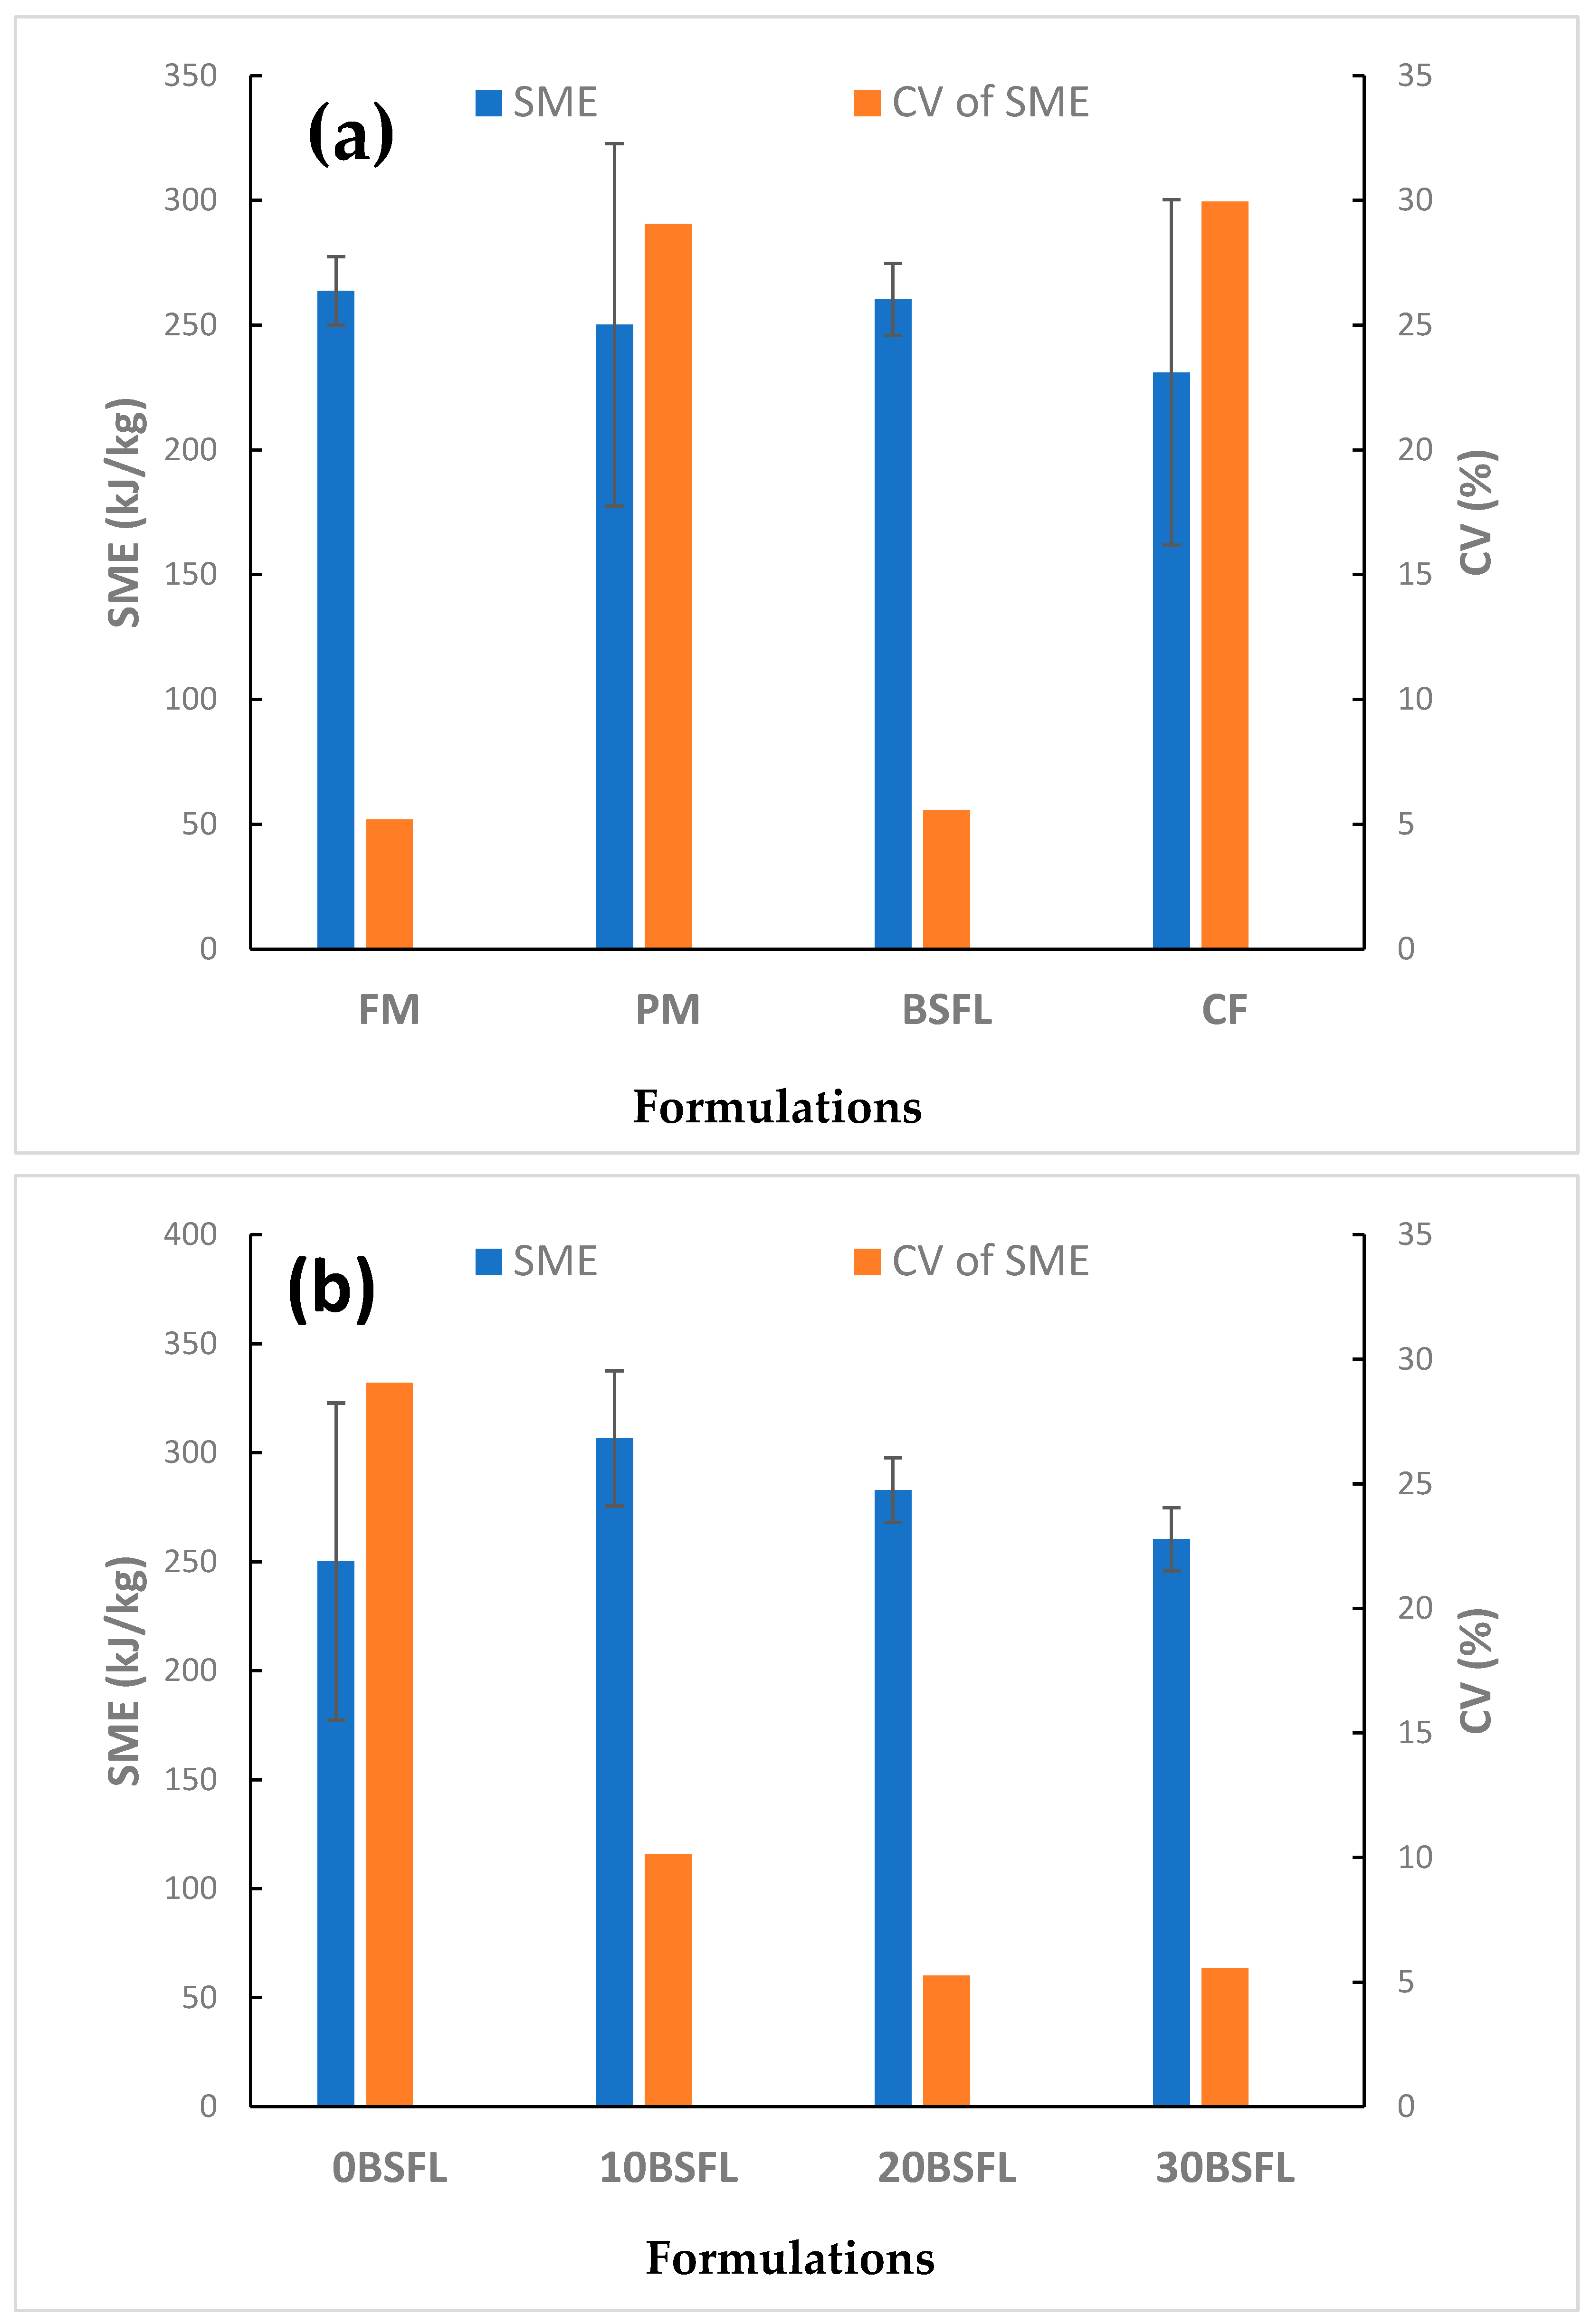
3.3.2. Specific Mechanical Energy and Die Temperature

SME input during extrusion of formulations with different animal protein meals (Experiment 1) varied from 231.0 to 263.7 kJ/kg, as shown in Figure 5a. CF had the lowest SME because of its highest fat content among all the protein meals, which led to excessive lubrication and low friction. Reduced friction between the material, screw surface, and barrel wall directly impact the mechanical energy, besides viscosity of the material and process parameters [35,36,37]. PM had a relatively low SME as well, while the BSFL and FM treatments had the highest SME due to the low-fat content of black soldier fly larvae and fish meals, respectively. SME during extrusion of formulations with different levels of BSFL meal (Experiment 2) ranged between 250.2 and 306.6 kJ/kg, as can be seen in Figure 5b. The 0BSFL formulation had the lowest SME due to the relatively high fat content of poultry meal, while the use of 10–30% BSFL meal led to higher SME input. Compared with the data from this work, much lower SME ranges (38.9–210.7 kJ/kg) have been reported in previous research on pet food extrusion [30,33,34]. The use of a wattmeter for the calculation of SME in this study is a more reliable and direct technique than other indirect methods based on the measurement of electrical current that have been employed previously.
The die temperature measured directly upstream of the extruder die for Experiments 1 and 2 is shown in Figure 6. The die temperature in the case of formulations with different animal protein meals ranged from 123.9 to 136.6 °C and closely mirrored the trends that were observed for SME input. The highest temperature at the die was observed for the BSFL treatment, which also had the most SME. On the other hand, the lowest die temperatures were observed for CF and PM, having the least SME. The material in the extruder barrel gets heated up due to mechanical energy input, and the higher the SME input, the higher the final temperature would be close to the extruder discharge, as long as the specific heats of the material and in-barrel process moisture did not vary much between treatments. Die temperature for treatments with varying levels of BSF meal (123.9–140.8 °C) also followed the corresponding SME trends. Processing of formulation with 10–30% BSFL meal led to higher die temperature as compared to the formulation with no BSFL meal, with the latter also having the least SME. The difference in throughput between treatments might have been another factor impacting the die temperature trends, as it impacts pressure build up at the die inlet, which in turn dissipates into heat. For example, the higher throughput for FM and BSFL treatments due to better flowability of the formulations, as compared to the CF and PM, might have contributed to the higher die temperature in the former, besides the SME effect.
Process stability is essential for quality control and uniformity of the final product with regard to kibble appearance, palatability, and nutrient digestibility. The coefficient of variation or CV of SME (CVSME) is a good measure of the constancy or stability of the extrusion process and is shown for the two experiments in Figure 5. In Experiment 1, the largest CVSME was observed for CF and PM treatments (29–30%), which indicated relatively high process instability. Surging of flow at the extruder discharge was very noticeable for CF and PM, as observed visually, and matched these data well. This was attributed to the high fat content of these two formulations, which caused slippage in the barrel. These observations and data also corresponded with particulate rheology and flow visualization data that pointed to the poorest flowability for CF and PM. On the other hand, BSFL and FM treatments had a very low CVSME of 5–6% with no visual observations of surging, indicating a very stable process. This corresponded well with particulate rheology and flow visualization data. In the last section of the extruder, where maximum mechanical energy is generated, the material is fluidized and not particulate in nature. However, it is apparent that consistency of flow or lack thereof has an important role in sections much upstream of the extruder discharge, where a granular flow regime exists. In Experiment 2, the 0BSFL treatment had the highest CVSME of 29% due to the poor flowability of poultry meal. A declining trend was observed with an increase in the BSFL meal level, as expected with the lowest CVSME of 5–6% for 10BSFL and 30BSFL treatments.
The differences in the coefficient of variation of SME between treatments were also transferred to the trends observed for the coefficient of variation of die temperature CVtemp, as can be seen from Figure 6. In Experiment 1, CVtemp was highest for CF and PM (3.0–4.2%) and lowest for FM and BSFL (1.0–2.7%). Similarly, CVtemp was highest for 0BSFL (3.0%), and declined to 1.0% as the BSFL meal level in the formulation increased to 30%. SME and die temperature, and also their respective coefficient of variations, along with raw material characteristics, had a clear impact on the macrostructural characteristics of extruded dog food kibbles and their uniformity, as discussed next.

3.4. Kibble Macrostructure

3.4.1. Bulk Density

Product bulk density data for treatments with different animal protein meals are shown in Table 10. The pre-dryer or wet kibble bulk density (304.2–382.5 g/L) was within the typically targeted range of 300–400 g/L for optimal dog food textural hardness, and the formulation had a significant statistical impact (p = 0.0131). The post-dryer or dry kibble bulk density was lower (286.7–306.2 g/L) due to the moisture loss during the drying process dominating over the phenomenon of product shrinkage, and the broader trends between treatments were maintained, but the differences were no longer significant (p = 0.7917). For isolating the impact of extrusion on the dynamics of structure formation, the discussion will focus on the wet bulk density.
Product expansion is inversely proportional to bulk density, although factors such as kibble size, shape, packing, moisture content, and composition can have a role as well. Expansion is a function of product temperature and material properties at the extruder discharge. The former directly impacts water vapor pressure developed inside the nucleated air cells inside the product matrix, which is the driving force for expansion. Specific mechanical energy is an important determinant of the product temperature. Material properties like matrix extensibility also play a key role, as lacking that expansion has a negative impact [27]. The FM treatment had the highest SME and die temperature, while PM had a very low SME and die temperature; yet these two had the highest kibble expansion and least wet bulk density (304.2–305.7 g/L). The high amount of corn flour (45.6–46.8%) in these formulations provided adequate starch for good extensibility and dampened the impact of the contrasting driving force for expansion. Similarly, matrix extensibility had a big role in impacting expansion for the BSFL treatment. Its lowest corn flour (39.5%) and high chitin content lowered the extensibility and led to relatively high wet bulk density (328.2 g/L), even though it had high SME and also the highest die temperature of all treatments. On the other hand, CF formulation had the highest corn flour (51.2%), but it still had the lowest kibble expansion and highest wet bulk density (382.5 g/L) of all treatments. Its high fiber and fat might have negatively impacted extensibility and, compounded with the least SME and die temperature of all treatments (although only marginally lower than PM), led to low expansion.
BSFL meal level in the formulation did not have a significant effect on either wet kibble bulk density (287.3–328.2 g/L) or dry bulk density (258.7–300.3 g/L), as shown in Table 11. However, clear trends were observed, with the highest levels of BSFL meal (20–30%) leading to greater wet bulk density and also poor quality and irregular-shaped kibbles with sharp edges as compared to lower levels of BSFL meal (0–10%). The process and matrix-related factors described earlier impacted kibble expansion and overall quality when black soldier fly larvae meal was included in the formulation.
The coefficient of variation of bulk density (CVBD) is a measure of the bulk product consistency and is shown for the two experiments in Table 12 and Table 13. In Experiment 1, the highest CVBD for wet product was observed for PM (14.0%), followed by CF (5.6%). It is clear that the inconsistencies in flow, SME, and die temperature in the case of these two treatments were transferred to variations in product bulk density. On the other hand, FM and BSFL had the least wet product CVBD of 0.7% and 1.8%, respectively. In Experiment 2, the 10BSFL, 20BSFL, and 30 BSFL products had a much lower wet product CVBD (0.6–2.4%) than the control 0BSFL product (14.0%). This is due to the reduced process instability and surging with any level of BSFL meal inclusion (10–30%) to partially or fully replace poultry meal in the formulation. Similar CV trends were observed for dry product bulk density in both experiments. It should, however, be emphasized that CVBD related to the product in bulk, whereas piece-wise variability, especially with regard to higher levels of BSFL meal inclusion, had different results, as described later.

3.4.2. Piece Measurements

Product macrostructure data based on individual kibble measurements are shown in Table 12 and Table 13. Piece density (ρ) was significantly impacted by treatment (p < 0.0001), with trends loosely following that of bulk density for both Experiments 1 and 2, with the difference that the coefficient of variation (CVρ) was, in general, higher than that for bulk density (CVBD). This was expected, as more variability between individual pieces is typical, as compared to bulk measurements. However, the much larger increase in CVρ for BSFL treatment relative to its CVBD in Experiment 1 was reflective of the very irregular individual kibble shapes due to black soldier fly larvae meal inclusion and a low amount of corn flour. This was also noticeable in Experiment 2, with the inclusion of 20–30% BSFL meal, but not in the case of the 0–10% BSFL meal inclusion. In Experiment 1, ρ was higher for BSFL and CF (0.426–0.556 g/cm3) as compared to FM and PM (0.342–0.396 g/cm3). PM, with the least ρ and thus the highest piece-wise volumetric or overall expansion, had the largest sectional expansion ratio (ER) of 3.02 and also the lowest specific length (Lsp) of 2.55 cm/g. This indicated that the radial expansion perpendicular to the direction of extrusion dominated over longitudinal expansion. BSFL with the highest ρ had the lowest ER (1.22) and largest Lsp (3.89 cm/g), with kibbles clearly more elongated in the direction of extrusion due to the fibrous chitin component. The latter trend was also observed in Experiment 2, where volumetric expansion (ρ = 0.342–0.556 g/cm3) and radial expansion (ER = 1.22–3.02) decreased with the addition of 10–30% BSFL meal, while longitudinal expansion (Lsp = 2.55–3.89 cm/g) increased. Fiber particles have been shown to reduce radial expansion and increase longitudinal expansion due to the reduction in matrix extensibility and elasticity of the matrix and alignment in the directions of the shear field during extrusion [27].

3.5. Texture Analysis

Palatability and preference of commercial dog food are influenced by various complex and overlapping factors, including flavor, dry versus canned or semi-moist foods, and even social factors such as attachment to the family [38]. In the case of dry expanded dog foods, kibble texture and hardness can also have a role. The texture analyzer peak crushing force data for kibbles under compression are shown in Table 14. Peak force, indicative of hardness, was significantly (p < 0.0001) affected by the type of animal protein meal and also by different levels of BSFL meal inclusion. Two main factors impact the mechanical strength of brittle and porous extruded products, viz., their piece density or extent of porosity and the mechanical strength of the matrix material [36,39,40]. Typically, the lower the porosity or the higher the piece density, the more difficult it is to crush the product, and thus, the higher the hardness. This relationship is tempered by differences in the solid material making up the product matrix, as a weak or poorly binding material reduces the hardness. Both factors had a role in impacting the peak crushing force of dog food kibbles. From the piece density data described earlier, it can be inferred that the kibbles from the BSFL treatment would be the hardest, while CF would also be relatively harder than the FM and PM kibbles, as the latter had the most porosity. However, the lowest starch content in the BSFL formulation led to weak and poorly binding matrix material. This was compounded by the high specific length of the kibbles that made the product anisotropically weaker while being compressed in the longitudinal direction. Resultingly, BSFL kibbles, contrary to expectations, fractured easily on compression and had the lowest peak force of 6.55 kg. The rest of the treatments mostly followed the piece density trends, with CF kibbles being the hardest, having a peak force of 13.72 kg, and PM and FM the least hard, having a peak force of 11.45 and 8.4, respectively. The hardness of CF kibbles was reinforced due to the highest starch content from corn flour, while that of FM kibbles was further dampened because of the marginally higher specific length. In Experiment 2, the role of matrix material strength and structural anisotropy had a predominant role as compared to piece density in determining the kibble hardness. Product hardness was significantly reduced from 11.45 kg to 6.55 kg as the BSFL meal level increased from 0 to 30%, due to a decrease in starch content, leading to reduced binding of the matrix and an increase in specific length.
Notably, peak force data had high variability in both experiments, with the coefficient of variation (CVF) ranging from 18.7 to 40.1%. Understandably, the CVF was at least partly related to variability in the piece density. For example, the highest overall CVF was observed for 0BSFL (or PM) kibbles and the lowest for 10BSFL, which also had the highest and lowest overall CVρ, respectively.

4. Conclusions

The particulate flow of various formulations impacted the stability of the extrusion process and the dry expanded dog food kibble consistency and was, in turn, impacted by the flowability of individual insect protein meals and other animal protein meals used in the diets. At 30% inclusion, the use of cricket flour that had high fat content led to poor expansion and also increased kibble variability. The use of 30% black soldier fly larvae meal also led to poor expansion due to high chitin content and other compositional reasons, which also led to overall poor-quality kibbles with irregular shape and sharp edges. However, inclusion of a lower amount of BSFL meal (10%) in combination with poultry meal resulted in good expansion and kibble quality, and also low variability. Therefore, the strategy for using insect protein meals in dry expanded food might need to center on using moderate amounts to consider the detrimental effects of components such as chitin, and/or defatting the meals to reduce the fat content, besides optimizing other ingredients in the formulation and the extrusion parameters. Future work can focus on in vivo feeding trials to verify high digestibility and other nutritional attributes and fecal quality for further establishing insect meals as a good protein source in pet food diets.

Author Contributions

Conceptualization, Y.C., T.G. and S.A.; Formal analysis, Y.C., T.G., and S.A.; Investigation, Y.C., T.G., A.C.C., R.G., K.S. and J.G.P.; Methodology, S.A.; Project administration, S.A.; Resources, K.S., J.G.P., and S.A.; Writing—original draft, Y.C., T.G., A.C.C. and R.G.; Writing—review and editing, S.A. All authors have read and agreed to the published version of the manuscript.

Funding

This research received no external funding.

Data Availability Statement

The original contributions and data related to this study are included in the article. Further inquiries can be directed to the corresponding authors.

Acknowledgments

The authors would like to thank KSU Extrusion Lab operations manager Eric Maichel for his assistance with the extrusion trials.

Conflicts of Interest

The authors declare no conflicts of interest.

References

  1. Alvarenga, I.C.; Ou, Z.; Thiele, S.; Alavi, S.; Aldrich, C.G. Effects of Milling Sorghum into Fractions on Yield, Nutrient Composition, and Their Performance in Extrusion of Dog Food. J. Cereal Sci. 2018, 82, 121–128. [Google Scholar] [CrossRef]
  2. Fediaf, The European Pet Food Industry. European Facts and Figures. Available online: https://www.jardinerie-animalerie-fleuriste.fr/wp-content/uploads/2020/07/FEDIAF_Facts_and_Figures_2019_compressed.pdf (accessed on 27 February 2025).
  3. Shahbandeh, M. Number of Dogs in the United States from 2000 to 2017. Available online: https://www.statista.com/statistics/198100/dogs-in-the-united-states-since-2000/ (accessed on 27 February 2025).
  4. Shahbandeh, M. Number of Cats in the United States from 2000 to 2017. Available online: https://www.statista.com/statistics/198102/cats-in-the-united-states-since-2000/ (accessed on 27 February 2025).
  5. Kim, H.S.; Titgemeyer, E.C.; Curles, E.; Olsen, L.M.; Aldrich, C.G. Evaluation of Soybean Ingredients in Pet Foods Applications: Systematic Review. Animals 2023, 14, 16. [Google Scholar] [CrossRef] [PubMed]
  6. Van Huis, A.; Oonincx, D.G.A.B. The Environmental Sustainability of Insects as Food and Feed. A Review. Agron. Sustain. Dev. 2017, 37, 43. [Google Scholar] [CrossRef]
  7. El Hajj, R.; Mhemdi, H.; Besombes, C.; Allaf, K.; Lefrançois, V.; Vorobiev, E. Edible Insects’ Transformation for Feed and Food Uses: An Overview of Current Insights and Future Developments in the Field. Processes 2022, 10, 970. [Google Scholar] [CrossRef]
  8. Looy, H.; Dunkel, F.V.; Wood, J.R. How Then Shall We Eat? Insect-Eating Attitudes and Sustainable Foodways. Agric. Hum. Values 2014, 31, 131–141. [Google Scholar] [CrossRef]
  9. Bosch, G.; Swanson, K.S. Effect of Using Insects as Feed on Animals: Pet Dogs and Cats. JIFF 2021, 7, 795–805. [Google Scholar] [CrossRef]
  10. Siddiqui, S.A.; Brunner, T.A.; Tamm, I.; van der Raad, P.; Patekar, G.; Bahmid, N.A.; Aarts, K.; Paul, A. Insect-Based Dog and Cat Food: A Short Investigative Review on Market, Claims and Consumer Perception. J. Asia-Pac. Entomol. 2023, 26, 102020. [Google Scholar] [CrossRef]
  11. Oonincx, D.G.A.B.; De Boer, I.J.M. Environmental Impact of the Production of Mealworms as a Protein Source for Humans—A Life Cycle Assessment. PLoS ONE 2012, 7, e51145. [Google Scholar] [CrossRef]
  12. Miglietta, P.; De Leo, F.; Ruberti, M.; Massari, S. Mealworms for Food: A Water Footprint Perspective. Water 2015, 7, 6190–6203. [Google Scholar] [CrossRef]
  13. Halloran, A.; Hanboonsong, Y.; Roos, N.; Bruun, S. Life Cycle Assessment of Cricket Farming in North-Eastern Thailand. J. Clean. Prod. 2017, 156, 83–94. [Google Scholar] [CrossRef]
  14. Oonincx, D.G.A.B.; Van Broekhoven, S.; Van Huis, A.; Van Loon, J.J.A. Feed Conversion, Survival and Development, and Composition of Four Insect Species on Diets Composed of Food By-Products. PLoS ONE 2015, 10, e0144601. [Google Scholar] [CrossRef] [PubMed]
  15. Halloran, A.; Roos, N.; Eilenberg, J.; Cerutti, A.; Bruun, S. Life Cycle Assessment of Edible Insects for Food Protein: A Review. Agron. Sustain. Dev. 2016, 36, 57. [Google Scholar] [CrossRef]
  16. Koukouna, E.; Broekema, R. Carbon Footprint Assessment of Cat 3 Meal for Pet Food Applications; Blonk Consultants: Gouda, The Netherlands, 2017. [Google Scholar]
  17. Bosch, G.; Van Zanten, H.H.E.; Zamprogna, A.; Veenenbos, M.; Meijer, N.P.; Van Der Fels-Klerx, H.J.; Van Loon, J.J.A. Conversion of Organic Resources by Black Soldier Fly Larvae: Legislation, Efficiency and Environmental Impact. J. Clean. Prod. 2019, 222, 355–363. [Google Scholar] [CrossRef]
  18. Iñaki, G.-B.J.; Antonio, P.-C.G.; Efrén, D.; Hiram, M.-R.; Daniela, G.-I.; Damián, R.-J. Black Soldier Fly: Prospection of the Inclusion of Insect-Based Ingredients in Extruded Foods. Food Chem. Adv. 2022, 1, 100075. [Google Scholar] [CrossRef]
  19. Ahmed, I.; İnal, F. Replacement of Chicken Meal with Full-Fat Locust Meal in Golden Retriever Dog Food and Its Influence on Palatability, Digestibility, Fecal Quality, and Immunity. Anim. Feed Sci. Technol. 2025, 320, 116191. [Google Scholar] [CrossRef]
  20. Weththasinghe, P.; Hansen, J.Ø.; Nøkland, D.; Lagos, L.; Rawski, M.; Øverland, M. Full-Fat Black Soldier Fly Larvae (Hermetia Illucens) Meal and Paste in Extruded Diets for Atlantic Salmon (Salmo Salar): Effect on Physical Pellet Quality, Nutrient Digestibility, Nutrient Utilization and Growth Performances. Aquaculture 2021, 530, 735785. [Google Scholar] [CrossRef]
  21. Alam, M.R.; Scampicchio, M.; Angeli, S.; Ferrentino, G. Effect of Hot Melt Extrusion on Physical and Functional Properties of Insect Based Extruded Products. J. Food Eng. 2019, 259, 44–51. [Google Scholar] [CrossRef]
  22. AAFCO. Dog Food Nutrient Profiles Based on Dry Matter. In 2020 Official Publication; Association of American Feed Control Officials Inc.: Champaign, IL, USA, 2016; pp. 158–159. [Google Scholar]
  23. AACC Standard Method 76-21.02; General Pasting Method for Wheat or Rye Flour of Starch Using the Rapid Visco Analyser; AACC International Approved Methods. Cereals & Grains Association: St. Paul, MN, USA, 2009. [CrossRef]
  24. Alavi, S.; Ambrose, R.P.K. Particulate Flow and Agglomeration in Food Extrusion. In Production, Handling and Characterization of Particulate Materials; Merkus, H.G., Meesters, G.M.H., Eds.; Springer International Publishing: Cham, Switzerland, 2016; pp. 137–155. ISBN 978-3-319-20949-4. [Google Scholar]
  25. McGuire, C.; Siliveru, K.; Ambrose, K.; Alavi, S. Food Powder Flow in Extrusion: Role of Particle Size and Composition. Processes 2022, 10, 178. [Google Scholar] [CrossRef]
  26. Freeman, R.E. The Flowability of Powder-An Empirical Approach; Wiley: New York, NY, USA, 2000; pp. 545–556. [Google Scholar]
  27. Karkle, E.L.; Keller, L.; Dogan, H.; Alavi, S. Matrix Transformation in Fiber-Added Extruded Products: Impact of Different Hydration Regimens on Texture, Microstructure and Digestibility. J. Food Eng. 2012, 108, 171–182. [Google Scholar] [CrossRef]
  28. Rojas-Molina, I.; Mendoza-Avila, M.; Cornejo-Villegas, M.A.; Del Real-López, A.; Rivera-Muñoz, E.; Rodríguez-García, M.; Gutiérrez- Cortez, E. Physicochemical Properties and Resistant Starch Content of Corn Tortilla Flours Refrigerated at Different Storage Times. Foods 2020, 9, 469. [Google Scholar] [CrossRef]
  29. Jiménez, B.C.; Toledo, M.E.O.; Mier, L.G.; Bravo, R.M.; Gutiérrez, C.A.G.; Ayala, F.C.; Rodriguez-Garcia, M.E. Physicochemical Study of Nixtamalized Corn Masa and Tortillas Fortified with “Chapulin” (Grasshopper, Sphenarium purpurascens) Flour. CyTA-J. Food 2020, 18, 527–534. [Google Scholar] [CrossRef]
  30. Maichel, E.W. Use of Grain Sorghum as the Primary Grain Ingredient in Premium Extruded Foods Designed for Cats. Master’s Thesis, Kansas State University, Manhattan, KS, USA, 2021. [Google Scholar]
  31. Rokey, G.J. Single-Screw Extruders. In Extruders in Food Applications; CRC Press: Boca Raton, FL, USA, 2000; ISBN 978-0-429-16556-6. [Google Scholar]
  32. Buschow, K.H.J. Encyclopedia of Materials: Science and Technology; Elsevier: Amsterdam, The Netherlands, 2001. [Google Scholar]
  33. Pacheco, P.D.G.; Putarov, T.C.; Baller, M.A.; Peres, F.M.; Loureiro, B.A.; Carciofi, A.C. Thermal Energy Application on Extrusion and Nutritional Characteristics of Dog Foods. Anim. Feed Sci. Technol. 2018, 243, 52–63. [Google Scholar] [CrossRef]
  34. Monti, M.; Gibson, M.; Loureiro, B.A.; Sá, F.C.; Putarov, T.C.; Villaverde, C.; Alavi, S.; Carciofi, A.C. Influence of Dietary Fiber on Macrostructure and Processing Traits of Extruded Dog Foods. Anim. Feed Sci. Technol. 2016, 220, 93–102. [Google Scholar] [CrossRef]
  35. Huber, G.R. Twin-Screw Extruders. In Extruders in Food Applications; CRC Press: Boca Raton, FL, USA, 2000; ISBN 978-0-429-16556-6. [Google Scholar]
  36. Agbisit, R.; Alavi, S.; Cheng, E.; Herald, T.; Trater, A. Relationships Between Microstructure and Mechanical Properties of Cellular Cornstarch Extrudates. J. Texture Stud. 2007, 38, 199–219. [Google Scholar] [CrossRef]
  37. Kantrong, H.; Charunuch, C.; Limsangouan, N.; Pengpinit, W. Influence of Process Parameters on Physical Properties and Specific Mechanical Energy of Healthy Mushroom-Rice Snacks and Optimization of Extrusion Process Parameters Using Response Surface Methodology. J. Food Sci. Technol. 2018, 55, 3462–3472. [Google Scholar] [CrossRef]
  38. Houpt, K.A.; Smith, S.L. Taste Preferences and Their Relation to Obesity in Dogs and Cats. Can. Vet. J. 1981, 22, 77–81. [Google Scholar]
  39. Gibson, L.G.; Ashby, M.F. Cellular Solids: Structure and Properties; Cambridge University Press: Cambridge, UK, 1997. [Google Scholar]
  40. Warburton, S.C.; Donald, A.M.; Smith, A.C. Structure and Mechanical Properties of Brittle Starch Foams. J. Mater. Sci. 1992, 27, 1469–1474. [Google Scholar] [CrossRef]
Figure 1. Pilot-scale single-screw extruder screw profile and set barrel temperatures. 1 = inlet screw; 2 = single-flight full-pitch screw; 3 = small steam lock; 4 = single-flight full-pitch screw; 5 = small steam lock; 6 = double-flight half-pitch screw; 7 = medium steam lock; 8 = double-flight half-pitch screw; 9 = large steam lock; 10 = double-flight half-pitch cone screw.
Processes 13 02083 g001
Figure 2. Average RVA pasting profiles of formulations with (a) different animal protein meals at 30% (Experiment 1) and (b) different levels of BSFL meal (Experiment 2).
Processes 13 02083 g002
Figure 3. Snapshots of pilot-scale single-screw extruder barrel flow visualization tests for formulations with different types of animal protein meals.
Processes 13 02083 g003
Figure 4. Compressibility versus applied normal stress for formulations with (a) different animal protein meals (Experiment 1) and (b) different levels of BSFL meal (Experiment 2).
Processes 13 02083 g004
Figure 5. Specific mechanical energy (SME) and its coefficient of variation (CVSME) during extrusion of formulations with (a) different animal protein meals (Experiment 1) and (b) different levels of BSFL meal (Experiment 2).
Processes 13 02083 g005
Figure 6. Die temperature and its coefficient of variation (CVtemp) during extrusion of formulations with (a) different animal protein meals (Experiment 1) and (b) different levels of BSFL meal (Experiment 2).
Processes 13 02083 g006
Table 1. Proximate analysis of different animal protein meals used in the study.
Proximate (% wb)Fish MealPoultry MealBSFL MealCricket Flour
Moisture8.65.76.1<4.0%
Crude protein63.565.352.667
Crude fat9.211.68.718.1
Fiber *0.40.859.56.7
Ash2015.2511.94.7
* Refers to crude fiber, except in the case of cricket flour, where data reported is total dietary fiber.
Table 2. Target post-coating nutrient content of diets with different animal protein meals (Experiment 1) *.
FMPMBSFLCF
Dry matter (DM), %90.791.891.591.3
Crude protein, % DM32.532.532.532.7
Crude fat, % DM1112.111.09.9
Ash, % DM7.68.05.63.4
Crude fiber, % DM2.42.55.03.1
* Diets coded based on primary protein source: FM = fish meal, PM = poultry meal, BSFL = black soldier larvae meal, and CF = cricket flour.
Table 3. Extruded formulations with different animal protein meals (Experiment 1) *.
Ingredients (%)FMPMBSFLCF
Fish meal32.30.00.00.0
Poultry meal0.032.30.00.0
BSFL meal0.00.032.30.0
Cricket powder0.00.00.030.9
Corn46.845.639.551.2
Corn gluten meal, 60%15.816.923.112.9
Beet pulp4.14.14.13.9
Salt0.30.30.30.3
Vitamin & trace mineral premixes0.30.30.30.3
Calcium carbonate0.20.20.20.2
Potassium chloride0.20.20.20.2
Antioxidant0.10.10.10.1
Choline chloride, 60%0.10.10.10.1
Total100.0100.0100.0100.0
* Formulations coded based on primary protein source: FM = fish meal, PM = poultry meal, BSFL = black soldier larvae meal, and CF = cricket flour.
Table 4. Target post-coating nutrient content of diets with different BSFL meal levels (Experiment 2) *.
0BSFL10BSFL20BSFL30BSFL
Dry matter (DM), %91.891.791.691.5
Crude protein, % DM32.532.532.532.5
Crude fat, % DM12.111.611.211.0
Ash, % DM8.07.26.45.6
Crude fiber, % DM2.53.34.15.0
* Diets coded as xBSF based on primary protein source, where BSFL = black soldier larvae meal and x = % BSF in the diet.
Table 5. Extruded formulations with different BSFL meal levels (Experiment 2) *.
Ingredients (%)0BSFL10BSFL20BSFL30BSFL
BSFL meal0.010.821.532.3
Poultry meal32.321.510.80.0
Corn45.643.741.739.5
Corn gluten meal, 60%16.918.920.923.1
Beet pulp4.14.14.14.1
Salt0.30.30.30.3
Vitamin & trace mineral premixes0.30.30.30.3
Calcium carbonate0.20.20.20.2
Potassium chloride0.20.20.20.2
Antioxidant0.10.10.10.1
Choline chloride, 60%0.10.10.10.1
Total100.0100.0100.0100.0
* Formulations coded based on primary protein source: xBSFL, where BSFL = black soldier larvae meal and x = % BSF in the final product.
Table 6. Pasting temperature and peak viscosity of formulations with different animal protein meals (Experiment 1) and different levels of BSFL meal (Experiment 2).
Exp 1Pasting Temp (°C)Peak Viscosity (cP)Exp 2Pasting Temp (°C)Peak Viscosity (cP)
FM80.1 ± 0.2246 ± 240BSFL78.5 ± 0.2274 ± 7
PM78.5 ± 0.2274 ± 710BSFL79.7 ± 0.2154 ± 7
BSFL80.7 ± 0.4190 ± 620BSFL80.5 ± 0.6188 ± 22
CF79.0 ± 0.6220 ± 2430BSFL80.7 ± 0.4190 ± 6
Table 7. Particulate flow energy of different animal protein meals used in the study.
IngredientsSBFE (mJ/g)SE (mJ/g)
Fish meal12.78 ± 0.15 c4.95 ± 0.14 c
Poultry meal14.06 ± 0.17 b7.55 ± 0.06 a
BSFL meal11.50 ± 0.49 d5.31 ± 0.03 b
Cricket flour15.10 ± 0.46 a5.29 ± 0.20 b
p-value<0.0001<0.0001
abcd Means within a column lacking a common superscript letter are different (p < 0.05).
Table 8. Particulate flow energy of formulations with different animal protein meals at 30% (Experiment 1) and different levels of BSFL meal (Experiment 2).
Exp 1SBFE (mJ/g)SE (mJ/g)Exp 2SBFE (mJ/g)SE (mJ/g)
FM11.87 ± 0.03 b6.00 ± 0.12 bc0BSFL11.99 ± 0.24 a6.92 ± 0.10 a
PM11.99 ± 0.24 b6.92 ± 0.10 a10BSFL10.76 ± 0.17 b5.87 ± 0.16 b
BSFL10.34 ± 0.47 c5.68 ± 0.14 c20BSFL10.72 ± 0.14 b5.78 ± 0.13 b
CF12.84 ± 0.23 a6.12 ± 0.14 b30BSFL10.34 ± 0.47 b5.68 ± 0.14 b
p-value<0.0001<0.0001p-value0.0005<0.0001
abc Means within a column lacking a common superscript letter are different (p < 0.05).
Table 9. Steam loss expressed as % of total steam injected, specific thermal energy input, and preconditioner discharge temperature during processing of different dog food formulations.
Exp 1Steam Loss
(%)
STE
(kJ/kg)
PC Temp
(°C)
Exp 2Steam Loss
(%)
STE
(kJ/kg)
PC Temp
(°C)
CF52.4216.798.10BSFL50.2216.298.1
BSFL54.1201.696.230BSFL *54.1201.696.2
* 30BSFL is the same formulation and treatment as the one labeled as BSFL for Experiment 1.
Table 10. Kibble bulk density and its coefficient of variation for treatments with different animal protein meals (Experiment 1).
DietsWet Bulk Density (g/L)CV (%)Dry Bulk Density (g/L)CV (%)
FM304.2 ± 2.0 b0.7286.7 ± 6.82.4
PM305.7 ± 42.8 b14.0300.3 ± 47.415.8
BSFL328.2 ± 5.8 ab1.8293.0 ± 3.31.1
CF382.5 ± 21.5 a5.6306.2 ± 13.84.5
p-value0.0131-0.7917-
ab Means within a column lacking a common superscript letter are different (p < 0.05).
Table 11. Bulk density of kibbles and coefficient of variation for treatments with different levels of BSFL meal (Experiment 2).
Wet Bulk Density (g/L)CV (%)Dry Bulk Density (g/L)CV (%)
0BSFL305.7 ± 42.814.0300.3 ± 47.415.8
10BSFL287.3 ± 1.80.6258.7 ± 9.53.7
20BSFL341.8 ± 8.32.4298.8 ± 6.12.0
30BSFL328.2 ± 5.81.8293.0 ± 3.31.1
p-value0.0653-0.2024-
Table 12. Piece density (ρ), sectional expansion ratio (ER), and specific length (lsp) of dry kibbles with different animal protein meals (Experiment 1) and the respective coefficient of variation (CV).
ρ
(g/cm3)
CVρ
(%)
ERCVER
(%)
Lsp
(cm/g)
CVL
(%)
FM0.396 ± 0.048 c12.82.27 ± 0.20 b8.82.88 ± 2.48 b8.8
PM0.342 ± 0.058 d17.03.02 ± 0.43 a14.22.55 ± 2.98 c11.7
BSFL0.556 ± 0.087 a15.71.22 ± 0.21 c17.23.89 ± 4.19 a10.8
CF0.426 ± 0.069 b17.02.38 ± 0.30 b12.62.58 ± 2.28 c9.6
p-value<0.0001 <0.0001 <0.0001
abcd Means within a column lacking a common superscript letter are different (p < 0.05).
Table 13. Piece density (ρ), sectional expansion ratio (ER), and specific length (lsp) of dry kibbles with different levels of black soldier fly larvae meal (Experiment 2) and the respective coefficient of variation (CV).
ρ
(g/cm3)
CVρ
(%)
ERCVER
(%)
Lsp
(cm/g)
CVL
(%)
0BSFL0.342 ± 0.058 b17.03.02 ± 0.42 a14.22.55 ± 2.98 d11.7
10BSFL0.344 ± 0.023 b6.92.45 ± 0.27 b11.03.06 ± 2.44 c8.0
20BSFL0.568 ± 0.095 a15.51.29 ± 0.36 c27.93.67 ± 4.52 b12.3
30BSFL0.556 ± 0.087 a15.71.22 ± 0.21 c17.23.89 ± 4.19 a10.8
p-value<0.0001 <0.0001 <0.0001
abcd Means within a column lacking a common superscript letter are different (p < 0.05).
Table 14. Peak crushing force and coefficient of variation for kibbles with different animal protein meals (Experiment 1) and different levels of BSFL meal (Experiment 2).
Exp 1Peak Force (kg)CVF (%)Exp 2Peak Force (kg)CVF (%)
FM8.40 ± 2.01 c23.90BSFL11.45 ± 4.59 a40.1
PM11.45 ± 4.59 b40.110BSFL8.36 ± 1.56 b18.7
BSFL6.55 ± 2.01 d30.720BSFL7.15 ± 1.90 bc26.5
CF13.72 ± 3.59 a26.230BSFL6.55 ± 2.01 c30.7
p-value<0.0001 p-value<0.0001
abcd Means within a column lacking a common superscript letter are different (p < 0.05).
Disclaimer/Publisher’s Note: The statements, opinions and data contained in all publications are solely those of the individual author(s) and contributor(s) and not of MDPI and/or the editor(s). MDPI and/or the editor(s) disclaim responsibility for any injury to people or property resulting from any ideas, methods, instructions or products referred to in the content.

