
Data-Driven Framework for Mechanical Behavior Characterization from Instrumented Indentation

Abstract
1. Introduction
2. Instrumented Indentation and Computation
3. Data-Driven Indentation Computation
3.1. Reduced-Order Model
3.2. SHGO
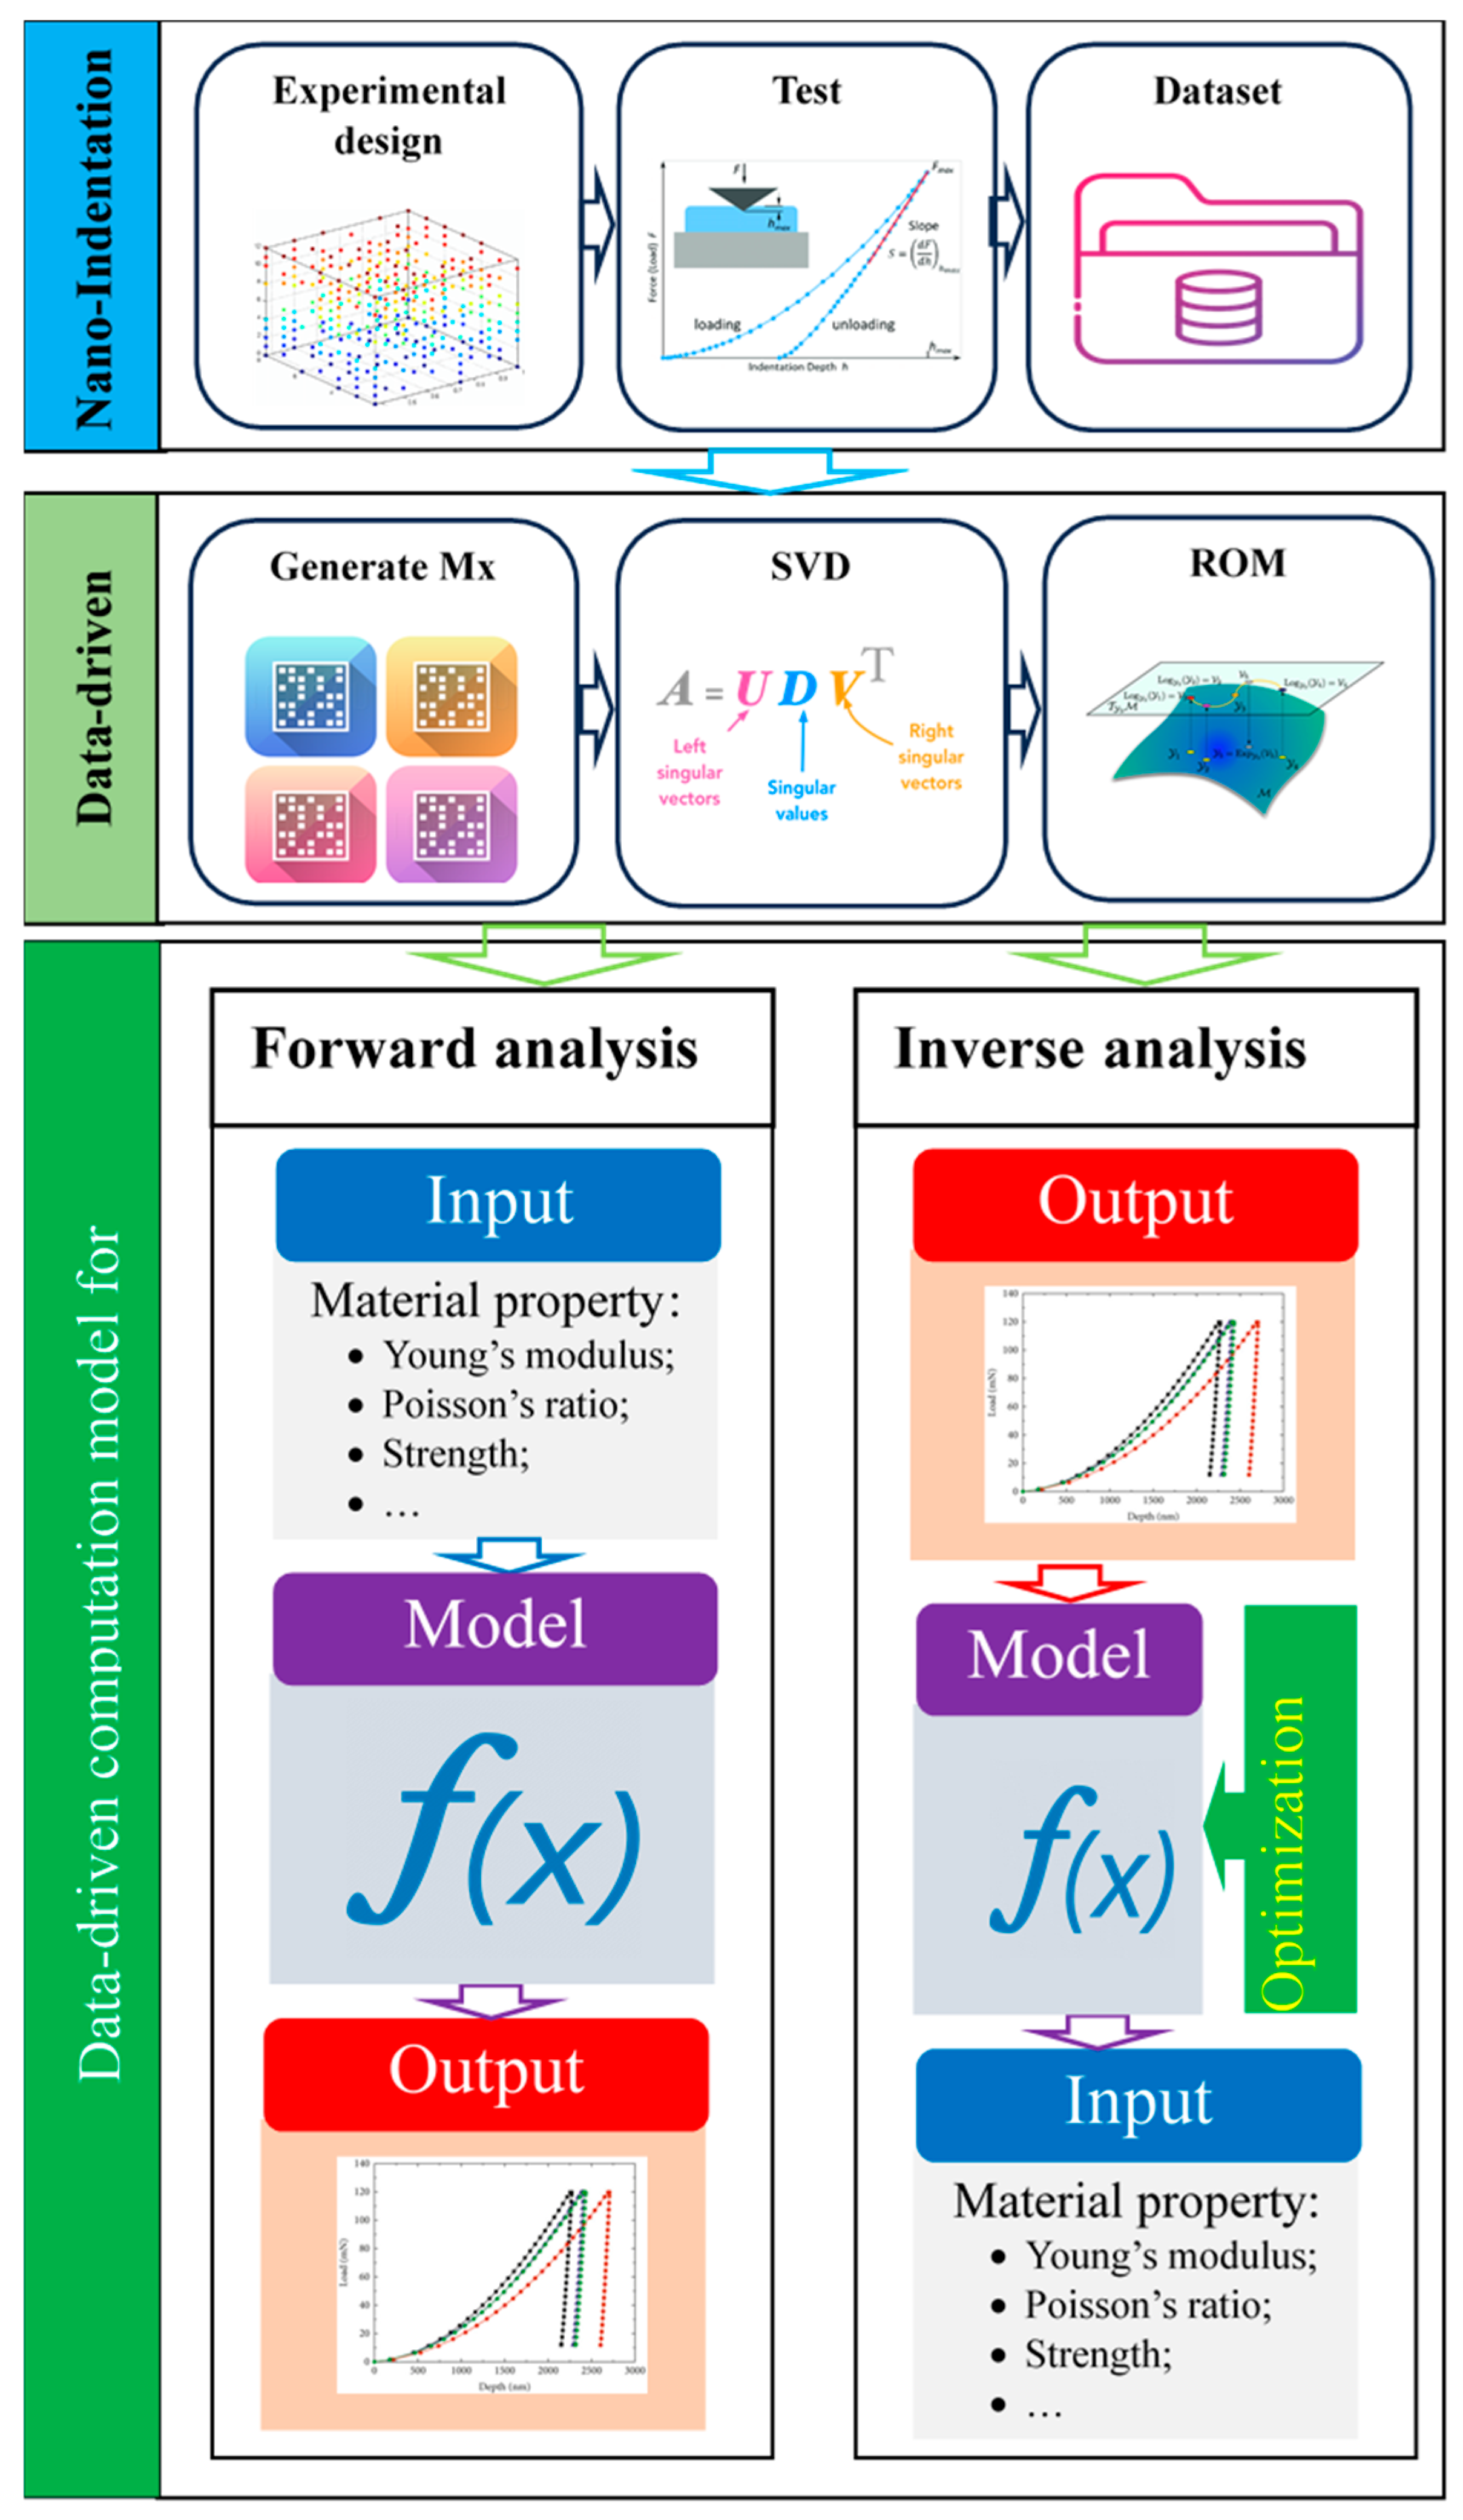
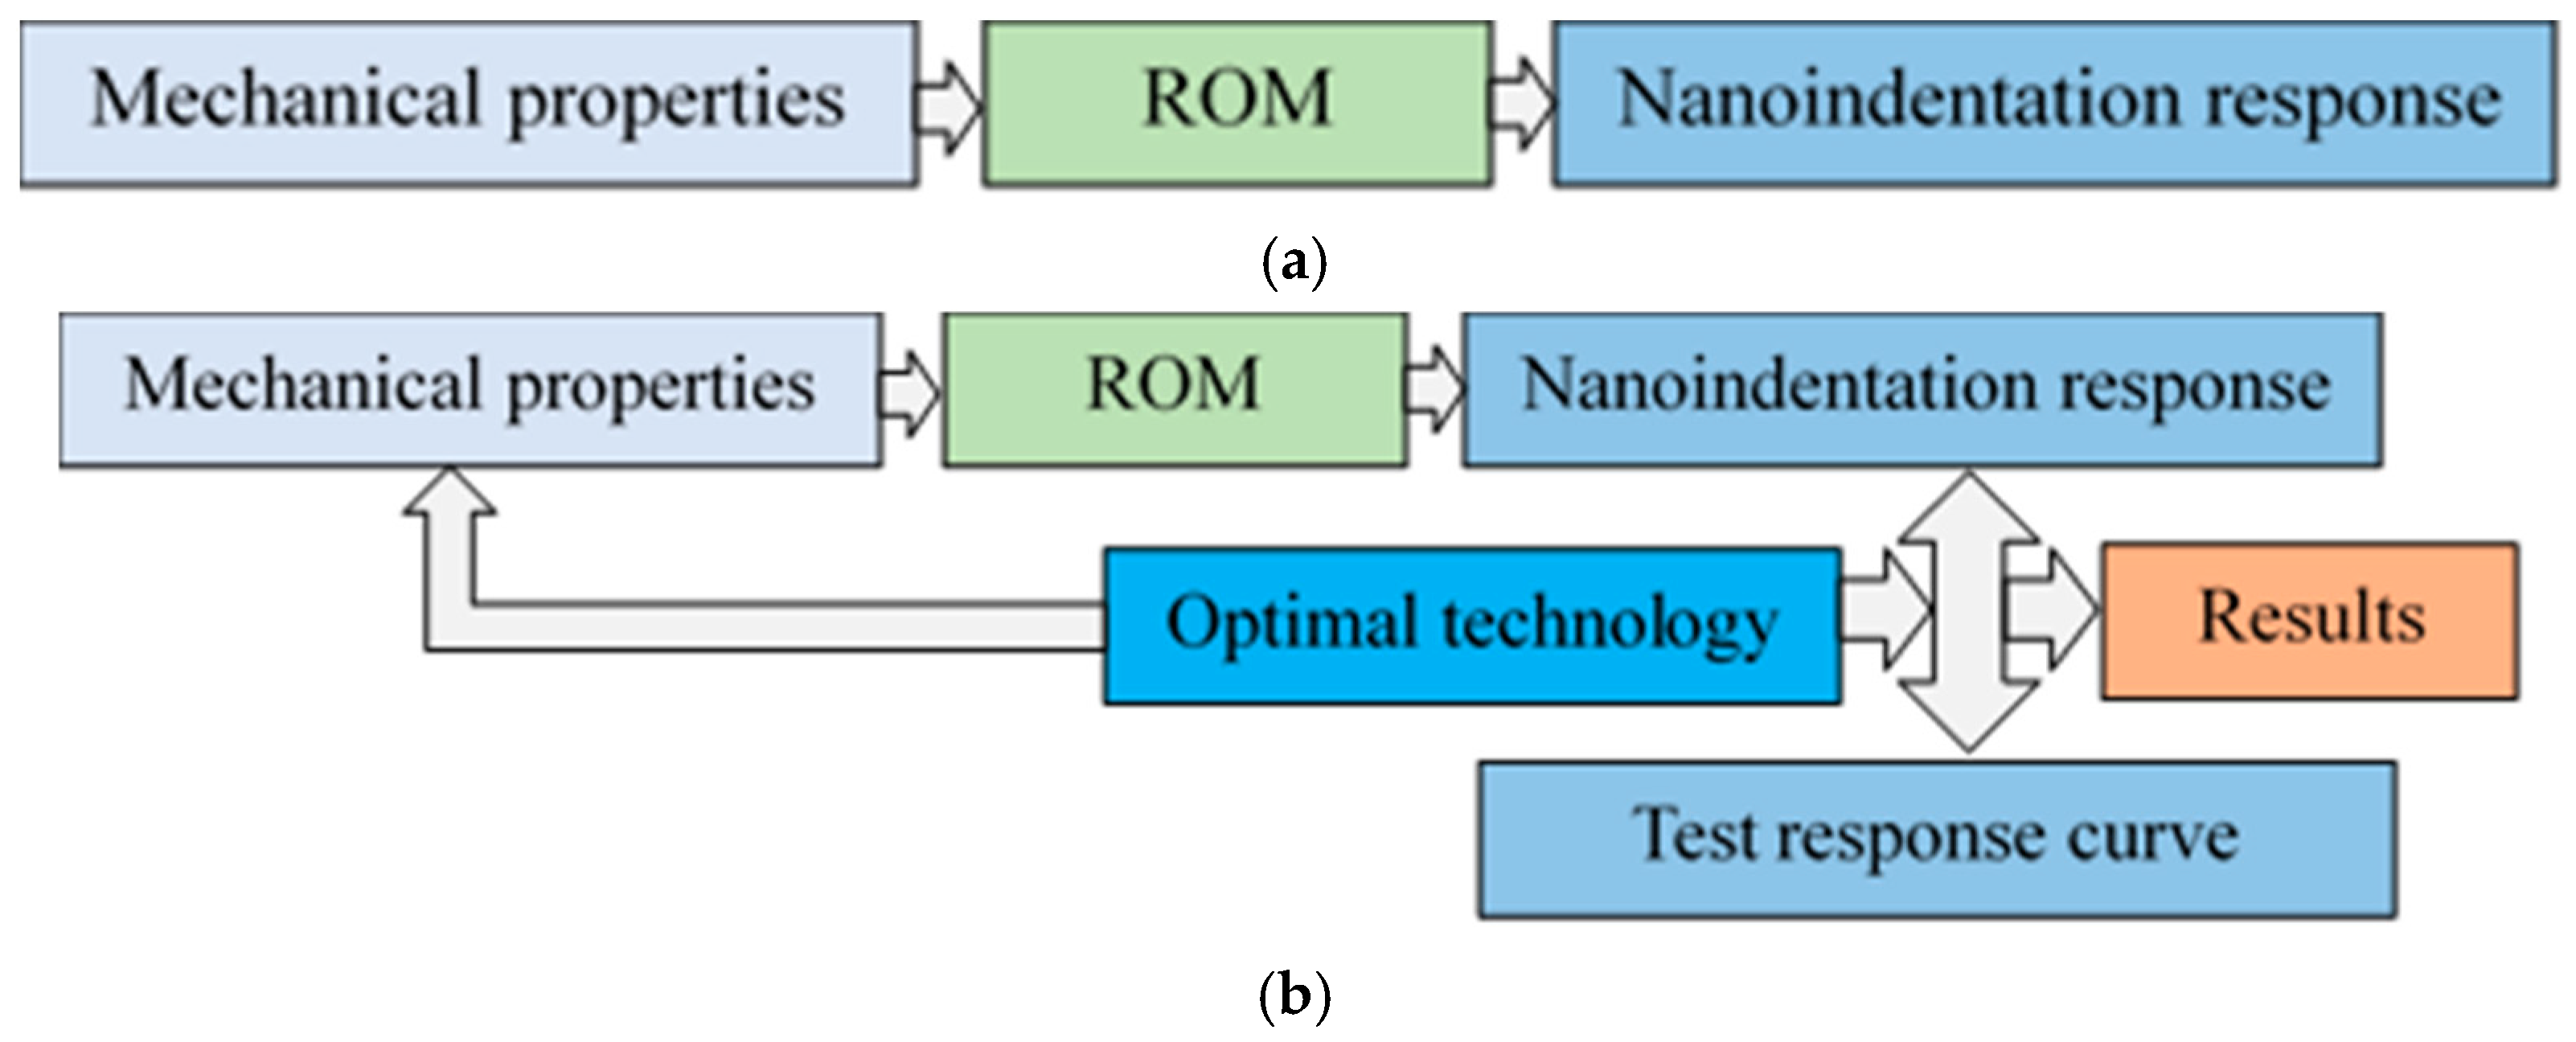
3.3. ROM Bsed Data-Driven Indentation Model
3.3.1. Data Collection
3.3.2. Forward Computation
3.3.3. Inverse Analysis
3.3.4. Objective Function
3.3.5. Procedure of the Data-Driven Indentation Computation
4. Application
5. Conclusions
- (1)
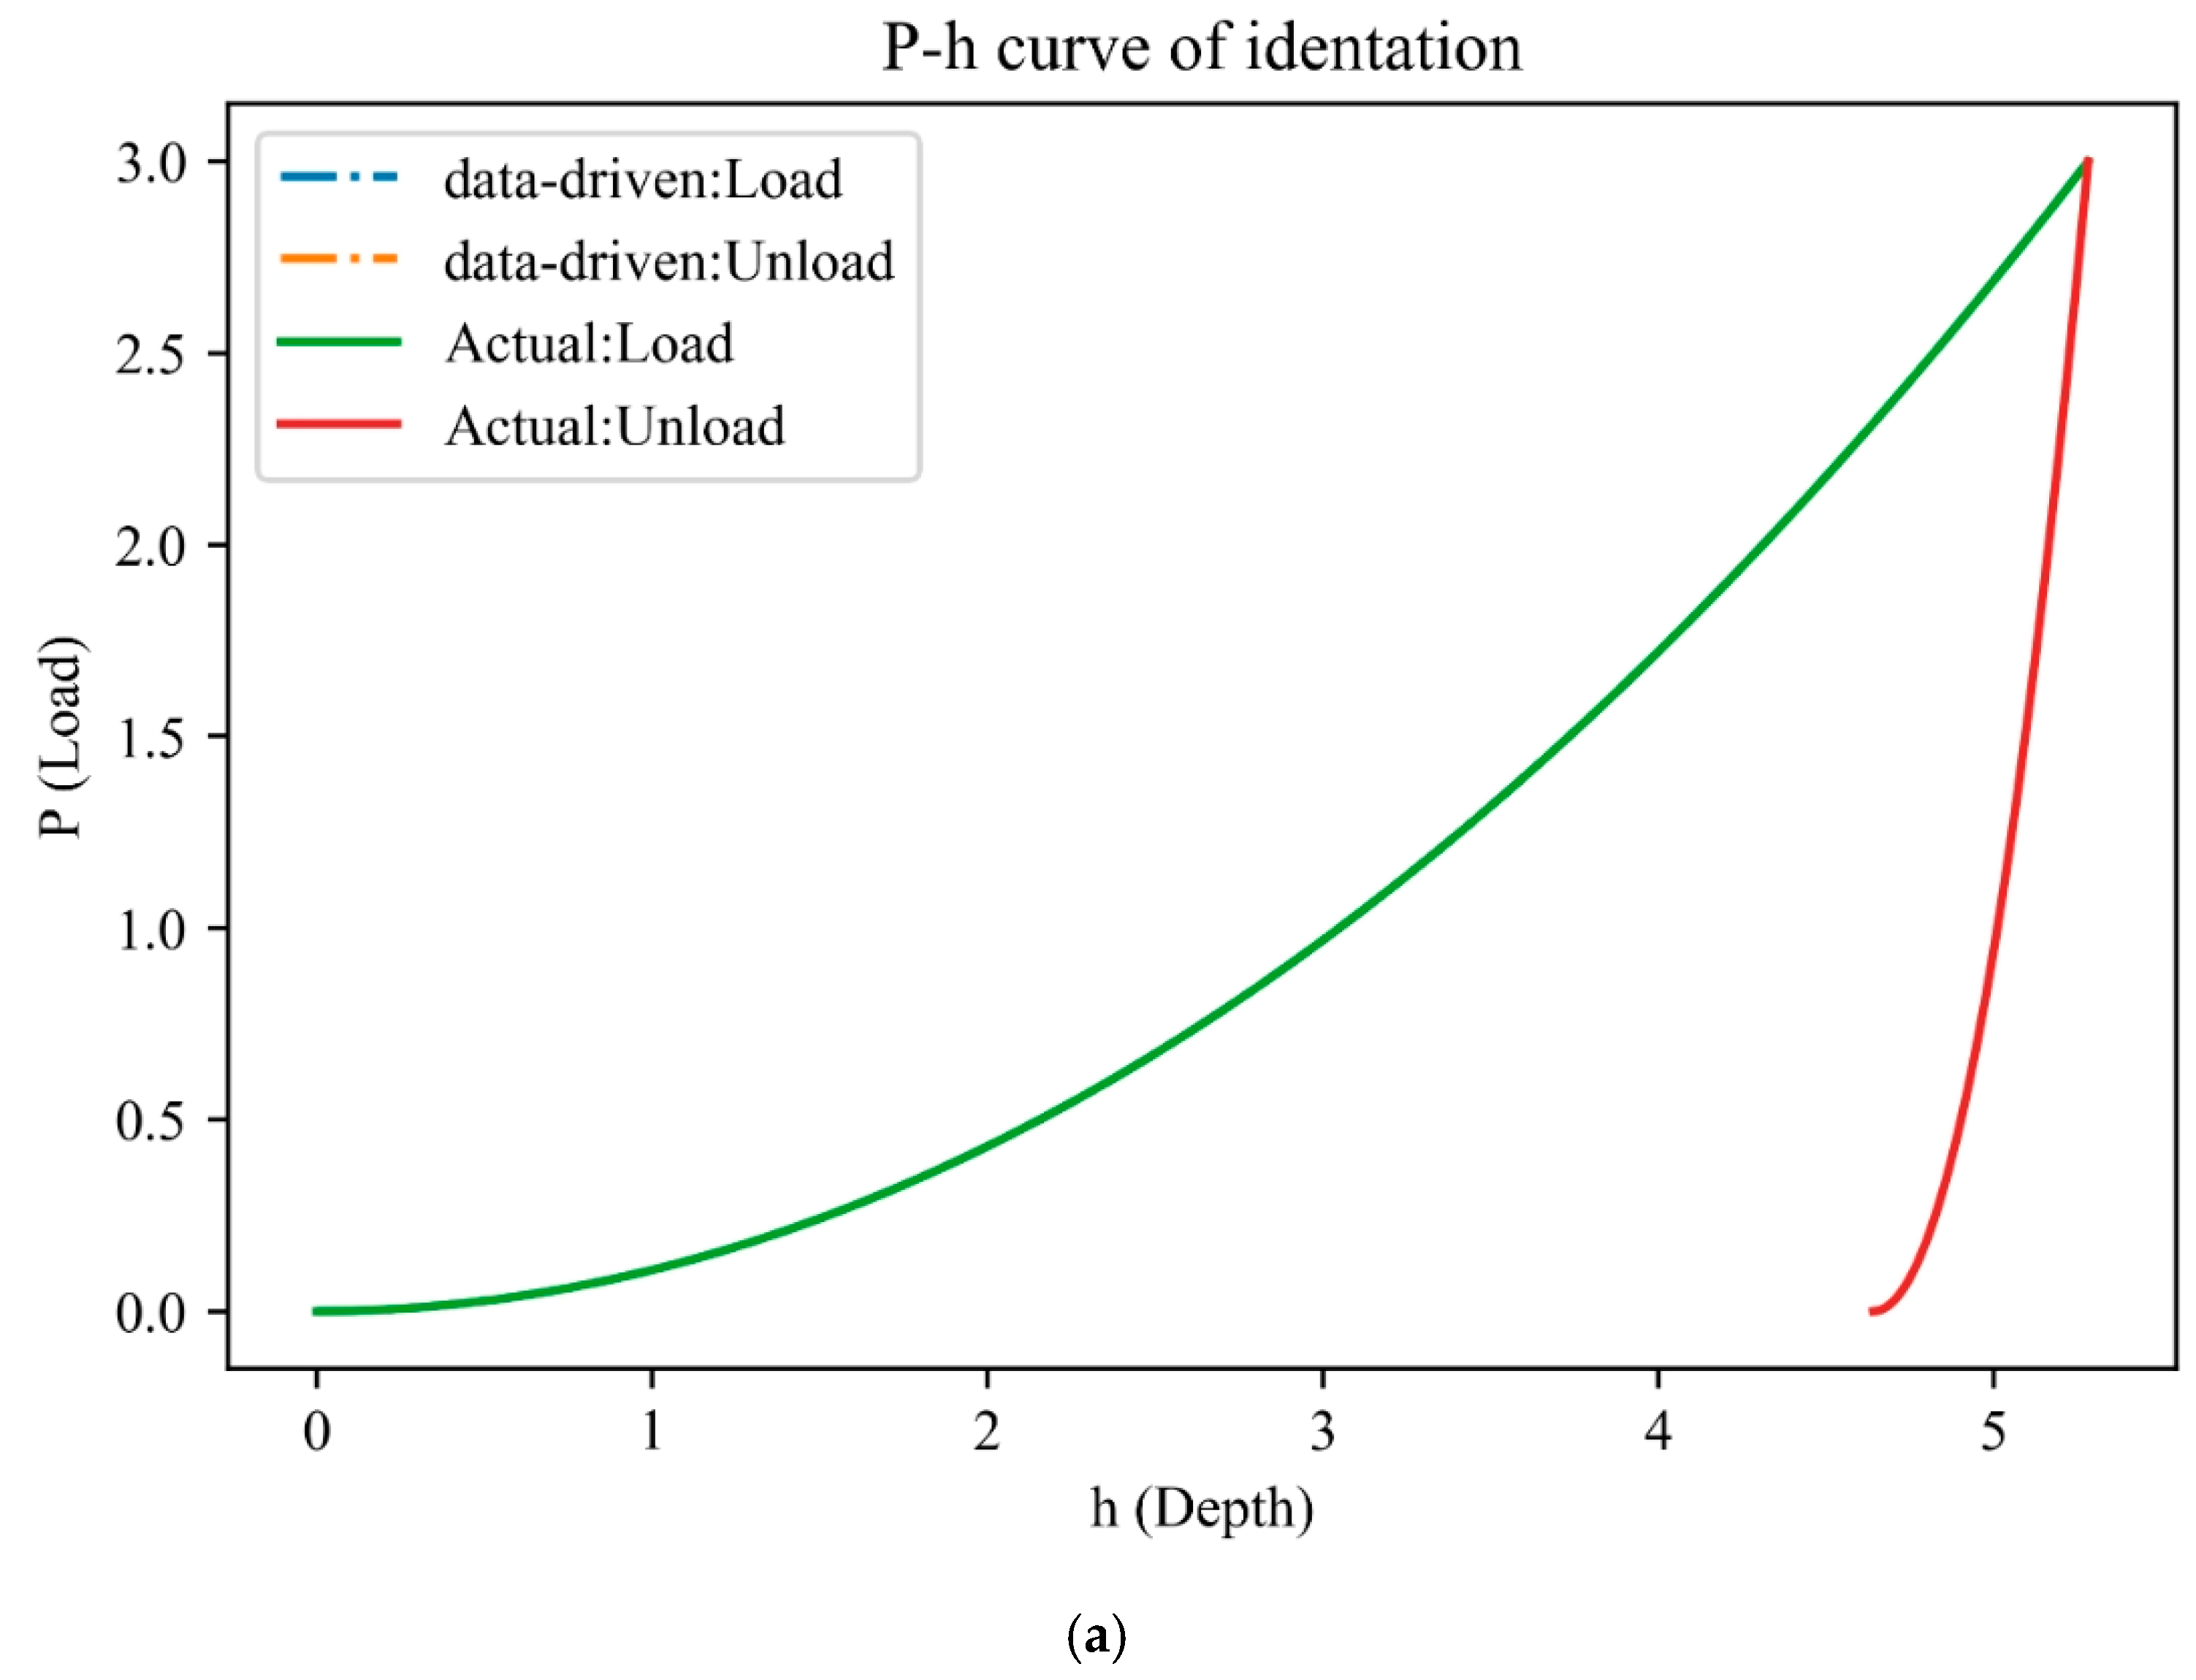
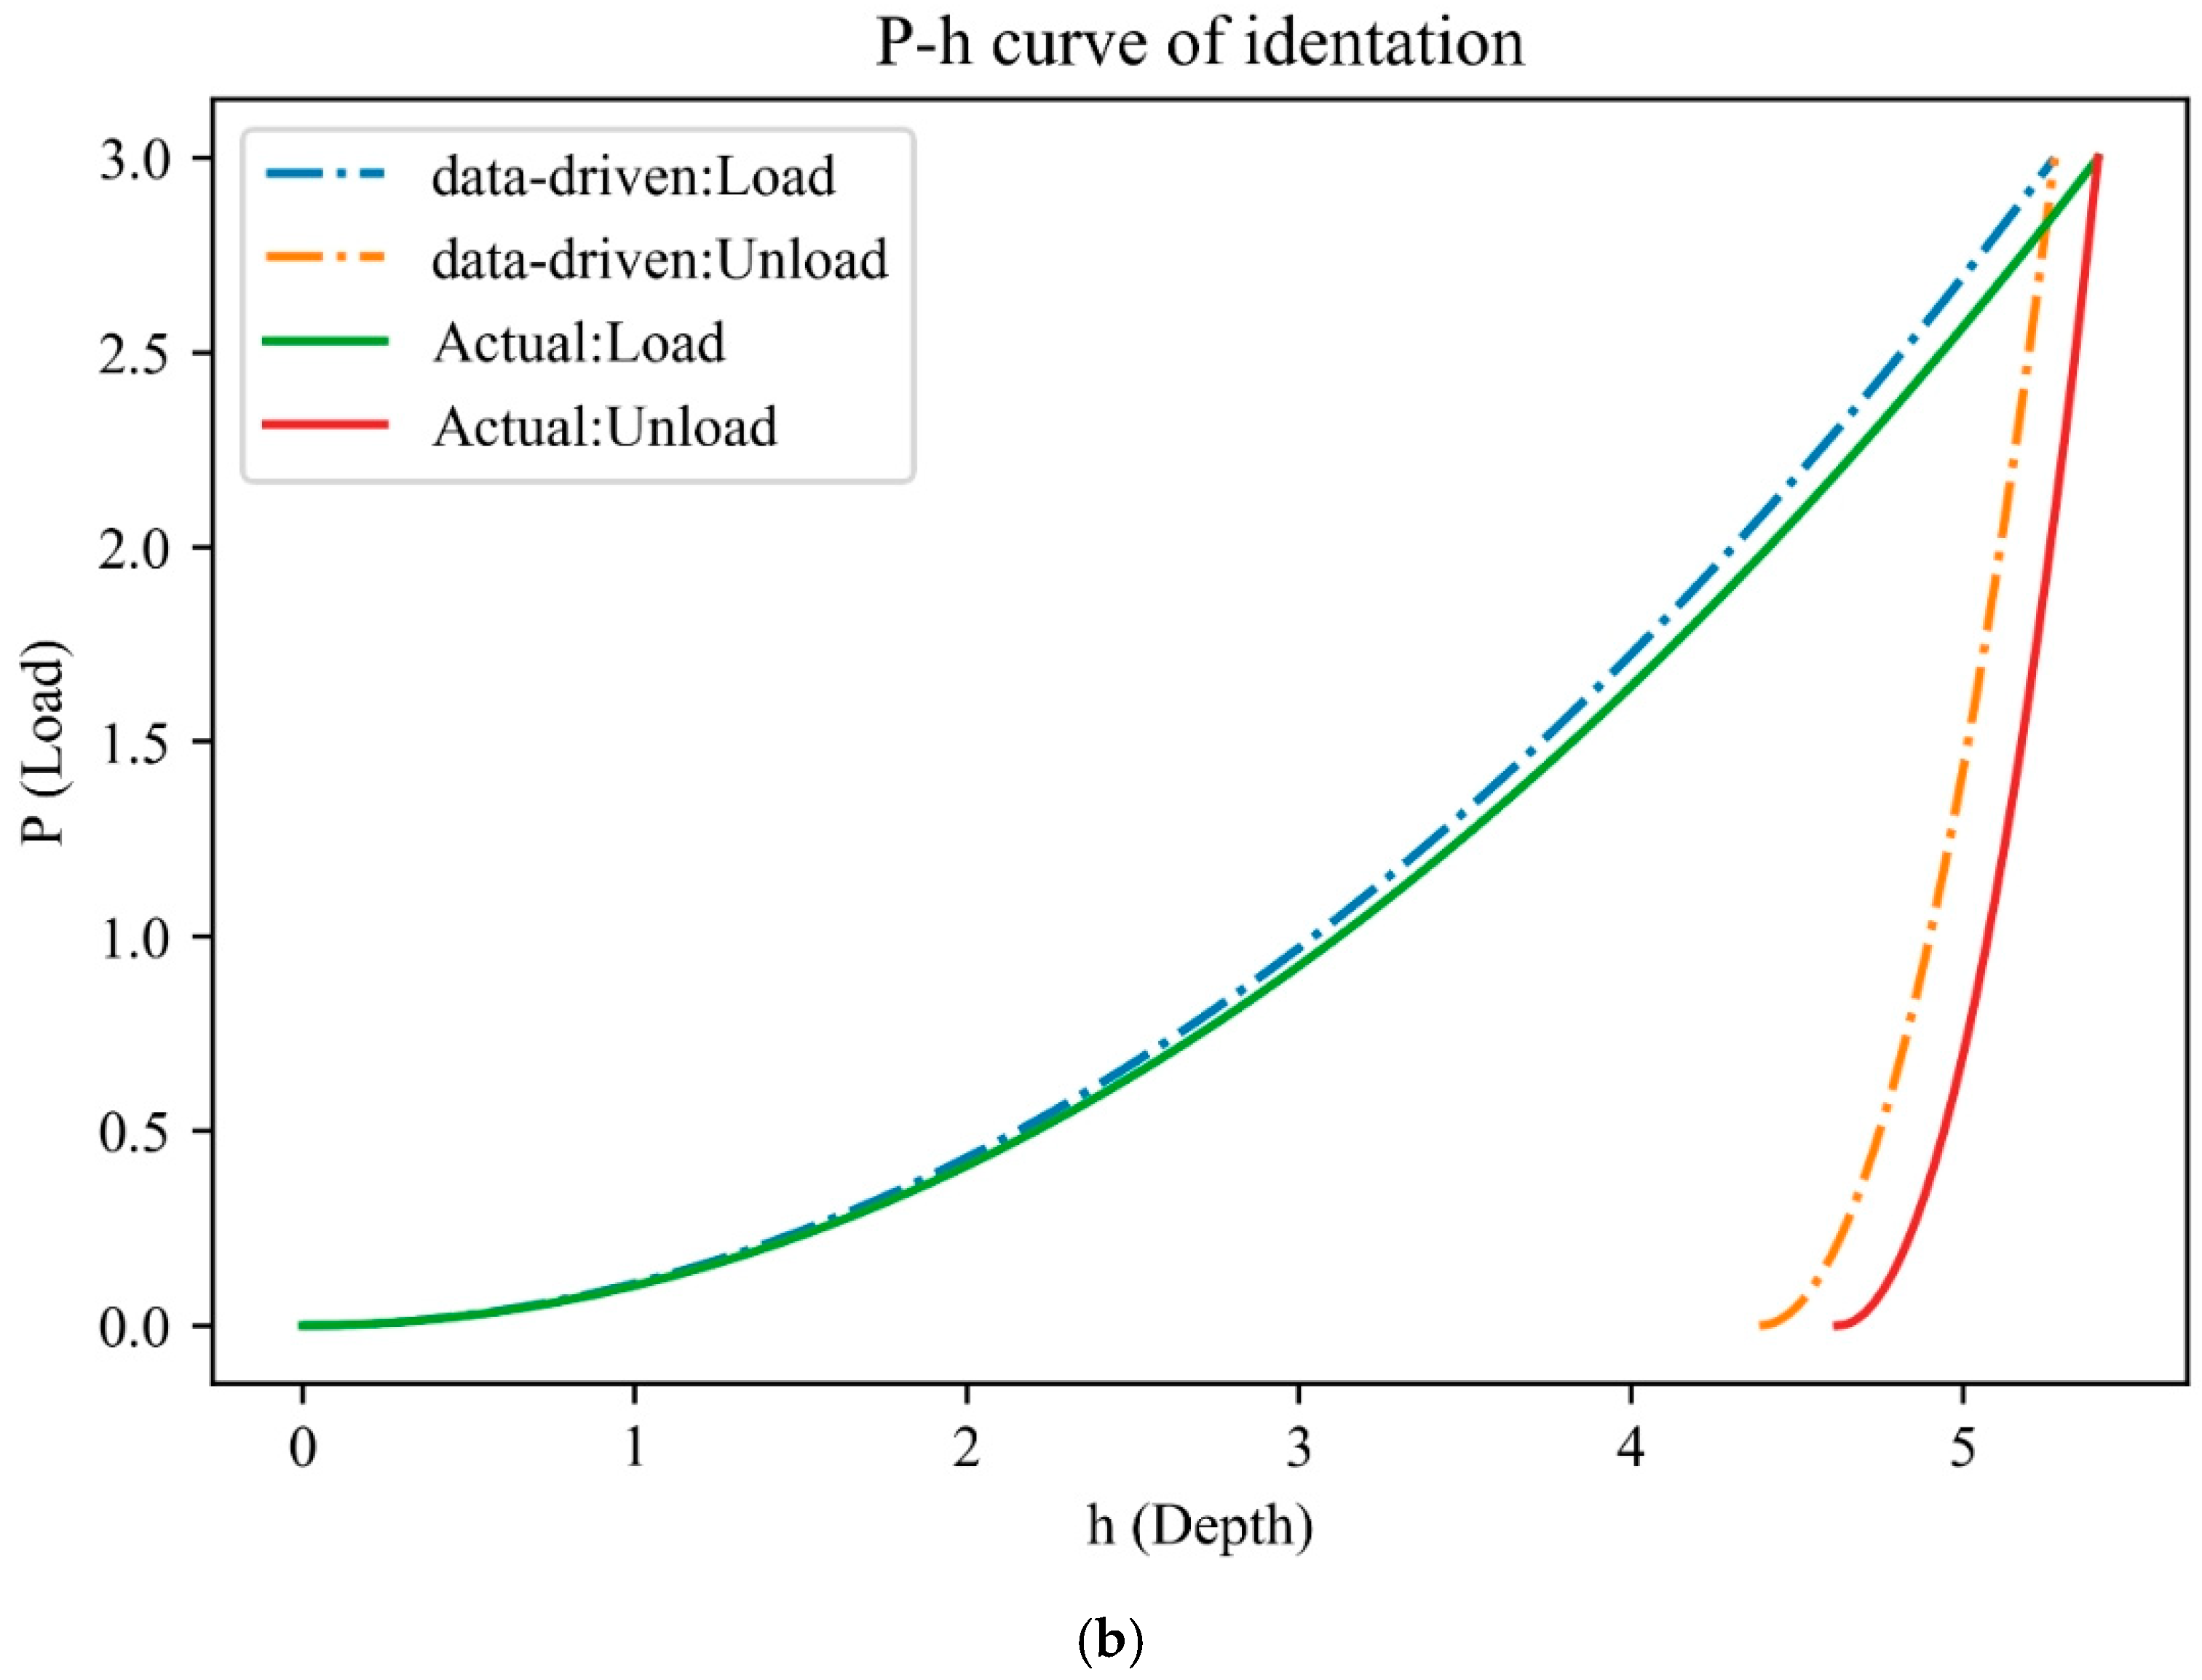
- The ROM was used to analyze the complex relationship between the material’s mechanical properties and the corresponding indentation response during loading and unloading. The coefficient of determination is about 0.9970 and almost close to 1 for snapshots. The resulting mechanical properties were in excellent agreement with the actual values. The ROM improved the optimization efficiency and could be used to replace the indentation test in inverse analysis. It provided a reasonable and scientific surrogated model for determining mechanical properties based on an indentation test.
- (2)
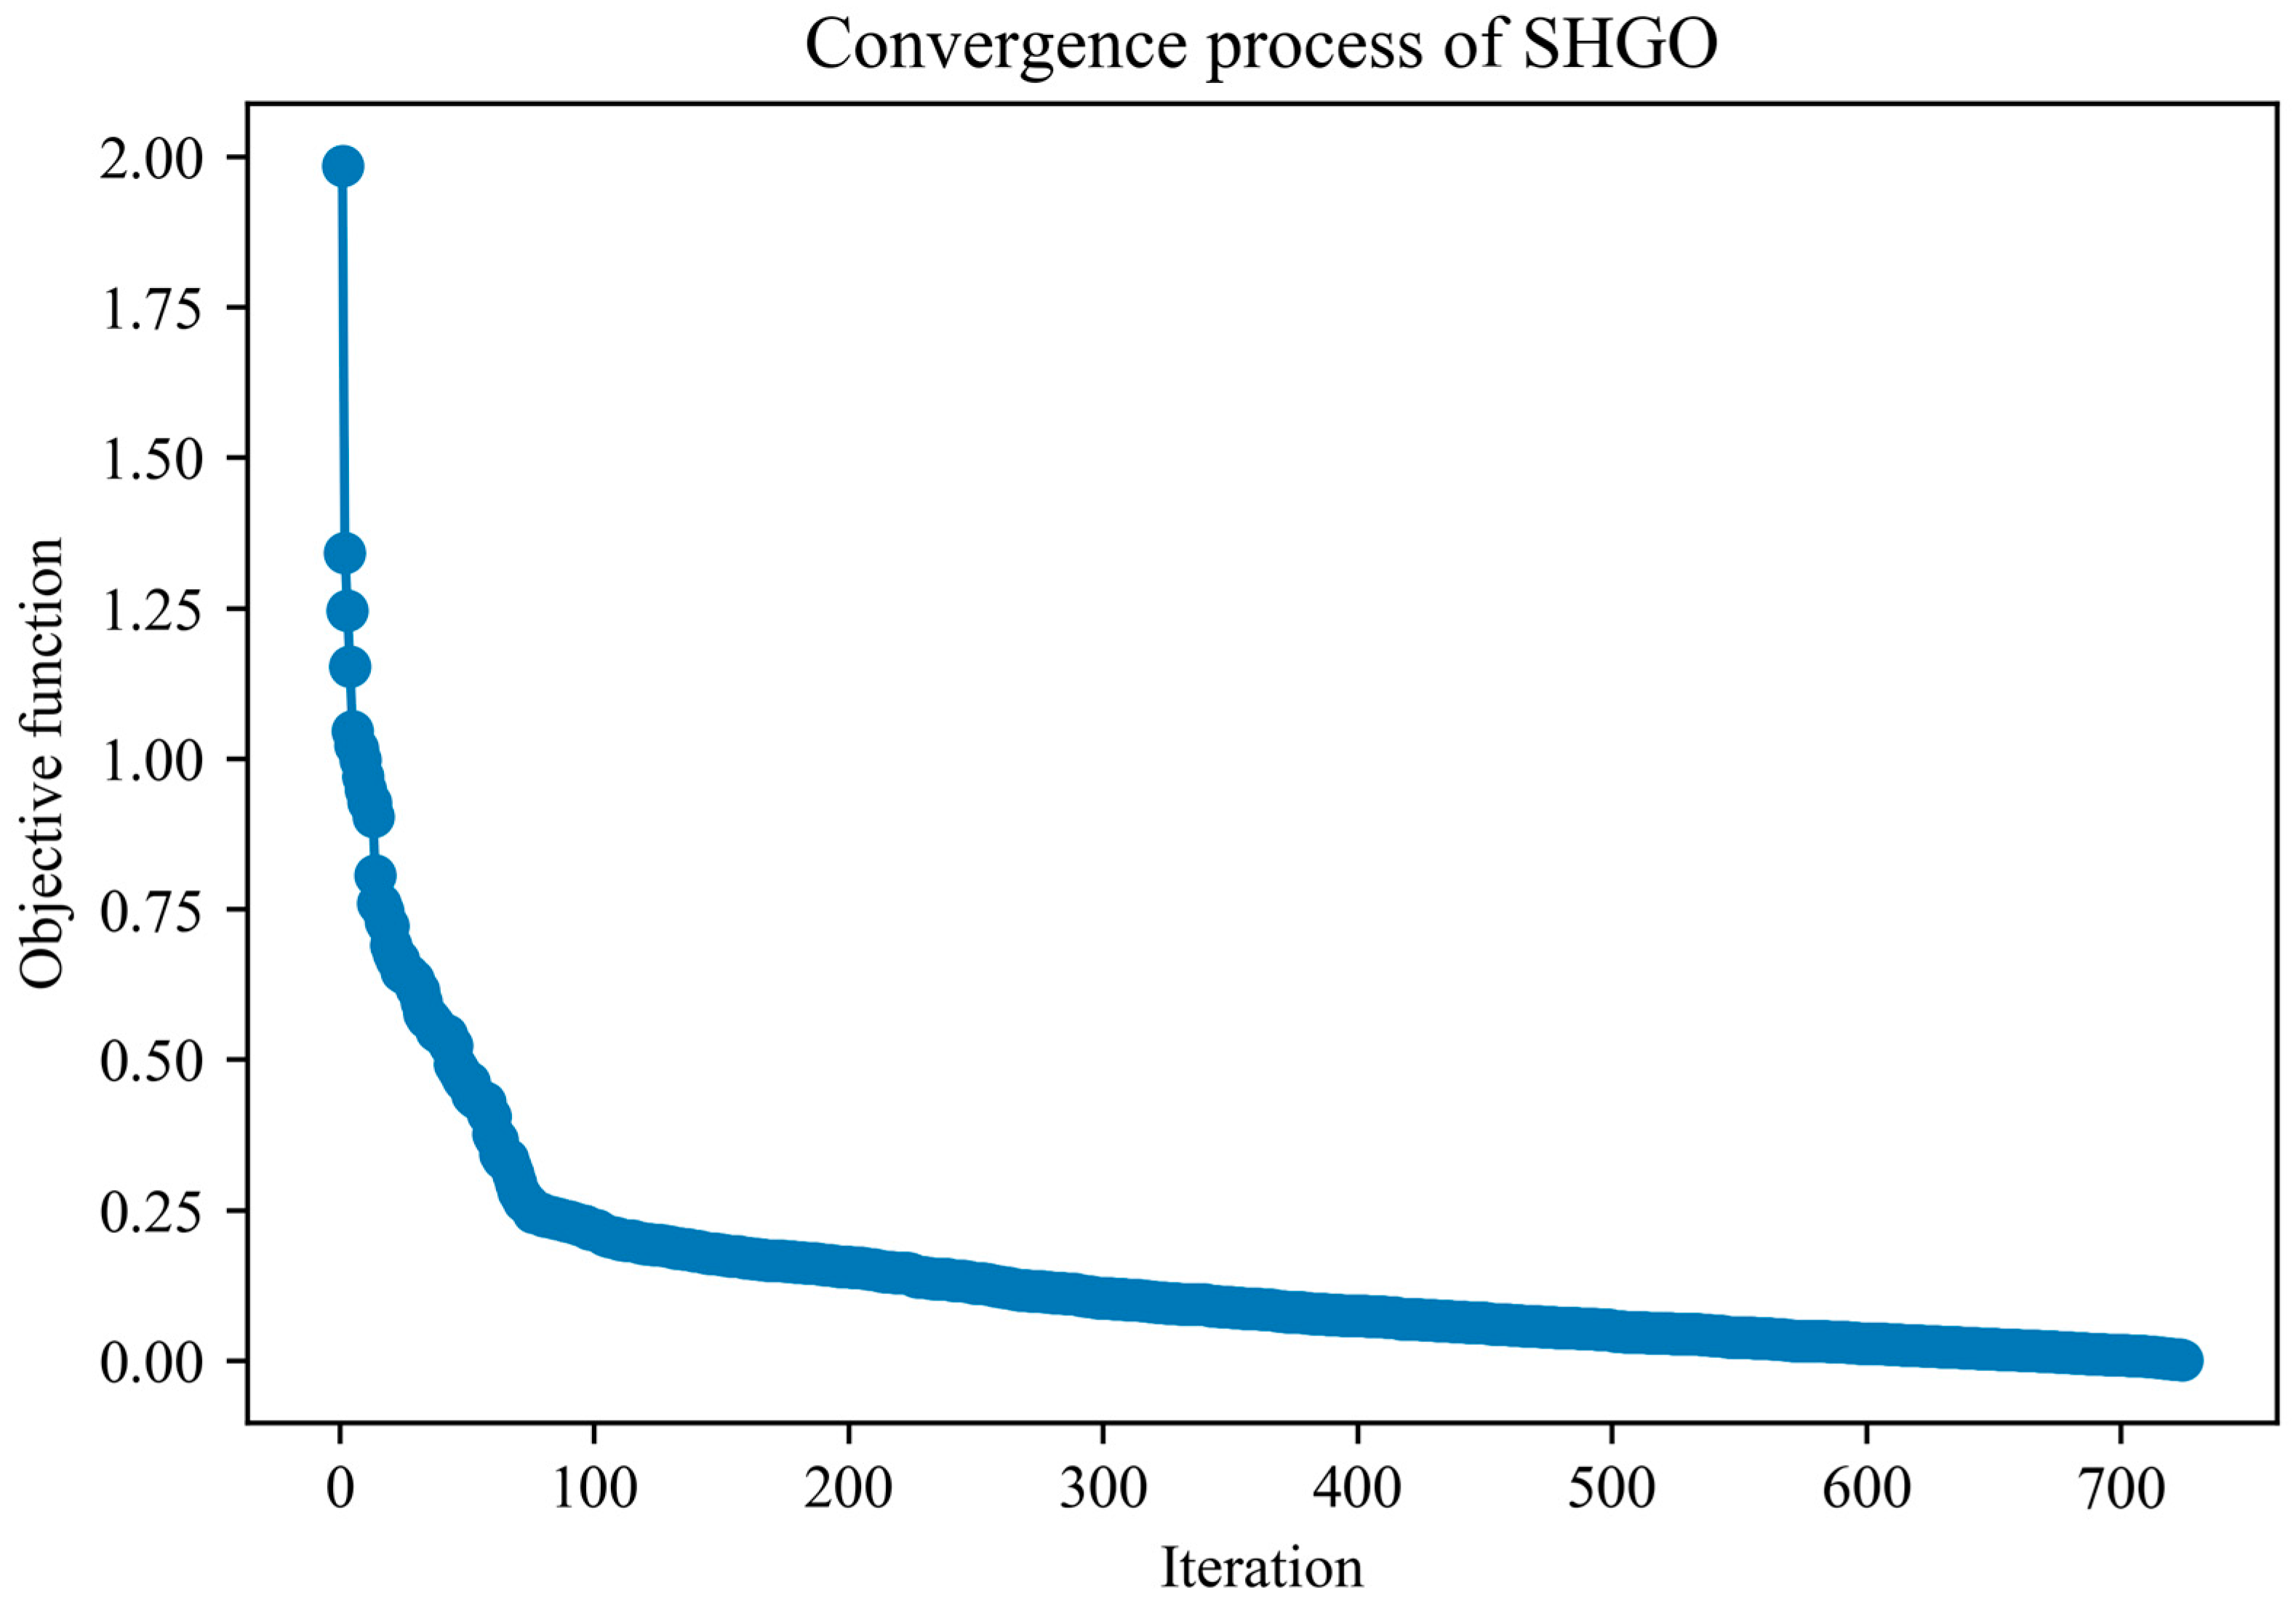
- Inverse analysis, a crucial aspect of characterizing material mechanical properties, relies on optimal technology. This study adopted the SHGO, a practical and effective optimization method, to handle the optimization and seek the material mechanical property. The developed model is more in agreement with engineering practice, providing a sense of reassurance about its real-world applicability.
- (3)
- During the indentation computation, it is essential and is not easy to characterize material mechanical properties and corresponding indentation response. In this study, a ROM-based surrogate model was developed for an indentation test. This surrogate model is a valuable and promising tool for determining the mechanical properties during the indentation process.
- (4)
- This study adopted pure and alloyed engineering metal materials to validate and illustrate the developed framework through numerical examples and synthesized data. The developed framework is independent of the material. It can be extended and applied to various materials and models. The developed framework provides a helpful tool to characterize the material properties from the instrumental indentation.
Author Contributions
Funding
Data Availability Statement
Conflicts of Interest
Nomenclature
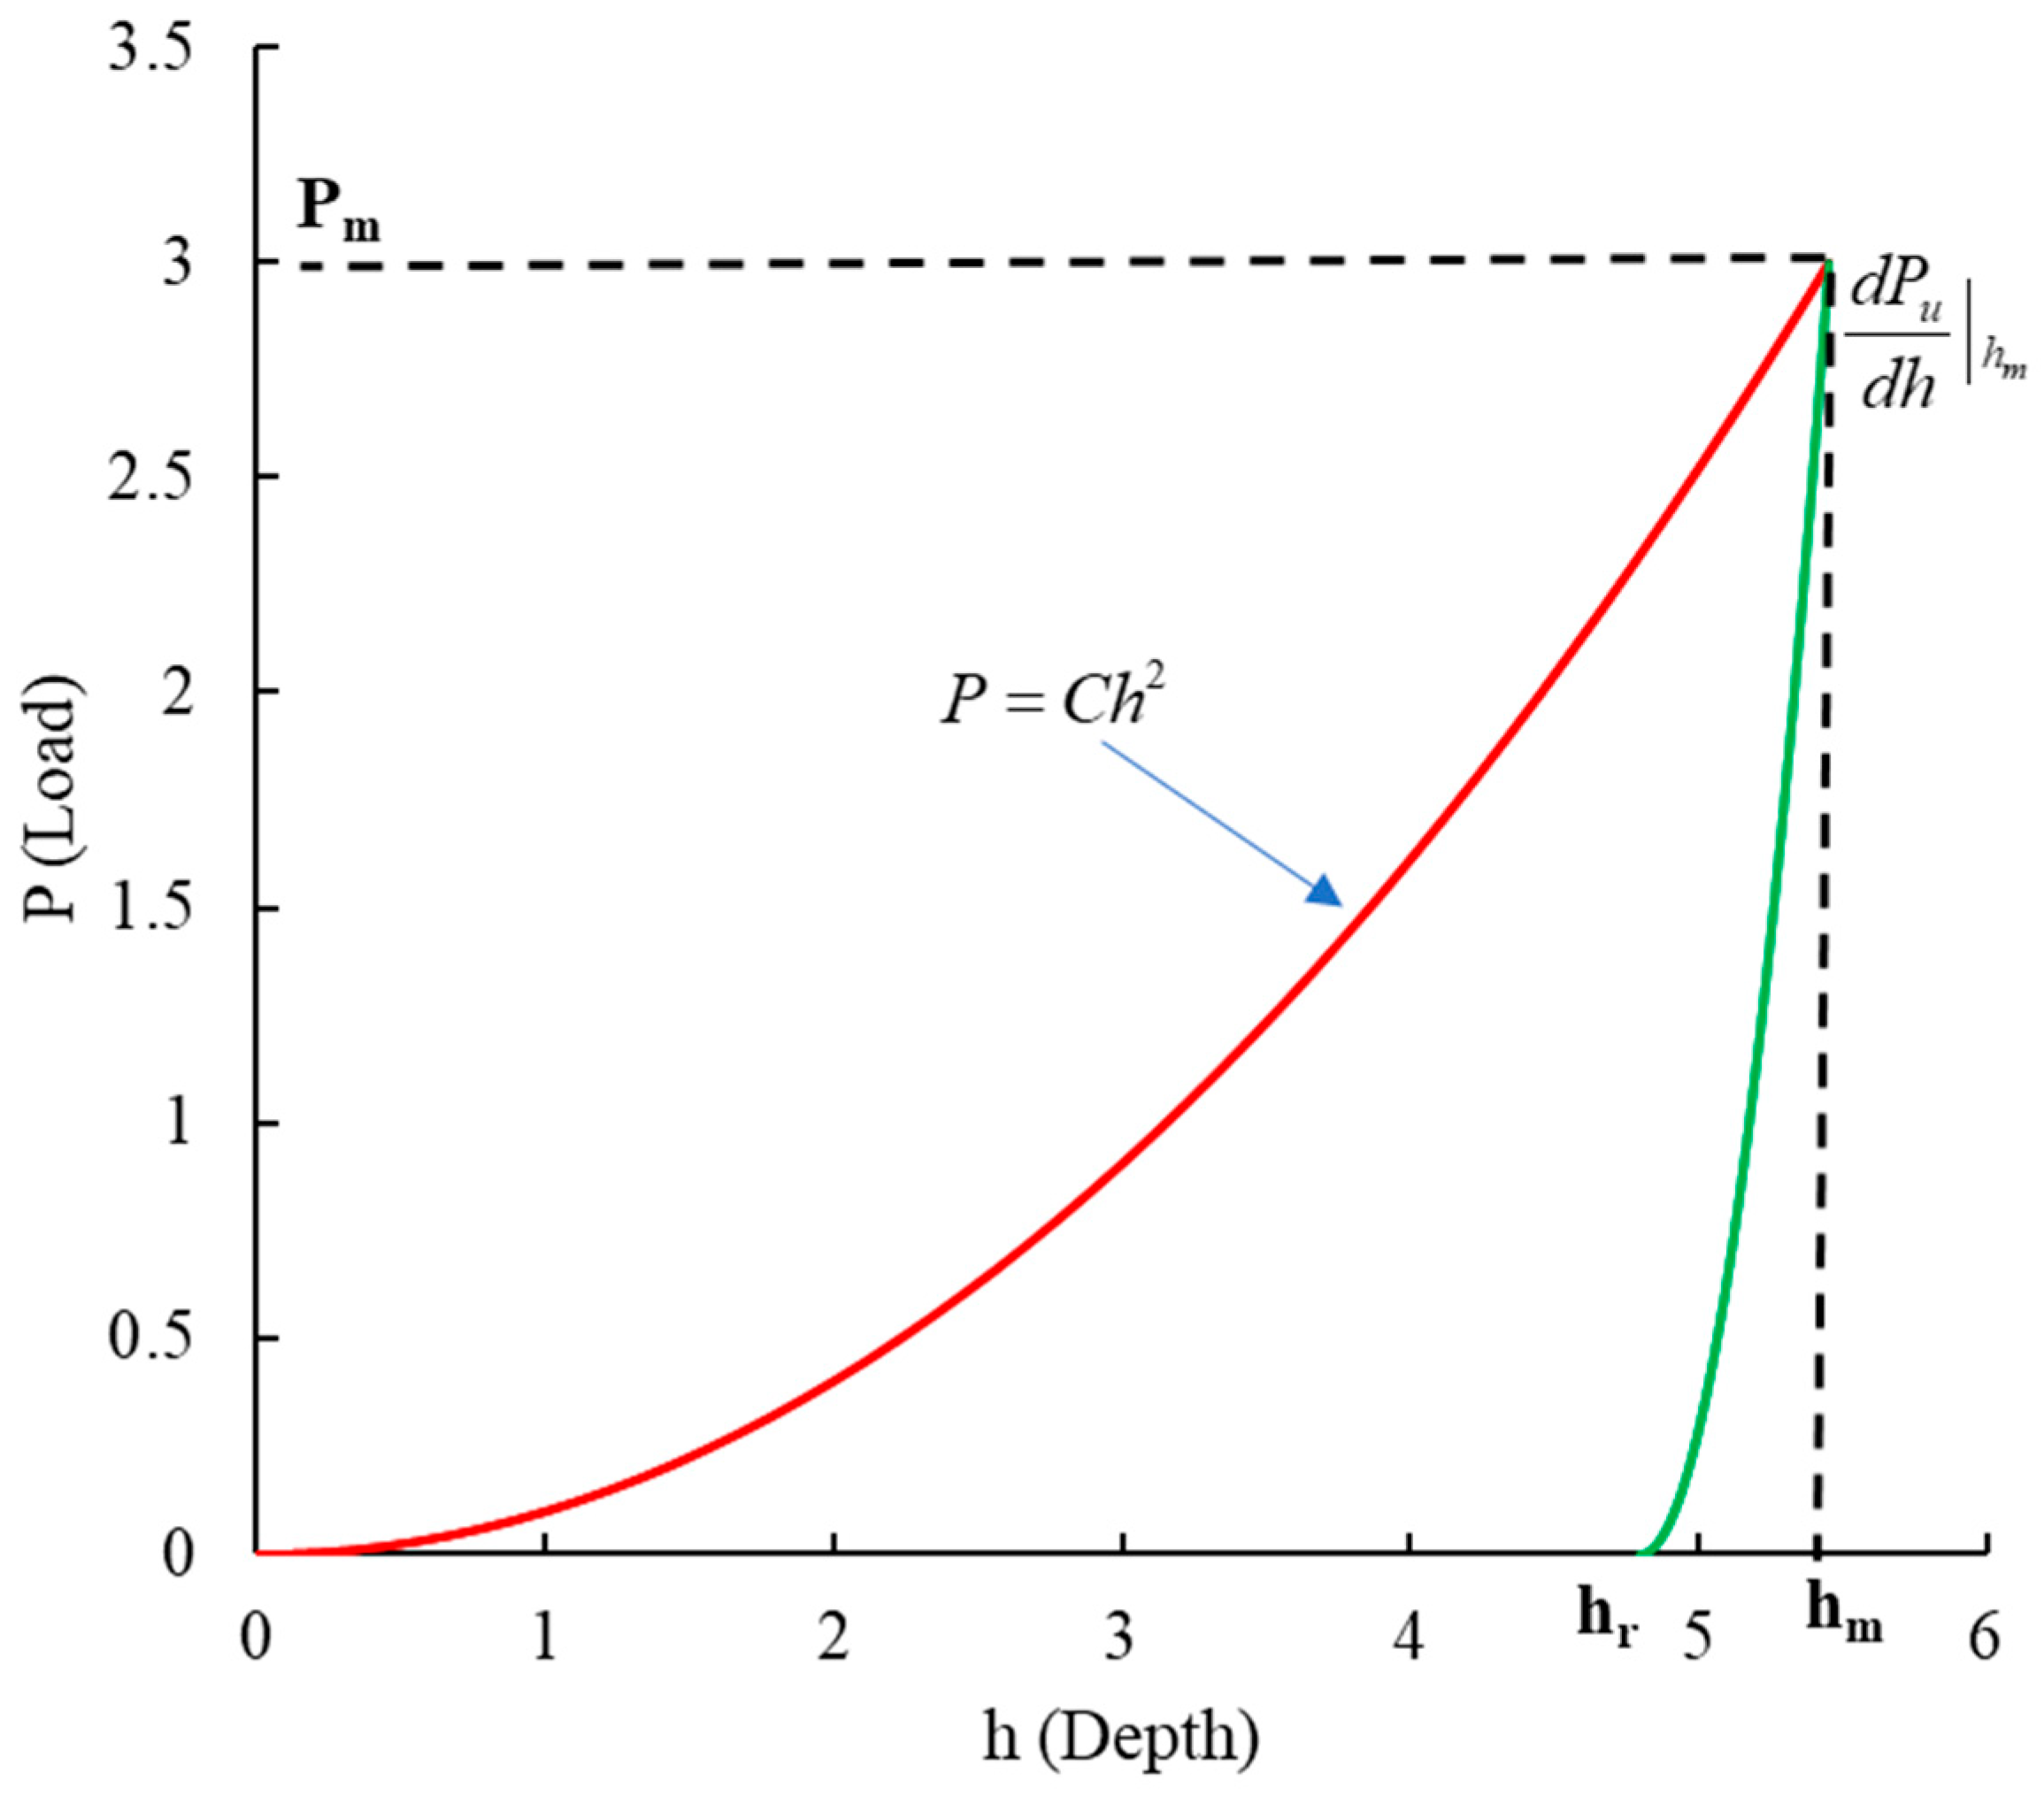
| P | Loading force. |
| h | Penetration depth. |
| C | Loading curvature. |
| Pave | Average contact pressure. |
| Pm | Maximum load. |
| Am | True projected contact area at maximum load. |
| hm | Maximum indentation depth. |
| hr | Residential indentation depth. |
| Pu | Unloading force. |
| Wt | Total work performed by the load P during loading. |
| W | Elastic work released during unloading. |
| E | Young’s modulus. |
| N | Strain-hardening exponent. |
| σy | Initial yield stress. |
| εy | Yield strain. |
| εp | Nonlinear part of the total effective strain. |
| Ei | Young’s modulus of the indenter. |
| υi | Poisson’s ratio of the indenter. |
| Deformation variables for the indentation test. | |
| xi | Design variables of an ROM. |
| θ | Parameter variables of an ROM. |
| φ | Unknown coefficient of ROM. |
| β | Unknown coefficient of ROM. |
| Eigenfunctions. | |
| Mx | Eigenvector. |
| Μ | Small regularization parameter. |
| Prom | Indentation force predicted by ROM. |
| Ptest | Indentation force measured by test. |
| hrom | Indentation depth predicted by ROM. |
| htest | Indentation depth measured by test. |
References
- Chai, B.X.; Gunaratne, M.; Ravandi, M.; Wang, J.; Dharmawickrema, T.; Di Pietro, A.; Jin, J.; Georgakopoulos, D. Smart Industrial Internet of Things Framework for Composites Manufacturing. Sensors 2024, 24, 4852. [Google Scholar] [CrossRef]
- Schuh, C.A. Nanoindentation studies of materials. Mater. Today 2006, 9, 32–40. [Google Scholar] [CrossRef]
- Luo, S.M.; Lu, Y.H.; Wu, Y.K.; Song, J.; DeGroot, D.J.; Jin, Y.; Zhang, G. Cross-scale characterization of the elasticity of shales: Statistical nanoindentation and data analytics. J. Mech. Phys. Solids 2020, 140, 103945. [Google Scholar] [CrossRef]
- Gibson, R.F. A review of recent research on nanoindentation of polymer composites and their constituents. Compos. Sci. Technol. 2014, 105, 51–65. [Google Scholar] [CrossRef]
- Lu, L.; Dao, M.; Kumar, P.; Ramamurty, U.; Karniadakis, G.E.; Suresh, S. Extraction of mechanical properties of materials through deep learning from instrumented indentation. Proc. Natl. Acad. Sci. USA 2020, 117, 7052–7062. [Google Scholar] [CrossRef]
- Oliver, W.C.; Pharr, G.M. An improved technique for determining hardness and elastic modulus using load and displacement sensing indentation experiments. J. Mater. Res. 1992, 7, 1564–1583. [Google Scholar] [CrossRef]
- Suresh, S.; Giannakopoulos, A.E. A new method for estimating residual stresses by instrumented sharp indentation. Acta Mater. 1998, 46, 5755–5767. [Google Scholar] [CrossRef]
- Cheng, Y.T.; Cheng, C.M. Relationships between hardness, elastic modulus, and the work of indentation. Appl. Phys. Lett. 1998, 73, 614–616. [Google Scholar] [CrossRef]
- Giannakopoulos, A.E.; Suresh, S. Determination of elastoplastic properties by instrumented sharp indentation. Scr. Mater. 1999, 40, 1191–1198. [Google Scholar] [CrossRef]
- Dao, M.; Chollacoop, N.; Van Vliet, K.J. Computational modeling of the forward and reverse problems in instrumented sharp indentation. Acta Mater. 2001, 49, 3899–3918. [Google Scholar] [CrossRef]
- Chollacoop, N.; Dao, M.; Suresh, S. Depth-sensing instrumented indentation with dual sharp indenters. Acta Mater. 2003, 51, 3713–3729. [Google Scholar] [CrossRef]
- Oliver, W.C.; Pharr, G.M. Measurement of hardness and elastic modulus by instrumented indentation: Advances in understanding and refinements to methodology. J. Mater. Res. 2004, 19, 3–20. [Google Scholar] [CrossRef]
- Gouldstone, A.; Chollacoop, N.; Dao, M.; Li, J.; Minor, A.M.; Shen, Y.L. Indentation across size scales and disciplines: Recent developments in experimentation and modeling. Acta Mater. 2007, 55, 4015–4039. [Google Scholar] [CrossRef]
- Lan, H.Z.; Venkatesh, T.A. Determination of the elastic and plastic properties of materials through instrumented indentation with reduced sensitivity. Acta Mater. 2007, 55, 2025–2041. [Google Scholar] [CrossRef]
- Doerner, M.F.; Nix, W.D. A method for interpreting the data from depth-sensing indentation instruments. J. Mater. Res. 1986, 1, 601–609. [Google Scholar] [CrossRef]
- Hill, R.; Storakers, B.; Zdunek, A.B. A Theoretical Study of the Brinell Hardness Test. Proc. R. Soc. Lond. A Math. Phys. Sci. 1989, 423, 301–330. [Google Scholar]
- Giannakopoulos, A.E.; Larsson, P.L.; Vestergaard, R. Analysis of Vickers indentation. Int. J. Solids Struct. 1994, 31, 2679–2708. [Google Scholar] [CrossRef]
- Avadanii, D.; Kareer, A.; Hansen, L.; Wilkinson, A. Calibration and data-analysis routines for nanoindentation with spherical tips. J. Mater. Res. 2023, 38, 4042–4056. [Google Scholar] [CrossRef]
- Liu, X.-Y.; Xu, D.-P.; Li, S.-J.; Qiu, S.-L.; Jiang, Q. An Insight into the Mechanical and Fracture Characterization of Minerals and Mineral Interfaces in Granite Using Nanoindentation and Micro X-Ray Computed Tomography. Rock Mech. Rock Eng. 2023, 56, 3359–3375. [Google Scholar] [CrossRef]
- Herbert, E.G.; Pharr, G.M.; Oliver, W.C.; Lucas, B.N.; Hay, J.L. On the measurement of stress-strain curves by spherical indentation. Thin Solid Films 2001, 398–399, 331–335. [Google Scholar] [CrossRef]
- Liu, X.-Y.; Xu, D.-P.; Duan, S.-Q.; Xu, H.-S.; Feng, G.-L.; Qiu, S.-L.; Jiang, Q. Study on the micromechanical and crack characteristics of granite based on nanoindentation test and discrete element method. Comput. Part. Mech. 2024, 11, 1547–1563. [Google Scholar] [CrossRef]
- Puchi-Cabrera, E.S.; Rossi, E.; Sansonetti, G.; Sebastiani, M.; Bemporad, E. Machine learning aided nanoindentation: A review of the current state and future perspectives. Curr. Opin. Solid State Mater. Sci. 2023, 27, 101091. [Google Scholar] [CrossRef]
- Picklum, M.; Beetz, M. MatCALO: Knowledge-enabled machine learning in materials science. Comput. Mater. Sci. 2019, 163, 50–62. [Google Scholar] [CrossRef]
- Nayak, G.K.; Srinivasan, P.; Todt, J.; Daniel, R.; Nicolini, P.; Holec, D. Accurate prediction of structural and mechanical properties on amorphous materials enabled through machine-learning potentials: A case study of silicon nitride. Comput. Mater. Sci. 2025, 249, 113629. [Google Scholar] [CrossRef]
- Huber, N.; Tsakmakis, C. Determination of constitutive properties from spherical indentation data using neural networks. Part II: Plasticity with nonlinear isotropic and kinematic hardening. J. Mech. Phys. Solids 1999, 47, 1589–1607. [Google Scholar] [CrossRef]
- Huber, N.; Konstantinidis, A.; Tsakmakis, C. Determination of Poisson’s ratio by spherical indentation using neural networks—Part I: Theory. J. Appl. Mech. 2001, 68, 218–223. [Google Scholar] [CrossRef]
- Huber, N.; Tsakmakis, C. Determination of Poisson’s ratio by spherical indentation using neural networks—Part II: Identification method. J. Appl. Mech. 2001, 68, 224–229. [Google Scholar] [CrossRef]
- Tyulyukovskiy, E.; Huber, N. Identification of viscoplastic material parameters from spherical indentation data: Part I. Neural networks. J. Mater. Res. 2006, 21, 664–676. [Google Scholar] [CrossRef]
- Zhang, Y.; Hart, J.D.; Needleman, A. Identification of plastic properties from conical indentation using a bayesian-type statistical approach. J. Appl. Mech. 2019, 86, 011002. [Google Scholar] [CrossRef]
- Lü, Q.; Liu, S.-H.; Mao, W.-Z.; Yu, Y.; Long, X. A numerical simulation-based ANN method to determine the shear strength parameters of rock minerals in nanoscale. Comput. Geotech. 2024, 169, 106175. [Google Scholar] [CrossRef]
- Peng, T.; Sun, T.; Li, Y.; Wang, B.; Zhang, J. Correlation between scratch hardness and plastic parameters of metallic materials: A comparative study of machine learning and empirical solution. J. Mater. Res. 2025, 40, 572–584. [Google Scholar] [CrossRef]
- Li, L.; Li, H.; Yang, S.; Wang, Z. Evaluation of equibiaxial residual stress in metal materials using indentation testing techniques. Mater. Today Commun. 2025, 42, 111268. [Google Scholar] [CrossRef]
- Jeong, K.; Lee, H.; Kwon, O.M. Prediction of uniaxial tensile flow using finite element-based indentation and optimized artificial neural networks. Mater. Des. 2020, 196, 109104. [Google Scholar] [CrossRef]
- LeCun, Y.; Bengio, Y.; Hinton, G. Deep learning. Nature 2015, 521, 436–444. [Google Scholar] [CrossRef] [PubMed]
- Veer, L.J.; Bernards, R. Enabling personalized cancer medicine through analysis of gene-expression patterns. Nature 2008, 452, 564–570. [Google Scholar] [CrossRef] [PubMed]
- Severson, K.A.; Attia, P.M.; Jin, N.; Perkins, N.; Jiang, B.; Yang, Z.; Chen, M.H.; Aykol, M.; Herring, P.K.; Fraggedakis, D.; et al. Data-driven prediction of battery cycle life before capacity degradation. Nat. Energy 2019, 4, 383–391. [Google Scholar] [CrossRef]
- Alipanahi, B.; Delong, A.; Weirauch, M.T. Predicting the sequence specificities of DNA- and RNA-binding proteins by deep learning. Nat. Biotechnol. 2015, 33, 831–838. [Google Scholar] [CrossRef] [PubMed]
- Huys, Q.J.M.; Maia, T.V.; Frank, M.J. Computational psychiatry as a bridge from neuroscience to clinical applications. Nat. Neurosci. 2016, 19, 404–413. [Google Scholar] [CrossRef]
- Reichstein, M.; Camps-Valls, G.; Stevens, B.; Jung, M.; Denzler, J.; Carvalhais, N.; Prabhat. Deep learning and process understanding for data-driven earth system science. Nature 2019, 566, 195–203. [Google Scholar] [CrossRef]
- Zhao, H.; Chen, B.; Li, S. Determination of geomaterial mechanical parameters based on back analysis and reduced-order model. Comput. Geotech. 2021, 132, 104013. [Google Scholar] [CrossRef]
- ASTM E2546-15; Standard Practice for Instrumented Indentation Testing. ASTM International: West Conshohocken, PA, USA, 2023.
- Audouze, C.; Vuyst, F.D.; Nair, P.B. Reduced-order modeling of parameterized PDEs using time-space-parameter principal component analysis. Int. J. Numer. Methods Eng. 2009, 80, 1025–1057. [Google Scholar] [CrossRef]
- Endres, S.C.; Sandrock, C.; Focke, W.W. A simplicial homology algorithm for Lipschitz optimization. J. Glob. Optim. 2018, 72, 181–217. [Google Scholar] [CrossRef]
- Ren, J.; Zhao, H.; Zhang, L.; Zhao, Z.; Xu, Y.; Cheng, Y.; Wang, M.; Chen, J.; Wang, J. Design optimization of cement grouting material based on adaptive boosting algorithm and simplicial homology global optimization. J. Build. Eng. 2022, 49, 104049. [Google Scholar] [CrossRef]
- Xu, Y.S.; Zhao, H.B.; Yang, X.C.; Li, G.; Zhang, L.; Ren, J.L. Data-Driven Design for a Modified Asphalt Binder Based on a Reduced Order Model and Simplicial Homology Global Optimization. J. Mater. Civ. Eng. 2024, 36, 04023590. [Google Scholar] [CrossRef]


| Young’s Modulus E (GPa) | Yield Strength σy (MPa) | Strain-Hardening Exponent n | Poisson’s Ratio υ |
|---|---|---|---|
| [10, 210] | [30, 3000] | [0, 0.5] | [0, 0.5] |
| Method | Young’s Modulus E (GPa) | Yield Strength σy (MPa) | Strain-Hardening Exponent n | Poisson’s Ratio υ |
|---|---|---|---|---|
| Actual | 134 | 1.104146677 | 0.272536859 | 0.282475525 |
| This study | 191.810382 | 0.963285098 | 0.189510922 | 0.347130587 |
Disclaimer/Publisher’s Note: The statements, opinions and data contained in all publications are solely those of the individual author(s) and contributor(s) and not of MDPI and/or the editor(s). MDPI and/or the editor(s) disclaim responsibility for any injury to people or property resulting from any ideas, methods, instructions or products referred to in the content. |
© 2025 by the authors. Licensee MDPI, Basel, Switzerland. This article is an open access article distributed under the terms and conditions of the Creative Commons Attribution (CC BY) license (https://creativecommons.org/licenses/by/4.0/).
Share and Cite
Wang, X.; Ru, Z.; Li, B.; Zhao, H. Data-Driven Framework for Mechanical Behavior Characterization from Instrumented Indentation. Processes 2025, 13, 2076. https://doi.org/10.3390/pr13072076
Wang X, Ru Z, Li B, Zhao H. Data-Driven Framework for Mechanical Behavior Characterization from Instrumented Indentation. Processes. 2025; 13(7):2076. https://doi.org/10.3390/pr13072076
Chicago/Turabian StyleWang, Xiaoqun, Zhongliang Ru, Bangxiang Li, and Hongbo Zhao. 2025. "Data-Driven Framework for Mechanical Behavior Characterization from Instrumented Indentation" Processes 13, no. 7: 2076. https://doi.org/10.3390/pr13072076
APA StyleWang, X., Ru, Z., Li, B., & Zhao, H. (2025). Data-Driven Framework for Mechanical Behavior Characterization from Instrumented Indentation. Processes, 13(7), 2076. https://doi.org/10.3390/pr13072076