Abstract
The metal powder quality of a supersonic gas atomizer can vastly differ depending on the operating gas variables. This study investigates the high-pressure gas atomization (HPGA) process using computational fluid dynamics (CFD) simulations. The simulation results were validated against experimental data, revealing a series of shock waves that play a crucial role in the gas flow field. A full factorial design of experiments (DOE) was used to optimize inlet gas pressure and temperature. The optimized parameters were found to directly influence droplet breakup and particle size. It was observed that higher inlet gas pressures and temperatures enhance atomization efficiency and produce finer powders, with pressure having a more dominant effect than temperature. The findings provide valuable insights into the gas dynamics of HPGA and support process optimization for producing high-quality metal powders.
1. Introduction
Metal/alloy in dust form is identified as one of the key ingredients for powder metallurgy, which has a wide range of applicability in various fields. It is high in demand due to its utilization in additive manufacturing, rapid prototyping, and injection molding [1]. Metal/alloy powder manufacturing procedures can be classified into three main categories: physical, chemical, and mechanical methods [2].
Atomization, which falls under the category of the physical method, can be identified as one of the best options for efficiently obtaining high-quality metal powders with purity, controllability, and versatility. The ranges of average particle size obtainable from various atomization techniques are shown by a previous study [3]. Among those techniques, the study shows that gas atomization is the most adaptable technique and much more cost-effective than hybrid atomization for producing high-quality metal powders. Thus, the gas atomization process has been considered ideal for mass production. On the other hand, close-coupled and free-fall atomization are the most common atomization types employed for industrial applications. Among these, close-coupled atomization is much more promising for the production of very fine, high-quality metal powders, as shown by the prior study [3]. This is because of the more efficient breakup of liquid particles due to a much higher gas–melt interaction.
A close-coupled method known as high-pressure gas atomization (HPGA) is the most commonly used process for manufacturing fine sphere-shaped metal powders [4]. In general, the HPGA mechanism can be classified into two consecutive processes, i.e., primary breakup and secondary breakup [5]. In the primary atomization process, the melt surface is disoriented by the sinusoidal oscillation produced by the high-speed gas jets, then split up into wobbly ligaments (filaments) and big melt droplets. Immediately after the primary breakup process, a secondary atomization process initiates through an instability mechanism, therefore forming a droplet with a finer particle size before the solidification takes place [6]. Even though the history of research regarding metal powder production is quite long, the comprehensive physics associated with the atomization of gas is not fully understood [7]. Thus, various investigations were performed to realize the corresponding physical insight.
A typical high-pressure gas atomization system contains a supersonic nozzle, also known as a convergent–divergent nozzle. While passing through this nozzle, the gas experiences a large expansion that yields the supersonic jet. This type of jet flow pattern was primarily studied by Mates & Settles [8] and Unal [9], and both studies have concluded that the convergent–divergent nozzle generates much fewer internal shocks in comparison with the ordinary convergent nozzle. However, the particle size distribution remains unchanged under similar operating conditions.
From the perspective of modeling, the progression of atomization courses was examined intensively by simulating the metal melt breakup with the Lagrangian discrete phase model. Markus and Fritsching [10] numerically examined the integration of primary and secondary atomization processes along with the transmission of heat during solidification. However, their results were not properly valid in the area of the atomizer outlet, as they considered their gas flow model incompressible, but the fully expanded gas flow at the outlet region could be supersonic. Zeoli and Gu [11] performed numerical simulation for droplet breakup in gas atomization by combining models of TAB (Taylor analogy breakup) and KH (Kelvin–Helmholtz) instability. Their model only considered the secondary atomization of molten metal droplets, and the primary atomization mechanism was neglected. They showed a steady profile of the gas flow field and suggested a multi-stage droplet-breakup model on the basis of particle diameter history in that area. Note that they did not account for the unsteady nature of droplet propagation. Therefore, their particle flow paths did not match properly with the prior experimental outcomes.
Firmansyah et al. [7] performed a number of numerical simulations for secondary atomization of the melt droplets with HPGA using the KH instability model and conducted parametric studies to understand the influence of inlet gas temperature and gas pressure on the obtained particle size. They employed a two-way coupling of gas and melt to realize the mass loading effect during the secondary breakup of melt droplets. They considered the effect of molten metal droplets on the gaseous phase; thereby, more realistic results were obtained to explain the atomization process. Apart from this, their numerical simulation results showed that initially, the droplet size increases gradually with the rise of flow time, but the changes become almost negligible after the first 50 ms. Kaiping Du et al. [12] conducted studies on an axisymmetric two-dimensional numerical model of a gas atomizer while considering the secondary breakup. The work describes the gas flow dynamics and the process of metal droplet breakup. Ernesto Urionabarrenetxea et al. [13] did numerical simulation on the close-coupled gas atomization process and validated the gas flow dynamics using particle image velocimetry. The study focuses on the effect of the gas inlet pressure and the supersonic nozzle throat size. Yutong Shi et al. [14] performed both experiments and simulations on a high-pressure gas atomizer in order to observe the effect of gas inlet pressure on the obtained particle features. Tongchun Zhao et al. [15] conducted both experiments and simulations of a close-coupled gas atomizer and studied the influence of the Mach number of the gas jet on the obtained particle size, gas flow field, and cooling rate of the gas-atomized metal droplets. Li-Chong Zhang et al. [16] performed numerical simulations on the gas atomization process and used the discrete phase model to analyze the secondary breakup process of metal droplet atomization. The study investigates the satellite formation mechanism and characterizes the cross-sectional microstructure and morphology of the satellite’s collision region by scanning electron microscopy.
The use of CFD for HPGA process analysis offers a sustainable approach in the development and optimization of metal powder production. It reduces the dependency on extensive physical trials, thereby saving raw materials, energy, and time. CFD allows predictive modelling to optimize resource usage (e.g., gas consumption) and improve process efficiency, which aligns with sustainable manufacturing goals. By enhancing process understanding and reducing experimental waste, CFD contributes to a greener production methodology.
However, all these works still demonstrate a lack of a thorough optimization of the particle size using the main influencing parameters, which is extremely important for achieving optimum efficiency in a gas atomization system.
Overall, from a previous study [17], it is clear that for the high-velocity or supersonic gas jet, the Kelvin–Helmholtz instability model shows strong agreement with the experimental results. Then again, the equations of the Reynolds stress turbulence model were able to be entirely coupled with the DPM in a simulation to analyze the effect of the interaction between gas and droplets during atomization [7]. Therefore, in the present work, various numerical simulations were performed using the Reynolds stress turbulence model along with the KH instability model. These numerical simulations were focused on the optimization of inlet gas parameters. From previous studies [1,7,18], it was identified that the inlet gas temperature and inlet gas pressure are the most important parameters that determine the size of the particle.
On the other hand, the full factorial design is considered one of the most reliable designs of experiments (DOEs) of the factorial design method (FDM), used for optimization in various scientific or engineering fields due to its precise results. Full factorial designs have proven to be most effective for understanding the system and identifying the main effects of the input variables on the response variable. These input variables were identified as independent variables. This DOE is highly applicable in such situations, where it is important to rigorously investigate the whole factor space involved to influence the quality characteristic or performance measure of the process.
Hence, to facilitate effective optimization, the full factorial DOE was employed to investigate the influence of those process parameters (inlet gas temperature and inlet gas pressure) for optimizing the mean diameter of gas-atomized particles, which is also significant for a better understanding of the physics related to gas atomization and to determining the correct operational variables to achieve the desired quality of the obtained metal powder. Overall, the main objective of this study was to optimize the desired fineness of the metal powder while operating in a certain range of process parameters in an HPGA system.
2. Numerical Simulation Model Description
The molten metal film disintegrates into big droplets (reaching an average diameter of 500 µm) as soon as it comes in contact with the high-velocity gas stream, i.e., primary breakup. Then, these larger droplets are further atomized into smaller droplets during their flight trajectory to produce fine metal powders, i.e., secondary breakup [19,20].
Numerical investigations using single-particle injection have revealed that the melt droplet exposed to the gas jet becomes more and more flattened and then generally displays one of the following secondary atomization patterns. The first one is known as bag breakup, which occurs when the gas speed is equal to or slightly above the critical value required to start the droplet breakup process. The second one is known as stripping breakup. It occurs when the gas speed vastly surpasses the required critical velocity to shatter the droplet [19]. Apart from these two main types, there are also two more significant secondary breakup mechanisms, namely the catastrophic breakup and vibrational breakup mechanisms. Catastrophic breakup occurs at a very high relative velocity between gas and particles that far exceeds the critical value required to initiate the shattering of melt droplets. In the work of C. Chryssakis et al. [21], the breakup of a droplet was illustrated schematically, and was produced due to KH (Kelvin–Helmholtz) and/or RT (Rayleigh–Taylor) instabilities, where the various fragmentation processes are categorized on the basis of the rising Weber number (i.e., bag, stripping, and catastrophic breakup). On the other hand, the vibrational breakup mechanism is a very slow process that only occurs at a lower relative velocity, where the larger droplet breaks into smaller droplets due to its vibration. Therefore, it is not very effective in HPGA [19].
The numerical simulations were based on the solution of the unsteady Reynolds-averaged Navier–Stokes (RANS) equations, coupled with the energy transport equation. All transport equations were discretized using a second-order upwind scheme to ensure numerical accuracy and stability. The continuity and momentum equations are expressed as follows:
The continuity equation:
where is the fluid density, and is the velocity vector.
Momentum equation:
where τ is the viscous stress tensor, is the static pressure, and represents the momentum exchange between the gas and particle phases because of two-way coupling.
Energy equation:
where E is the total energy per unit mass, is the effective thermal conductivity, is the volumetric heat source, and Φ is the viscous dissipation term.
The Weber number is known to be the most significant parameter linked to the breakup physics [11], which is defined as:
where is the density of the atomization gas, is the relative velocity between the melt droplet and the gas, is the initial particle or blob radius, and is the coefficient of gas–droplet interfacial tension (surface tension).
Two robust breakup models, i.e., the TAB model and the KH model of instability, have been commonly used for numerically simulating droplet breakup in previous studies. Depending on the Weber number (We), this TAB model is better for bag breakup (12 < We < 100 approx.); on the other hand, the KH instability model exhibits better agreement with the results of previous experiments in the case of stripping and catastrophic breakup (100 < We < 800 approx.) [11].
For a high-velocity gas jet, the KH model provides much better agreement with the experimental results in terms of obtained particle size than the TAB model, as depicted by Liu et al. [17]. In a previous study, Zeoli and Gu [11] performed numerical simulations using both the TAB and the KH models, which showed no significant change in the overall diameter of the obtained particles. Here, the Kelvin–Helmholtz Rayleigh–Taylor (KHRT) fragmentation model and discrete phase model (DPM) were used in the present work to conduct numerical investigation of the HPGA to calculate the force and movement of droplets. This Kelvin–Helmholtz model is also considered to be the most accurate when assessing the speedily growing disturbances upon the surface of the droplets, which eventually become the reason behind the disintegration of the droplets. The KH model generally assumes the fastest growth of disturbance is occurring on the surface of the melt droplet, and the equivalent wavelength (Ʌ) of this disturbance is given by [22]:
where the Taylor number is mentioned as Ta, and the Ohnesorge number is mentioned as Oh. The maximum growth rate of the wavelength is:
The radius of the final particle formed in the gas atomizer is directly proportional to the fastest rising disturbance wavelength on the wobbly droplet surface (Ʌ). The obtained particle radius () is:
where is considered the model constant, with a value of 0.61, according to the analysis of Reitz [17]. The typical breakup time is given by Ref. [17] as:
where is an adjustable model constant, the value of which can be varied for every single breakup regime. In the Reitz analysis [17], is 10. To simulate the stretching and thinning mechanism of the child droplets pinching from a parent droplet, the law of the particle radius evaluation is:
The parent droplet diameter mentioned in Equation (6) will further reduce only if the amount of removed mass reaches at least three percent of its original mass at the beginning [11].
The current numerical model is subject to a few assumptions. The flow is considered axisymmetric and steady for computational efficiency. Droplet coalescence and collisions are not modeled, which may slightly influence the accuracy of particle size predictions in regions with high particle density. Surface tension effects and liquid-phase compressibility are neglected, simplifying the liquid breakup dynamics. The KHRT breakup model employed does not capture viscous damping or oscillatory breakup behavior. Additionally, the model excludes phase change phenomena and particle radiation.
3. Model Implementation
The above-defined secondary atomization model was applied for a confined nozzle HPGA system through a commercial CFD code, i.e., Ansys Fluent 2020R2. A computational domain was formed for the simulation of a supersonic gas atomizer with a traditional de Laval nozzle [23], as depicted in Figure 1. The geometry, boundary conditions, and initial inlet parameters were considered similar to those of the previous work of Zeoli and Gu [11] and Firmansyah et al. [7]. The number of elements considered in the grid was 30621, with the help of a grid-sensitivity test. The test result ensured that the grid was reasonably fine for the detention of all the flow characteristics in the high-pressure gas atomizer without the need for further refinement, and that the flow pattern would not show any variation with the additional increment in grid density, as shown in Figure 3a. The structured grid was sufficient for providing flow predictions as per the theories [11] of compressible flow consistently. The cells near the throat region appear to be the smallest, at around 0.001 m to 0.002 m in size. Also, the nozzle throat is well resolved, with approximately 10 cells across the narrowest section of the throat. These are structured hexahedral or quad elements, indicating good quality for capturing gradients in this high-speed flow zone.
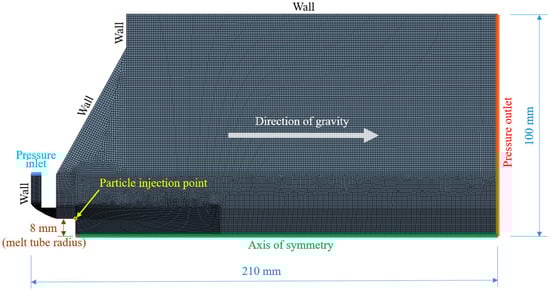
Figure 1.
Geometry and meshing of the computational domain with boundary conditions.
To simulate the transient compressible multiphase flow during high-pressure gas atomization, a pressure-based coupled solver was adopted with Rhie–Chow distance-based flux formulation. The first-order implicit transient scheme was chosen to ensure numerical stability across timesteps under compressible conditions. All governing equations—including momentum, pressure, energy, Reynolds stresses, and turbulence quantities—were discretized using the second-order upwind scheme to ensure higher-order spatial accuracy. Numerical stability was ensured through consistent convergence of residuals and stable evolution of particle tracking across timesteps. Under-relaxation factors were implicitly managed by the coupled solver in Fluent to ensure a stable yet responsive solution process.
In this study, a transient simulation was performed in the computational domain. To further ensure the accuracy of the process, very small time steps of 10−5 s and 5 × 10⁻⁷ s were deployed for the simulation of the gas phase and discrete phase (gas–droplet), respectively. A time step size analysis was also conducted to confirm that the precision of the simulation results was not dependent on the time step size, as shown in Figure 6. The simulation was completed using a total of 100,000 time steps, with a maximum of 60 iterations per time step allowed to ensure adequate convergence of the solution at each step. Time advancement was user-specified and employed a fixed time-stepping scheme for enhanced numerical stability.
To couple the result of the gas–droplet interactions throughout the atomization process, the gaseous-state equations of the Reynolds stress turbulence model [24] were combined with the discrete-phase model. The spraying of liquid was typically measured in several parcels. This can be made available through a definite amount of melt particles with similar energy, mass, and physical properties. The material properties were considered the same as those in the previous studies by Zeoli and Gu [11] and Firmansyah et al. [7], as shown in Table 1 and Table 2. Initially, the HPGA nozzle functioned at 11 atm of inlet or reservoir gas pressure during the simulation of the atomization domain. The pressure at the gas outlet was considered 1 atm. Later, the gas pressure of the inlet was altered by starting from 10 atm and increasing to 40 atm to study the effects of varying pressure.

Table 1.
Material properties of molten metal.
Table 2.
Material properties of atomization gas (nitrogen).
In the current study, the fluid nitrogen in the gaseous state was modeled as a compressible ideal gas, and other gas properties are specified in Table 2. The temperature of the inlet gas was primarily considered 300 K and eventually varied to 600 K for the parametric study. Figure 1 also illustrates the boundary conditions of the flow field geometry of the computational domain along with meshing, where the wall represents the adiabatic wall boundary. Here, wall surfaces were assumed to be adiabatic. This assumption is based on the high velocity of the atomization gas, which leads to very short residence times (in the order of milliseconds) in the atomization chamber and the negligible influence of wall heat transfer on the supersonic jet and particle breakup dynamics. Moreover, industrial atomization chambers are typically constructed with thick insulated walls that effectively limit heat conduction during operation.
Molten metal droplets were eventually released from the corner or tip of the molten metal feeding nozzle when the gas flow field reached a steady state inside the atomization section. The molten metal had a flow mass or feeding rate of 0.27619 kg/s with a temperature of 1900 K. Here, the diameters of the mean particles were measured at the pressure outlet after a certain flow time of 0.05 s. The system was regarded as reaching the steady state at 0.05 s, after which there was no significant change in the obtained metal particle diameter or the particle size distribution with further increment in flow time [7].
The obtained current cumulative mass size distributions of the liquid metal droplets were eventually compared to the prior numerical and experimental results. Then, different inlet gas parameters, such as temperature and pressure, were chosen due to their ease of accessibility for numerical investigation to produce finer powder.
A full-factorial DOE was used to study the influence of two key inlet parameters or process variables, i.e., the pressure and temperature of the inlet gas. This method makes it possible to determine the effects of each process variable and the interaction of each variable between all combinations of other process variables without presuming the implication of any individual variable. The studied factors were the inlet gas pressure, with an operating range of 5 to 40 atm, and the inlet gas temperature, with an operating range of 300 to 600 K, while the response variable was the mean particle diameter of the obtained metal powder.
To implement the full-factorial experimental design, four individual pressures, or four levels (10 atm, 20 atm, 30 atm, and 40 atm), were taken from the inlet gas pressure range, and three individual temperatures, or three levels (300 K, 450 K, and 600 K), were taken from the inlet gas temperature range. The experimental design with level values for those independent variables is specified in Table 3. A total of twelve simulation runs were considered to analyze the interaction between each individual level for a parent droplet size of 3 mm while keeping the same material properties as mentioned in Table 1 and Table 2. The cases were assigned on the basis of a full-factorial design structure with two factors, as shown in Table 4. After that, an analysis of the variance (ANOVA) was carried out on the basis of the full-factorial DOE to determine the significance of the inlet parameters. Then, optimization through the FDM was performed to discover the optimum condition for each inlet parameter from the accustomed model. The regression model for the full-factorial design with two independent factors, pressure and temperature, can be expressed as the following linear polynomial equation:
where Y is the response variable, i.e., mean particle size (µm); is the constant coefficient or the intercept term; and represent pressure (atm) and temperature (K), respectively; and and are the linear coefficients for the effect of pressure (10 atm, 20 atm, 30 atm, and 40 atm) and temperature (300 K, 450 K, and 600 K), respectively. A statistical software package named Minitab® (Version 18) was used to conduct the optimization process.
Table 3.
Actual values of the chosen factors or process parameters of the full-factorial design used for the numerical investigation to estimate the obtained particle diameter of a supersonic gas atomizer.
Table 4.
Full-factorial design table with two factors.
4. Results and Discussion
4.1. Gas Flow Dynamics
Initially, the numerical simulation of gas circulation in the atomizer was performed without the introduction of molten metal. The creation of various shocks that existed in the supersonic gas jet was revealed by the gas velocity flow field, as shown in Figure 2. This gas flow field data consistently agrees with theoretical descriptions of the high-speed gas jets from the previous investigations [11,25]. Soon after entering the atomization chamber, the inlet gas jet quickly expanded due to the pressure variation between the chamber and the nozzle exit. This produced a highly compressible turbulent flow with high velocity inside the atomization chamber; the velocity reached around 631 m/s, with a corresponding Mach number of 1.9. Consequently, just after entering the atomization chamber, a series of shocks and various waves were produced due to the expansion of the atomization gas. Inside the gas nozzle, an oblique shock was produced, which was then reflected by the external surface of the melt feeding nozzle.
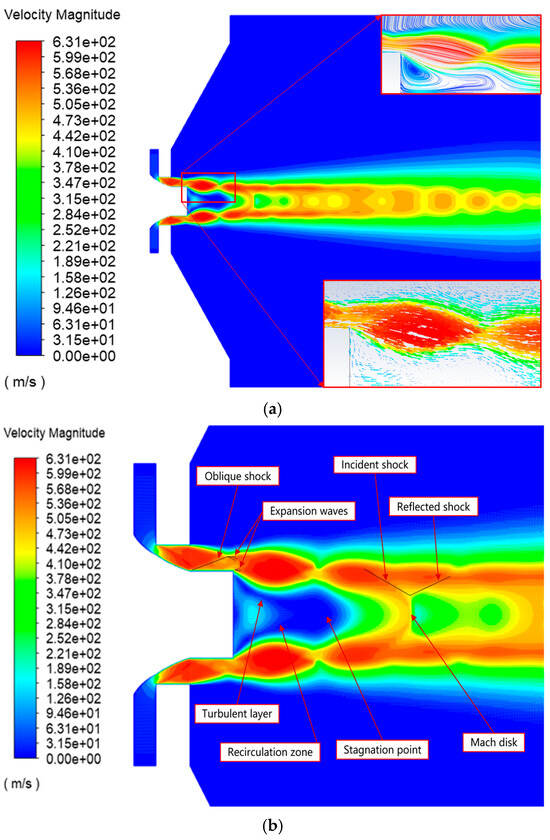
Figure 2.
Gas flow field without melt introduction. (a) Contour for the velocity magnitude of gas along with the path lines and velocity vectors of the nozzle exit area magnified in the upper and lower insets, respectively, and (b) magnified nozzle surrounding the area in the gas velocity contour plot.
After exiting through the nozzle, the gas stream followed the sequence of Prandtl–Meyer expansion waves and recompression shocks for expanding through the nebulizer in order to balance with the atmospheric pressure inside the atomizer, which matched with previous observations [26]. Moreover, as soon as the high-velocity gas jet arrived through the gas nozzle, a sharp gas flow angle was produced with respect to that gas nozzle, which yielded flow detachment from the wall. Yet, a continuous recirculation vortex was created under the corner area of the molten metal feeding nozzle throat, i.e., the formation of the recirculation zone under the base of the nozzle plug. That recirculation area was distinguished by the formation of sonic lines due to the turbulent layer separation between the high-speed upstream and low-speed downstream gas, which agrees with the result observed in experimental data [8]. There existed a stagnation point at the recirculation zone end, where the speed of the gas reached almost zero, which was clearly visible in the gas flow velocity profile, as shown in Figure 3a. Likewise, the Mach disk formation, oscillation behavior of the velocity, and presence of the shock inside the gas flow field were also clearly noticeable, as seen in Figure 3a, which is also consistent with the observation of Zeoli and Gu [11].
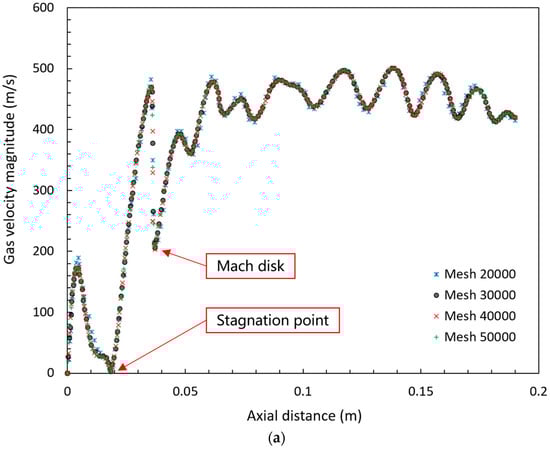
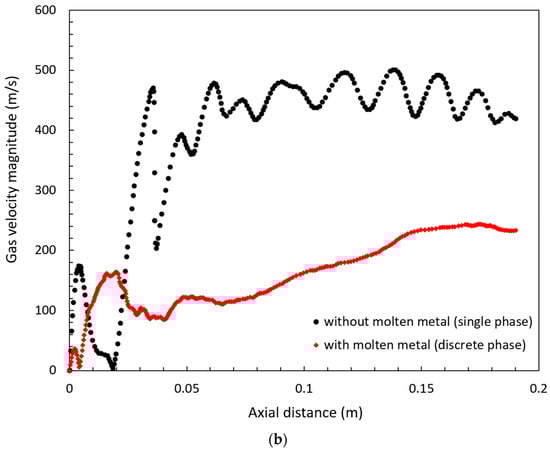
Figure 3.
Gas velocity profiles along the axis of symmetry: (a) without molten metal detected through multiple (four) grid systems, and (b) with molten metal v/s without molten metal.
The gas flow fields of the entire atomization area without and with the introduction of liquid metal are shown in Figure 2 and Figure 4, respectively. The various parts of the velocity distribution showed different features of a supersonic gas jet, including the formation of oblique shock, expansion waves, a Mach disk, etc., as labeled in Figure 2b. It is acknowledged that the shock structures in Figure 2b appear diffused, and the vortex patterns along the slip line are not sharply resolved. This is likely due to the inherent numerical diffusion of the second-order upwind scheme used in this study. To address this, future work will consider implementing the Reconstruction with Uniformly Accurate Numerical Dissipation (ROUND) scheme. The ROUND scheme offers high-resolution shock capturing and improved vortex preservation [27,28]. Its integration into the simulation framework is expected to enhance the fidelity of flow structure predictions in high-speed gas atomization processes.
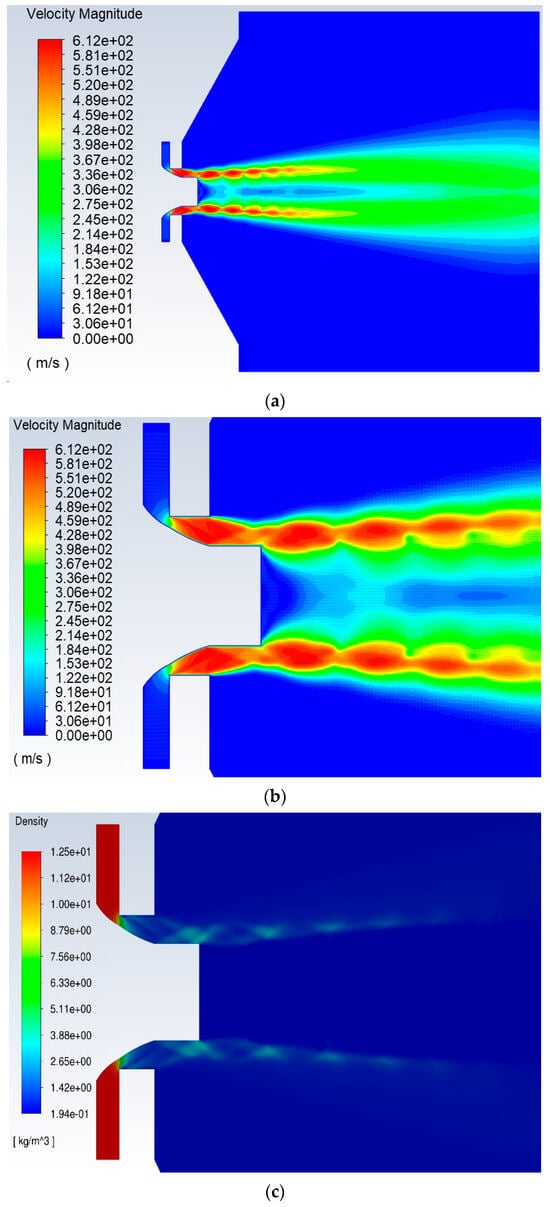
Figure 4.
Gas flow field with the introduction of molten metal: (a) contour for the velocity magnitude of gas, (b) magnified nozzle surrounding the area in the gas velocity contour plot, and (c) nozzle surrounding the area of the gas density field.
Before the introduction of the liquid metal droplets, the gas flow field displayed a typical repeating rhombus-shaped shock, distinctive to an unevenly expanding gas stream formed by the circular nozzle. After the introduction of the melt, the gas flow field usually crossed entirely through the mid-section of the gas jet to turn the large rhombus-patterned shock into a much smaller rhombus-patterned shock. An extreme mass loading effect was exposed due to this change in the gas flow pattern. This mass loading effect eventually decreased the total velocity of the gas flow and produced a substantial radial velocity gradient in the core of the gas jet, as shown in Figure 3b and Figure 4a,b. In Figure 4c, the density field further verifies the flow pattern by showing the change in gas density, which matches the gas velocity contour.
Overall, all these phenomena showed a clear agreement with the previous experimental observations [8] and also matched with the results obtained in previous numerical studies [7,11], thus validating the current numerical results. It is also known that, apart from the atomizer’s structural design, the inlet parameters control the efficiency of the atomizer. This leads to the necessity of optimizing these key parameters. The issue of inlet parameter optimization will be addressed subsequently.
4.2. Droplet Breakup Dynamics
The process of droplet breakup typically occurs in two steps: the first step is called primary breakup, and the second step is known as secondary breakup [19]. It is known that the overall obtained mean particle diameter primarily depends on the secondary breakup process [8]. In this regard, the primary breakup process was not taken into consideration in the present study, as it does not have any significant effect on determining the final droplet size. Previous research data showed that higher inlet gas pressure produces more fine melt droplets due to the supersonic region elongation of the gas jet that extends the secondary atomization period [8].
In this study, the melt droplet size after the primary breakup was considered to be 3 mm. This modeling choice was based on prior validated studies with similar atomizer geometries and operating conditions [e.g., Firmansyah et al. [7]; Zeoli and Gu [11]], where a thorough sensitivity analysis of the parent droplet diameter was already performed and demonstrated that variations in initial droplet size within a realistic range (1–5 mm) do not significantly impact the overall trends or optimization outcomes for operating gas variables. The continuous release of those melt droplets was initiated from the periphery of the melt nozzle to initiate the secondary breakup. The Lagrangian discrete-phase model was used to simulate the droplet behaviors to enable the tracking of size change and motion of the particles, as displayed in Figure 5.
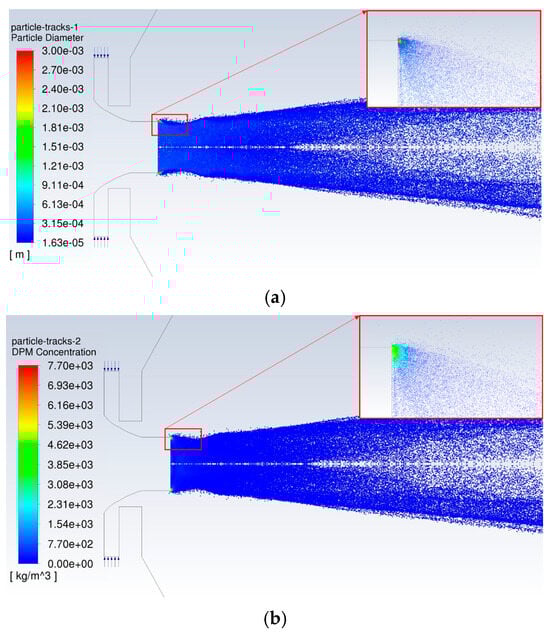
Figure 5.
Traces of droplets throughout the domain during atomization. The nozzle surrounding the area of the gas–melt interaction is magnified in the inset. (a) Particle diameter; (b) DPM concentration.
The trajectories of the particles during atomization looked like the usual comet-like appearance of the particles photographed, as illustrated by prior work [8]. The different particle sizes are represented by the different colors in Figure 5. In Figure 5, starting from the edge of the melt nozzle, the large droplets experience a course of fast breakup and eventually turn into smaller droplets, where the parcels are depicted as dots that gradually change from red to blue as the droplet size decreases. As the breakup happened mainly near the edge of the melt nozzle, this area, specified by a box, is magnified in the upper right corner of Figure 5. Here, a bunch of the derived small droplets with a diameter of 40–70 µm were continuously produced from the initial large droplet, with a larger diameter of 3 mm, which was released from the melt nozzle corner, where the gas momentum was very high, causing a gradual decrease in droplet size. Immediately after the shifting from their parental form, those derived small droplets usually spread out in the direction of the annular boundary of the gas jet stream and drifted very fast in the downstream direction. The fragmentation of droplets was not possible when their Weber number dropped below ten because of their small size.
In contrast, some initial large droplets moved towards the radially inward direction and flowed up to a certain distance (0–10 mm) downstream from the end of the melt tube/nozzle, where their relative velocity decreased significantly. After that, they moved outward from the axis of symmetry due to the oscillatory flow pattern of the gas jet, where they tended to recover some amount of relative velocity and restarted the breakup process from the initial large droplets. Due to the continuous supply of large droplets (3 mm) through the melt nozzle, high velocity-derived small droplets could move near or pass by some other large droplets released earlier. Thus, at the same time, parent droplets could co-exist with other derived small droplets up to a certain distance axially from the edge of the melt nozzle, as displayed in Figure 5.
To explore the distribution of various particle sizes obtained through atomization, the cumulative mass size distribution of droplets was measured at the outlet or exit boundary through simulation, which was generated upon a constant release of large droplets, as shown in Figure 6. In Figure 6, the current result was also compared with the previous simulation result by Firmansyah et al. [7] and the experimental results from Li-Chong Zhang et al. [16] and Anderson and Terpstra [29]. As depicted in the figure, the current results are in good agreement with previous results, with a mean deviation of only about 6% from the experimental result of Anderson and Terpstra [29], due to similar geometry and boundary conditions. In an attempt to control and improve the quality of the metal powder, the effect of key inlet parameters such as inlet gas pressure and temperature was optimized in the following section based on numerical simulation data of the gas atomizer.
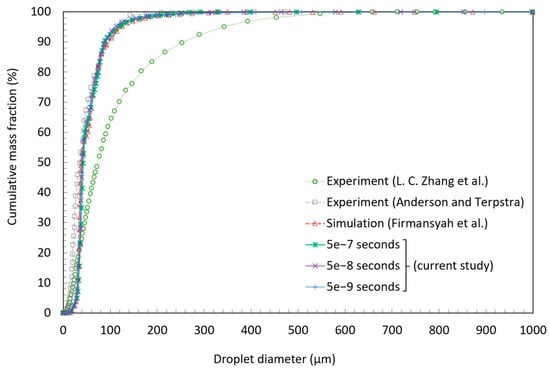
Figure 6.
Cumulative mass size distributions of particles at the pressure outlet obtained from three different time step sizes in comparison with the previous numerical simulation (Firmansyah et al. [7]) and experimental (Li-Chong Zhang et al. [16], Anderson and Terpstra [29]) data.
4.3. Inlet Parameter Optimization
Through the literature review, it was observed that the powder particle size obtained by the metal atomization highly relies on the key inlet parameters of the atomizing gas, especially the inlet pressure and temperature. That is why the objective of this current work was to determine the influence of these factors on the obtained particle size from atomization. Therefore, the overall mean diameter of the obtained powder particle was chosen as the response variable in this study in order to discuss the outcomes obtained from the full-factorial DOE.
Table 5 shows twelve cases of numerical simulation trials designed with specified conditions subject to the statistical design of experiments along with their responses. The factorial design model for the particle size was optimized with a 95% confidence level for all intervals. Then, the effect of inlet gas parameters during the molten metal atomization was studied. The coefficients for the effect of inlet gas pressure and inlet gas temperature were obtained through the full-factorial regression analysis, as shown in Table 6. The relationship of the response variable (Y) with the coded values of the process variables inlet gas pressure (: 10 atm, 20 atm, 30 atm, and 40 atm) and inlet gas temperature (: 300 K, 450 K, and 600 K) is shown as a regression model in Equation (8) for the mean particle size (µm).
Table 5.
Results obtained from the numerical simulation trails performed for the optimization of inlet parameters.
Table 6.
Coefficients of the full-factorial regression analysis.
After the responses obtained from the interaction of those independent factors, those results were further investigated in order to determine the interactive nature of the inlet parameters in various circumstances. It was observed that the produced metal particle size decreased with the rise of both inlet gas pressure and inlet gas temperature, as shown in Figure 7. However, through the result shown by the optimization plot in Figure 7b, it was clear that the effect of inlet gas pressure appreciably outweighed the influence of inlet gas temperature in terms of controlling the particle size obtained from HPGA. Here, Figure 7c shows that the finest possible metal powder can be obtained by applying the highest available pressure along with the highest available temperature of the inlet gas within the operational boundaries.
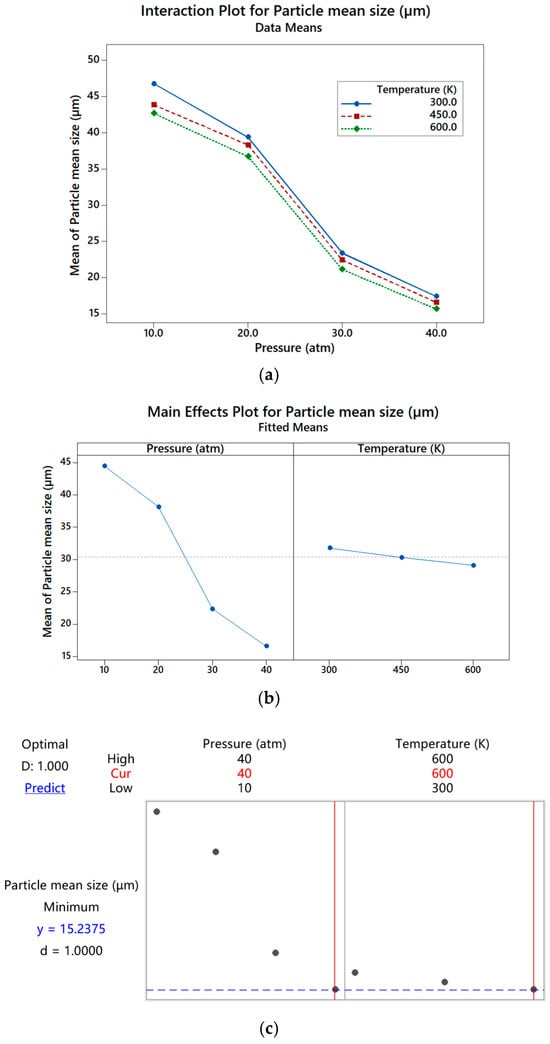
Figure 7.
Effect of inlet gas pressure (atm) and temperature (K) on mean particle size (µm): (a) interaction plot, (b) main effects plot, and (c) predicted values shown by the optimization plot.
The outcome of the influence of inlet gas temperature and pressure on the obtained particle diameter can be seen in the contour plot shown in Figure 8. The response shows that the obtained particle size was decreasing as usual with the higher atomization gas pressure due to better dispersion and the formation of smaller droplets, as desired in this work, which occurs due to the higher velocity of atomization gas that upsurges the relative velocity between atomization gas and melt, thereby resulting in rapid breakup. On the other hand, it was noticed that the particle size started getting smaller, while the value of the atomization gas temperature became higher. This is due to the phenomenon of inlet gas velocity increment by the contribution of increasing gas temperature as the volume of gas increases with the temperature. As a result, the relative velocity between the gas and droplets also increases and eventually leads to an increase in overall atomization efficiency. In summary, the simulation results show how the quality of the gas-atomized powder can be improved by varying certain inlet gas parameters (pressure and temperature) and predict the optimum conditions to obtain the finest possible metal powder while operating the pressure and temperature within a specific range, which is expected in a real situation.
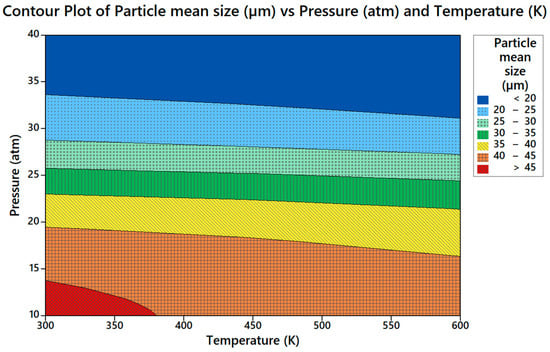
Figure 8.
Contour plot of mean particle size for various inlet gas pressures and temperatures.
In Figure 7, it is also noticeable that there was a sharp drop in mean particle size while changing the inlet gas pressure from 20 atm to 30 atm. To understand the reason behind such a phenomenon, the results of four numerical simulations with different pressures (10 atm, 20 atm, 30 atm, and 40 atm) at a constant gas temperature of 300 K were taken for the qualitative comparison. From the pressure contours in Figure 9, it was observed that the gas pressure rapidly dropped while the gas stream moved from the throat area towards the exit through the diverging section of the supersonic nozzle due to the increasing area. At a 10 atm inlet gas pressure, the nozzle exit pressure remained lower compared to the ambient or outside pressure, as shown in Figure 9a. The nozzle exit pressure was roughly matched with the outside pressure when the inlet gas pressure increased up to 20 atm, causing a visible reduction in pressure fluctuation in the shock cells, i.e., a reduction in shock wave formation, as shown in Figure 9b. After that, when the inlet gas pressure was further increased, the pressure at the nozzle exit gradually became higher than the outside pressure, as shown in Figure 9c,d. The subsequent changes in static pressure along the symmetry axis after the nozzle exit are also shown in Figure 11a.
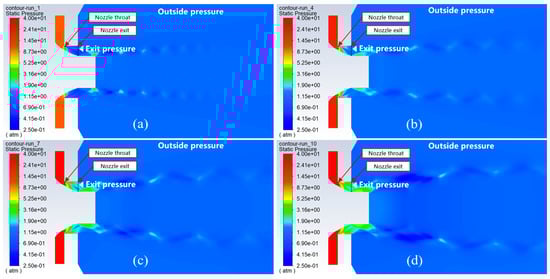
Figure 9.
Contours of the static pressure of the gas flow field during atomization at a constant gas temperature of 300 K, with different pressures: (a) 10 atm, (b) 20 atm, (c) 30 atm, and (d) 40 atm.
The velocity contours, displayed in Figure 10, show that the flow was accelerated while passing through the diverging section of the nozzle because, in supersonic compressible flows, the velocity is directly proportional to the area. Since the exit pressure of the nozzle was below the outside pressure in the case of the 10 atm inlet gas pressure, the nozzle exit flow converged and caused an overexpanded jet flow, as shown in Figure 10a. For the 20 atm inlet gas pressure, the slip line was nearly parallel to the axis, and the gas flow left the nozzle with almost the same diameter as the diameter of the exit nozzle, i.e., there was almost no deflection of flow at the nozzle exit, as shown in Figure 10b. For the case with 30 atm and 40 atm of inlet gas pressure, as shown in Figure 10c and Figure 10d, respectively, where the exit pressure of the nozzle was higher than the outside pressure, the gas coming from the nozzle expanded outward as soon as it left the nozzle. This flow behavior is also known as underexpanded jet flow.
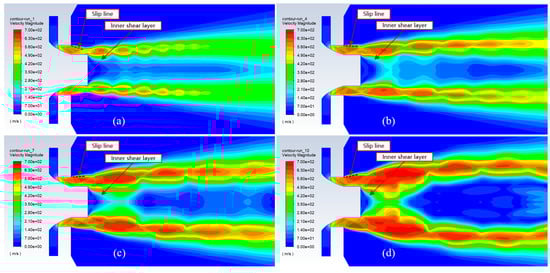
Figure 10.
Contours of the velocity magnitude of the gas flow field during atomization at a constant gas temperature of 300 K, with different pressures: (a) 10 atm, (b) 20 atm, (c) 30 atm, and (d) 40 atm.
The comparison among velocity contours in Figure 10 shows that when the inlet gas pressure increased, the inner shear layer moved towards the axis and produced a relatively higher gas velocity in the secondary breakup zone of the atomizer, where the interaction between melt and gas jet occurred. Figure 10 also shows a significant increase in the size of the shock cells with the rise in inlet gas pressure. The cumulative mass size distribution of particles from the numerical simulation results for different pressures (10 atm, 20 atm, 30 atm, and 40 atm) are compared in Figure 11b, which shows a substantial improvement in the powder fineness while the overexpanded gas jet transformed into the underexpanded form.
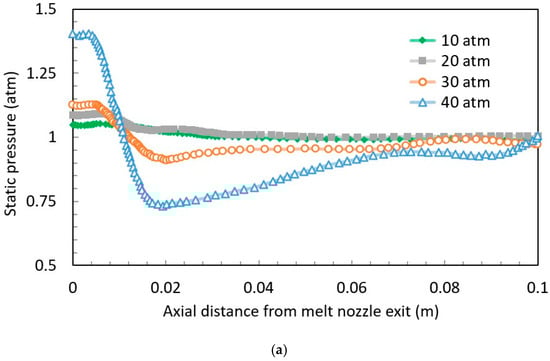
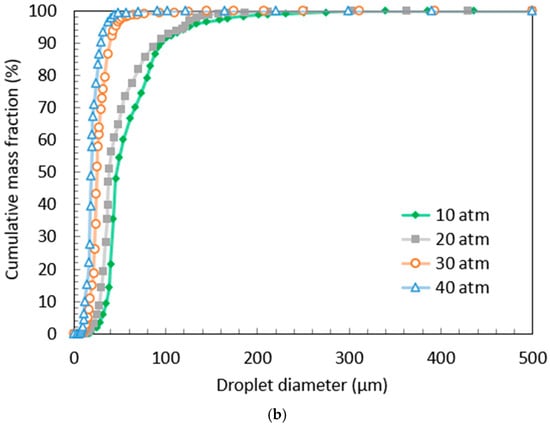
Figure 11.
Effects of different gas inlet pressures (10 atm, 20 atm, 30 atm, and 40 atm) for a certain inlet gas temperature (300 K): (a) on the profiles of static pressure along the axis, and (b) on the cumulative mass size distribution of particles at the pressure outlet.
In further analysis, an overexpanded and an underexpanded jet flow were chosen to understand the difference in their respective flow pattern, as shown in Figure 12. Initially, the flow was detached from the downstream of the nozzle throat section, and a normal shock wave formation also occurred that extended towards the tip of the nozzle, known as internal shock. This internal shock was eventually reflected by the wall around the nozzle tip and formed an oblique shock wave, which is also called the reflected shock. In the case of the overexpanded jet flow, where the nozzle exit pressure was below the outside pressure, the overexpansion shock formation occurred at the exit of the nozzle, as the flow was actually trying to reach pressure equilibrium. These shock waves increased the pressure and made the pressure equal to the outside pressure but also changed the direction of the gas inward. Then, eventually, more oblique shocks formed from the intersection point of the previous shockwaves (reflected shock and overexpansion shock), causing the gas pressure to increase even more than the outside pressure, as shown in Figure 12a.
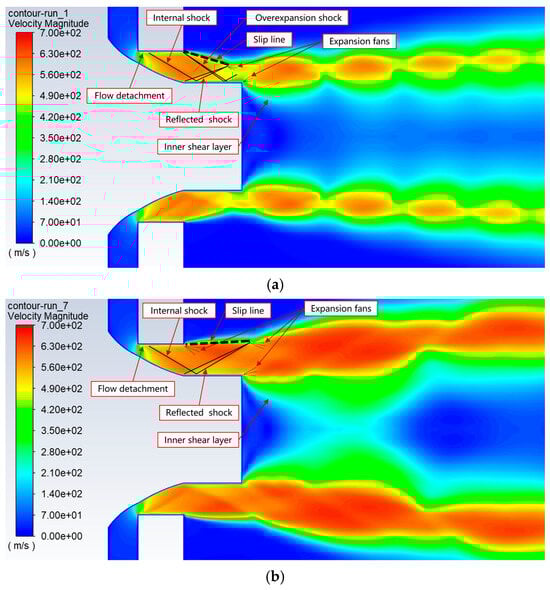
Figure 12.
Velocity contours of the gas flow field around the nozzle exit during atomization at a constant gas temperature of 300 K, with different pressures: (a) 10 atm (overexpanded jet), and (b) 30 atm (underexpanded jet).
As the flow had gone inside two shockwaves and the pressure exceeded the back pressure, in an attempt to achieve equilibrium, the flow eventually went through a series of expansion waves (also known as a Prandtl–Meyer expansion fan). The slip line is a line connecting the shocks at the edge. Static pressure across the slip line stays constant, but the velocity can change. As the flow was losing energy after leaving the nozzle, the subsequent shock waves were usually a bit weaker than the previous ones. Thus, the slip line was angled inward after the initial oblique shocks from the nozzle tip in the case of overexpanded jet flow. Similar principles are also applicable to the underexpanded jet flow.
In contrast, the pressure at the nozzle exit exceeded the outside or ambient pressure when the gas jet was underexpanded. Since the gas coming from the exit nozzle was at a higher pressure than the surrounding gas, a set of expansion waves formed instead of the overexpansion shock at the nozzle exit as the gas flow was trying to reach the pressure equilibrium. These expansion waves reduced the gas pressure and made it equal to the outside pressure. This event also changed the direction of the gas outward and formed the slip line at a bigger angle. i.e., the flow deflection angle was positive relative to the axis, as displayed in Figure 12b. As the nozzle exit pressure was higher than the surrounding air pressure in the underexpanded flow, the atomization gas flow expanded rapidly as it left the nozzle. Therefore, compared to the overexpanded jet flow, the underexpanded jet flow produced a much higher velocity at the gas–melt interaction zone and caused better energy transfer between melt droplets and the atomization gas due to the increment in thrust force going directly toward that area, as shown in Figure 12. Therefore, the underexpanded jet flow produced much finer metal powder compared to the overexpanded jet flow.
5. Conclusions
This study numerically examined molten metal atomization in a supersonic gas atomizer for a better understanding of the physical phenomenon. A numerical model for the simulation of the secondary breakup of melt droplets during the high-pressure gas atomization (HPGA) process, with two-way gas–droplet coupling, was designed and validated. To produce more fine metal powder, optimization was performed to examine the effect of key parameters (pressure and temperature) of the inlet gas on the atomization process based on the results obtained from the numerical simulation. The major conclusions are summarized as follows.
- The use of a full-factorial DOE combined with CFD studies allowed for effective optimization and prediction of the required inlet gas pressure and temperature within a specific range for obtaining the desired fineness of the gas-atomized metal powder in a supersonic gas atomizer.
- Overexpanded and underexpanded gas jets showed distinct impacts on flow fields and powder morphology, with shockwave patterns significantly influencing atomization quality.
- Higher inlet gas pressures and temperatures improved the atomization process and reduced particle size, with pressure having a stronger influence.
- CFD simulations revealed a series of shockwaves in the flow field, which played a pivotal role in the secondary droplet breakup process.
- Increasing the inlet gas pressure significantly enlarged the shock cell size and enhanced the atomization performance.These results advance the understanding of HPGA physics and support the efficient and sustainable production of fine metal powders through numerical optimization.
The findings from this study have direct industrial relevance in the context of metal powder production for additive manufacturing and powder metallurgy applications. The optimized inlet gas parameters (pressure and temperature) identified through CFD-DOE integration can serve as operational guidelines for manufacturers to improve powder quality and production efficiency. The approach is scalable and can be adapted to different atomizer designs and alloy systems, facilitating its integration into industrial-scale high-pressure gas atomization (HPGA) units. By minimizing trial-and-error experiments, the proposed method contributes to reducing development time and cost in powder production workflows, thereby promoting its adoption in commercial environments.
Author Contributions
Conceptualization, S.M. and C.-C.W.; methodology, S.M.; software, C.-C.W.; validation, S.M.; formal analysis, S.M.; investigation, S.M.; data curation, S.M.; writing—original draft, S.M.; writing—review and editing, S.M.; supervision, C.-C.W.; project administration, C.-C.W.; funding acquisition, C.-C.W. All authors have read and agreed to the published version of the manuscript.
Funding
This research was funded by the National Science and Technology Council, Taiwan, under contract number NSTC 112-2221-E-A49-020.
Data Availability Statement
The original contributions presented in this study are included in the article. Further inquiries can be directed to the corresponding author.
Conflicts of Interest
The authors declare no conflict of interest.
Nomenclature
| Parameter | Definition |
| , | constants for the KH model |
| Oh | Ohnesorge number |
| r | radius of droplets |
| t | time (s) |
| Ta | Taylor number |
| inlet gas pressure (atm) | |
| inlet gas temperature (K) | |
| mean particle size (µm) | |
| V | velocity (m/s) |
| We | Weber number |
| Greek symbols | |
| Constant coefficient | |
| coefficient for the effect of inlet gas pressure (atm) | |
| coefficient for the effect of inlet gas temperature (K) | |
| wavelength (m) | |
| σ | surface tension (N/m) |
| density (kg/m3) | |
| maximum wavelength growth rate (m/s) | |
| Subscripts | |
| b | breakup |
| g | gas |
| l | liquid |
| P | parent |
| rel | relative |
| Abbreviations | |
| ANOVA | analysis of variance |
| CFD | computational fluid dynamics |
| DOE | design of experiments |
| DPM | discrete-phase model |
| FDM | factorial design method |
| HPGA | high-pressure gas atomization |
| KH | Kelvin–Helmholtz |
| RT | Rayleigh–Taylor |
| TAB | Taylor analogy breakup |
| VIF | variance inflation factor |
References
- Arachchilage, K.H.; Haghshenas, M.; Park, S.; Zhou, L.; Sohn, Y.; McWilliams, B.; Cho, K.; Kumar, R. Numerical simulation of high-pressure gas atomization of two-phase flow: Effect of gas pressure on droplet size distribution. Adv. Powder Technol. 2019, 30, 2726–2732. [Google Scholar] [CrossRef]
- Neikov, O.D.; Yefimov, N.; Naboychenko, S. Handbook of Non-Ferrous Metal Powders: Technologies and Applications; Elsevier: Amsterdam, The Netherlands, 2009. [Google Scholar]
- Mandal, S.; Sadeghianjahromi, A.; Wang, C.-C. Experimental and numerical investigations on molten metal atomization techniques–A critical review. Adv. Powder Technol. 2022, 33, 103809. [Google Scholar] [CrossRef]
- Kuhn, H.A.; Lawley, A. New techniques and analyses. In Powder Metallurgy Processing; Academic Press: Cambridge, MA, USA, 1978. [Google Scholar]
- Nasr, G.G.; Yule, A.J.; Bendig, L. Industrial Sprays and Atomization: Design, Analysis and Applications; Springer Science & Business Media: Berlin, Germany, 2002. [Google Scholar]
- Zheng, B.; Lavernia, E. Melt Atomization. In Handbook of Atomization and Sprays: Theory and Applications; Springer: Berlin/Heidelberg, Germany, 2011; pp. 837–848. [Google Scholar]
- Firmansyah, D.A.; Kaiser, R.; Zahaf, R.; Coker, Z.; Choi, T.-Y.; Lee, D. Numerical simulations of supersonic gas atomization of liquid metal droplets. Jpn. J. Appl. Phys. 2014, 53, 05HA09. [Google Scholar] [CrossRef]
- Mates, S.P.; Settles, G.S. A study of liquid metal atomization using close-coupled nozzles, Part 1: Gas dynamic behavior. At. Sprays 2005, 15, 19–40. [Google Scholar] [CrossRef]
- Ünal, A. Flow separation and liquid rundown in a gas-atomization process. Metall. Trans. B 1989, 20, 613–622. [Google Scholar] [CrossRef]
- Markus, S.; Fritsching, U. Discrete break-up modeling of melt sprays. Int. J. Powder Metall. 1986 2006, 42, 23–32. [Google Scholar]
- Zeoli, N.; Gu, S. Numerical modelling of droplet break-up for gas atomisation. Comput. Mater. Sci. 2006, 38, 282–292. [Google Scholar] [CrossRef]
- Du, K.; Gao, X.; Li, Z.; Shen, J.; Ma, Y.; Hu, Y.; Sun, H. Numerical analysis on secondary breakup process of metal droplet in gas atomization. At. Sprays 2019, 29, 455–476. [Google Scholar] [CrossRef]
- Urionabarrenetxea, E.; Martín, J.M.; Avello, A.; Rivas, A. Simulation and validation of the gas flow in close-coupled gas atomisation process: Influence of the inlet gas pressure and the throat width of the supersonic gas nozzle. Powder Technol. 2022, 407, 117688. [Google Scholar] [CrossRef]
- Shi, Y.; Lu, W.; Sun, W.; Zhang, S.; Yang, B.; Wang, J. Impact of gas pressure on particle feature in Fe-based amorphous alloy powders via gas atomization: Simulation and experiment. J. Mater. Sci. Technol. 2022, 105, 203–213. [Google Scholar] [CrossRef]
- Zhao, T.; Chen, C.; Liu, X.; Hao, J. Effect of gas Mach number on the flow field of close-coupled gas atomization, particle size and cooling rate of as-atomized powder: Simulation and experiment. Adv. Powder Technol. 2023, 34, 104007. [Google Scholar] [CrossRef]
- Zhang, L.-C.; Xu, W.-Y.; Li, Z.; Zheng, L.; Liu, Y.-F.; Zhang, G.-Q. Mechanism of rapidly solidified satellites formation in gas atomized powders: Simulation and characterization. Powder Technol. 2023, 418, 118162. [Google Scholar] [CrossRef]
- Liu, A.B.; Mather, D.; Reitz, R.D. Modeling the effects of drop drag and breakup on fuel sprays. SAE Trans. 1993, 102, 83–95. [Google Scholar]
- Zeoli, N.; Gu, S. Computational validation of an isentropic plug nozzle design for gas atomisation. Comput. Mater. Sci. 2008, 42, 245–258. [Google Scholar] [CrossRef]
- Ünal, A. Liquid break-up in gas atomization of fine aluminum powders. Metall. Trans. B 1989, 20, 61–69. [Google Scholar] [CrossRef]
- Dias, G.S.; Machado, D.A.; de Andrade, J.C.; de Souza Costa, F. ENC-2020-0193 hydrous ethanol atomization by impinging jets. In Proceedings of the 18th Brazilian Congress of Thermal Sciences and Engineering, Virtual, 16–20 November 2020. [Google Scholar]
- Chryssakis, C.; Assanis, D.; Tanner, F. Atomization Models. In Handbook of Atomization and Sprays: Theory and Applications; Springer: Berlin/Heidelberg, Germany, 2011; pp. 215–231. [Google Scholar]
- Reitz, R.D. Modeling atomization processes in high-pressure vaporizing sprays. At. Spray Technol. 1987, 3, 309–337. [Google Scholar]
- Si, C.-R.; Zhang, X.-J.; Wang, J.-B.; Li, Y.-J. Design and evaluation of a Laval-type supersonic atomizer for low-pressure gas atomization of molten metals. Int. J. Miner. Metall. Mater. 2014, 21, 627–635. [Google Scholar] [CrossRef]
- Launder, B.E.; Reece, G.J.; Rodi, W. Progress in the development of a Reynolds-stress turbulence closure. J. Fluid Mech. 1975, 68, 537–566. [Google Scholar] [CrossRef]
- Mi, J.; Figliola, R.; Anderson, I. A numerical simulation of gas flow field effects on high pressure gas atomization due to operating pressure variation. Mater. Sci. Eng. A 1996, 208, 20–29. [Google Scholar] [CrossRef]
- Zeoli, N. Multiphase Modelling of the Characteristics of Close Coupled Gas Atomization. Ph.D. Thesis, Aston University, Birmingham, UK, 2011. [Google Scholar]
- Deng, X. A new open-source library based on novel high-resolution structure-preserving convection schemes. J. Comput. Sci. 2023, 74, 102150. [Google Scholar] [CrossRef]
- Deng, X. A unified framework for non-linear reconstruction schemes in a compact stencil. Part 1: Beyond second order. J. Comput. Phys. 2023, 481, 112052. [Google Scholar] [CrossRef]
- Anderson, I.E.; Terpstra, R.L. Progress toward gas atomization processing with increased uniformity and control. Mater. Sci. Eng. A 2002, 326, 101–109. [Google Scholar] [CrossRef]
Disclaimer/Publisher’s Note: The statements, opinions and data contained in all publications are solely those of the individual author(s) and contributor(s) and not of MDPI and/or the editor(s). MDPI and/or the editor(s) disclaim responsibility for any injury to people or property resulting from any ideas, methods, instructions or products referred to in the content. |
© 2025 by the authors. Licensee MDPI, Basel, Switzerland. This article is an open access article distributed under the terms and conditions of the Creative Commons Attribution (CC BY) license (https://creativecommons.org/licenses/by/4.0/).