
Holistically Green and Sustainable Pathway Prioritisation for Chemical Process Plant Systems via a FAHP–TOPSIS Framework


Abstract
1. Introduction
2. Materials and Methods
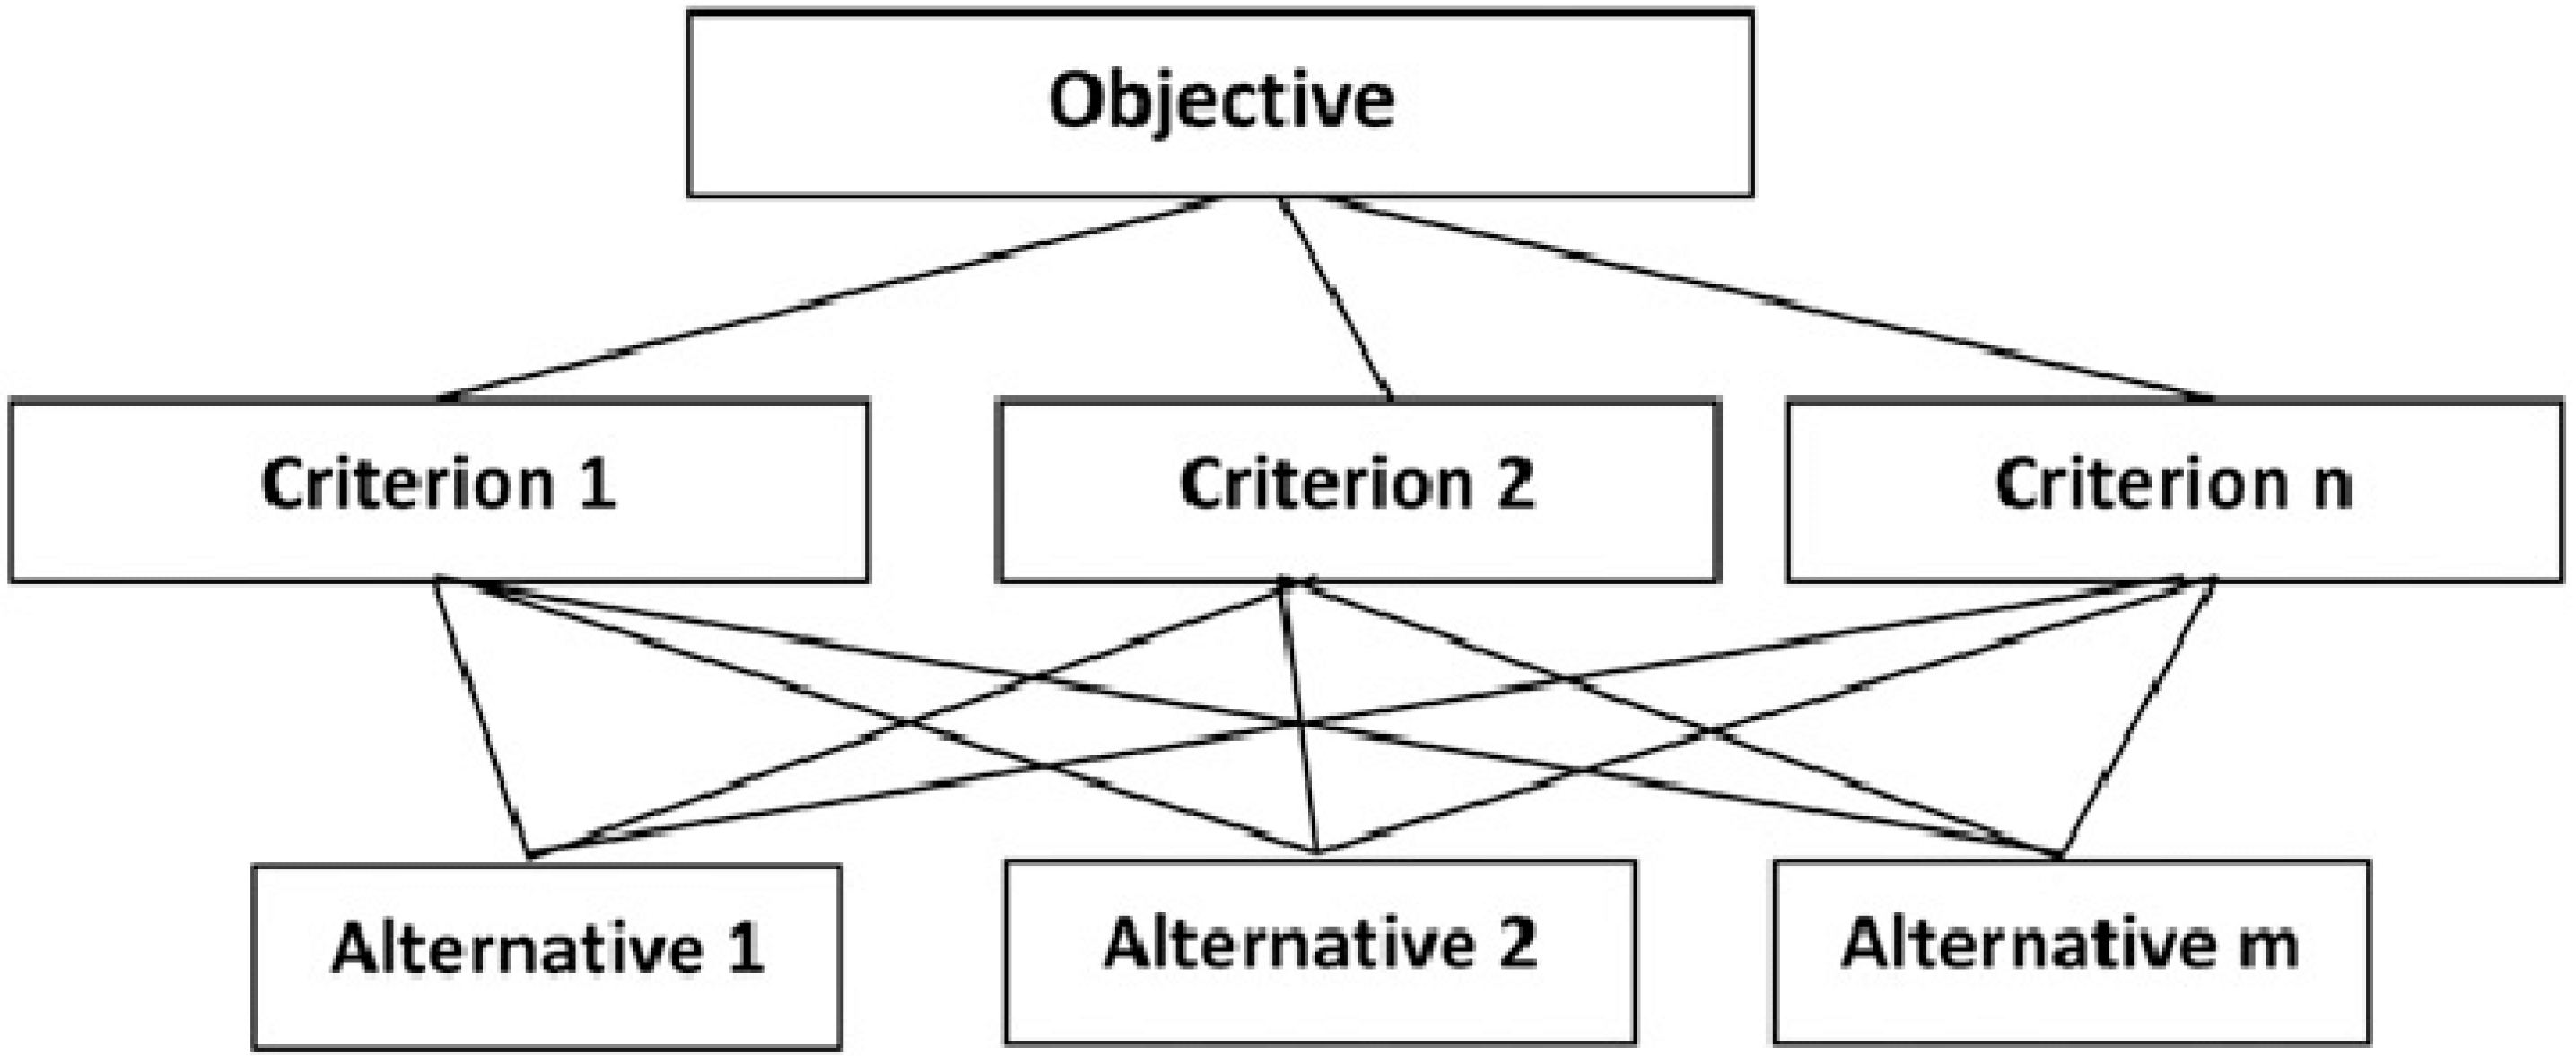
2.1. MCDM Framework
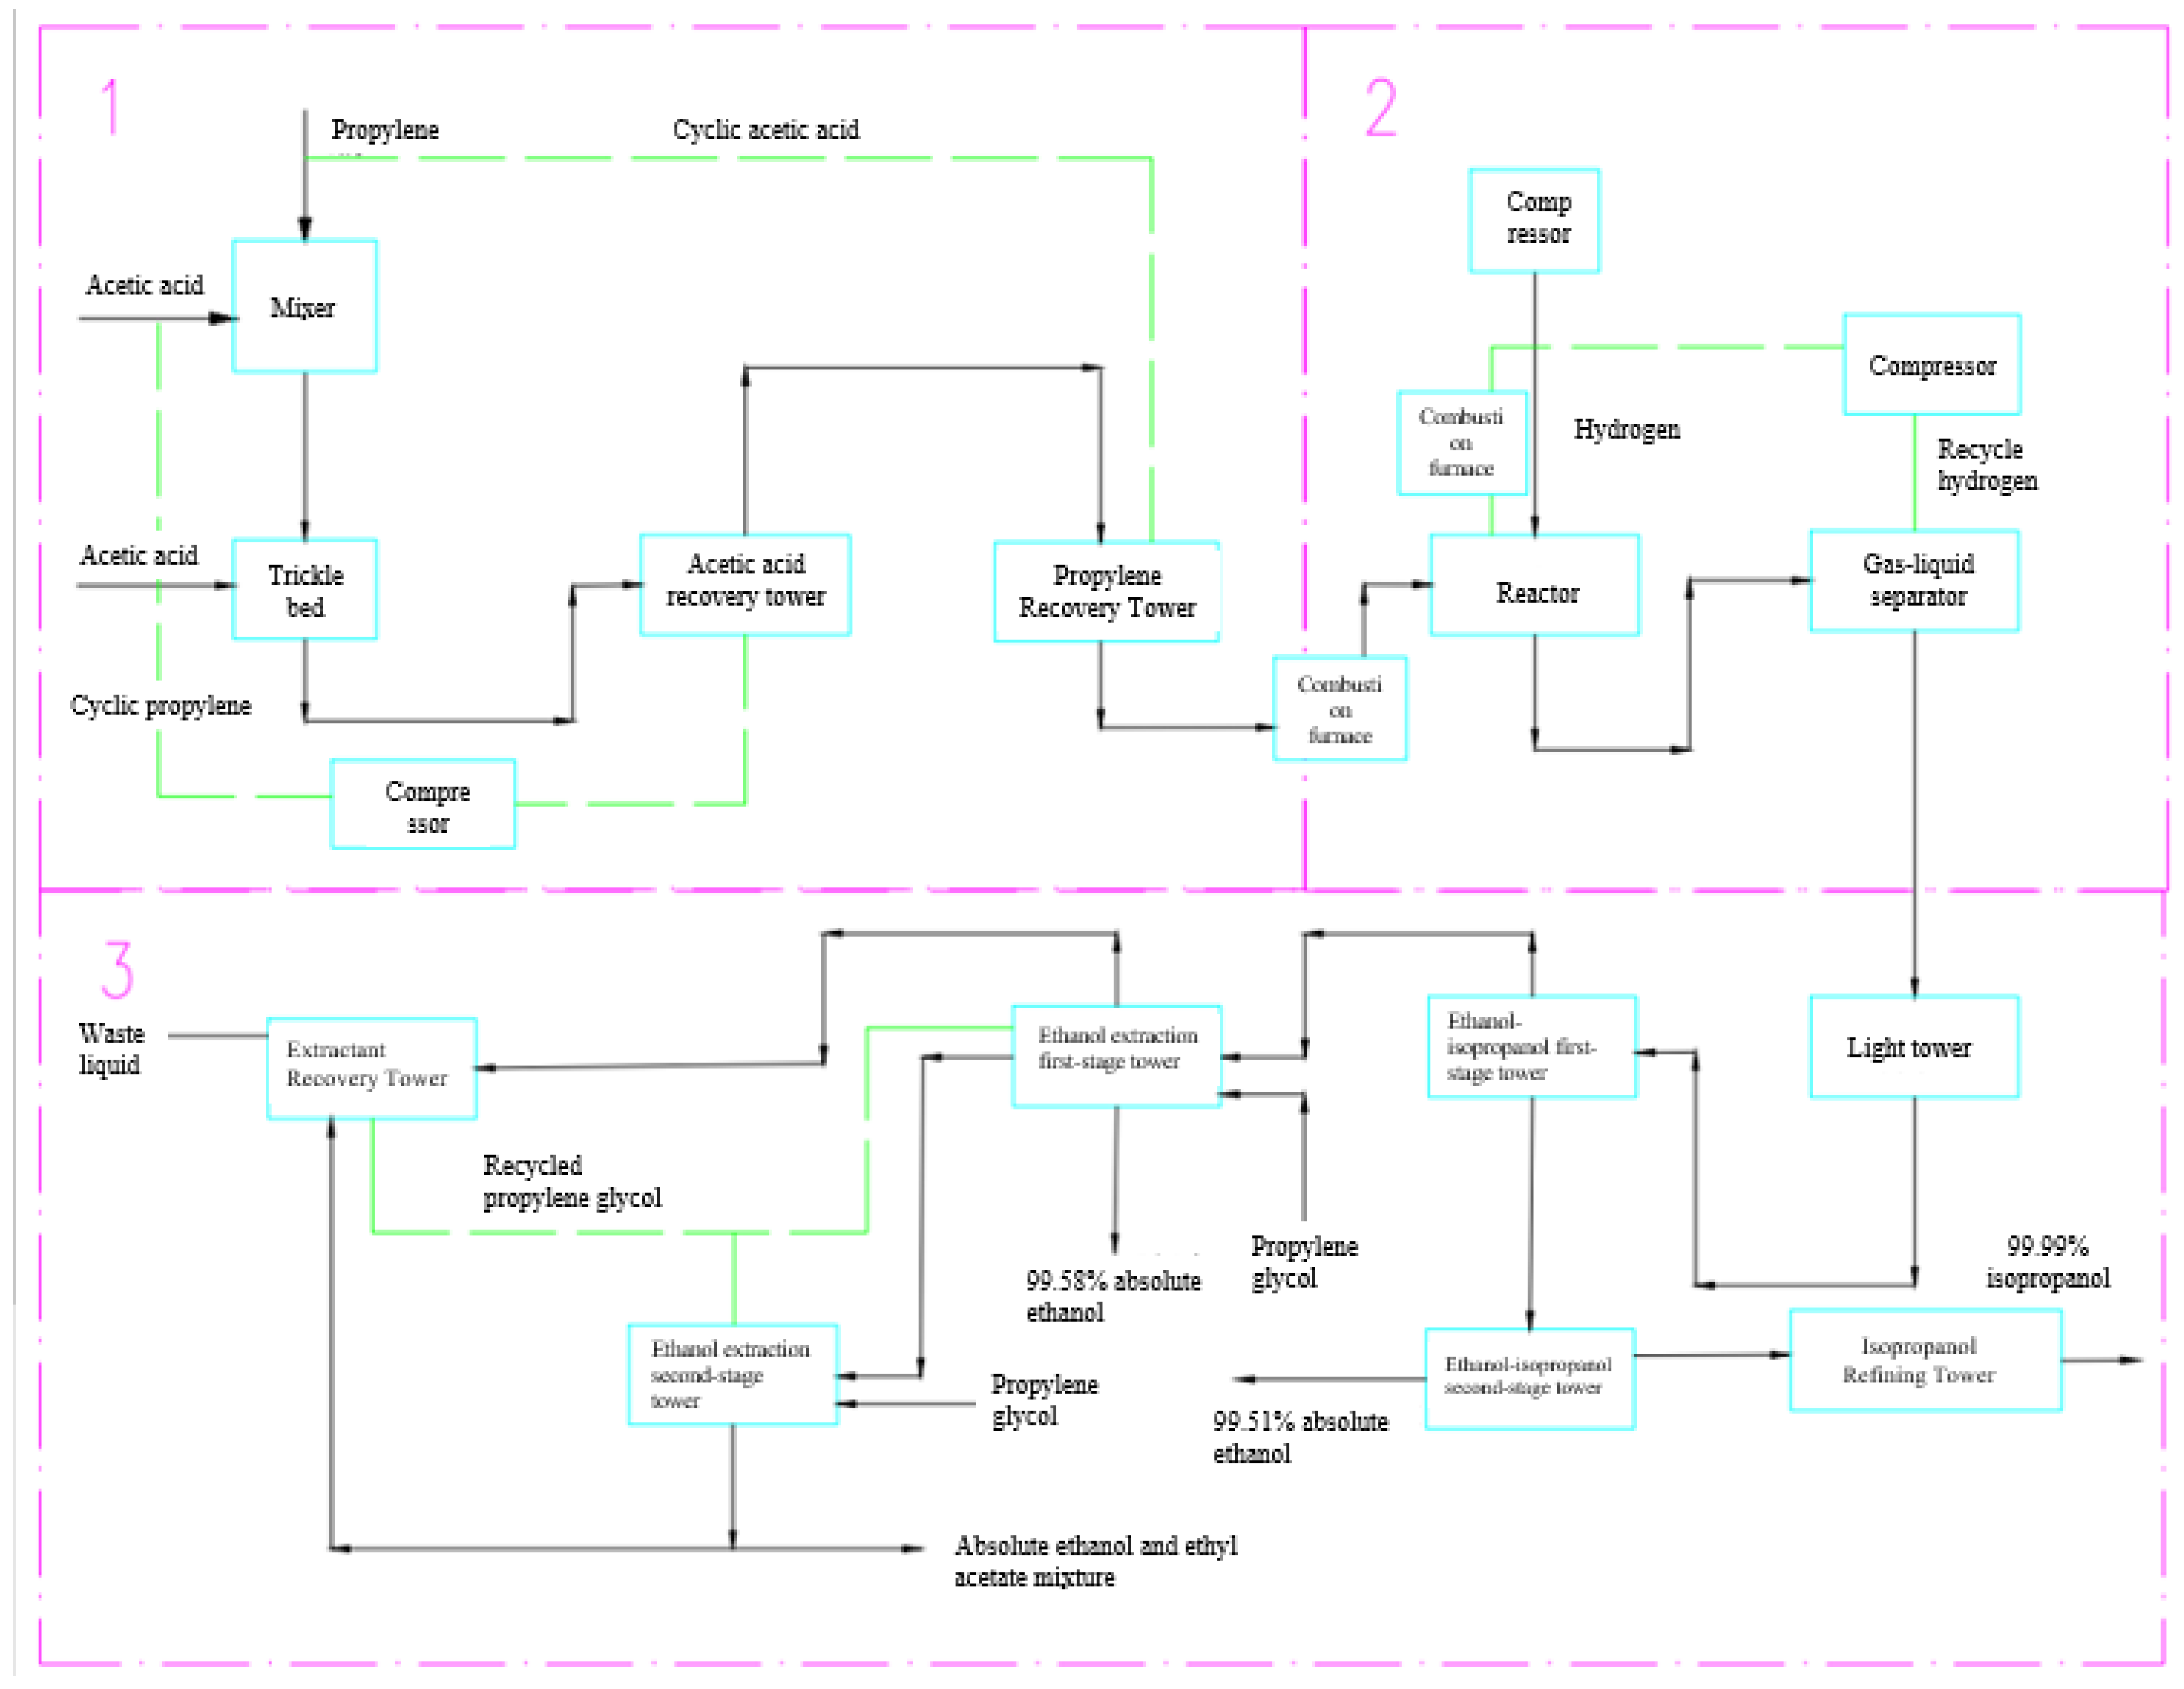
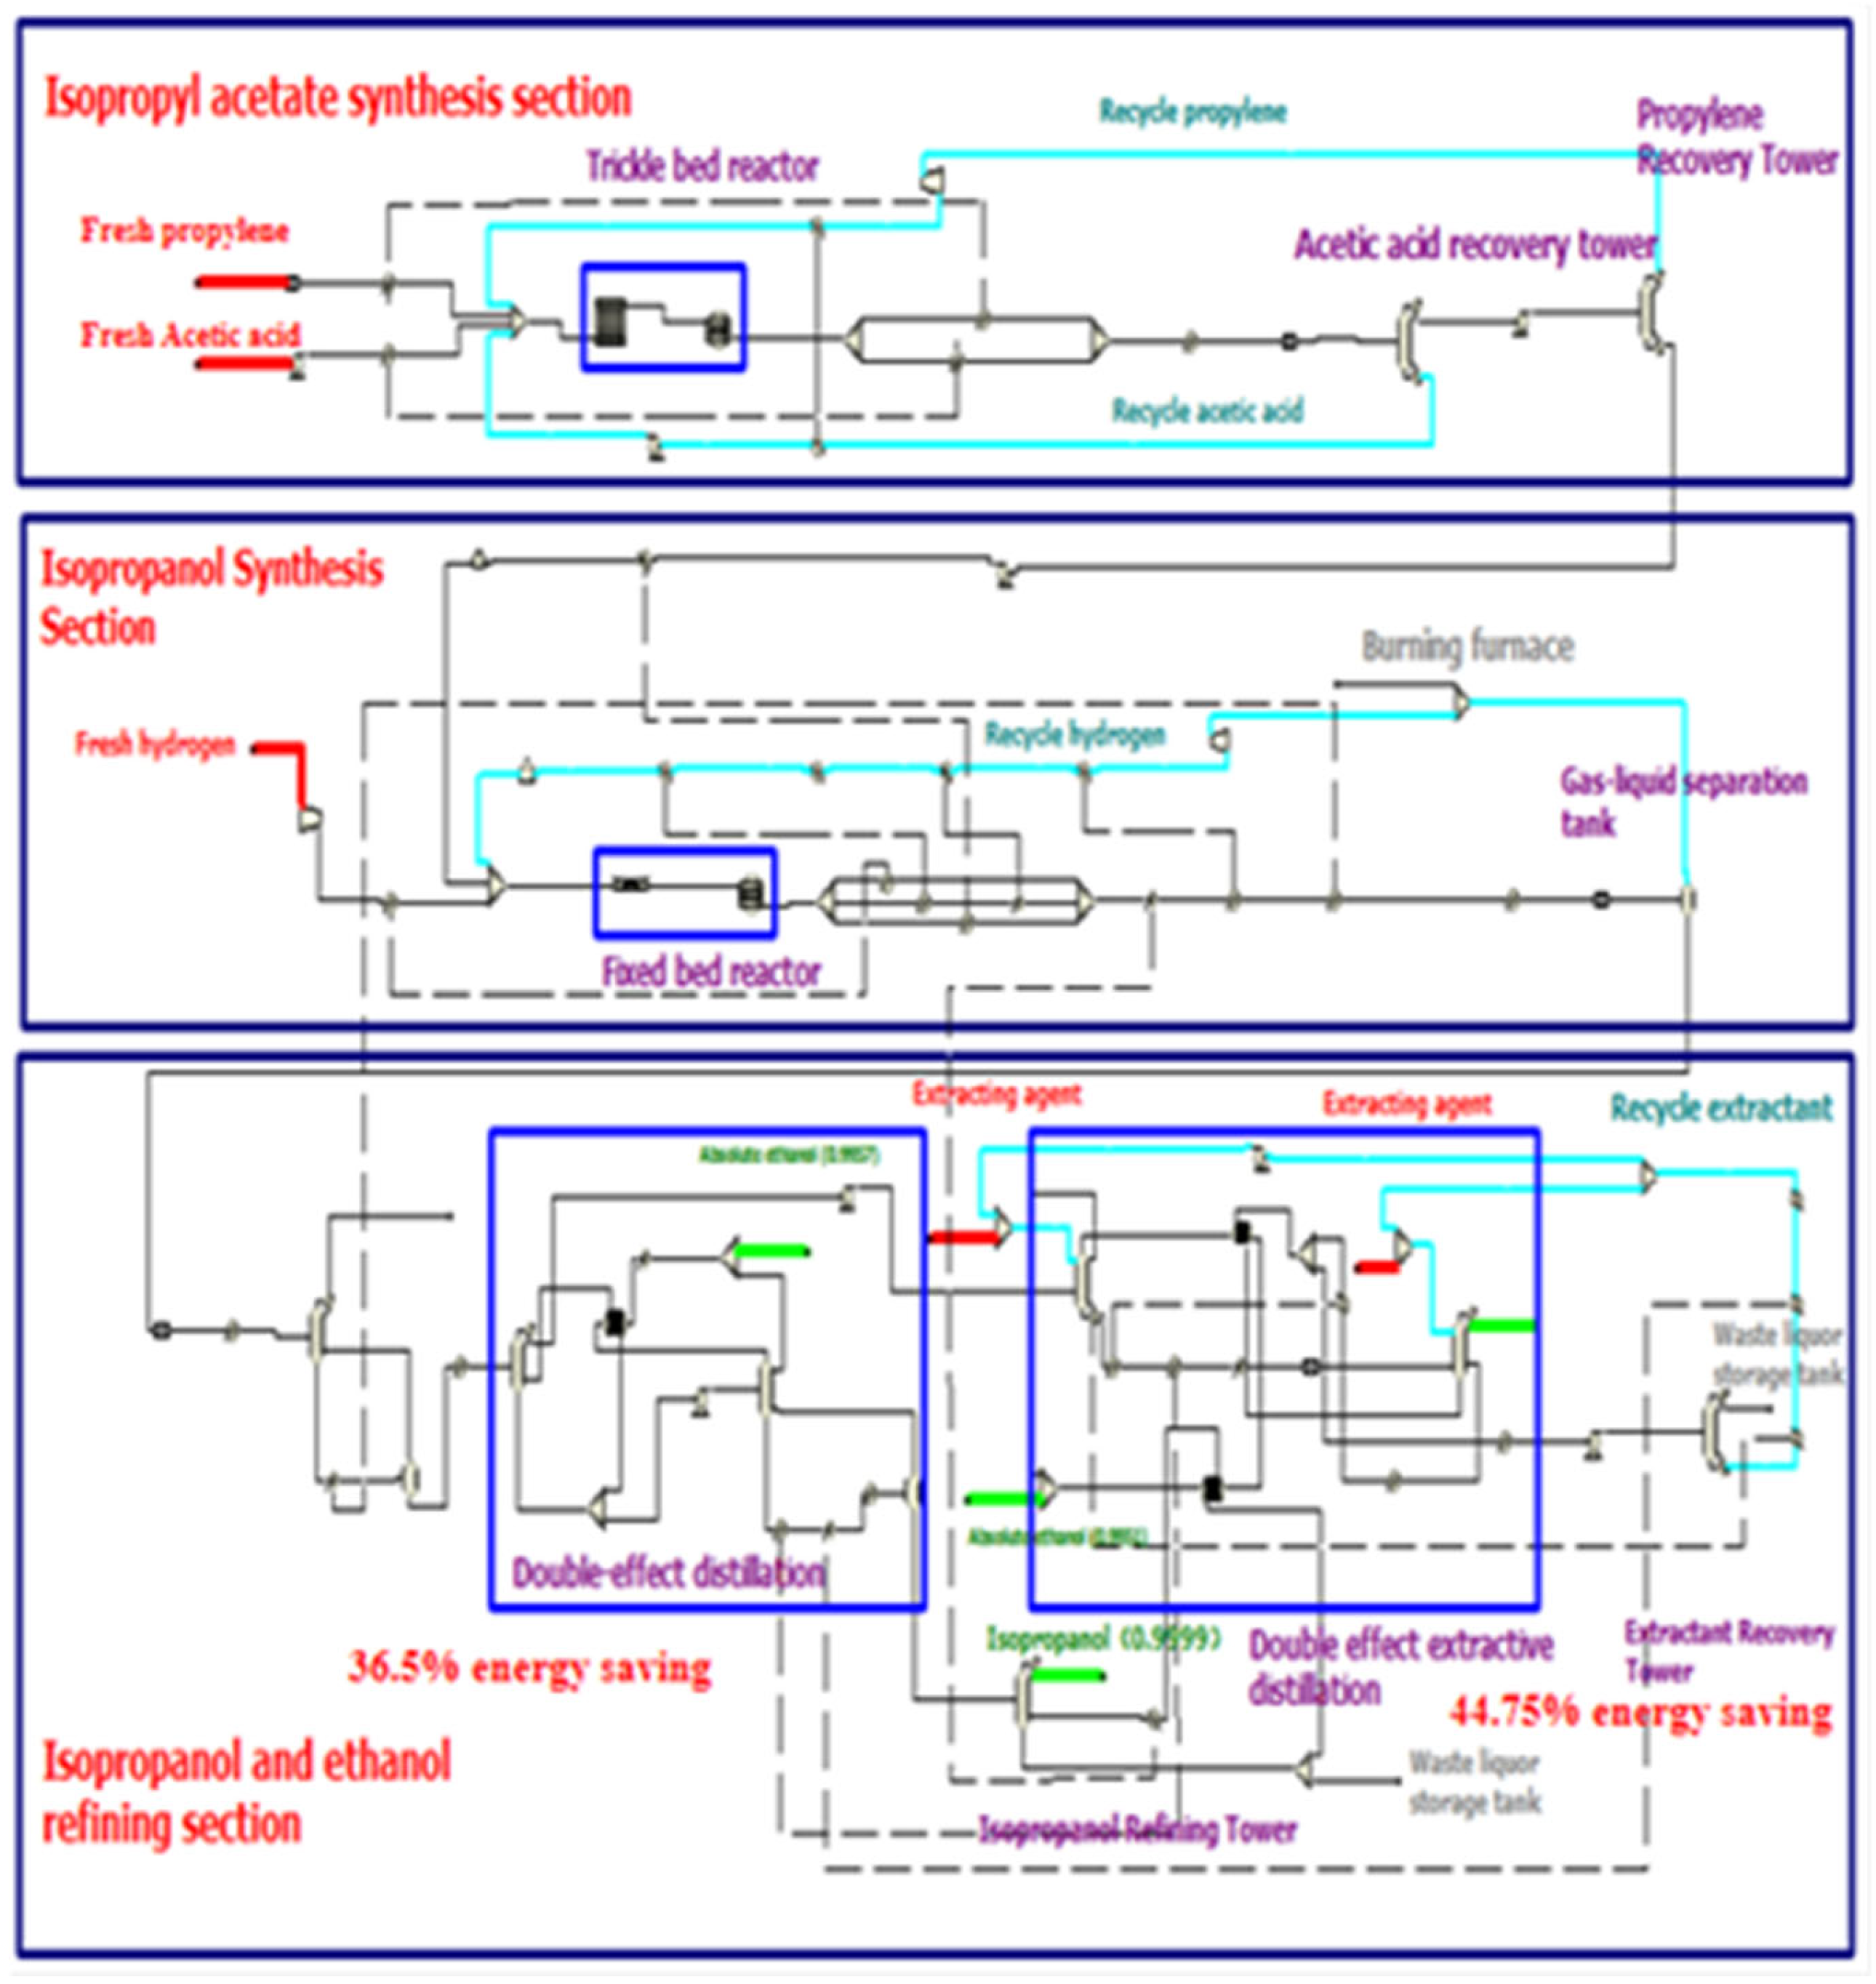
2.2. Case Studies
3. Results
3.1. FAHP–TOPSIS
3.2. Formatting of Mathematical Components
3.2.1. TOPSIS
3.2.2. Weight Calculations
4. Discussion
5. Conclusions
Author Contributions
Funding
Data Availability Statement
Acknowledgments
Conflicts of Interest
Abbreviations
| MCDM/A | Multi-Criteria Decision Making/Analysis |
| CPP | Chemical Process Plants |
| TFN | Triangular Fuzzy Number |
| CR | Consistency Ratio |
| PENG–ROB | Peng–Robinson |
| FAHP | Fuzzy Analytical Hierarchy Process |
| NH3 | Ammonia |
| IPA | Isopropanol |
| TOPSIS | Technique for Order of Preference by Similarity to Ideal Solution |
| PROMETHEE | Preference Ranking Organization Method for Enrichment Evaluation |
| LCA | Life Cycle Assessment |
| AH | Acetone Hydrogenation |
| PH | Direct Propylene Hydration |
| IAH | Propylene Indirect Hydration |
| HPEA | Hydropower Electrolysis |
| WGEA | Wind Turbine Electrolysis |
| PVEA | Solar Photovoltaic Electrolysis |
| BGEA | Biomass Gasification Electrolysis |
| NTEA | Nuclear High Temperature Electrolysis |
Appendix A

| Linguistic Variable | Crisp Value (AHP) | TFN |
|---|---|---|
| Equally important (E) | 1 | (1,1,1) |
| Weakly important (W) | 2 | (1/2,1,3/2) |
| Fairly—(F) | 3 | (1,3/2,2) |
| Strongly—(S) | 4 | (3/2,2,5/2) |
| Very strongly—(V) | 5 | (2,5/2,3) |
| Extremely—(EI) | 6 | (5/2,3,7/2) |
Appendix B
| A | B | C | D | |
| A (Tech) | E | REI | RV | RF |
| B (Econ) | E | F | V | |
| C (Env) | E | F | ||
| D (Soc) | E |
| A | B | C | D | |
| A (Env) | E | REI | RV | RF |
| B (Econ) | E | F | V | |
| C (Soc) | E | F | ||
| D (Tech) | E |
Appendix C
| A | B | C | D | CR | Wr | S | |
| A | (1,1,1) | (2/7,1/3,2/5) | (1/3,2/5,1/2) | (1/2,2/3,1) | 0.0186 | 0.122 | 0.0887 0.122 0.182 |
| B | (5/2,3,7/2) | (1,1,1) | (1,3/2,2) | (2,5/2,3) | 0.402 | 0.272 0.408 0.596 | |
| C | (2,5/2,3) | (1/2,2/3,1) | (1,1,1) | (1,3/2,2) | 0.290 | 0.188 0.289 0.439 | |
| D | (1,3/2,2) | (1/3,2/5,1/2) | (1/2,2/3,1) | (1,1,1) | 0.185 | 0.119 0.182 0.282 |
Appendix D
| A | A1 | A2 | A3 | CR | Ws | S |
| A1 | (1,1,1) | (3/2,2,5/2) | (1/2,2/3,1) | 0.0873 | 0.372 | 0.247 0.373 0.570 |
| A2 | (2/5,1/2,2/3) | (1,1,1) | (1/2,2/3,1) | 0.221 | 0.156 0.220 0.338 | |
| A3 | (1,3/2,2) | (1,3/2,2) | (1,1,1) | 0.408 | 0.247 0.407 0.633 |
| B | B1 | B2 | B3 | CR | Ws | S |
| B1 | (1,1,1) | (3/2,1,2) | (1/2,2/3,1) | 0.0566 | 0.418 | 0.250 0.421 0.667 |
| B2 | (1/2,1,3/2) | (1,1,1) | (3/2,1,2) | 0.249 | 0.167 0.246 0.208 | |
| B3 | (1,3/2,2) | (1/2,1,3/2) | (1,1,1) | 0.333 | 0.208 0.333 0.533 |
| C | C1 | C2 | C3 | CR | Ws | S |
| C1 | (1,1,1) | (3/2,1,2) | (3/2,1,2) | 0.0455 | 0.489 | 0.324 0.492 0.723 |
| C2 | (1/2,1,3/2) | (1,1,1) | (1/2,2/3,1) | 0.296 | 0.195 0.295 0.442 | |
| C3 | (1/2,1,3/2) | (1/2,2/3,1) | (1,1,1) | 0.216 | 0.154 0.213 0.321 |
| D | D1 | D2 | D3 | CR | Ws | S |
| D1 | (1,1,1) | (1,3/2,2) | (3/2,2,5/2) | 0.0349 | 0.454 | 0.288 0.458 0.696 |
| D2 | (1/2,2/3,1) | (1,1,1) | (1,3/2,2) | 0.325 | 0.206 0.322 0.506 | |
| D3 | (2/5,1/2,2/3) | (1/2,2/3,1) | (1,1,1) | 0.221 | 0.156 0.220 0.338 |
Appendix E
| A1 | A2 | A3 | B1 | B2 | B3 | C1 | C2 | C3 | D1 | D2 | D3 | |
|---|---|---|---|---|---|---|---|---|---|---|---|---|
| PH | 0.366 | 0.333 | 0.500 | 0.369 | 5.00 × 10⁻⁵ | 0.239 | 6.25 × 10⁻⁵ | 0.367 | 5.00 × 10⁻⁵ | 6.67 × 10⁻⁵ | 1 × 10⁻⁴ | 0.667 |
| AH | 6.34 × 10⁻⁵ | 0.667 | 0.500 | 6.30 × 10⁻⁵ | 0.500 | 7.61 × 10⁻⁵ | 0.375 | 6.33 × 10⁻⁵ | 0.500 | 0.333 | 1 × 10⁻⁴ | 0.333 |
| IAH | 0.634 | 6.67 × 10⁻⁵ | 5.00 × 10⁻⁵ | 0.631 | 0.500 | 0.761 | 0.625 | 0.633 | 0.500 | 0.667 | 1.00 | 6.67 × 10⁻⁵ |
| A1 | A2 | A3 | B1 | B2 | B3 | C1 | C2 | C3 | D1 | D2 | D3 | |
|---|---|---|---|---|---|---|---|---|---|---|---|---|
| WGEA | 0.0688 | 0.429 | 0.287 | 0.160 | 0.328 | 0.280 | 0.287 | 0.315 | 0.328 | 0.115 | 0.238 | 0.153 |
| PVEA | 0.0424 | 5.38 × 10⁻⁵ | 0.00993 | 4.17 × 10⁻⁵ | 0.525 | 0.134 | 0.287 | 0.315 | 0.230 | 5.48 × 10⁻⁵ | 5.24 × 10⁻⁵ | 0.153 |
| HPEA | 0.434 | 0.5384 | 0.347 | 0.121 | 0.0574 | 0.508 | 0.287 | 0.258 | 0.442 | 0.549 | 0.524 | 0.489 |
| BGEA | 0.455 | 0.0110 | 0.356 | 0.417 | 0.0902 | 5.08 × 10⁻⁵ | 0.139 | 0.112 | 4.42 × 10⁻⁵ | 0.0989 | 5.24 × 10⁻⁵ | 0.204 |
| NTEA | 4.55 × 10⁻⁵ | 0.0220 | 3.56 × 10⁻⁵ | 0.301 | 5.24 × 10⁻⁵ | 0.0784 | 2.87 × 10⁻⁵ | 3.15 × 10⁻⁵ | 4.42 × 10⁻⁵ | 0.237 | 0.238 | 4.89 × 10⁻⁵ |
Appendix F
| Sub-Criterion | ej | gj | Wo |
|---|---|---|---|
| A1 | 0.598 | 0.402 | 0.0735 |
| A2 | 0.580 | 0.420 | 0.0769 |
| A3 | 0.631 | 0.369 | 0.0675 |
| B1 | 0.600 | 0.400 | 0.0732 |
| B2 | 0.631 | 0.369 | 0.0675 |
| B3 | 0.501 | 0.500 | 0.0914 |
| C1 | 0.603 | 0.397 | 0.0727 |
| C2 | 0.599 | 0.401 | 0.0734 |
| C3 | 0.631 | 0.369 | 0.0675 |
| D1 | 0.580 | 0.420 | 0.0769 |
| D2 | 0.00186 | 0.998 | 0.183 |
| D3 | 0.580 | 0.420 | 0.0769 |
| SUM | 5.46 | ||
| Sub-Criterion | ej | gj | Wo |
|---|---|---|---|
| A1 | 0.646 | 0.354 | 0.102 |
| A2 | 0.516 | 0.484 | 0.139 |
| A3 | 0.708 | 0.292 | 0.0837 |
| B1 | 0.793 | 0.207 | 0.0594 |
| B2 | 0.675 | 0.325 | 0.0933 |
| B3 | 0.727 | 0.273 | 0.0784 |
| C1 | 0.838 | 0.162 | 0.0463 |
| C2 | 0.822 | 0.178 | 0.0511 |
| C3 | 0.662 | 0.338 | 0.0969 |
| D1 | 0.714 | 0.286 | 0.0820 |
| D2 | 0.636 | 0.364 | 0.104 |
| D3 | 0.777 | 0.223 | 0.0640 |
| SUM | 3.49 | ||
Appendix G
| PH | AH | IAH | |
|---|---|---|---|
| A1 (+) | 0.85 | 0.7 | 0.96 |
| A2 (+) | 0.96 | 0.97 | 0.95 |
| A3 (+) | 9 | 9 | 8 |
| B1 (−) | 5.532 | 7.245 | 4.321 |
| B2 (+) | 1 | 2 | 2 |
| B3 (−) | 9.638 | 10.441 | 7.879 |
| C1 (−) | 349.65 | 199.025 | 98.762 |
| C2 (-) | 1476.302 | 2032.015 | 1073.3 |
| C3 (+) | 1 | 2 | 2 |
| D1 (−) | 30 | 25 | 20 |
| D2 (+) | 1 | 1 | 2 |
| D3 (+) | 2 | 1 | 0 |
| WGEA | PVEA | HPEA | BGEA | NTEA | |
|---|---|---|---|---|---|
| A1, kg (−) | 0.82 | 0.87 | 0.13 | 0.09 | 0.95 |
| A2, kg CO2 eq (−) | 0.47 | 0.86 | 0.37 | 0.85 | 0.84 |
| A3, 10−2 kg Sb eq (−) | 0.35 | 0.63 | 0.29 | 0.28 | 0.64 |
| B1, M$; (t/day) (−) | 3.318 | 4.549 | 3.615 | 1.341 | 2.23 |
| B2 (+) | 0.231 | 0.279 | 0.165 | 0.173 | 0.151 |
| B3, % (+) | 27.3 | 14 | 47.9 | 1.9 | 9 |
| C1, scores (−) | 16 | 16 | 16 | 33 | 49 |
| C2(+) | 0.267 | 0.267 | 0.234 | 0.149 | 0.084 |
| C3(+) | 0.247 | 0.211 | 0.289 | 0.126 | 0.126 |
| D1, % (+) | 16.4 | 9.4 | 42.7 | 15.4 | 23.8 |
| D2 (+) | 0.204 | 0.179 | 0.234 | 0.179 | 0.204 |
| D3 (+) | 0.179 | 0.179 | 0.33 | 0.202 | 0.11 |
Appendix H
| Constant Added +0.0001 | PH | AH | IAH |
|---|---|---|---|
| A1 (+) | 0.577 | 0.0001 | 1.0001 |
| A2 (+) | 0.5001 | 1.0001 | 0.0001 |
| A3 (+) | 1.0001 | 1.0001 | 0.0001 |
| B1 (−) | 0.586 | 0.0001 | 1.0001 |
| B2 (+) | 0.0001 | 1.0001 | 1.0001 |
| B3 (−) | 0.314 | 0.0001 | 1.0001 |
| C1 (−) | 0.0001 | 0.600 | 1.0001 |
| C2 (−) | 0.580 | 0.0001 | 1.0001 |
| C3 (+) | 0.0001 | 1.0001 | 1.0001 |
| D1 (−) | 0.0001 | 0.5001 | 1.0001 |
| D2 (+) | 0.0001 | 0.0001 | 1.0001 |
| D3 (+) | 1.0001 | 0.5001 | 0.0001 |
| Constant Added +0.0001 | WGEA | PVEA | HPEA | BGEA | NTEA |
|---|---|---|---|---|---|
| A1, kg (−) | 0.151 | 0.0931 | 0.954 | 1.0001 | 0.0001 |
| A2, kg CO2 eq (−) | 0.796 | 0.0001 | 1.0001 | 0.0205 | 0.0409 |
| A3, 10−2 kg Sb eq (−) | 0.806 | 0.0279 | 0.972 | 1.0001 | 0.0001 |
| B1, M$; (t/day) (−) | 0.384 | 0.0001 | 0.291 | 1.0001 | 0.723 |
| B2 (+) | 0.625 | 1.0001 | 0.109 | 0.171975 | 0.0001 |
| B3, % (+) | 0.552 | 0.263 | 1.0001 | 0.0001 | 0.154 |
| C1, scores (−) | 1.0001 | 1.0001 | 1.0001 | 0.485 | 0.0001 |
| C2(+) | 1.0001 | 1.0001 | 0.820 | 0.355 | 0.0001 |
| C3(+) | 0.742 | 0.522 | 1.0001 | 0.0001 | 0.0001 |
| D1, % (+) | 0.210 | 0.0001 | 1.0001 | 0.180 | 0.433 |
| D2 (+) | 0.455 | 0.0001 | 1.0001 | 0.0001 | 0.455 |
| D3 (+) | 0.314 | 0.314 | 1.0001 | 0.418 | 0.0001 |
References
- Rezaei, J. Best-worst multi-criteria decision-making method. Omega 2015, 53, 49–57. [Google Scholar] [CrossRef]
- Penadés Plà, V.; García-Segura, T.; Martí, J.; Yepes, V. A Review of Multi-Criteria Decision-Making Methods Applied to the Sustainable Bridge Design. Sustainability 2016, 8, 1295. [Google Scholar] [CrossRef]
- Zavadskas, E.; Antucheviciene, J.; Chatterjee, P. Multiple Criteria Decision Making (MCDM) Techniques for Business Processes Information Management. Information 2019, 10, 4. [Google Scholar] [CrossRef]
- Wang, J.-J.; Jing, Y.-Y.; Zhang, C.-F.; Zhao, J.-H. Review on multi-criteria decision analysis aid in sustainable energy decision-making. Renew. Sustain. Energy Rev. 2009, 13, 2263–2278. [Google Scholar] [CrossRef]
- Behzadian, M.; Khanmohammadi Otaghsara, S.; Yazdani, M.; Ignatius, J. A state-of the-art survey of TOPSIS applications. Expert Syst. Appl. 2012, 39, 13051–13069. [Google Scholar] [CrossRef]
- Ali, Y.; Haroon, M.; Abdullah, M.; Khan, A. The best manufacturing procedure for the commercial production of urea, using ahp based topsis. Int. J. Anal. Hierarchy Process 2019, 11, 313–330. [Google Scholar] [CrossRef]
- Bandyopadhyay, S. Comparison among multi-criteria decision analysis techniques: A novel method. Prog. Artif. Intell. 2020, 10, 195–216. [Google Scholar] [CrossRef]
- Stojčić, M.; Zavadskas, E.K.; Pamučar, D.; Stević, Ž.; Mardani, A. Application of MCDM Methods in Sustainability Engineering: A Literature Review 2008–2018. Symmetry 2019, 11, 350. [Google Scholar] [CrossRef]
- Fonseca, J.D.; Commenge, J.-M.; Camargo, M.; Falk, L.; Gil, I.D. Multi-criteria optimization for the design and operation of distributed energy systems considering sustainability dimensions. Energy 2021, 214, 118989. [Google Scholar] [CrossRef]
- Kannan, D.; Moazzeni, S.; Darmian, S.M.; Afrasiabi, A. A hybrid approach based on MCDM methods and Monte Carlo simulation for sustainable evaluation of potential solar sites in east of Iran. J. Clean. Prod. 2021, 279, 122368. [Google Scholar] [CrossRef]
- Muhammad, L.J.; Badi, I.; Haruna, A.A.; Mohammed, I.A. Selecting the Best Municipal Solid Waste Management Techniques in Nigeria Using Multi Criteria Decision Making Techniques. Rep. Mech. Eng. 2021, 2, 180–189. [Google Scholar] [CrossRef]
- Chourabi, Z.; Khedher, F.; Dhouib, A.; Cheikhrouhou, M. Multi-criteria decision making in workforce choice using AHP, WSM and WPM. J. Text. Inst. 2018, 110, 1092–1101. [Google Scholar] [CrossRef]
- Narwane, V.S.; Yadav, V.S.; Raut, R.D.; Narkhede, B.E.; Gardas, B.B. Sustainable development challenges of the biofuel industry in India based on integrated MCDM approach. Renew. Energy 2021, 164, 298–309. [Google Scholar] [CrossRef]
- Tobiszewski, M.; Mechlińska, A.; Zygmunt, B.; Namieśnik, J. Green analytical chemistry in sample preparation for determination of trace organic pollutants. TrAC Trends Anal. Chem. 2009, 28, 943–951. [Google Scholar] [CrossRef]
- Geissdoerfer, M.; Savaget, P.; Bocken, N.M.P.; Hultink, E.J. The Circular Economy—A new sustainability paradigm? J. Clean. Prod. 2017, 143, 757–768. [Google Scholar] [CrossRef]
- Kirchherr, J.; Reike, D.; Hekkert, M. Conceptualizing the circular economy: An analysis of 114 definitions. Resour. Conserv. Recycl. 2017, 127, 221–232. [Google Scholar] [CrossRef]
- DEMarco, B.A.; Rechelo, B.S.; Tótoli, E.G.; Kogawa, A.C.; Salgado, H.R.N. Evolution of green chemistry and its multidimensional impacts: A review. Saudi Pharm. J. 2019, 27, 1–8. [Google Scholar] [CrossRef]
- Ho, W.; Xu, X.; Dey, P.K. Multi-criteria decision making approaches for supplier evaluation and selection: A literature review. Eur. J. Oper. Res. 2010, 202, 16–24. [Google Scholar] [CrossRef]
- Nazim, M.; Wali Mohammad, C.; Sadiq, M. A comparison between fuzzy AHP and fuzzy TOPSIS methods to software requirements selection. Alex. Eng. J. 2022, 61, 10851–10870. [Google Scholar] [CrossRef]
- Saaty, R.W. The analytic hierarchy process—What it is and how it is used. Math. Model. 1987, 9, 161–176. [Google Scholar] [CrossRef]
- Vaidya, O.; Kumar, S. Analytic Hierarchy Process: An Overview of Applications. Eur. J. Oper. Res. 2006, 169, 1–29. [Google Scholar] [CrossRef]
- Jamwal, A.; Agrawal, R.; Sharma, M.; Kumar, V. Review on multi-criteria decision analysis in sustainable manufacturing decision making. Int. J. Sustain. Eng. 2021, 14, 202–225. [Google Scholar] [CrossRef]
- Wu, Z.; Abdul-Nour, G. Comparison of Multi-Criteria Group Decision-Making Methods for Urban Sewer Network Plan Selection. CivilEng 2020, 1, 26–48. [Google Scholar] [CrossRef]
- Behzadian, M.; Kazemzadeh, R.B.; Albadvi, A.; Aghdasi, M. PROMETHEE: A comprehensive literature review on methodologies and applications. Eur. J. Oper. Res. 2010, 200, 198–215. [Google Scholar] [CrossRef]
- Kumar, A.; Sah, B.; Singh, A.R.; Deng, Y.; He, X.; Kumar, P.; Bansal, R.C. A review of multi criteria decision making (MCDM) towards sustainable renewable energy development. Renew. Sustain. Energy Rev. 2017, 69, 596–609. [Google Scholar] [CrossRef]
- Chen, C.-T. Extensions of the TOPSIS for group decision-making under fuzzy environment. Fuzzy Sets Syst. 2000, 114, 1–9. [Google Scholar] [CrossRef]
- Opricovic, S.; Tzeng, G.-H. Compromise solution by MCDM methods: A comparative analysis of VIKOR and TOPSIS. Eur. J. Oper. Res. 2004, 156, 445–455. [Google Scholar] [CrossRef]
- Kabir, G.; Sadiq, R.; Tesfamariam, S. A review of multi-criteria decision-making methods for infrastructure management. Struct. Infrastruct. Eng. 2014, 10, 1176–1210. [Google Scholar] [CrossRef]
- Balioti, V.; Tzimopoulos, C.; Evangelides, C. Multi-Criteria Decision Making Using TOPSIS Method Under Fuzzy Environment. Appl. Spillway Sel. Proc. 2018, 2, 637. [Google Scholar]
- Karami, A. Utilization and Comparison of Multi Attribute Decision Making Techniques to Rank Bayesian Network Options. Master’s Thesis, University of Skövde, Skövde, Sweden, 2011. [Google Scholar]
- Prasad, V.; Pappu, K. Role of Consistency in Analytic Hierarchy Process—Consistency Improvement Methods. Indian J. Sci. Technol. 2017, 10, 1–5. [Google Scholar]
- Xu, D.; Lv, L.; Ren, X.; Ren, J.; Dong, L. Route selection for low-carbon ammonia production: A sustainability prioritization framework based-on the combined weights and projection ranking by similarity to referencing vector method. J. Clean. Prod. 2018, 193, 263–276. [Google Scholar] [CrossRef]
- Institute for Development (ISDP). Made in China 2025. 2018. Available online: https://www.isdp.eu/wp-content/uploads/2018/06/Made-in-China-Backgrounder.pdf (accessed on 10 February 2024).
- Wang, J.; Wu, H.; Chen, Y. Made in China 2025 and manufacturing strategy decisions with reverse QFD. Int. J. Prod. Econ. 2020, 224, 107539. [Google Scholar] [CrossRef]
- Aspentech. Aspen HYSYS: Property and Methods Technical Reference. 2013. Available online: https://esupport.aspentech.com/FileAttachment?id=a0g0B00000GfNrw (accessed on 13 January 2025).
- Arrarte, J.L. Small-Scale Green Ammonia Production Plant: Preliminary Design and Simulation Using Aspen Plus. 2022. Available online: https://repositorio.unican.es/xmlui/bitstream/handle/10902/24744/440803.pdf?sequence=1 (accessed on 30 May 2025).
- Guati-Rojo, A.; Demski, C.; Poortinga, W.; Valera-Medina, A. Public Attitudes and Concerns about Ammonia as an Energy Vector. Energies 2021, 14, 7296. [Google Scholar] [CrossRef]
- Kurien, C.; Mittal, M. Review on the production and utilization of green ammonia as an alternate fuel in dual-fuel compression ignition engines. Energy Convers. Manag. 2022, 251, 114990. [Google Scholar] [CrossRef]
- Zhang, Y.; Zhang, Y.; Song, Z.; Pan, H. A Lfpp-Fahp Based Evaluation Model of Blasting Scheme for Tunnel Undercrossing Existing Buildings. 2023. Available online: https://ssrn.com/abstract=4331303 (accessed on 12 May 2025).
- Olabanji, O.M.; Mpofu, K. Hybridized fuzzy analytic hierarchy process and fuzzy weighted average for identifying optimal design concept. Heliyon 2020, 6, e03182. [Google Scholar] [CrossRef]
- Osman, O.; Sgouridis, S.; Sleptchenko, A. Scaling the production of renewable ammonia: A techno-economic optimization applied in regions with high insolation. J. Clean. Prod. 2020, 271, 121627. [Google Scholar] [CrossRef]
- Chehade, G.; Dincer, I. Progress in green ammonia production as potential carbon-free fuel. Fuel 2021, 299, 120845. [Google Scholar] [CrossRef]
- Salmon, N.; Bañares-Alcántara, R. A global, spatially granular techno-economic analysis of offshore green ammonia production. J. Clean. Prod. 2022, 367, 133045. [Google Scholar] [CrossRef]

| Case Study | Potential Pathways |
|---|---|
| IPA via isopropyl acetate |
|
| Green NH3 |
|
| Tech (A) | Econ (B) | Env (C) | Soc (D) |
|---|---|---|---|
| A1: Conversion rate | B1: Total operational costs | C1: Human toxicity | D1: Intrinsic safety |
| A2: IPA selectivity | B2: Process complexity | C2: CO2 emissions | D2: Policy relevance |
| A3: Tech maturity | B3: Total annual costs | C3: Pollution | D3: Public perception |
| Env (A) | Econ (B) | Soc (C) | Tech (D) |
|---|---|---|---|
| A1: Biodiversity loss | B1: Total operational costs | C1: Employer safety | D1: Exergy efficiency |
| A2: GHG emissions | B2: Sales prices | C2: Policy applicability | D2: Energy efficiency |
| A3: Global warming potential | B3: Net present value potential | C3: Public perception | D3: Green performance |
| Criteria | Sub-Criteria | Ws | Wc | CR | Wo | Wi |
|---|---|---|---|---|---|---|
| A | A1 | 0.372 | 0.0455 | 0.0873 | 0.0735 | 0.0607 |
| A2 | 0.221 | 0.0270 | 0.0769 | 0.0479 | ||
| A3 | 0.407 | 0.0499 | 0.0675 | 0.0609 | ||
| B | B1 | 0.418 | 0.168 | 0.0566 | 0.0732 | 0.116 |
| B2 | 0.249 | 0.100 | 0.0675 | 0.0863 | ||
| B3 | 0.333 | 0.134 | 0.0914 | 0.116 | ||
| C | C1 | 0.489 | 0.142 | 0.0455 | 0.0727 | 0.107 |
| C2 | 0.296 | 0.0859 | 0.0734 | 0.0834 | ||
| C3 | 0.216 | 0.0626 | 0.0675 | 0.0683 | ||
| D | D1 | 0.454 | 0.0839 | 0.0349 | 0.0769 | 0.0843 |
| D2 | 0.325 | 0.0601 | 0.183 | 0.110 | ||
| D3 | 0.221 | 0.0408 | 0.0769 | 0.0588 |
| Wi | Wo | Wc | ||||
|---|---|---|---|---|---|---|
| Di+ | Di− | Di+ | Di− | Di+ | Di− | |
| PH | 0.532 | 0.298 | 0.573 | 0.307 | 0.504 | 0.286 |
| AH | 0.551 | 0.326 | 0.588 | 0.335 | 0.529 | 0.315 |
| IAH | 0.250 | 0.632 | 0.292 | 0.648 | 0.206 | 0.625 |
| Wi | Wo | Wc | ||||
| Di+ | Di− | Di+ | Di− | Di+ | Di− | |
| WGEA | 0.244 | 0.267 | 0.247 | 0.280 | 0.235 | 0.259 |
| PVEA | 0.366 | 0.225 | 0.392 | 0.207 | 0.344 | 0.233 |
| HPEA | 0.180 | 0.404 | 0.161 | 0.431 | 0.192 | 0.375 |
| BGEA | 0.365 | 0.222 | 0.386 | 0.219 | 0.341 | 0.228 |
| NTEA | 0.388 | 0.142 | 0.411 | 0.128 | 0.364 | 0.156 |
| Wi | Wo | Wc | ||||
|---|---|---|---|---|---|---|
| Ci− | Ci+ | Ci− | Ci+ | Ci− | Ci+ | |
| PH | 0.359 | 0.248 | 0.349 | 0.249 | 0.362 | 0.244 |
| AH | 0.371 | 0.257 | 0.363 | 0.259 | 0.373 | 0.251 |
| IAH | 0.716 | 0.495 | 0.689 | 0.492 | 0.752 | 0.506 |
| Wi | Wo | Wc | ||||
| Ci− | Ci+ | Ci− | Ci+ | Ci− | Ci+ | |
| WGEA | 0.522 | 0.233 | 0.531 | 0.241 | 0.525 | 0.229 |
| PVEA | 0.381 | 0.170 | 0.345 | 0.157 | 0.404 | 0.176 |
| HPEA | 0.692 | 0.309 | 0.728 | 0.330 | 0.662 | 0.289 |
| BGEA | 0.378 | 0.169 | 0.362 | 0.164 | 0.401 | 0.175 |
| NTEA | 0.268 | 0.120 | 0.238 | 0.108 | 0.299 | 0.131 |
Disclaimer/Publisher’s Note: The statements, opinions and data contained in all publications are solely those of the individual author(s) and contributor(s) and not of MDPI and/or the editor(s). MDPI and/or the editor(s) disclaim responsibility for any injury to people or property resulting from any ideas, methods, instructions or products referred to in the content. |
© 2025 by the authors. Licensee MDPI, Basel, Switzerland. This article is an open access article distributed under the terms and conditions of the Creative Commons Attribution (CC BY) license (https://creativecommons.org/licenses/by/4.0/).
Share and Cite
Li, D.; Hassan-Sayed, M.G.; Bimbo, N.; Li, Z.; Shigidi, I.M.T. Holistically Green and Sustainable Pathway Prioritisation for Chemical Process Plant Systems via a FAHP–TOPSIS Framework. Processes 2025, 13, 2068. https://doi.org/10.3390/pr13072068
Li D, Hassan-Sayed MG, Bimbo N, Li Z, Shigidi IMT. Holistically Green and Sustainable Pathway Prioritisation for Chemical Process Plant Systems via a FAHP–TOPSIS Framework. Processes. 2025; 13(7):2068. https://doi.org/10.3390/pr13072068
Chicago/Turabian StyleLi, Daniel, Mohamed Galal Hassan-Sayed, Nuno Bimbo, Zhaomin Li, and Ihab M. T. Shigidi. 2025. "Holistically Green and Sustainable Pathway Prioritisation for Chemical Process Plant Systems via a FAHP–TOPSIS Framework" Processes 13, no. 7: 2068. https://doi.org/10.3390/pr13072068
APA StyleLi, D., Hassan-Sayed, M. G., Bimbo, N., Li, Z., & Shigidi, I. M. T. (2025). Holistically Green and Sustainable Pathway Prioritisation for Chemical Process Plant Systems via a FAHP–TOPSIS Framework. Processes, 13(7), 2068. https://doi.org/10.3390/pr13072068