Abstract
For the gas injection process in the underground natural gas storage, it is of great significance to separate lubricating oil droplets from natural gas to ensure the capacity of gas injection. However, the interaction mechanism, among various factors, is still unclear in real field conditions. In this study, the filtration performances of filter elements were investigated in a range of gas temperatures from 20 °C to 70 °C, aerosol concentrations from 400 mg/m3 to 1200 mg/m3 and flowrates from 37.2 m3/h to 74.4 m3/h. The results show that at the same flowrate, the steady-state filtration efficiency decreases with increasing temperature, resulting from a shift in the upstream aerosol towards the smaller size and an increase in the concentration for droplets within the range of 0.3 to 2 μm. The filtration efficiency only increases by 0.02% at 20 °C, while the steady-state efficiency increases by more than 0.10% at 70 °C and all the flowrates. At the same gas temperature and aerosol concentration, the steady-state filtration efficiency increases with the increase in flowrate. In practical applications, the filtration performance can be improved by lowing the gas temperature, setting up fewer filter elements in the separator, and appropriately reducing the injection amount of lubricating oil.
1. Introduction
By the end of 2022, the total gas storage capacity of China’s active underground natural gas storage reached 190 × 108 m3, which accounts for about 5% of national natural gas consumption [1,2]. According to the national gas storage capacity construction target, the storage capacity should be 700 × 108~800 × 108 m3 in 2035. In view of the current demand for the construction of underground natural gas storages, the China National Petroleum Corporation and other enterprises have deployed corresponding development programs, in which it is expected that more than 30 new underground natural gas storages will be built during the “Tenth Five-Year Plan” period. In the process of natural gas injection, reciprocating compressors are mainly used as compressing equipment for underground gas storage in China. After natural gas is compressed by compressors, a large number of lubricating oil mists are entrained in the natural gas. In order to prevent oil mists from entering the reservoir layer with natural gas, lubricating oil separators are usually set up downstream of the compressors, in which the performance of the filter elements has a great influence on separating oil droplets. When the filtration performance does not meet the requirement for design, a large number of oil droplets flowing into reservoir stratum could block pores of rocks, resulting in reductions in permeability and the capacity for gas injecting.
During the entire period for gas injecting in underground gas storages, the pressure, temperature, and flowrate of compressed natural gas vary within a certain range. Moreover, there are differences in lubricant consumption among different manufacturers and models of compressors. As a result, the concentration of droplets in natural gas after compressing varies in a wide range under different operating conditions. Changes in the above parameters affect the performance of filter elements to varying degrees. In recent years, some researchers have studies the factors influencing gas–liquid filtration performance, such as the filter media structure [3,4,5], wettability [6,7], liquid physical properties [8,9], and filtration velocity [10,11]. Song et al. [8] found that the saturation and channel pressure drop in the channel region of the filter media increased linearly with an increase in liquid viscosity at the same filtration velocity, where the liquid dynamic viscosity was in the range of 46–320 mPa·s. Chen et al. [9] showed that an increase in liquid surface tension led to a shorter time to arrival at the steady state and a higher filtration efficiency for the filter media. Kolb et al. [10] studied the effect of gas velocity on the filtration performance. It was found that the wet pressure drop of the filter media was almost constant and did not change with an increase in gas velocity in the range of 0.05 to 0.70 m/s, while saturation decreased gradually. Penner et al. [11] investigated the filtration performance of filter media with different wettability-at-filtration velocities of 0.10~0.40 m/s. As the gas velocity increases, the amount of liquid remaining in with the filter media decreases, which results in a more effective filtration area available for capturing droplets, leading to an increase in filtration efficiency.
Straube et al. [12] reported that the majority of deposited oil is stored in the oil sails between adjacent fibers. The oil droplets surrounding fibers have found to grow in size with increasing oil loading time. Mead-Hunter et al. [13,14] observed that there were droplet motions and force characteristics on the surfaces of fibers with different wettabilities. Schwarzwälder et al. [15] investigated the effect of the wettability of a single fiber on droplet coalescence and transportation. Chen et al. [5,16] found that the evolution of the channel pressure drop during filtration is determined by the pore size of the filter media, and re-entrainment is likely to occur for oleophobic filter media with a small pore size and oleophilic filter media with a large pore size. Chang et al. [17] prepared filtration media with non-uniform wettability and investigated the difference in filtration performance between the ones with non-uniform and uniform wettability.
The existing research mainly focuses on disc-type filter media. There are a few studies on the performance of industrial filtration elements, but further in-depth work is required. Chang et al. [18] investigated the permeability of filtration elements before and after use at 11 MPa. It was found that the filtration media were compressed in varying degrees under a high-pressure condition. Chang et al. [19] established a filtration performance testing device for natural gas filter elements on offshore platforms. The effect of particle size distribution on the filtration performance of different filter elements was investigated based on which the best product was found to meet the requirements for separating and recovering lubricating oil under operating conditions. Liu et al. [20] proposed that as filters are composed by filter media with different filtration efficiency grades, the filters could operate reliably for a long period of time in the field. Li et al. [21] reported that a filter material with a high-efficiency grade is prone to cause liquid clogged between the last filtration layer and the drainage layer under high gas velocity, resulting in performance degradation, while a filter composed by filter media with a moderate efficiency grade shows a better filtration performance.
Within the ranges of gas temperature, aerosol concentration, and flowrate in underground natural gas storage, there is a lack of research on the gas–liquid filtration performance of filter elements. Moreover, there is no quantitative analysis of the impact of gas temperature and aerosol concentration on droplet distribution and the filtration performance in the reported works. The interaction mechanism among the various factors is still unclear. In this study, an experimental set-up was established to evaluate the filtration performance and investigate the effect of gas temperature, aerosol concentration, and gas flowrate on filtration efficiency. The results of this study could provide technical support for the selection, design, and evaluation of filter elements for lubricating oil separation.
2. Experimental Set-Up and Method
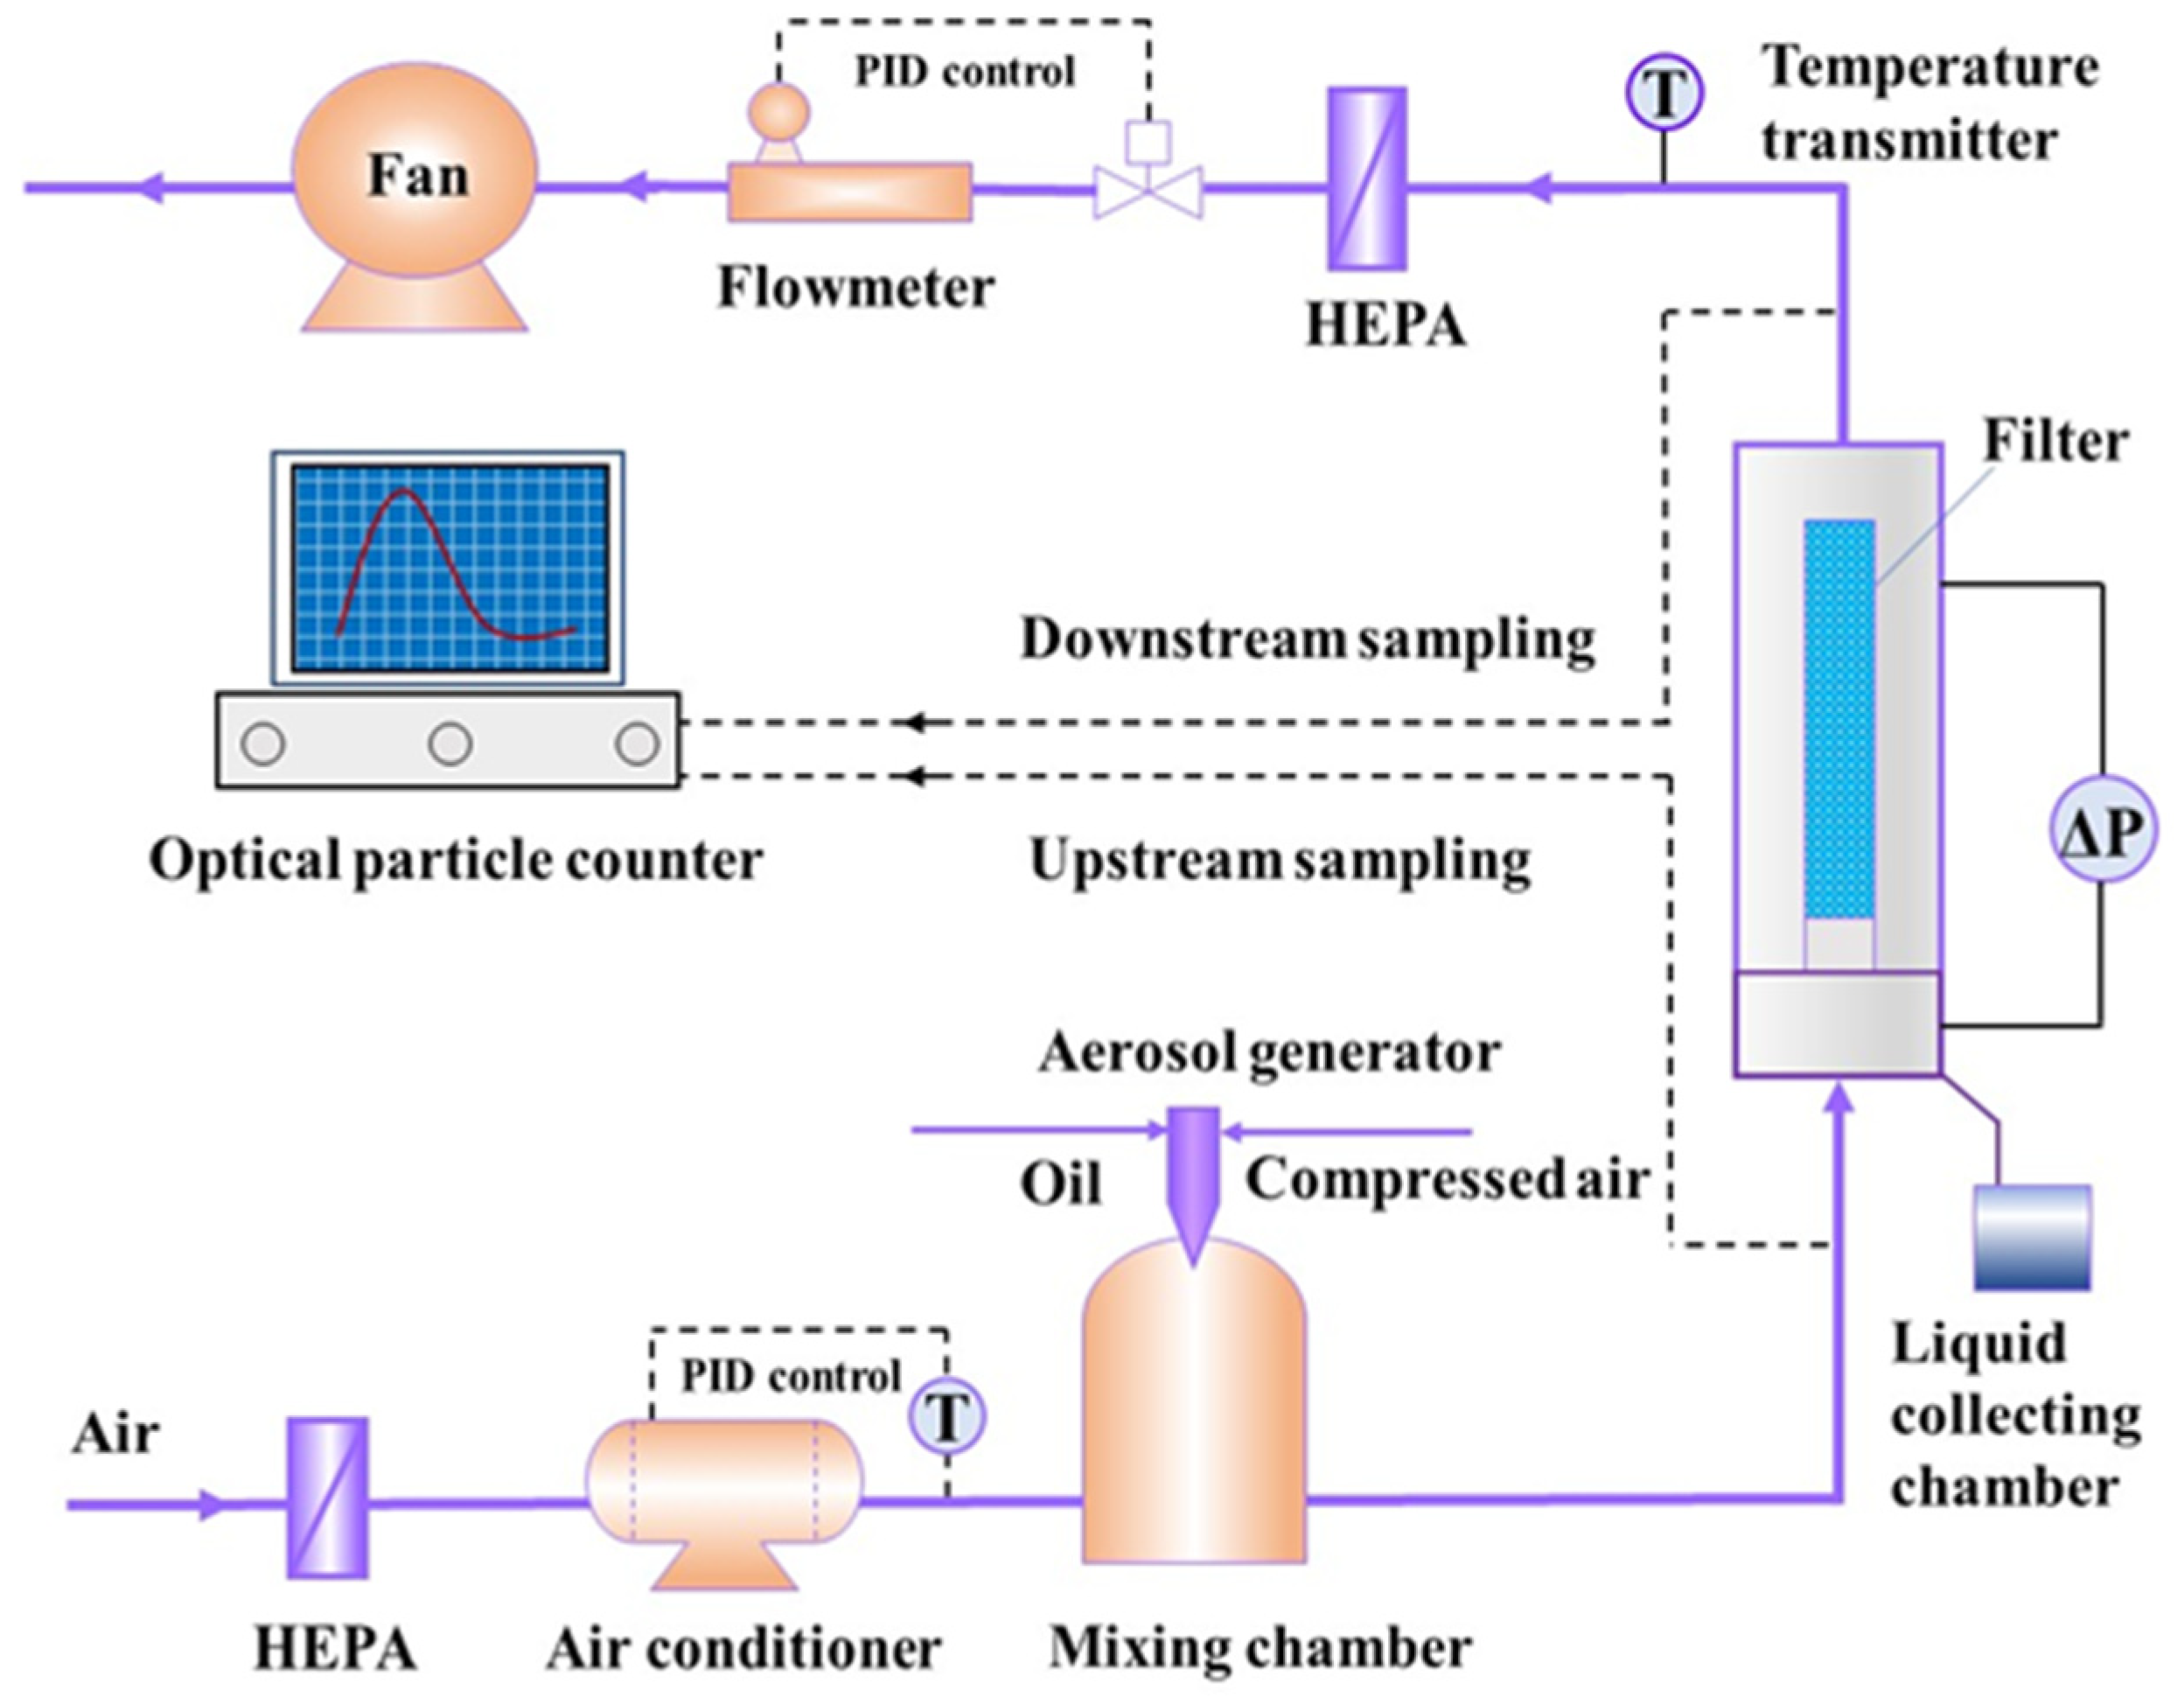
A conventional natural gas lubricant separation element was used, which was made of 4-layer oleophilic glass fibers, with an outer diameter of 114 mm and a height of 914 mm. In this study, the filter medium used is micron-sized glass fiber, of which the physical and chemical characteristics are listed in Table 1. An experimental set-up was used to investigate the influence of operating parameters on the filtration performance of the element, as shown in Figure 1. Oil and compressed air flowed into the sprayer. Liquid was broken into aerosol droplets via the function of gas shear, and then flowed into the element from the bottom of the filter holder. A filter element holder was placed vertically, of which the height is 1500 mm and the inner diameter is 255 mm. Gas-entrained droplets passed through the element from inside to outside, in which aerosol droplets were captured by fibrous filter media. Coalesced liquid drained out of the filter element. After flowing through the flow meter, purified gas was discharged to the atmosphere.

Table 1.
Physical and chemical characteristics of filter medium.

Figure 1.
Experimental set-up for lubricating oil separation.
The operating conditions of a lubricating oil separator (DWELL Co., Ltd., Beijing, China) in the Liaohe oilfield underground gas storage were used to determine the range of experimental parameters. The flowrate for natural gas is 100~130 × 104 Nm3/d. The gas pressure and temperature at inlet of the lubricating oil separator are 8~10 MPa and 40~70 °C, respectively. The average oil volume of lubricating oil flowing into the separator is 15 L/d. The typical natural gas components in underground gas storage, the corresponding mole ratio, critical temperatures, and critical pressures [22] are listed in Table 2. Based on the operating conditions, the density of natural gas can be calculated. For a lubricating oil separator, the flowrate is in the range of 37.1~66.1 m3/h, and the concentration of lubricating oil in gas is 700~1200 mg/m3.
Table 2.
Typical natural gas component parameters for gas storage.
According to the above operating parameters, the experimental parameters in this study were set as follows: gas temperature: 20 °C, 40 °C, and 70 °C; aerosol concentration: 400 mg/m3, 800 mg/m3, and 1200 mg/m3; gas flowrate: 37.2 m3/h, 55.8 m3/h, and 74.4 m3/h. For this, the filtration velocities were 0.04 m/s, 0.06 m/s, and 0.08 m/s, correspondingly. In this concentration range, it is suitable to use number efficiency for the performance test and evaluation. No. 150 lubricating oil was used as the experimental liquid, of which the viscosity is 150 mm2/s at 40 °C. During the experiment, when the liquid was drained from the element and the change rate of pressure drop was less than 5% per hour, a steady state was considered to have been reached for the element. At the steady state, an optical particle counter (Welas 2000, Palas, Karlsruhe, Germany) was used to measure the concentration and particle size distribution of droplets in gas upstream and downstream of the element based on which the filtration efficiency for each particle size was obtained. The results are the averages obtained by at least three measurements.
3. Results and Discussion
3.1. Effect of Gas Temperature
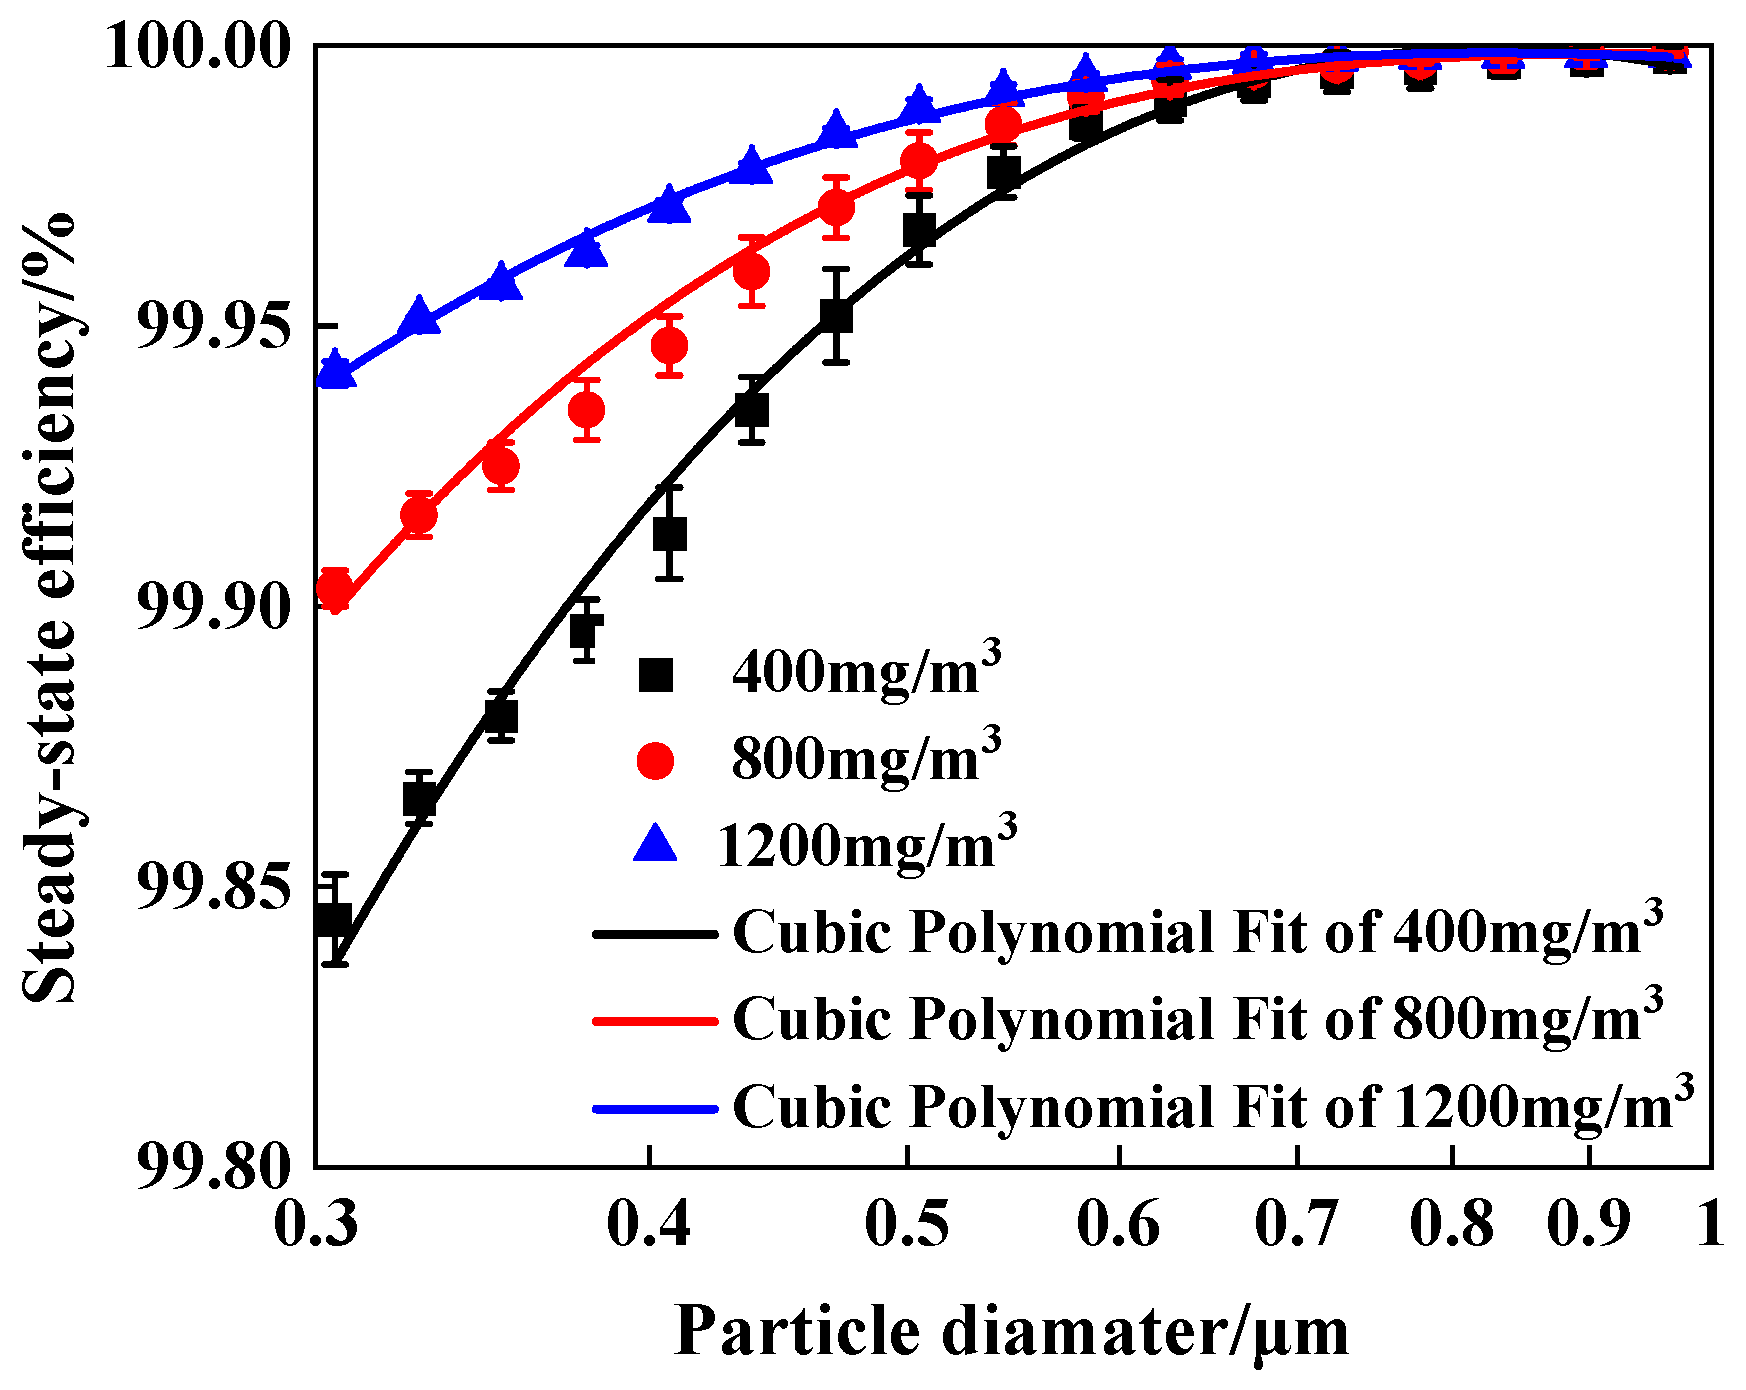
Taking a gas flowrate of 55.8 m3/h and an aerosol concentration of 800 mg/m3 as an example, the steady-state efficiency of the filter element at different gas temperatures is shown in Figure 2. The results were fitted by cubic polynomials. The R2 coefficients for 20 °C, 40 °C, and 70 °C are 0.995, 0.989, and 0.994, respectively. As can be seen, at the same filtration flowrate and aerosol concentration, the filtration efficiency gradually decreases with the increase in gas temperature. However, the degree of change in cumulative efficiency varies with the different particle sizes. A smaller particle size leads to greater decrease in filtration efficiency with the increase in gas temperature. When the gas temperature increased from 20 °C to 70 °C, the filtration efficiency for the droplets greater than 0.3 μm decreased by 0.074%. However, there is little variation for the droplets greater than 0.6 μm, of which the decrease in filtration efficiency was less than 0.01%.
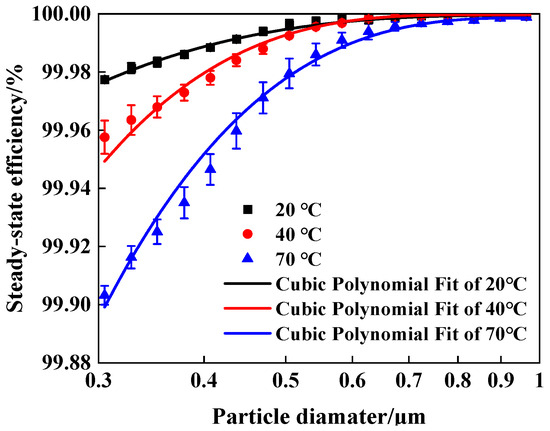
Figure 2.
Steady-state efficiency at different gas temperatures, with gas flowrate of 55.8 m3/h and aerosol concentration of 800 mg/m3.
The increase in operating temperature could affect the liquid surface tension and the aerosol particle size distribution. The surface tensions for oil were measured by a surface tension tester (Attension, Biolin Scientific, Gothenburg, Sweden) at temperatures of 20 °C, 40 °C, and 70 °C, which were 31.0 mN/m, 29.8 mN/m, and 27.7 mN/m, respectively. According to the modified Washburn Equation (Equation (1)) [23], it can be seen that the rise in fiber capillary height is proportional to surface tension, and surface tension decreases when the liquid temperature increases. The capillary effect is enhanced in fiber media, which means that liquid is more likely to wet filter media. More pores in the filter media were clogged by oil, which results in a decrease in the area of clean fibers that can effectively capture liquid droplets, leading to a reduction in the filtration efficiency of the filter media [24,25].
where is the capillary height increase at the steady state, m; C is the capillary wetting circumference, m; T is the liquid surface tension, N/m; θ is the contact angle, °; Ac is the capillary cross-sectional area, m2; ρ is the density of the liquid, kg/m3; and g is the acceleration of gravity, m/s2.
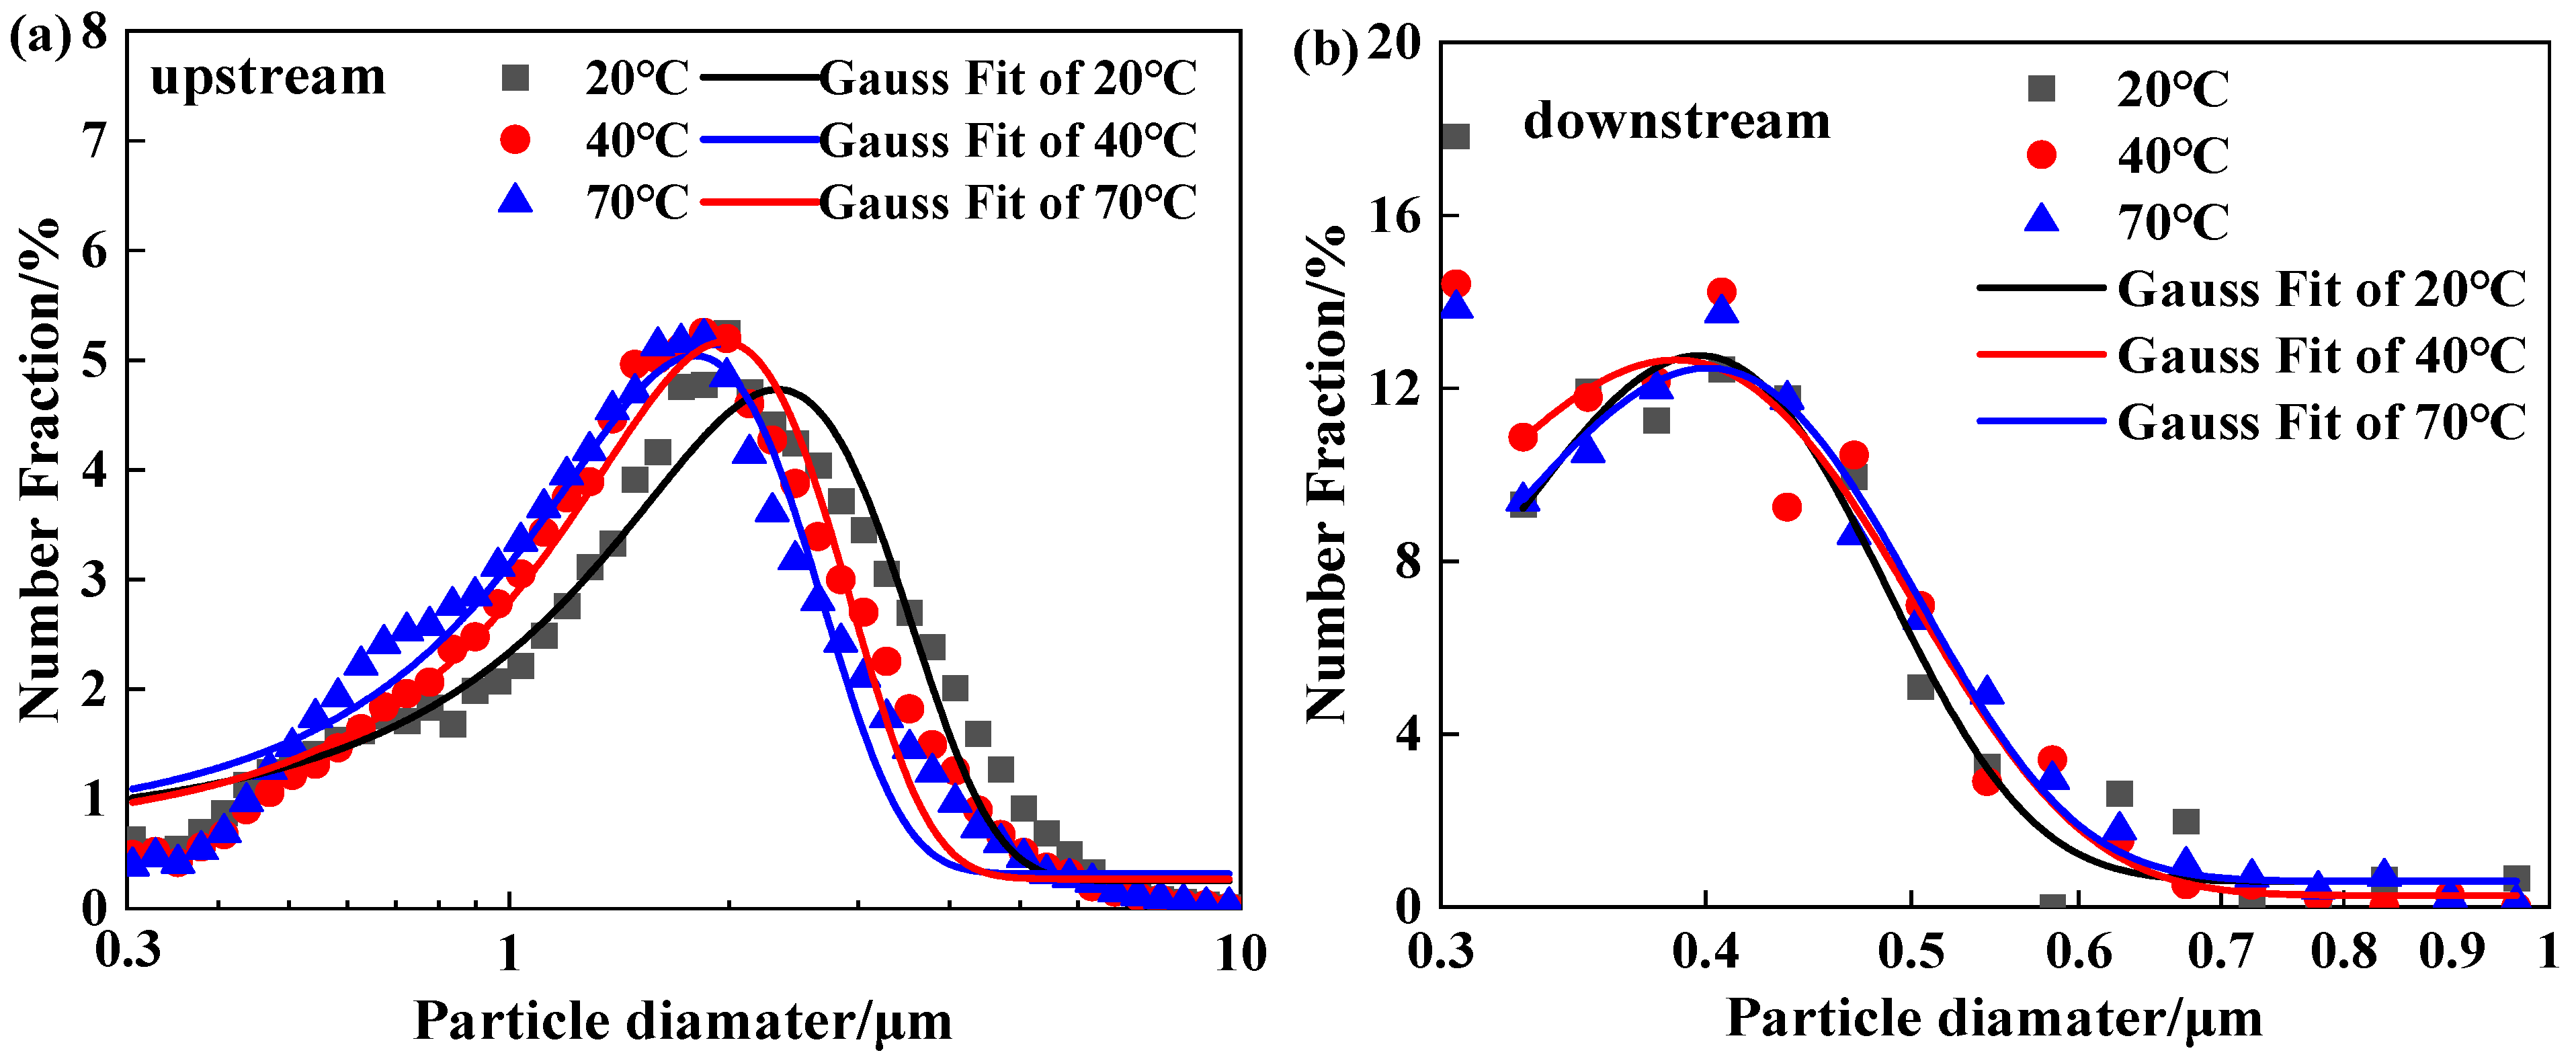
On the other hand, according to the “Jump-Channel” theory [26], a liquid film forms and extends on the rear side surface of oleophilic filter media. The serious re-entrainment of droplets occurred as the gas flowed through the liquid film, resulting in an increase in the droplet concentration downstream of the filter element. In addition, the upstream aerosol was shifted towards a small particle size after surface tension was reduced, as shown in Figure 3a. The results were fitted by Gauss distribution. The R2 coefficients for 20 °C, 40 °C, and 70 °C are 0.946, 0.944, and 0.953, respectively. The median droplet sizes were 1.7 μm and 1.4 μm at 20 °C and 70 °C, respectively. The shift in upstream particle size at higher temperatures led to an increase in the concentration of droplets in the range of 0.3–2 μm, which made it more difficult for the filter element to capture the droplets, resulting in a decrease in filtration efficiency.
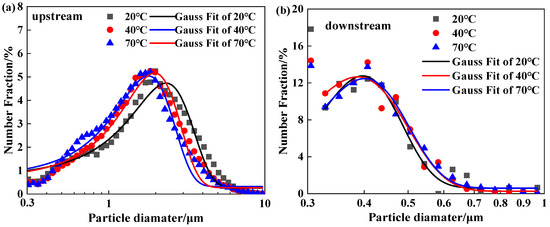
Figure 3.
Particle size distribution upstream and downstream at different gas temperatures with gas flowrate of 55.8 m3/h and aerosol concentration of 800 mg/m3. (a) Particle size distribution upstream at different gas temperatures. (b) Particle size distribution downstream at different gas temperatures.
Figure 3b shows the particle size distribution downstream of the element at the different gas temperatures. The results were fitted by Gauss distribution. The R2 coefficients for 20 °C, 40 °C, and 70 °C are 0.959, 0.963, and 0.985, respectively. As can be seen, the particle size is mainly in the range of 0.3~0.6 μm for each temperature. For the droplets greater than 0.6 μm, there is no obvious difference between the results at each temperature, in which there is a reduction in the difference between the filtration efficiencies in this particle size range, and filtration efficiency gradually tends to be close to 100%. The above results also show that there was no obvious re-entrainment in this experiment, which indicates that the decrease in efficiency resulting from the increase in temperature is caused by the change in wettability and the increase in the number of small-sized droplets upstream. The filtration efficiency for droplets greater than 0.3 μm at the different temperatures was further compared with that at a gas flowrate of 55.8 m3/h at the different upstream aerosol concentrations, as shown in Figure 4. Obviously, the filtration efficiency decreases with increasing temperature under all the concentration conditions. A higher gas temperature cannot lead to a greater increase in efficiency for the same aerosol concentration. However, for different aerosol concentrations, a higher efficiency may be obtained at a high temperature. For example, the filtration efficiency at a higher temperature (70 °C) and a higher concentration (800 or 1200 mg/m3) is higher than that at a lower temperature (40 °C) and a lower concentration (400 mg/m3), as shown in Figure 4. It should be noted that the increase in filtration efficiency results from the increase in aerosol concentration, rather than gas temperature. The above results show that the effect of the change in aerosol concentration on filtration efficiency is more significant than that caused by the change in temperature. In engineering applications, in order to improve the filtration performance, the temperature of gas flowing into the lubricating oil separator must be minimized, which can be realized by reducing the compressor inlet gas temperature or improving the cooling effect of the air cooler set up downstream of the compressor.
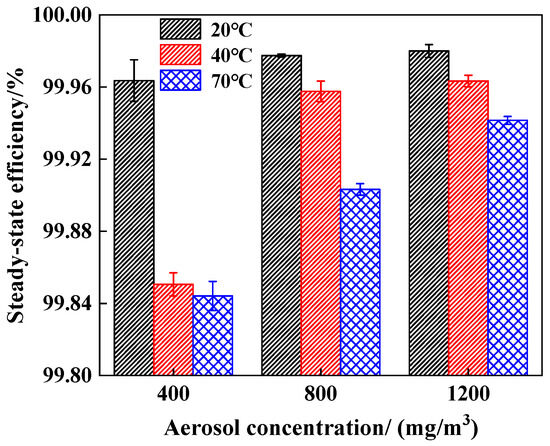
Figure 4.
Steady-state efficiency at different gas temperatures, with gas flowrate of 55.8 m3/h and aerosol concentrations of 400 mg/m3, 800 mg/m3, 1200 mg/m3.
3.2. Effect of Aerosol Concentration
Figure 5 shows the steady-state efficiency for different upstream concentrations at 55.8 m3/h and 70 °C. The results were fitted by cubic polynomials. The R2 coefficients for 400 mg/m3, 800 mg/m3, and 1200 mg/m3 are 0.994, 0.994, and 0.998, respectively. As shown, the filtration efficiency gradually increases with the increase in upstream concentration at the same filtration flowrate and temperature. Same as the results of Section 3.1, the degree of change in cumulative efficiency varies at different particle sizes. When the aerosol concentration increases from 400 mg/m3 to 1200 mg/m3, the filtration efficiency for droplets greater than 0.3 μm increases by 0.097%. However, the filtration efficiency for droplets greater than 0.6 μm increases by less than 0.01%.
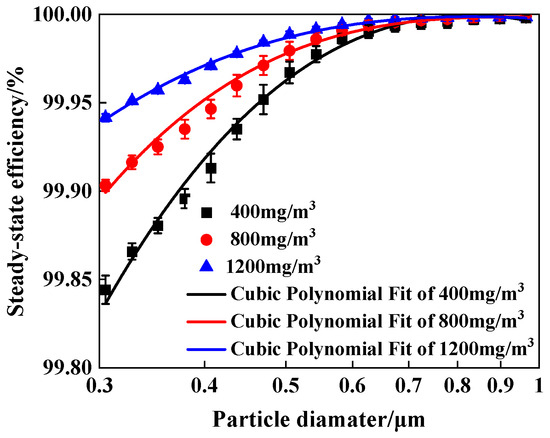
Figure 5.
Steady-state efficiency at gas flowrate of 55.8 m3/h and gas temperature of 70 °C.
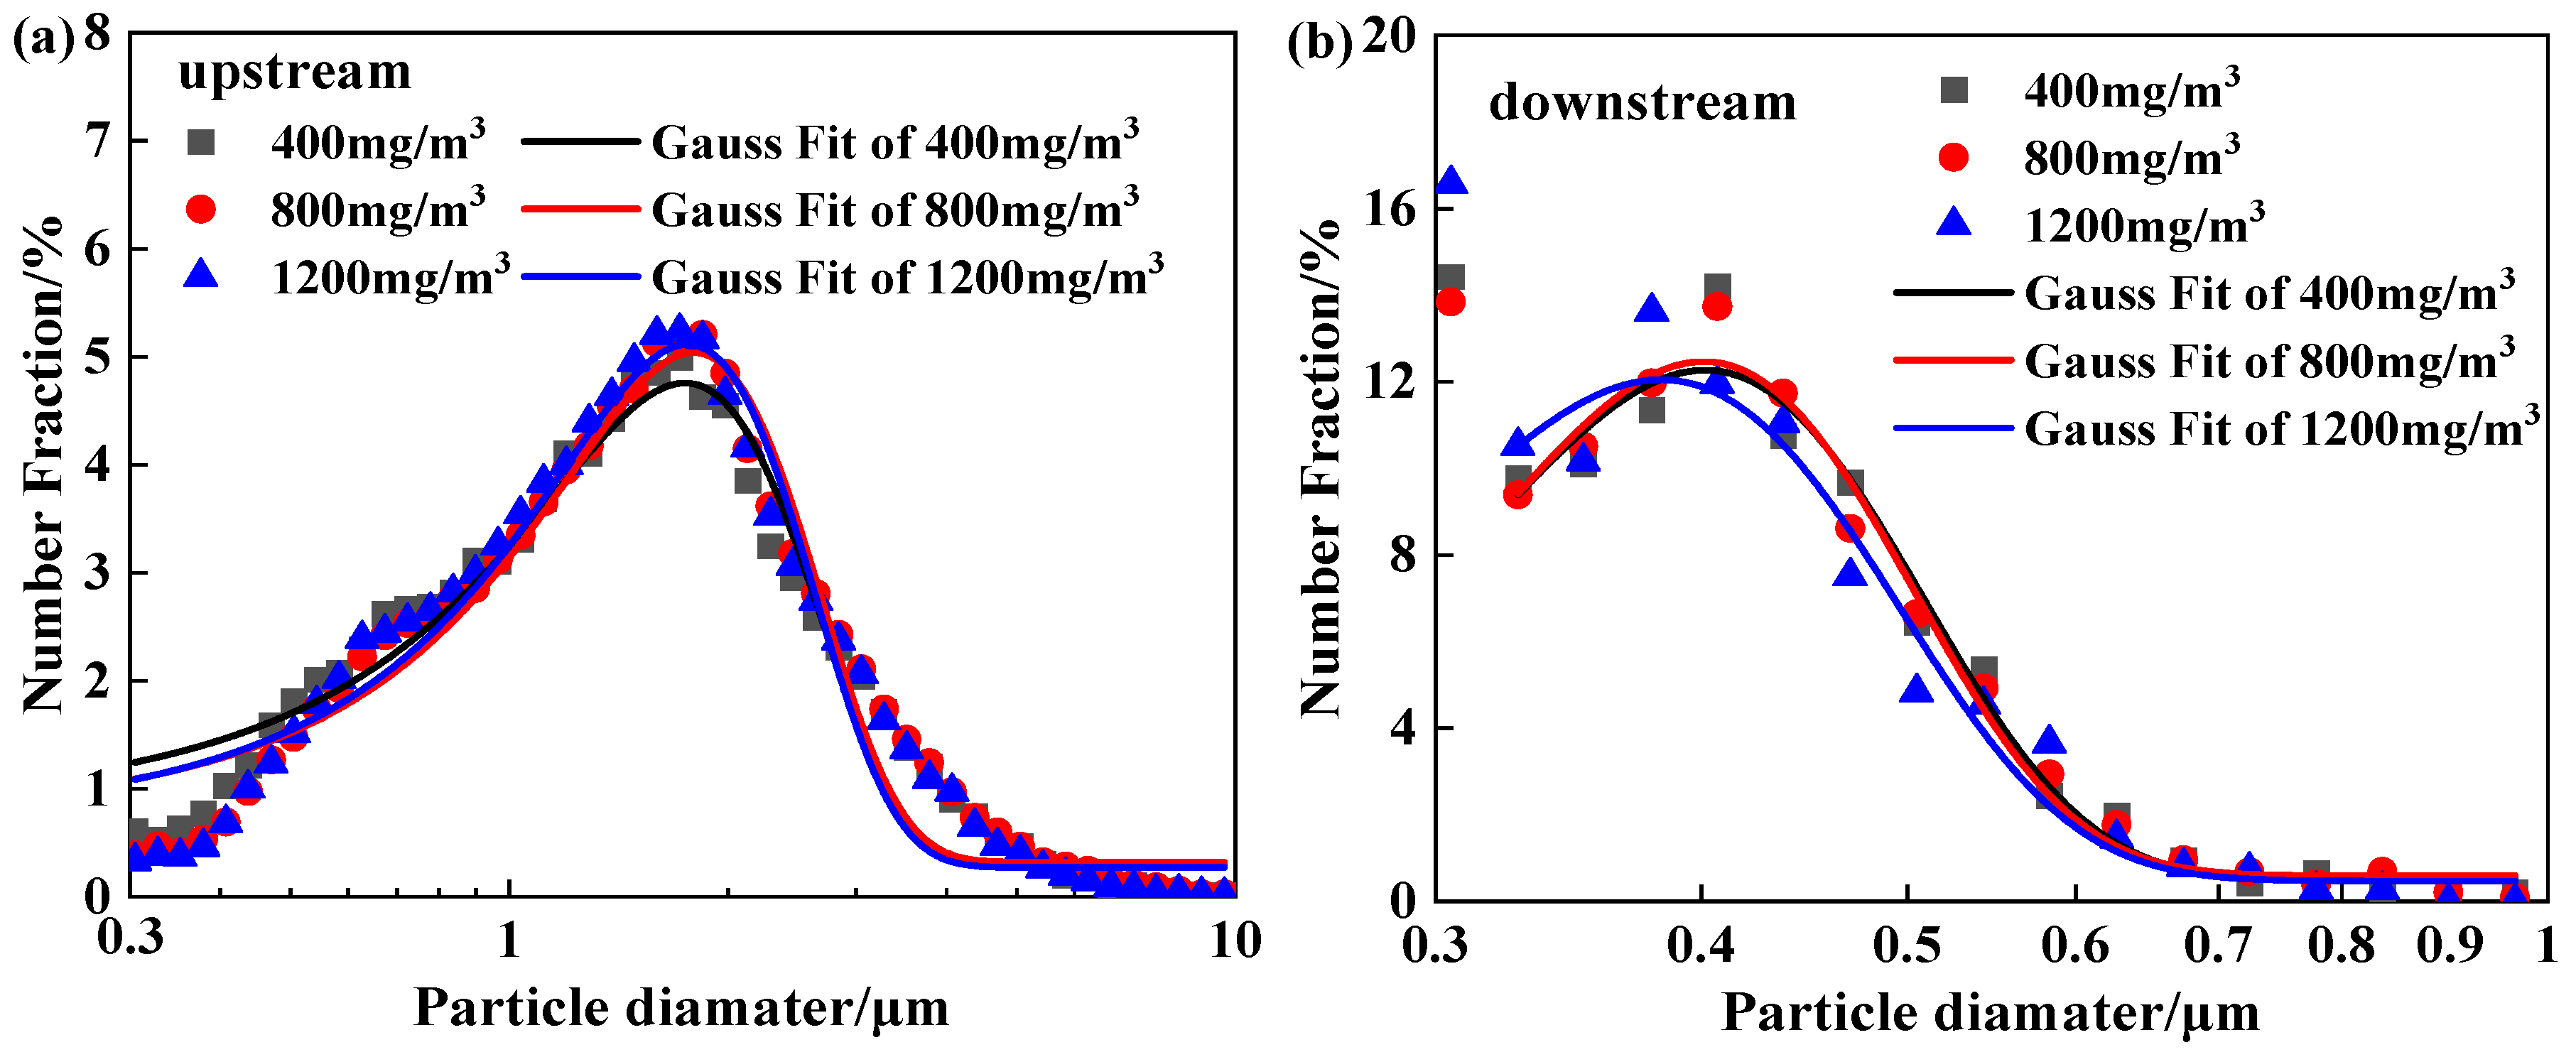
Figure 6 shows the particle size distribution upstream and downstream of the filter element at the different aerosol concentrations. The results in Figure 6a were fitted by Gauss distribution. The R2 coefficients for 400 mg/m3, 800 mg/m3, and 1200 mg/m3 are 0.944, 0.944, and 0.943, respectively. The particle size distribution did not vary significantly after increasing the upstream aerosol concentration. The increase in aerosol concentration was realized by increasing the amount of liquid flowing into the atomizer, in which the liquid physical properties did not change, leading to a stable particle size distribution. The results in Figure 6b were fitted by Gauss distribution. The R2 coefficients for 400 mg/m3, 800 mg/m3, and 1200 mg/m3 are 0.975, 0.985, and 0.963, respectively. For the downstream particle size distribution, there was no remarkable difference under the different concentration conditions. When the upstream concentration increased from 400 mg/m3 to 1200 mg/m3, the downstream concentration also increased gradually from 93.81 mg/m3 to 112.39 mg/m3. However, the increasing rate for the downstream concentration is significantly smaller than that of the upstream concentration, which led to a gradual increase in efficiency with the increase in the upstream concentration.

Figure 6.
Particle size distribution upstream and downstream at gas flowrate of 55.8 m3/h and gas temperature of 70 °C. (a) Particle size distribution upstream at different aerosol concentrations. (b) Particle size distribution downstream at different aerosol concentrations.
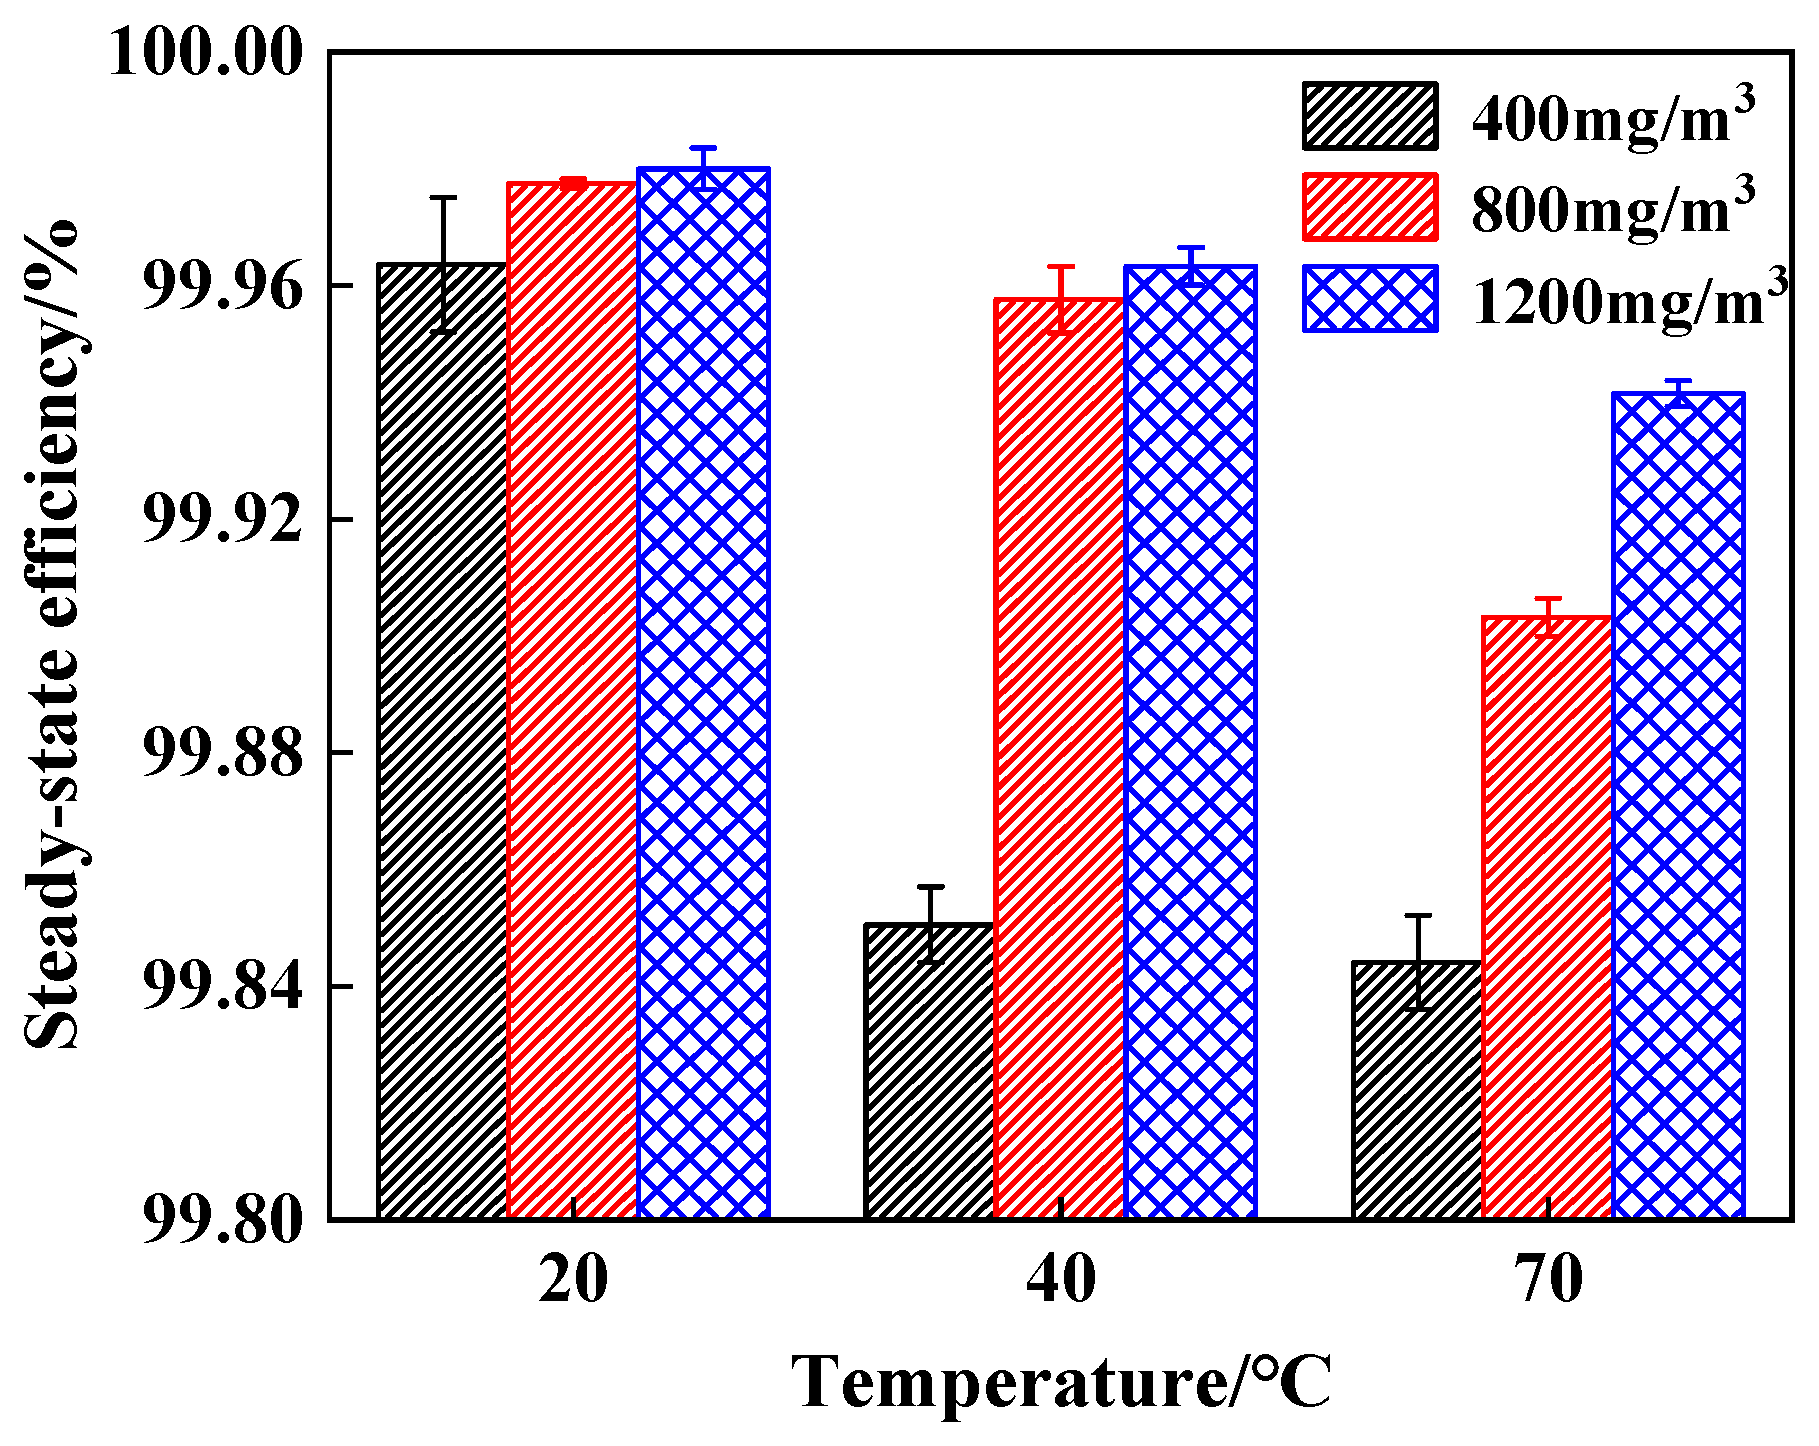
Figure 7 shows the filtration efficiency for droplets greater than 0.3 μm at 55.8 m3/h for the different upstream aerosol concentrations and temperatures. As shown, the steady-state efficiency gradually increases with the increase in concentration. However, the effect of aerosol concentration on the steady-state efficiency varies at the different temperatures. As the aerosol concentration increased, the steady-state efficiency increased by 0.02%, 0.11%, and 0.10% at 20 °C, 40 °C, and 70 °C, respectively. The results show that the increase in temperature makes the filter more sensitive to the change in aerosol concentration, implying that an increase in the amount of lubricating oil injected into a reciprocating compressor does not lead to a deterioration in the filtration performance. Nevertheless, in consideration of the droplets penetrating downstream and the service life of the filter element, a smaller amount of lubricating oil is recommended to inject into a reciprocating compressor the within the allowable dosing range.
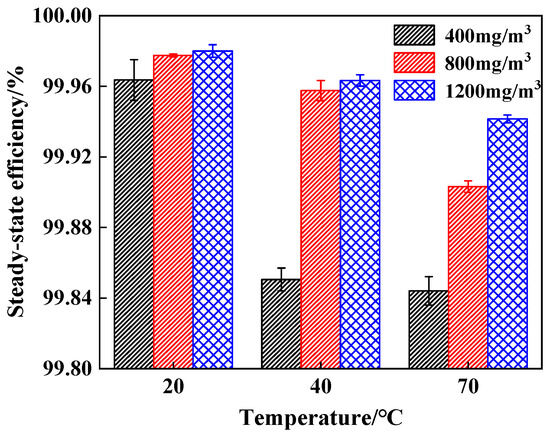
Figure 7.
Steady-state efficiency at different aerosol concentrations, with gas flowrate of 55.8 m3/h and gas temperatures of 20 °C, 40 °C, and 70 °C.
3.3. Effect of Flowrate
Figure 8 shows the filtration efficiency for different flowrates at 70 °C and 800 mg/m3. The results were fitted by cubic polynomials. The R2 coefficients for 37.2 m3/h, 55.8 m3/h, and 74.4 m3/h are 0.993, 0.994, and 0.994, respectively. It can be seen that the filtration efficiency increases with an increasing flowrate at the same concentration. The increase in the flowrate results in higher filtration efficiency, which can be explained in following way. The filter media used in this work are oleophobic glass fiber materials with a small average fiber diameter. According to the “Jump-Channel” theory, there is a dense liquid film that formed on the face side of the oleophobic filter media. The inertial effect of aerosol droplets is enhanced due to the increased flowrate, resulting in more droplets being captured by the liquid film. Moreover, for the oleophobic filter media, the number of liquid channels formed within the filter media decreases as the flowrate increases, resulting in less liquid remaining in the filter media [10,11] and a larger effective filtration area that can be used to capture droplets, which also contributes to an increase in filtration efficiency. In addition, for the droplets flowing through the filter media, according to the classical single-fiber theory, the capture mechanisms of droplets by fibers mainly include diffusion, interception, and inertial impaction. For droplets smaller than 0.3 μm, the capture mechanism is dominated by diffusion, which is weakened by the increase in flowrate. For droplets greater than 0.3 μm, the capture mechanism is dominated by interception and inertial impaction, which are enhanced by the increase in flowrate. In the range of this work, the upstream aerosol particles are larger than 0.3 μm. Therefore, the capture of droplets by the fibers is enhanced as the flowrate increases.
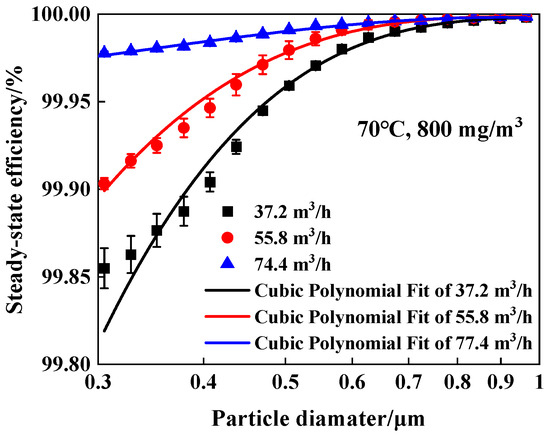
Figure 8.
Steady-state efficiency at different gas flowrates with gas temperature of 70 °C and aerosol concentration of 800 mg/m3.
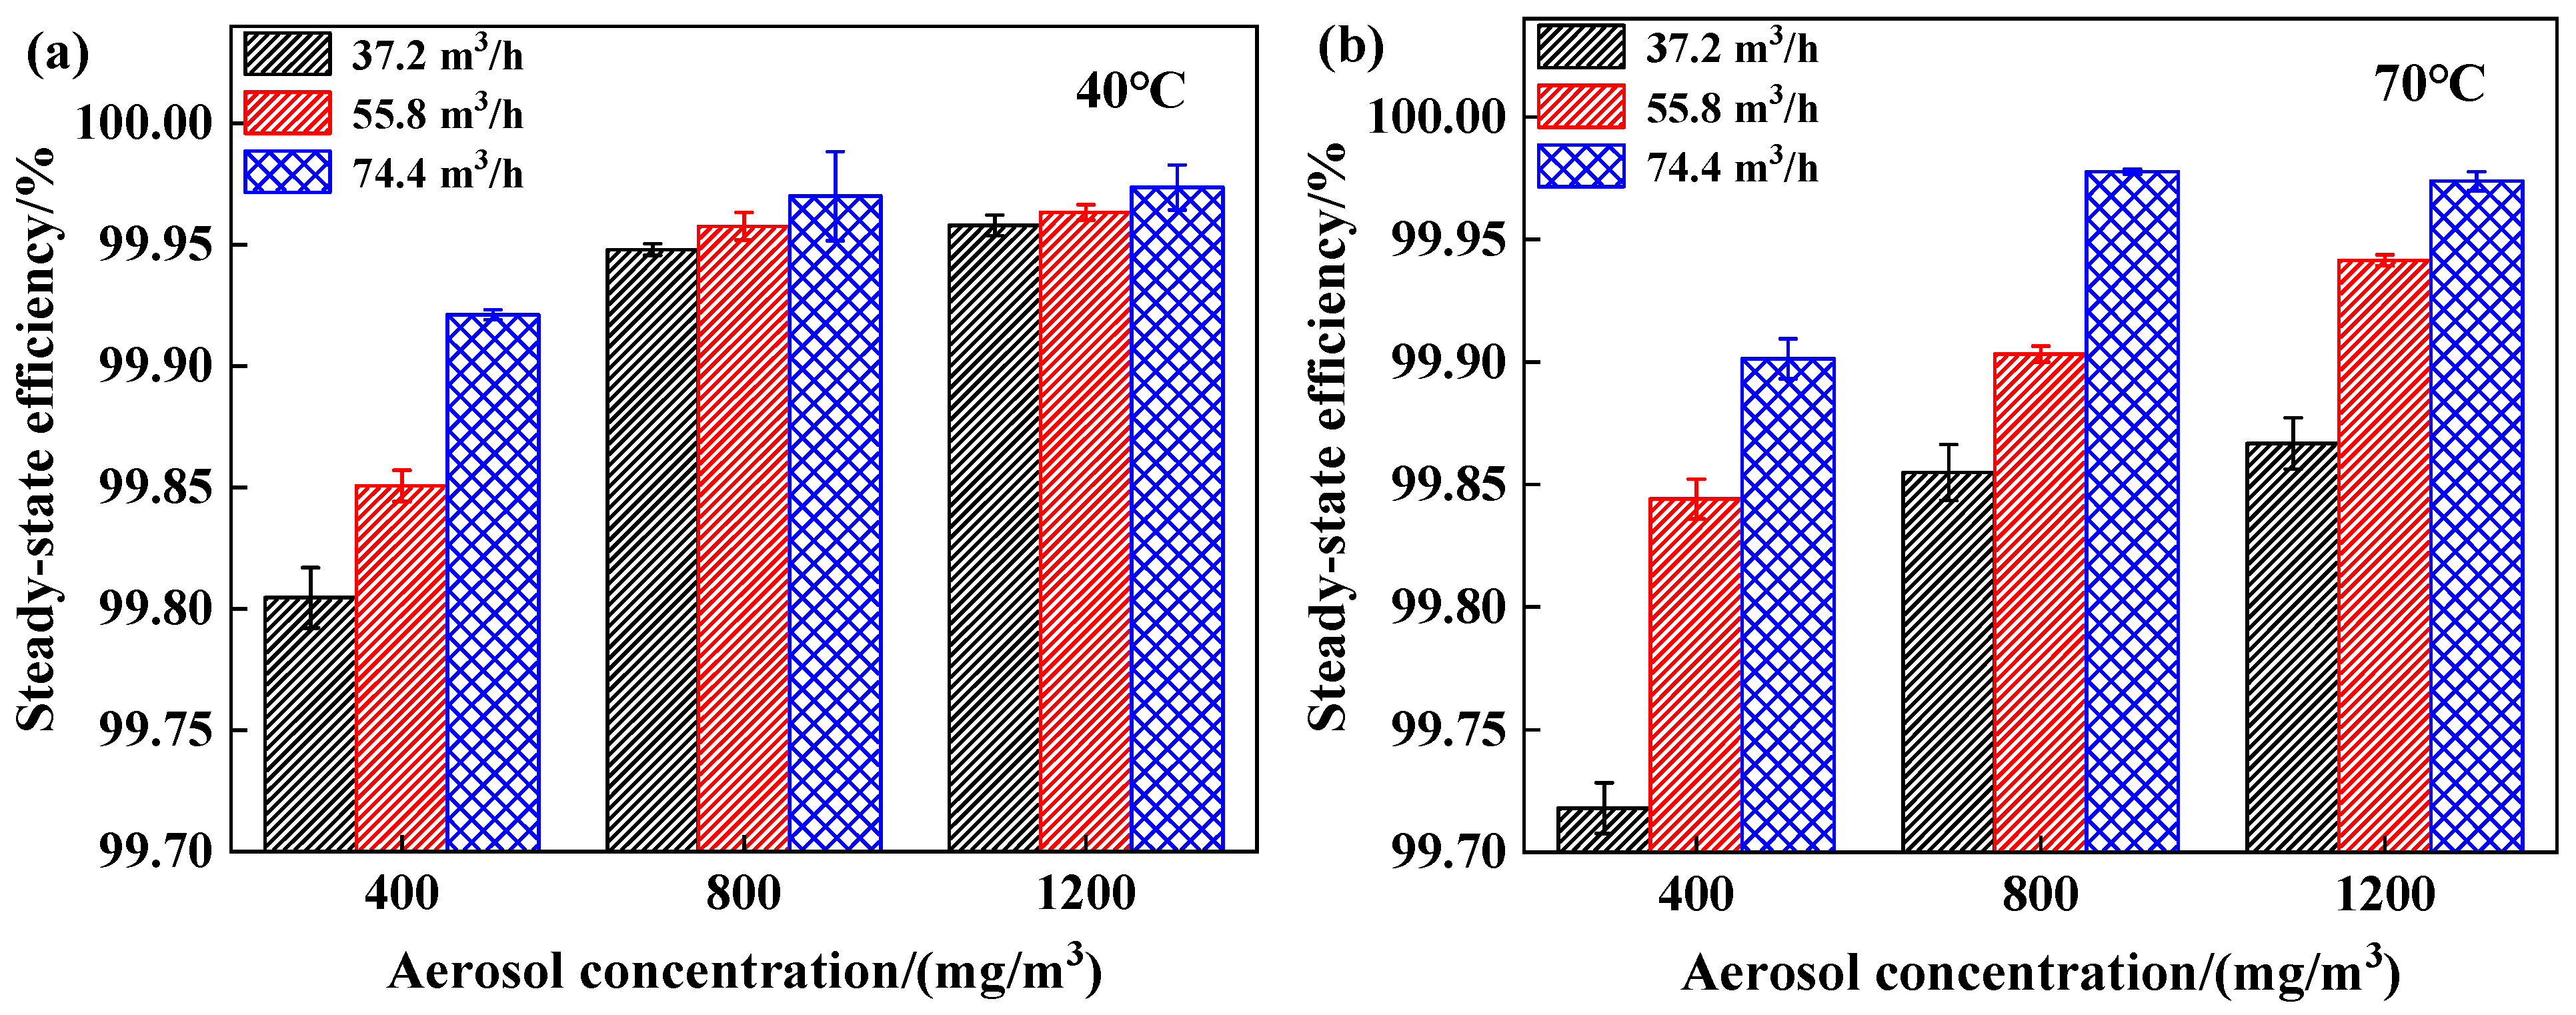
Figure 9 shows the filtration efficiency for droplets greater than 0.3 μm at 40 °C and 70 °C at different aerosol concentrations and flowrates. As can be seen, for the same gas temperature and concentration, the steady-state efficiency gradually increases with the increase in flowrate. At 40 °C, the steady-state efficiency increased by 0.12%, 0.02%, and 0.02% when the concentration was 400 mg/m3, 800 mg/m3, and 1200 mg/m3, respectively, while the steady-state efficiency was increased by 0.18%, 0.12%, and 0.11% at 70 °C. The above results show that for a higher gas temperature and a lower concentration, there is a more obvious change in steady-state efficiency when the flowrate varies. In engineering applications, there are a few or dozens of filter elements set up in the lubricating oil separator. For the same volume of processed gas, using fewer filter elements leads to a higher flowrate for a single filter element. According to Figure 9, it can be seen that a higher filtration efficiency can be obtained for a higher flowrate. Therefore, fewer elements are recommended to improve the filtration and separation performance.
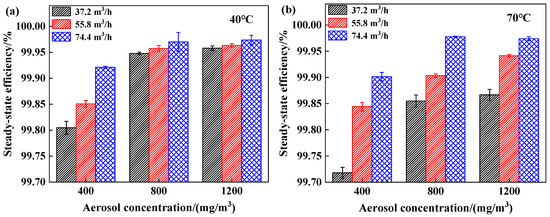
Figure 9.
Steady-state efficiency at different gas flowrates and different aerosol concentrations with gas temperatures of 40 °C and 70 °C. (a) Steady-state efficiency at different gas flowrates and different aerosol concentrations with gas temperature of 40 °C. (b) Steady-state efficiency at different gas flowrates and different aerosol concentrations with gas temperature of 70 °C.
4. Conclusions
In this study, the effects of gas temperature, aerosol concentration, and gas flowrate on the steady-state filtration efficiency of filter elements were investigated experimentally. The results show that at the same flowrate, the steady-state filtration efficiency decreases with increasing temperature, resulting from the shift in the upstream aerosol towards a smaller size and an increase in the concentration of droplets within the range of 0.3 to 2 μm. Compared with the temperature change, the concentration change had a bigger influence on filtration efficiency. At the same flowrate, when the aerosol concentration increases from 400 mg/m3 to 1200 mg/m3, the increase in the steady-state efficiency varies at different temperatures. The filtration efficiency only increases by 0.02% at 20 °C, while the steady-state efficiency increases by more than 0.10% at 70 °C and all the flowrates. In addition, at the same gas temperature and aerosol concentration, the steady-state filtration efficiency increases with the increase in flowrate. In practical applications, when the volume of natural gas flowing through a lubricating oil separator is constant, fewer filter elements set up in the separator can increase the filtration flowrate for each filter element. Moreover, appropriately reducing the injection amount of lubricating oil can increase the aerosol concentration. Using the above methods, the filtration performance of filter elements can be improved. As the experimental ranges of gas temperature, aerosol concentration, and flowrate were obtained based on the operating conditions of a lubricating oil separator in an underground natural gas storage, the obtained results are applicable in the field.
Author Contributions
Conceptualization, C.C.; methodology, H.L.; validation, S.W. and M.L.; formal analysis, M.L.; investigation, H.L. and S.W.; data curation, R.S.; writing—original draft preparation, H.L.; writing—review and editing, C.C.; visualization, K.C. All authors have read and agreed to the published version of the manuscript.
Funding
This research was funded by the research project of Liaohe Oilfield (Panjin) Gas Storage Co., Ltd., grant number LHSY-CQKGS-2023-JS-9365.
Data Availability Statement
The original contributions presented in this study are included in the article. Further inquiries can be directed to the corresponding author.
Conflicts of Interest
Authors Hongjun Li, Shengping Wang were employed by the company Liaohe Oilfield (Panjin) Gas Storage Co., Ltd. Author Mingxin Liu was employed by the company Liaohe Oilfield Construction Co., Ltd. Author Rongjun Song was employed by the Gas Storage Co., Ltd., PetroChina Xinjiang Oilfield Company. The remaining authors declare that the research was conducted in the absence of any commercial or financial relationships that could be construed as a potential conflict of interest. The company had no role in the design of the study; in the collection, analyses, or interpretation of data; in the writing of the manuscript, or in the decision to publish the results.
References
- Ding, G.S.; Li, C.; Yang, J.M.; Xu, H.C.; Zheng, Y.L.; Wanyan, Q.Q.; Zhao, Y.J. The status quo and technical development direction of underground gas storages in China. Nat. Gas Ind. 2015, 35, 107–112. (In Chinese) [Google Scholar] [CrossRef]
- Ding, G.S.; Wei, H. Review on 20 years’ UGS construction in China and the prospect. Oil Gas Storage Transp. 2020, 39, 5–31. (In Chinese) [Google Scholar]
- Kampa, D.; Wurster, S.; Buzengeiger, J.; Mayer, J.; Kasper, G. Pressure drop and liquid transport through coalescence filter media used for oil mist filtration. Int. J. Multiph. Flow 2014, 58, 313–324. [Google Scholar] [CrossRef]
- Chang, C.; Ji, Z.L.; Liu, J.L. The effect of a drainage layer on the saturation of coalescing filters in the filtration process. Chem. Eng. Sci. 2017, 160, 354–361. [Google Scholar] [CrossRef]
- Chen, F.; Ji, Z.L.; Qi, Q.Q. Effect of pore size and layers on filtration performance of coalescing filters with different wettabilities. Sep. Purif. Technol. 2018, 201, 71–78. [Google Scholar] [CrossRef]
- Mullins, B.J.; Mead-Hunter, R.; Pitta, R.N.; Kasper, G.; Heikamp, W. Comparative performance of philic and phobic oil-mist filters. AIChE J. 2014, 60, 2976–2984. [Google Scholar] [CrossRef]
- Penner, T.; Mayer, J.; Dittler, A. Oleophilic and oleophobic media combinations -Influence on oil mist filter operating performance. Sep. Purif. Technol. 2021, 261, 118255. [Google Scholar] [CrossRef]
- Song, R.J.; Ji, K.; Chen, Y.E.; Zhang, Y.X.; Tang, M.; Li, H.T.; Chang, C. Experimental on liquid passage saturation and pressure drop of gas-liquid coalescing filter material. Oil Gas Storage Transp. 2023, 42, 670–677. (In Chinese) [Google Scholar]
- Chen, F.; Ji, Z.L.; Qi, Q.Q. Effect of liquid surface tension on the filtration performance of coalescing filters. Sep. Purif. Technol. 2019, 209, 881–891. [Google Scholar] [CrossRef]
- Kolb, H.E.; Mayer, J.; Kasper, G. Flow velocity dependence of the pressure drop of oil mist filters. Sep. Purif. Chem. Eng. Sci. 2017, 166, 107–114. [Google Scholar] [CrossRef]
- Penner, T.; Mayer, J.; Kasper, G.; Dittler, A. Impact of operating conditions on the evolution of droplet penetration in oil mist filters. Sep. Purif. Technol. 2019, 211, 697–703. [Google Scholar] [CrossRef]
- Straube, C.; Meyer, J.; Dittler, A. Investigation of the local oil distribution on oleophilic mist filters applying X-ray micro-computed tomography. Sep. Purif. Technol. 2023, 311, 123279. [Google Scholar] [CrossRef]
- Mead-Hunter, R.; Mullins, B.J.; Becker, T.; Braddock, R.D. Evaluation of the force required to move a coalesced liquid droplet along a fiber. Langmuir 2011, 27, 227–232. [Google Scholar] [CrossRef]
- Mead-Hunter, R.; Bergen, T.; Becker, T.; O’leary, R.A.; Kasper, G.; Mullins, B.J. Sliding/rolling phobic droplets along a fiber: Measurement of interfacial forces. Langmuir 2012, 28, 3483–3488. [Google Scholar] [CrossRef] [PubMed]
- Schwarzwälder, A.; Meyer, J.; Dittler, A. Experimental analysis of droplet coalescence and transport mechanisms on a single vertical fiber. Exp. Fluids 2023, 64, 103. [Google Scholar] [CrossRef]
- Chen, F.; Ji, Z.L.; Yu, W.H.; Dong, W.; Wang, Q.; Wang, D. Influence of nanofiber membrane wettability on gas-liquid filtration performance of sandwiched composite filters. J. Text. Res. 2022, 43, 63–69, 85. (In Chinese) [Google Scholar]
- Chang, C.; Lyu, Q.; Ding, Y.H.; Ji, Z. Investigation of oil mist filtration performance of surface modified coalescence filters with asymmetric wettability. Sep. Purif. Technol. 2024, 331, 125465. [Google Scholar] [CrossRef]
- Chang, C.; Ji, Z.L.; Liu, C.; Zhao, F.T. Permeability of filter elements used for natural gas filtration at high pressure. J. Nat. Gas Sci. Eng. 2016, 34, 419–427. [Google Scholar] [CrossRef]
- Chang, C.; Wang, D.Y.; Wang, Y.W. Performance measurement and analysis of gas coalescence filter element. Oil Gas Storage Transp. 2021, 40, 1161–1166. (In Chinese) [Google Scholar]
- Liu, Z.; Du, H.D.; Hu, X. Experimental investigation of influence of high-pressure condition on filtration performance of natural gas filter element. J. Chem. Ind. Eng. Soc. China 2021, 72, 2669–2679. (In Chinese) [Google Scholar]
- Li, Y.P.; Chen, F.; Sun, Y.; Jia, H.J.; Gan, J.; Yu, W.H.; Jiao, Q.; Ji, Z.L. Performance analysis and optimization of oleophobic coalescing filter element at high gas velocity. Oil Gas Storage Transp. 2023, 42, 817–825, 834. (In Chinese) [Google Scholar]
- Boegnakke, C.; Sonntag, R.E. Fundamentals of Thermodynamics, 8th ed.; Wiley: New York, NY, USA, 2013; p. 758. [Google Scholar]
- Reed, C.M.; Wilson, N. The fundamentals of absorbency of fibers, textile structures and polymers. I. The rate of rise of a liquid in glass-capillaries. J. Phys. D Appl. Phys. 1993, 26, 1378–1381. [Google Scholar] [CrossRef]
- Payet, S.; Boulaud, D.; Madelaine, G.; Renoux, A. Penetration and pressure drop of a HEPA filter during loading with submicron liquid particles. J. Aerosol Sci. 1992, 23, 723–735. [Google Scholar] [CrossRef]
- Frising, T.; Thomas, D.; Bemer, D.; Contal, P. Clogging of fibrous filters by liquid aerosol particles: Experimental and phenomenological modeling study. Chem. Eng. Sci. 2005, 60, 2751–2762. [Google Scholar] [CrossRef]
- Kampa, D.; Wurster, S.; Mayer, J.; Kasper, G. Validation of a new phenomenological “jump-and-channel” model for the wet pressure drop of oil mist filters. Chem. Eng. Sci. 2015, 122, 150–160. [Google Scholar] [CrossRef]


Disclaimer/Publisher’s Note: The statements, opinions and data contained in all publications are solely those of the individual author(s) and contributor(s) and not of MDPI and/or the editor(s). MDPI and/or the editor(s) disclaim responsibility for any injury to people or property resulting from any ideas, methods, instructions or products referred to in the content. |
© 2025 by the authors. Licensee MDPI, Basel, Switzerland. This article is an open access article distributed under the terms and conditions of the Creative Commons Attribution (CC BY) license (https://creativecommons.org/licenses/by/4.0/).