Abstract
Challenges associated with the homogeneous charge combustion ignition (HCCI) concept include combustion phasing control and a narrow operating window. To address the HCCI engine developmental needs, chemical kinetic solvers have been recently included in the commercial engine simulation toolchains like GT-Suite v2024 upward. This study investigates the feasibility of ammonia (NH3) and hydrogen (H2) as dual fuels in homogenous charge compression ignition (HCCI) engines, leveraging chemical kinetics modeling via GT-Suite software v2024. A validated baseline model was adapted with NH3/H2 injectors and simulated across varying blending ratios (BR), compression ratios (CR), air–fuel equivalence ratios (ER), and engine speeds. Results reveal that adding 10% H2 to NH3 significantly improves ignition. Optimal performance was observed at a CR of 20 and a lean mixture, achieving higher indicated thermal efficiency (about 40%), while keeping the intrinsic advantages of zero-carbon fuel. However, NOx emissions increased with higher ER due to elevated combustion temperatures. The study emphasizes the trade-offs between efficiency and NOx emissions under tested conditions. Finally, despite the single-zone model limitations in neglecting thermal stratification, this study shows that kinetic modeling has great potential for effectively predicting trends in HCCI, thereby demonstrating the promise of NH3/H2 blends in HCCI engines for cleaner and efficient combustion, paving the way for advanced dual-fuel combustion concepts.
1. Introduction
The global pursuit of carbon neutrality has intensified the exploration of alternative fuels that can replace conventional hydrocarbon fuels in internal combustion engines (ICEs). Among emerging zero-carbon fuels, ammonia (NH3) and hydrogen (H2) have attracted growing interest due to their complementary combustion properties, abundance, and potential for renewable production pathways [1,2]. Their combination has proven particularly promising in advanced combustion concepts, particularly in the context of homogeneous charge compression ignition (HCCI) engines, which hold high-efficiency and near-zero emission output profiles [3,4].
Ammonia stands out as a viable hydrogen carrier and carbon-free fuel, benefiting from an already established distribution infrastructure. However, its direct applicability in ICEs is constrained by several challenges: notably, a narrow flammability limit, low flame speed (≈0.07 m/s) and high autoignition temperature (≈651 °C) that lead to combustion instability and ammonia slip [5]. These limitations are particularly pronounced in HCCI operation, which lacks a direct ignition source and relies on autoignition of a homogeneous mixture [5,6]. Hydrogen, on the other hand, features high diffusivity, fast flame speed, and low ignition energy, making it an ideal combustion enhancer for ammonia. Several studies confirm that blending H2 with NH3 significantly improves combustion stability, increases peak pressure, and reduces unburned ammonia emissions [5,7]. For instance, Pochet et al. demonstrated that NH3/H2 dual fueling in an HCCI engine with a 22:1 compression ratio (CR) expands the load range and increases combustion efficiency, although with a notable increase in NOx emissions that necessitates after-treatment such as exhaust gas recirculation (EGR) [2]. Akram et al. also experimentally verified these trends in a diesel pilot-ignited engine operating on NH3/H2 mixtures [5]. They found that increasing H2 and diesel pilot content improved net indicated mean effective pressure at 720 °CA (IMEP720) and indicated efficiency yet introduced ammonia slip and high NOx levels, particularly under low-load conditions [5]. Their findings support the role of hydrogen as a combustion enhancer for ammonia-based fuels in practical engine platforms.
While experimental investigations have shown the feasibility of NH3/H2 combustion in ICEs, detailed kinetic modeling provides critical insights into the complex ignition phenomena under HCCI conditions. More comprehensive simulation frameworks have evolved to capture the behavior of complex fuels in HCCI combustion. Kominionos and Rakopoulos reviewed various single-zone, multizone and multidimensional chemical kinetics models used to simulate HCCI operation with biofuels, hydrogen, and ammonia [4]. They emphasized the need for detailed kinetic mechanisms to resolve ignition chemistry accurately and predict performance across operating conditions. Xu et al. applied direct numerical simulation (DNS) to explore the impact of temperature and composition stratification on NH3/H2 autoignition. Their results showed that temperature stratification is more effective than composition stratification in extending combustion duration and moderating peak heat release rates (HRR) [6]. Stagni et al. have also investigated low- and intermediate-temperature NH3/H2 oxidation in a flow reactor using both experimental and wide-range kinetic modeling [8]. Similarly, Guo et al. utilized detailed kinetic models to investigate the combustion of n-heptane in HCCI, highlighting how precise control over ignition delay and HRR is essential for optimizing performance and emissions [9]. Challenges associated with the HCCI concept include achieving a consistent combustion phasing and controlling ignition timing under diverse engine operating conditions [3]. Fast simulation models are employable in engine performance optimization, due to their high comparability, enabling rapid prototyping of robust engine models [10]. This makes applied-level engine research possible, such as maximizing engine design concepts’ functioning limitations for technical advancement. HCCI simulation techniques vary by run-time constraint application, ranging from high-fidelity three-dimensional (3D) models to zero-dimensional (0D) models [11]. Computational fluid dynamics (CFD) solves the Navier–Stokes equations in detail, making 0D an order of magnitude faster than CFD. Chemical kinetics is usually used to simulate HCCI combustion progress, regardless of the model fidelity [10,11]. This illustrates the reaction-driven nature of the phenomena for capturing ignition and combustion characteristics. To address LTC development needs, chemical kinetic solvers have been recently included in the commercial engine simulation toolchains like GT-Suite (v2022 onwards) [12]. However, limited studies have validated the use of such solvers in 0–1D simulation, with unconventional fuels such as NH3 and H2 especially under HCCI conditions. This study aims to fill this gap by implementing a validated NH3/H2 kinetic mechanism in a 1D HCCI model in GT-Suite, assessing combustion and emissions across a wide range of operating conditions. Specifically, the study explores how blending ratio (BR), air–fuel equivalence ratio (ER), compression ratio (CR), and engine speed affect engine performance, combustion phasing and NOx emissions. In addition, cycle-to-cycle variability (CCV) is analyzed over six simulated cycles to quantify stability, a critical metric in HCCI combustion. By combining simulation accuracy with comprehensive parametric evaluation, this work contributes to the growing body of research on ammonia–hydrogen-fueled engines and highlights the opportunity and trade-offs inherent in transitioning towards carbon-free combustion.
To this end, using an n-heptane-fueled single-cylinder HCCI engine, Guo et al. [9] compared their experimental measurement with numerical simulations. They observed slight discrepancies in the HRR, in-cylinder pressure and other combustion parameters. This was predicted to be caused by the imperfect assumption of air/fuel homogenous mixing, combustion chamber wall temperature, reaction rates, uniform temperature and pressure, and fuel chemistry (level of detail of the applied chemical reaction mechanism) applied in modeling [6,9]. This led to increasing the inlet temperature by 30 K for modeling HCCI, as recommended by Yelvington et al. [13]. They proposed that using 333 K as the inlet temperature for the modeled case would reduce the deviation of the HRR phasing between the experimental and numerical modeling result data. To this end, a baseline model with a suitable multi-component mechanism is validated over the experimental data available in the previously mentioned study by Guo et al. [9]. The validated model is further extended with H2 and NH3 injectors and benchmarked for combustion and emission performance over a wide range of operating conditions.
2. Materials and Methods
2.1. Setting up HCCI Engine Model, Including Engine Specifications, Geometry, and Boundary Conditions
In this study, a zero-dimensional (0D) single-zone model for a 1-cylinder HCCI engine was developed using GT-Suite v2024 (Gamma Technologies, Westmont, IL, USA), based on a template configured for n-heptane fueling [14]. This baseline model was parametrized by adapting engine specifications from the single-cylinder HCCI engine experiment conducted by Guo et al. [9]. Table 1 presents the HCCI engine model (both baseline and present study) specifications, geometry, and other initial conditions. For this study, a dual-fuel 1-cylinder HCCI engine was modeled. NH3 and H2 were the target fuels. The InjRateConn injector type was used to introduce the H2 fuel into the engine model for the present study. The engine model specification included standard SI injection timing and valve timing. The combustion object used in the engine cylinder is the EngCylCombHCCI. The EngCylChemGas object was used to define both the gaseous reaction mechanism and the thermodynamic fluid properties from external files. This automatically created all necessary FluidNASA-LiqGas fluid species reference objects needed for the chemical reaction mechanism. Details on selected chemical reaction mechanism development and validation are included in Section 2.2. Combustion was assumed to be truly homogeneous.

Table 1.
HCCI engine model specifications, geometry, and operating conditions.
The cylinder initial state object was defined by object value “Init-FA”, which was used to impose boundary conditions such as absolute pressure, fluid temperature and composition at the start of the simulation. Values for both absolute pressure and temperature are listed in Table 1. The initial fluid composition is defined with the object value “FA-Mixture”, which comprises the fluid object “air”, “NH3” and “H2” with specified mass fractions of 0.95, 0.04 and 0.01, respectively. For the n-heptane-fueled HCCI model, the object value “FA-Mixture” comprises the fluid object “air” and “NC7H16” with specified mass fractions of 0.95 and 0.05, respectively. Exhaust gas recirculation (EGR) intake fraction is set to 0.2. Cylinder wall temperature is defined by the object value “TWall”, which defines the head and piston temperature as 575 K and the cylinder temperature as 400 K. This represented the temperature of the wall surface directly in contact with the fluid. The heat transfer properties in the cylinder are defined by the object value “Woschni”. This presented the heat transfer model as WoshniGT, overall convection multiplier as 1, head/bore area ratio as 1.3, piston/bore area ratio as 1.03, and convection temperature evaluation as hybrid, and enabled the low-speed heat transfer enhancement for the heat transfer model. The start of the cycle involved the intake valve closing at −144 °CA and the exhaust valve closing at 140 °CA, replicating the experimental valve timing from Guo et al. [9].
2.2. Chemical Kinetics Mechanism Selection
A reduced chemical kinetic mechanism developed by Patel et al. [15] was used for the baseline model simulation. The reduced mechanism was generated starting from an existing n-heptane mechanism containing 165 reactions and 40 species. The reduced mechanism was generated using SENKIN to produce ignition delay and solution files and XSENKPLOT to analyze the reduced reaction mechanism. The newly formulated and reduced reaction mechanism was then used to generate new ignition delay data. Finally, kinetic constants in the new mechanisms were adjusted to improve ignition delay and engine combustion to account for diesel fuel cetane number and composition. The newly reduced mechanism consisted of 29 species and 52 reactions and was validated under constant-volume engine conditions. In comparison with a comprehensive mechanism (having 179 species and 1642 reactions), the new reduced mechanism gives similar predictions. Reduced chemical reaction mechanisms were often used to enhance the computational efficiency of engine simulations [15]. Researchers have successfully applied the reduced mechanism developed by Patel et al. in HCCI concepts. Jia et al. [16] implemented an improved phenomenological soot model coupled with the reduced n-heptane chemical mechanism developed by Patel et al. into KIVA-3V code to describe soot formation and the oxidation process in an n-heptane HCCI combustion. The model was validated both experimentally and computationally. The results demonstrated satisfactory accuracy on all the studied parameters [16].
For the NH3/H2-fueled HCCI model, a detailed chemical kinetic mechanism and thermodynamics data file developed by Stagni et al. [8] for low-temperature combustion was used for model simulation. Stagni et al. investigated the oxidation of NH3/H2 blends under low- and intermediate-temperature conditions using experimental methods in a flow reactor at near-atmospheric pressure of 126.7 kPa and using stoichiometric conditions. They also developed a comprehensive kinetic model to interpret the experimental results. Fuel conversion and autoignition at low temperature were confirmed for the fuel blend with a reactivity boost provided by the addition of H2. The kinetic mechanism contained 203 reactions and 31 species. This included a comprehensive list of species involved in the NH3 reaction, including all radicals, intermediates and products. Table 2 presents both fuel type kinetic mechanisms to help understand model fidelity. NH3/H2 reaction mechanism has also been validated by Xu et al. [6]. The validation was carried out by comparing the results obtained from the mechanism with experimental data. The laminar flame speeds were calculated using CHEMKIN-PRO software with the developed mechanism. The calculated flame speeds were then compared with experimental results obtained by Han et al. [17]. The comparison of these results under different hydrogen content at room temperature and atmospheric pressure demonstrated that the chemical mechanism is reasonable for stimulating the overall combustion rate of NH3/H2/air mixtures in HCCI concepts.
Table 2.
Chemical reaction mechanism selection based on target fuel and desired level of detail.
2.3. Governing Equations for Numerical Solution
A coupled system of equations is solved over the crank angle (), covering the thermodynamic state variables. The engine modeling utilizes the geometry of a reciprocating engine to calculate the engine volume over the complete combustion cycle. The instantaneous cylinder volume at any crank angle () is given in Equation (1) as
where (clearance volume) is the ratio of total cylinder volume before the top dead center (BDC), is the compression ratio, and is the connecting rod length to crank radius [18]. Work performed by the piston is then calculated as given in Equation (2):
with being the cranckshaft angular velocity (). The energy balance is governed by the first law of thermodynamics as given in Equation (3):
where is the internal energy of the system, is constant mass for a constant volume of working fluid, is the specific heat at a constant volume, is the heat transfer rate into the system, is the crank angle, and is the work performed by the system on the piston. The rate of change in in-cylinder temperature is presented in Equation (4) as
and the rate of change in in-cylinder pressure is shown in Equation (5), where ϒ is the specific heat ratio [19]:
Combustion heat release in 0D single-zone combustion is modeled as presented in Equation (6):
where is combustion efficiency, LHV is the lower heating value of the fuel, is the fuel mass, is the burned mass fraction modeled using the Wiebe function, and is the heat lost to combustion chamber walls [19]. The Wiebe function describes the mass fraction burned during combustion and is used to describe the progression of combustion in the crank angle as presented in Equation (7), where a and m are empirical constants, is the start of combustion and is the combustion duration.
The Woshni heat transfer model provides the heat rate between the cylinder gases and the walls as described in Equation (8):
where is the heat transfer coefficient, is the instanteneous surface area of the cylinder, is the in-cylinder gas temperature, is the wall temperature, are the cylinder bore and pressure, respectively, and is the in-cylinder mean gas velocity [20]. Starting with known initial conditions of pressure, temperature, , engine geometry, wall temperature and crankshaft speed, Equation (3) is solved to update the temperature over the crank angle T(. The heat transfer rate () is calculated iteratively using Equation (8), and pressure over the crank angle P( is also calculated iteratively using the ideal gas law. Finally, the engine performance is quantified by the IMEP in Equation (9):
2.4. Baseline Model Validation
To validate the applicability of the baseline model, the operating conditions used for the HCCI engine experiment by Guo et al. [9] were used in the GT-power simulation. The experiment was conducted in a single-cylinder co-operative fuel research (CFR) engine modified and equipped with an air assist port fuel injector, similar to the single-cylinder HCCI baseline model in GT-power. Boundary conditions for the simulation were set per experimental reference, as follows: compression ratio (CR) as 10, intake temperature as 303 K, intake pressure as 95 kPa, air–fuel ratio (AFR) as 50 and engine speed as 900 rpm. The experiment was tailored towards capturing the n-heptane-fueled HCCI engine performance and combustion characteristics at individual parameter sweeps (engine speed and CR, particularly). Combustion parameters such as CA50 (crank angle at 50% heat release), IMEP, ISFC, and COVIMEP (coefficient of variation of indicated mean effective pressure) were monitored continuously in four tests to ensure accurate data collection and analysis.
An adjustment was made to the intake fluid mixture temperature by an increment of +30 to reproduce this HCCI engine model validation in GT-power, as proposed by Yelvington et al. [13]. The correction was applied to all operating conditions. On this basis, the model replicated the effect of CR and engine speed on the combustion phasing (CA50). The in-cylinder peak pressure and the CA50 measured data from the model were also validated against the experimental data from (Guo et al., 2006) [9]. Results of the validation are presented in Section 3.1. This simulation study only considered the results obtained from combustion between IVC and EVO.
2.5. Scope of the Research
A second injector was added for delivering H2 fuel to the engine model, post baseline model validation. Simulations were run to investigate the effect of fuel blending ratio (BR), air-to-fuel equivalence ratio ER (λ), CR, and engine speed on the performance, emission and combustion characteristics of an NH3/H2-fueled HCCI engine in comparison with a heptane-fueled HCCI engine model. The selected range of engine operating conditions for the parametric sweep was as presented in the baseline experimental study. Total fuel energy (TFE) introduced into the new model was kept constant at 67.6 MJ, equating the amount of fuel energy introduced for the baseline model, to enable effective comparison of their results. Table 3 presents the BR on energy basis (%) for NH3/H2 from pure NH3 (NH3/100) to a 50% NH3–H2 blend (NH3/50), as a function of their mass flow rate (MFR) and lower heating value (LHV).
Table 3.
Blending ratio (BR) for NH3/H2-fueled 1-cylinder HCCI engines. (* LHV_H2 = 120 MJ/g, * LHV_NH3 = 18.8 MJ/g). * Data from Lhuillier et al. [21].
Based on the initial sweeps, the range of operating conditions was refined for further optimization. A parametric sweep study was performed, choosing an appropriate range and step size for each parameter. The simulation matrix is presented in Table 4. The results on engine performance metrics and combustion phasing are observed as a function of the parametric sweeps. Optimal operating conditions that achieved the desired results were selected for iterative refinement. Optimization was realized by fine-tuning the operating conditions to converge towards optimal engine performance, combustion phasing and emissions. A final round of optimization was performed by case sweeping λ from 1 to 1.4 in simulation test 5, as seen in Table 4. Air–fuel mixture is among the several causes that may contribute to cycle-to-cycle variability (CCV) [22]. The air–fuel ER parametric sweep was used in the final optimization to achieve optimum solutions. This variability impacts combustion timing, maximum pressure and HRR. CCV analysis was performed by creating a scatter plot of CA02/CA50 for all cycles, at a selected engine operational point. Results of CCV are presented in Section 3.3. To run the above case setup, simulation time control was set to periodic, simulation duration was also set to 6 cycles, and in the initialization tab, the previous case was set to help the simulation converge faster. HCCI model simulation was initialized and then redirected to the simulation software’s postprocessing interface for analyzing result data. Five sets of simulation tests were carried out, with tests 1 to 4 as main simulations and test 5 as a rerun optimization.
Table 4.
Simulation matrix for NH3/H2-fueled HCCI engine. Intake conditions: 333 K, 1 bar.
3. Results
3.1. Baseline Model Validation Results
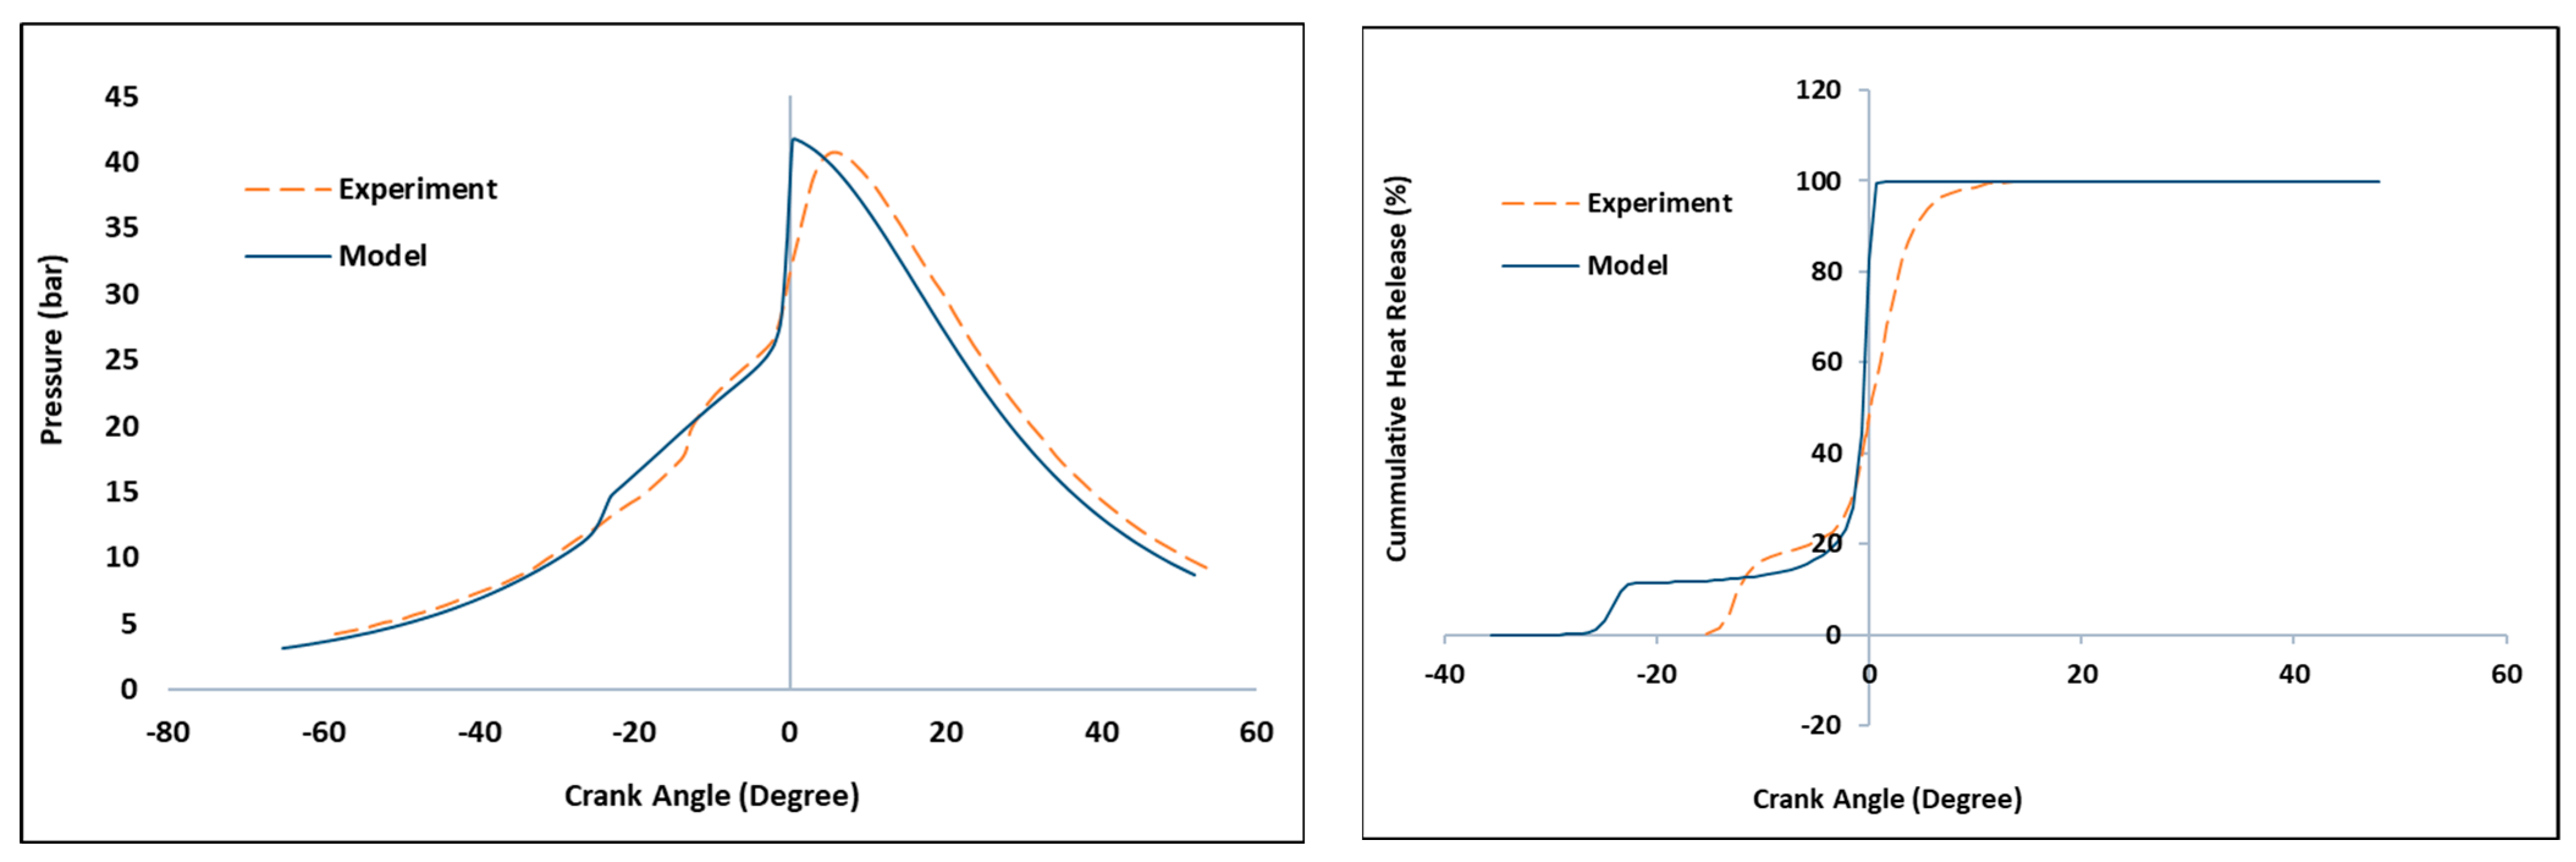
According to Figure 1, the 0D single-zone kinetic model was able to reproduce the experiment results discussed in Section 2.3, better while using the proposed simulation temperature of 333 K. The model was able to capture the combustion phasing in line with the experimental reference, while keeping the same combustion efficiency. CA50 predictions closely matched the experiment at zero degrees after top dead center (ATDC). In-cylinder maximum pressure was adequately reproduced, showing that simulated model reaction pathways were well represented. A difference of 0.5 bar may be associated with random errors from the experiments. Low-temperature reaction (LTR) is predicted to occur earlier in the simulation than in the experiment. Likewise, there was an observable sharp rise in the HRR at CA50 from the simulated model compared to the experiment. Both over-estimations result primarily from neglect of thermal stratification in the 0D, single-volume approach. Multizone models are typically able to capture the stratification much better as the kinetic solution progresses more slowly in the colder zones near the cylinder boundary [23]. The difference is also associated with inaccuracies in determining the boundary conditions on the engine airpath [11] and shortcomings of the incorporated mechanism itself [24]. The mechanism used in this baseline study was generic. However, the reduced mechanism by Patel et al. was validated on a reference CFR engine, and AFR is widely incorporated in various HCCI studies using N-heptane as a surrogate [15].
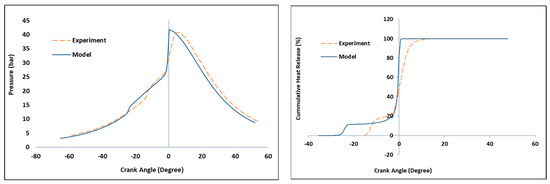
Figure 1.
Comparison of the simulated model against the experimental data: (left) in-cylinder pressure; (right) cumulative heat release. AFR = 50, CR = 10, intake pressure = 95 kPa, intake temperature =333 K.
HCCI is very sensitive to IVC conditions, including residual gas temperature and composition, exact fuel make-up (including impurities) and secondary effects on the thermal in-cylinder stratification. Neither of these parameters were directly available for the baseline engine used in this study, and the model calculated the IVC conditions starting from simplified data on the port geometry and valve timing information. The scope of the research did not deem it fit to re-tune the mechanism for this particular experiment (commonly performed by studies that show exact HRR match), as this brings a bigger risk of over-constraining the predictive features of the model. The approach is considered proper, considering the main goal of the study—assessing the functionality of the used kinetic solver in fast engine simulations. As such, the only tuning parameter was the cylinder area averaged wall temperature, which was not explicitly known from the experiments and used to target the reference CA50. Considering the fidelity of the approach, the resulting performance parameter estimation (main use case of 0/1-D engine models) is more than satisfying, as Pmax, IMEP720 and indicated efficiency are well-predicted.
CA10 and CA90, on the other hand, are very difficult to predict for HCCI in a computationally efficient 0-D combustion model. This is related to the fact that spatial temperature inhomogeneity is not captured [23]. The model captures the correct trends in this respect, confirming predictivity. CA10 in HCCI is determined mainly by the pre-ignition reactions that do not contribute significantly to the performance and emission formation. The efficiency in HCCI is shaped predominantly by the correct combustion onset (CA50) and the amount of energy released due to incomplete combustion. Both of these parameters are captured correctly considering the cumulative heat release (CHR) plots in Figure 1. As such, we consider this model suitable for computationally efficient pre-design, pre-optimization or control design studies, which are further substantiated by the main body of the result discussion. Table 5 also presents a comparison of baseline experiment versus simulation results of the CA10, CA50 and cylinder maximum pressure.
Table 5.
Comparison of baseline HCCI engine combustion experiment results (Guo et al., 2006) [9] versus GT-power model simulation (present study).
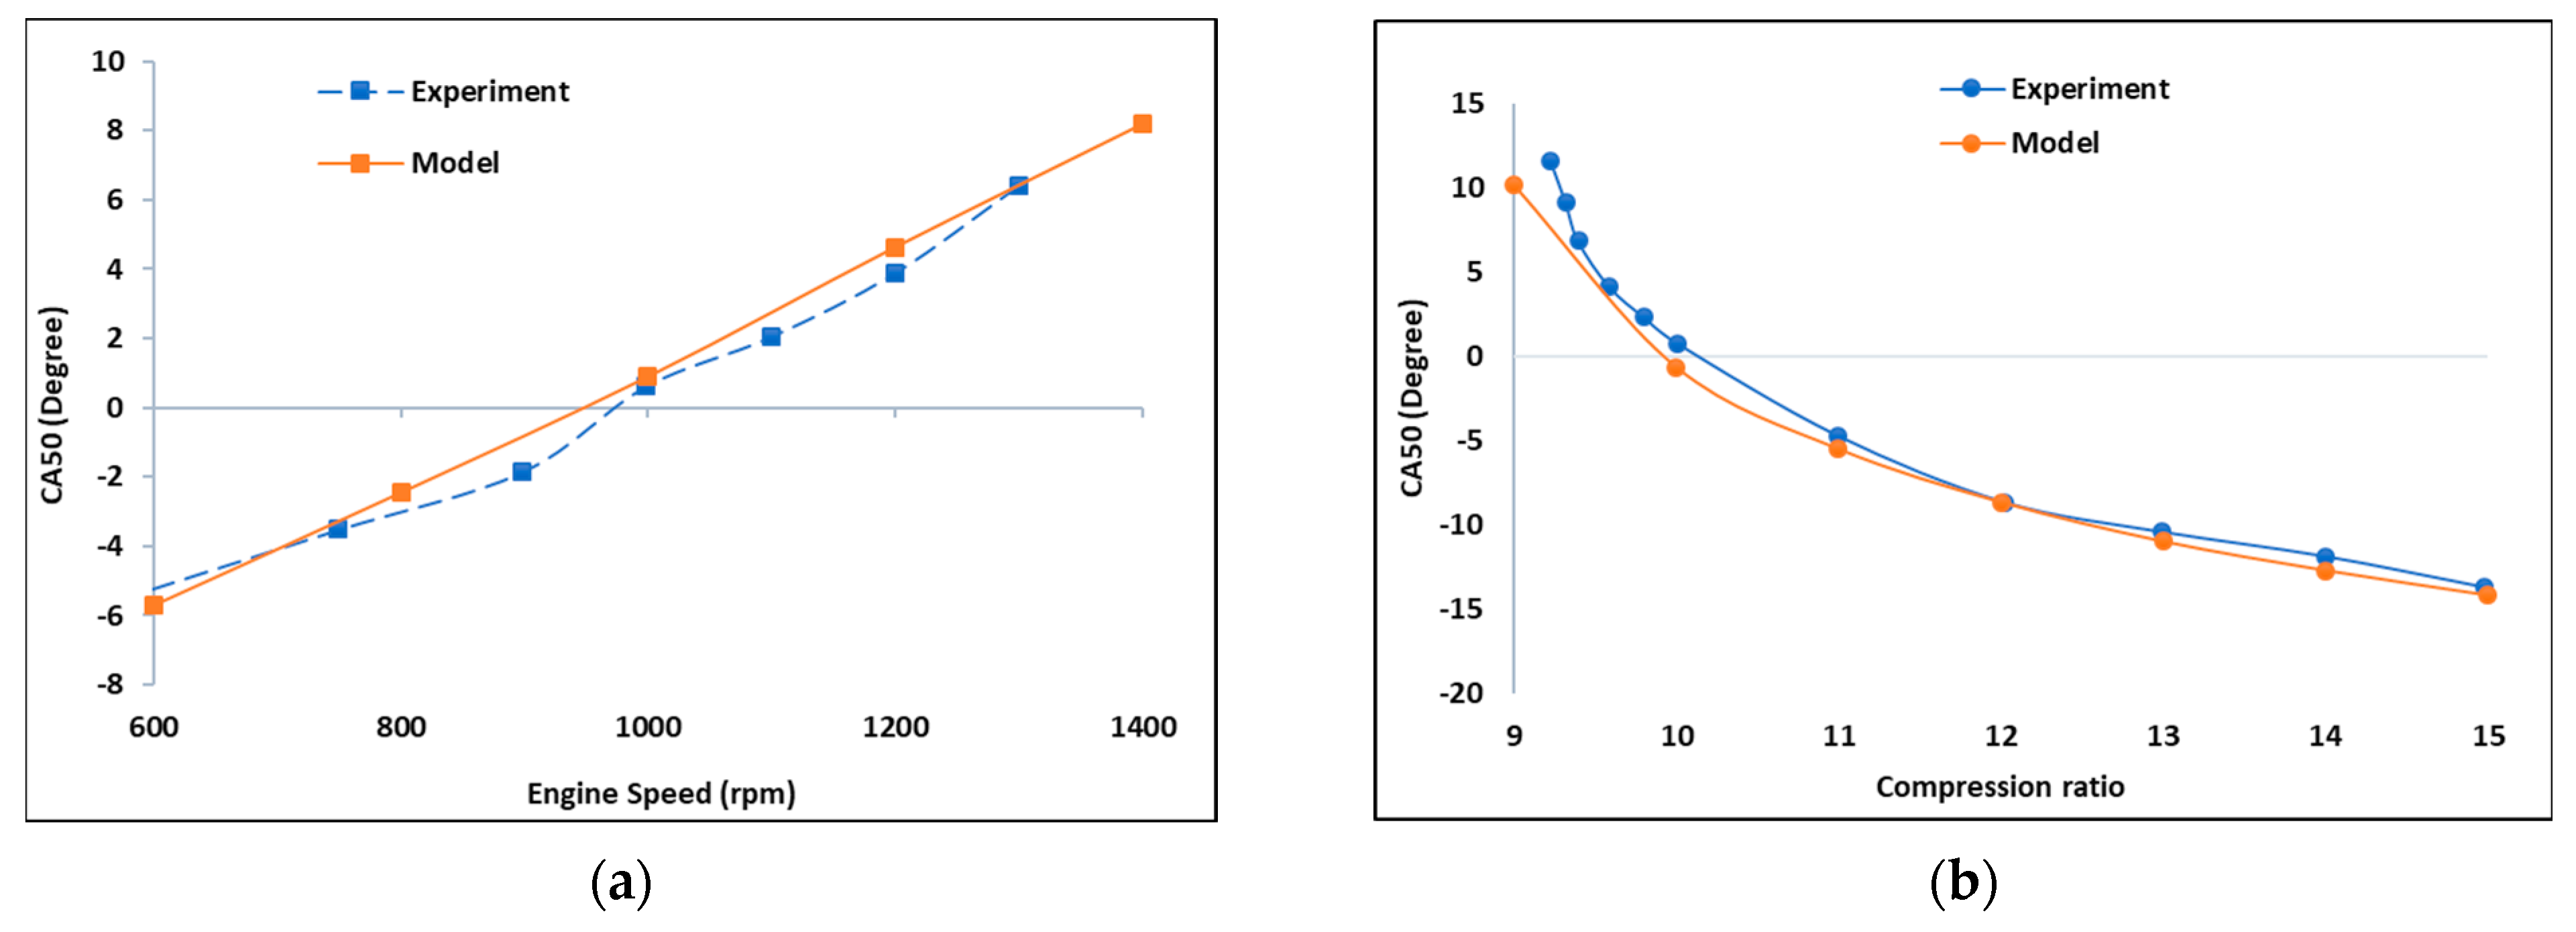
Furthermore, the model captured the effect of varying engine speed on CA50, similarly to the experimental data, as seen in Figure 2. Simulated engine speed varied from 600 rpm to 1500 rpm and 333 K. Resulting data points from the simulated model were almost linear, while those of the experiments showed some deviations, even though the trends in both were coherent. CA50 was observed to increase as the engine speed increased, which is understandable as the kinetic timescale of the combustion commences under faster resolving in-cylinder volume. At 900 rpm, CA50 was at zero-degree CA, ATDC. Effect of varying CR on CA50 is further shown in Figure 2. The observed decrease in CA50 with increased CR is attributed to shorter combustion duration since the kinetically controlled combustion process is faster in this condition [9]. Importantly, both the simulated and experimental trends were coherent. Individual resulting data points were almost corresponding for all cases, and trends were predicted. Simulation error in CA50 did not exceed 1.5 CA° for either of the operating points in Figure 2. Considering the above discussion, the predictivity of the modeling framework is considered validated in terms of HCCI phenomenology. Consequently, the model can be further used for extrapolating the combustion concept towards NH3/H2 fueling, under constraints of the validity of the kinetic mechanism involved.
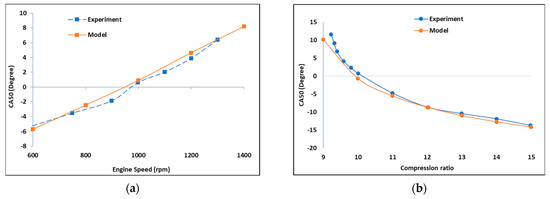
Figure 2.
Comparison of the simulated model against the experimental one: (a) CA50 against engine speed; (b) CA50 against compression ratio. AFR = 50, intake pressure = 95 kPa, intake temperature = 333 K.
3.2. Analyzing Combustion Parameters and Performance Metrics of NH3/H2-Fueled HCCI Engine
3.2.1. Effect of Varying Engine Speed on NH3/H2 Combustion
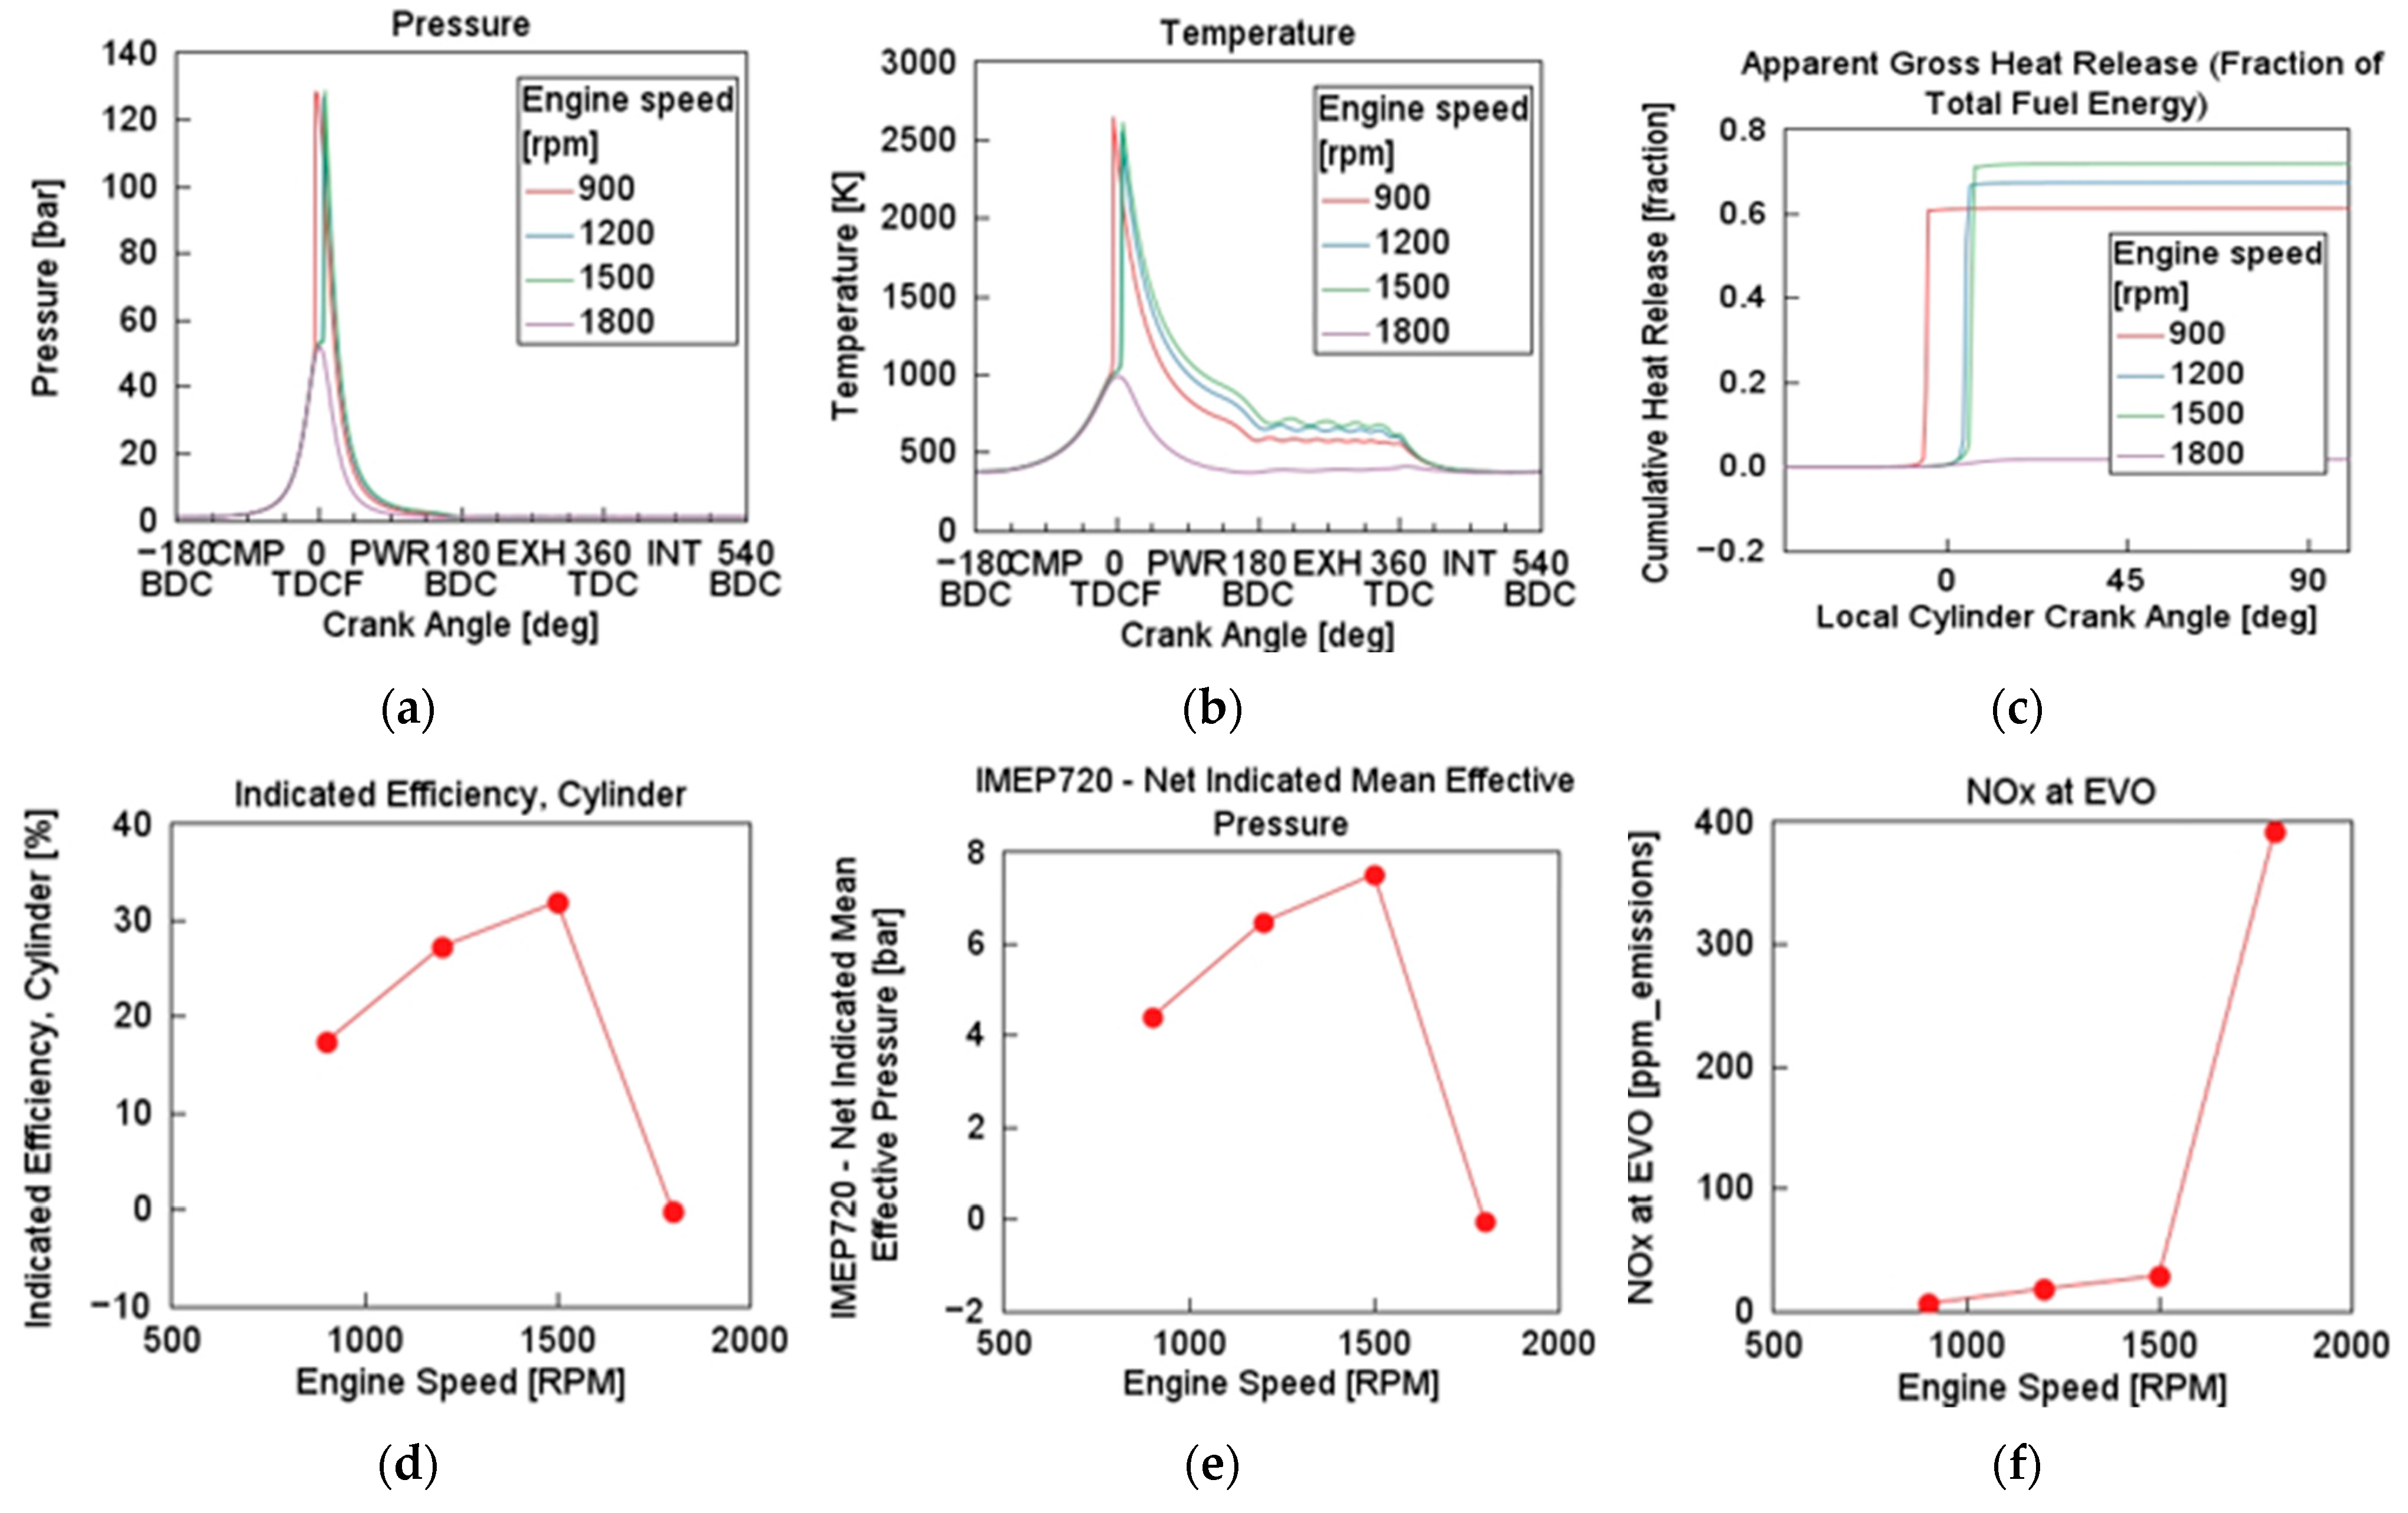
Simulation test 1 was carried out at inlet conditions of 333 K and 1 bar, and at a constant TFE of 67.6 MJ. As NH3 does not burn readily in its pure form, initial BR used for the simulation was NH3 (90%) (i.e., with 10% H2). For the initial test, CR was set to 20 and engine speed varied from 900 rpm to 1800 rpm. As illustrated in Figure 3, maximum in-cylinder pressure (Pmax) and maximum in-cylinder gas temperature (Tmax) increased with engine speed and then significantly decreased at the highest simulated engine speed (1800 rpm) indicating more rapid combustion between engine speeds of 1200 and 1500 rpm. Pmax and Tmax occurred shortly after TDC, indicating combustion phasing. Combustion was more intense with increases in engine speed but was shorter in duration. Faster heat release was observed between 1200 and 1500 rpm, which occurred at optimal crank angle, improving thermal efficiency. Net indicated mean effective pressure (IMEP720) also peaked at mid-range engine speeds, aligning with efficiency trends. However, NOx emissions at EVO increased significantly with engine speed, especially beyond 1500 rpm. The HCCI engine model performed more efficiently for NH3/H2 combustion at mid-range speeds (between 1200 and 1500 rpm).
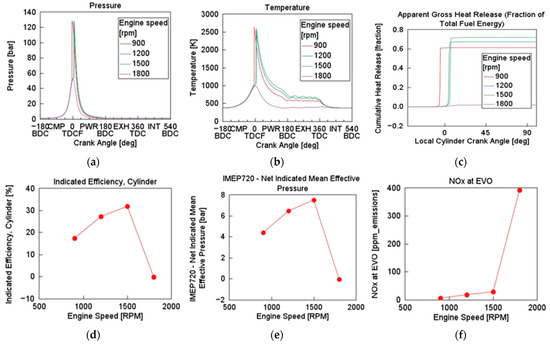
Figure 3.
Effect of varying engine speed on in-cylinder (a) pressure, (b) temperature, (c) cumulative heat release, (d) indicated efficiency, (e) IMEP720, and (f) NOx at EVO: λ = 1, BR = NH3 (90%), P = 1 bar, T = 333 K, CR = 20.
3.2.2. Effect of Varying Compression Ratio on NH3/H2 Combustion
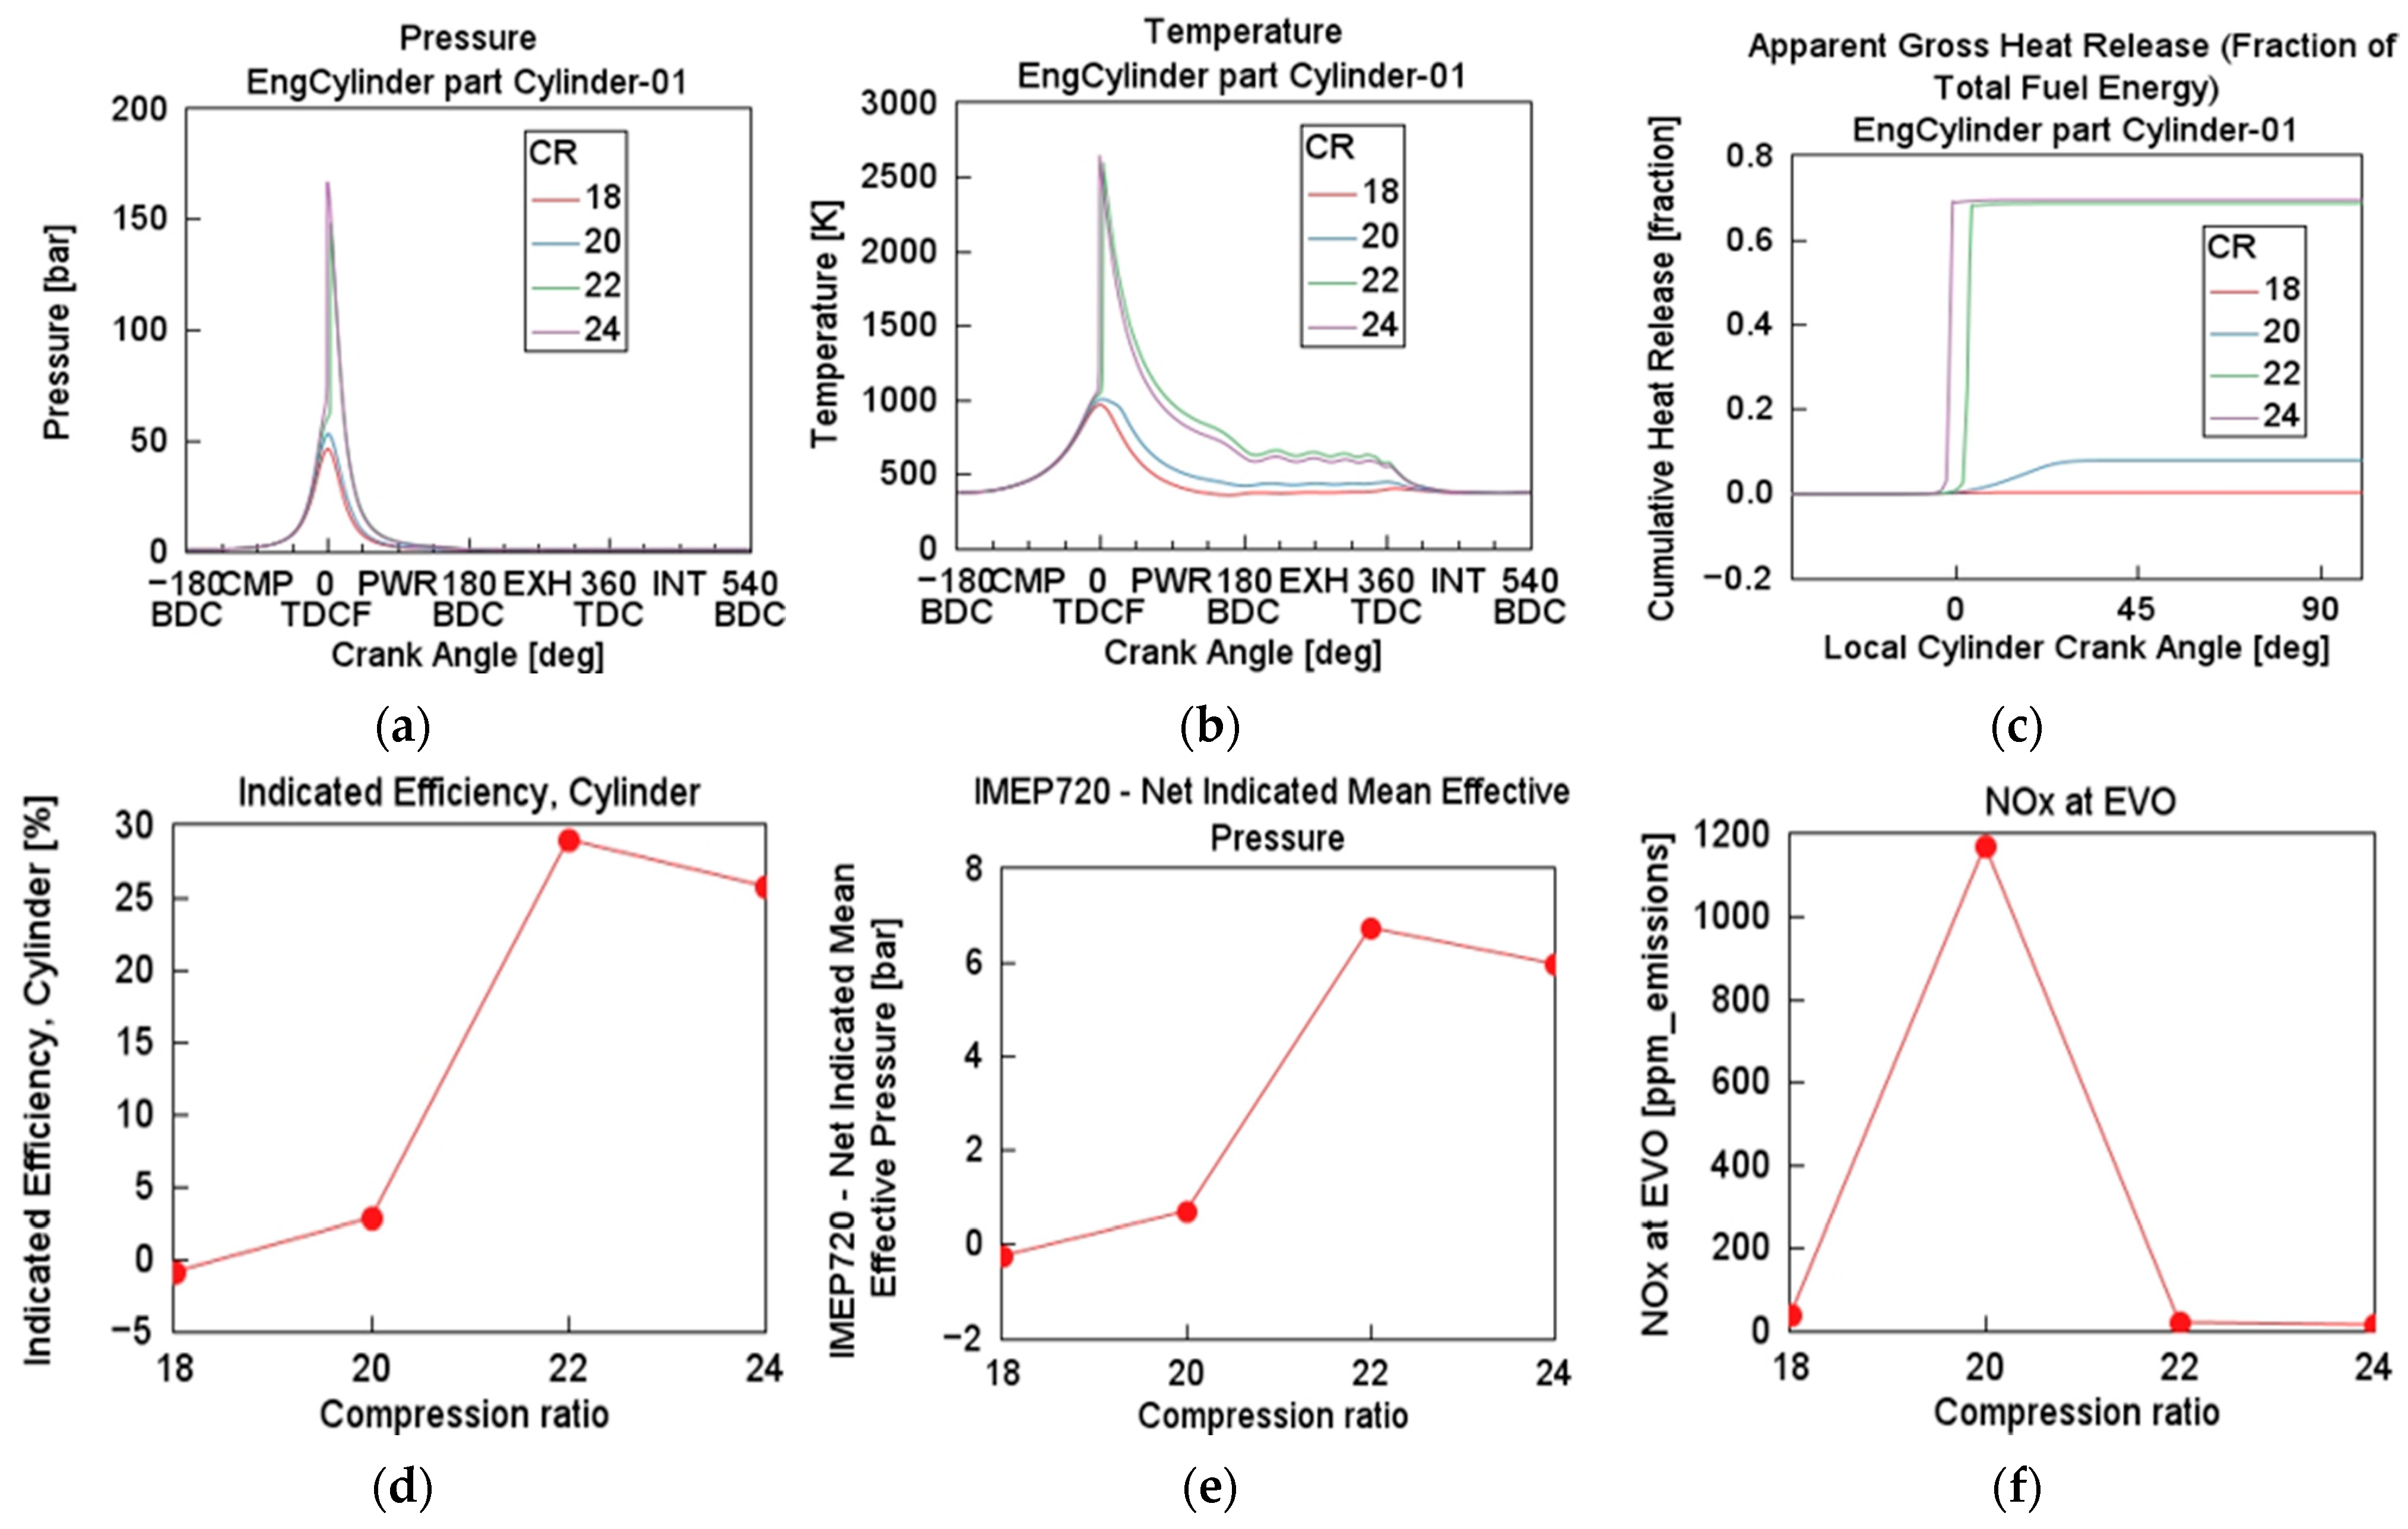
Simulation test 2 was executed with a CR case sweep range of 18 to 24 and incremental step of 2. BR was fixed at NH3 (90%), with λ of 1, engine speed of 1500 rpm, and inlet temperature and pressure of 333 K and 1 bar, respectively. This case sweep focuses on the influence of CR, a critical parameter governing combustion thermodynamics, efficiency, and emissions. As illustrated in Figure 4, Pmax rose notably with increasing CR. At CR = 24, Pmax reached about 180 bar, substantially higher than CR = 18 (almost 100 bar). Combustion became more rapid and intense as CR increased. Higher compression improves the thermodynamic efficiency and flame propagation speed, leading to quicker combustion [17]. Tmax also rose with CR, peaking near 2700 K at CR = 24. In-cylinder wall temperature trends mirror the pressure curves, reflecting adiabatic compression heating. Higher CR leads to better fuel–air autoignition and energy conversion [2]. However, elevated temperatures intensified NOx formation via the Zeldovich mechanism [25]. The CHR became steeper and reached a higher fraction at higher CRs, indicating that more fuel energy was being converted to work. IMEP720 followed the same trend, rising sharply until CR = 22, and slightly dropped thereafter. However, NOx emissions at EVO increased significantly at CR = 20 (about 1150 ppm) before slightly dropping at CR = 22. The non-linear trend suggests complex interactions between temperature, oxygen availability, and post-combustion quenching [25]. CR presents as a more dominant factor than engine speed in influencing combustion characteristics, thermodynamic efficiency, and emissions. Optimal CR lies around 20–22, balancing efficiency and emissions.
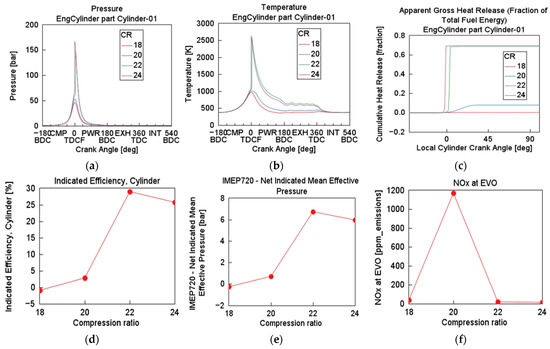
Figure 4.
Effect of varying compression ratio on cylinder (a) pressure, (b) temperature, (c) cumulative heat release, (d) indicated efficiency, (e) IMEP720, and (f) NOx at EVO: ER = 1, BR = NH3 (90%), P = 1 bar, T = 333 K, engine speed = 1500 rpm.
3.2.3. Effect of Varying Equivalence Ratio on NH3/H2 Combustion
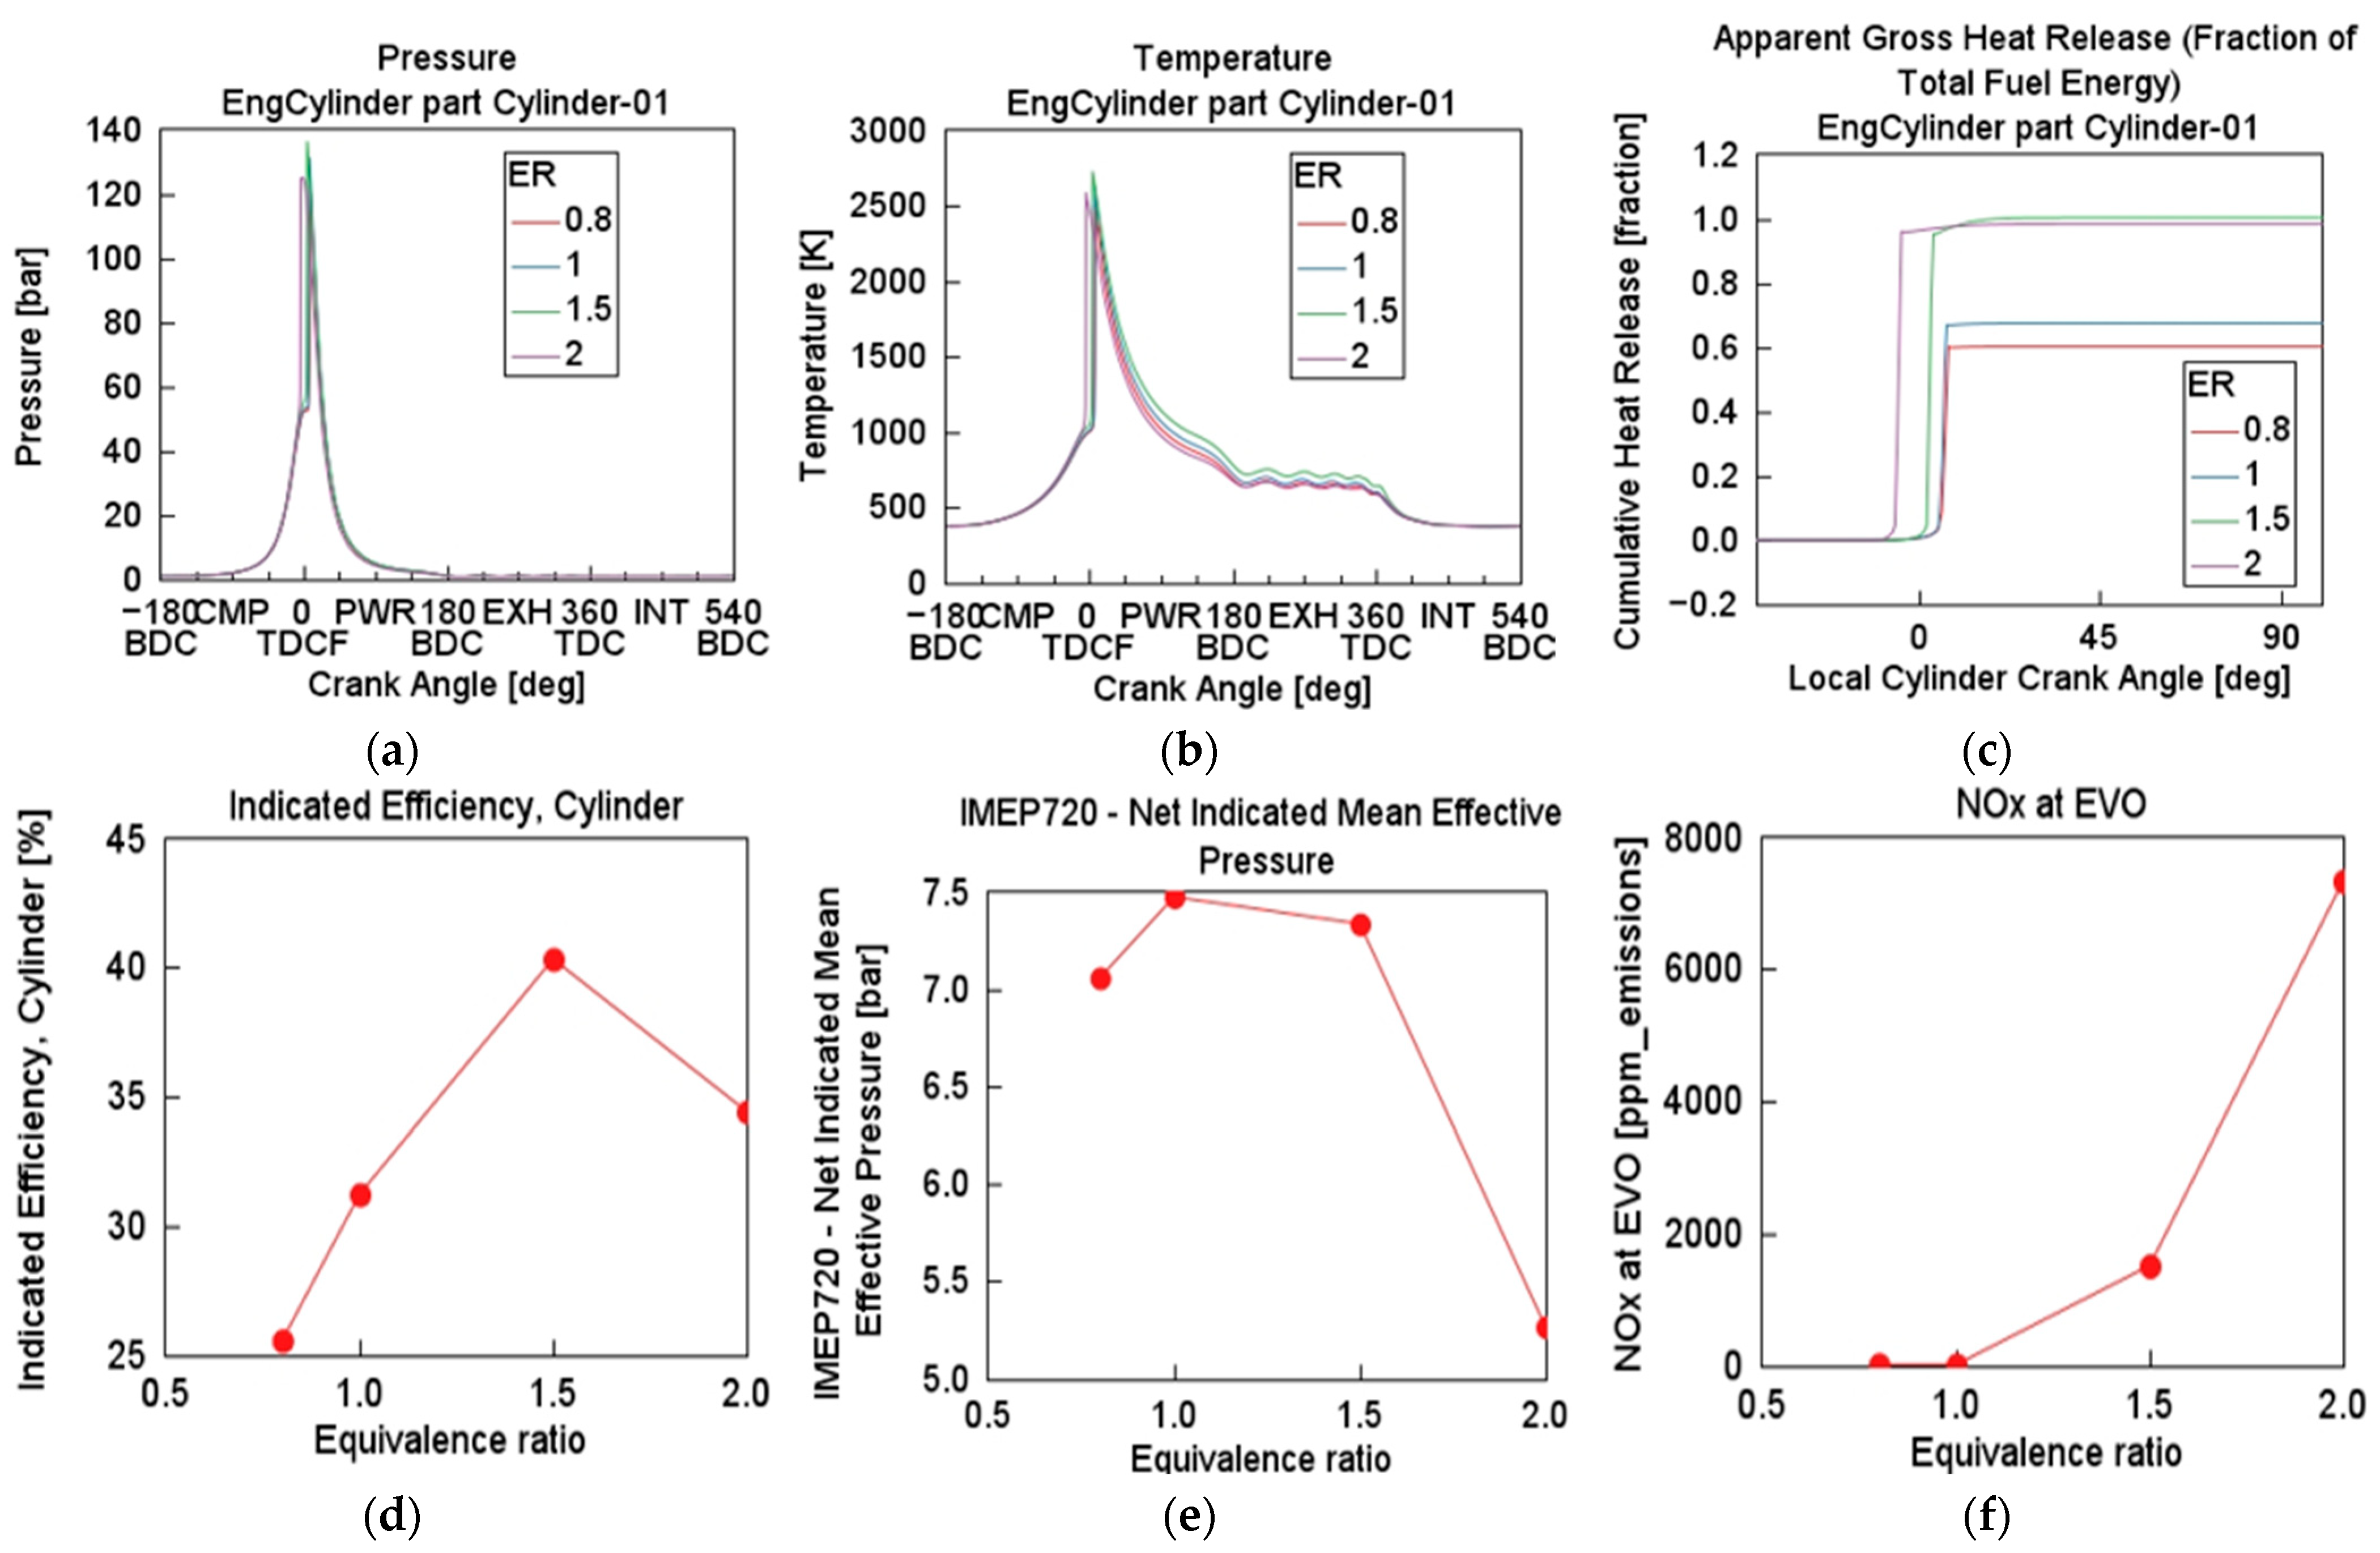
At fixed TFE of 67.6 MJ, CR of 20, engine speed of 1500 rpm, and inlet temperature and pressure of 333 K and 1 bar, respectively, the effect of varying ER on the HCCI combustion of NH3 (90%) was investigated. Air–fuel ER (lambda) was used to quantify the stoichiometry air–fuel ratio relative to the actual air-to-fuel ratio required to achieve complete combustion. From the fuel injector introducing NH3 into the engine model, the air–fuel equivalence ratio was defined as lambda (λ). This lambda was then varied as a parameter. Simulation test 3 was performed with air–fuel ER case sweep ranges of 0.8 (rich), 1.0 (stoichiometric), 1.5, and 2.0 (lean). This case sweep provides critical understanding into fuel–air mixture sensitivity, showing how combustion characteristics change with mixture richness. Illustrated in Figure 5, Pmax and Tmax increased sharply with increasing λ. At λ = 2.0, the engine exhibited much earlier combustion with peak pressure around 130 bar and temperature close to 2600 K. HRR is minimal at λ (0.8), suggesting a rich limit beyond which combustion fails or is incomplete. Rapid and complete heat release occurred early in the expansion stroke at λ (1.5–2.0), beneficial for efficiency but potentially harmful for engine durability. Efficiency peaked at λ = 1.5 (about 41%) then slightly dropped at λ = 2.0, indicating that overly lean operation may shift combustion away from ideal phasing. IMEP720 rose continuously up to λ (1.0–1.5) and then declined, suggesting reduced combustion effectiveness in overly lean conditions. An exponential increase in NOx level is observed for λ = 0.8 (<1000 ppm) to λ = 2.0 (7800 rpm), consistent with thermal NOx formation theory [25]. Air–fuel ER below stoichiometric levels risks misfire and incomplete combustion, while that above 1.5 should be avoided due to excessive NOx and thermal stresses [17,26]. Optimal λ lies between 1.0 and 1.5, balancing combustion completeness, efficiency and emissions.
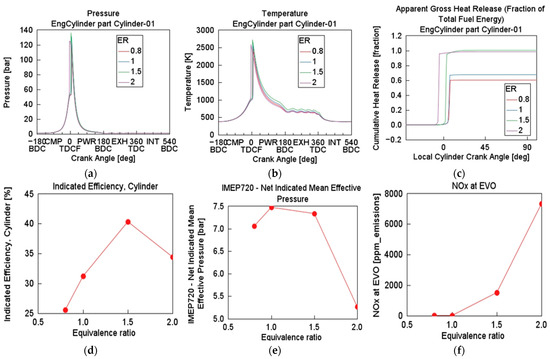
Figure 5.
Effect of varying equivalence ratio on cylinder (a) pressure, (b) temperature, (c) cumulative heat release, (d) indicated efficiency, (e) IMEP720, and (f) NOx at EVO: CR = 20, BR = NH3 (90%), P = 1 bar, T = 333 K, engine speed = 1500 rpm.
3.2.4. Effect of Varying Fuel Blending Ratio on NH3/H2 Combustion
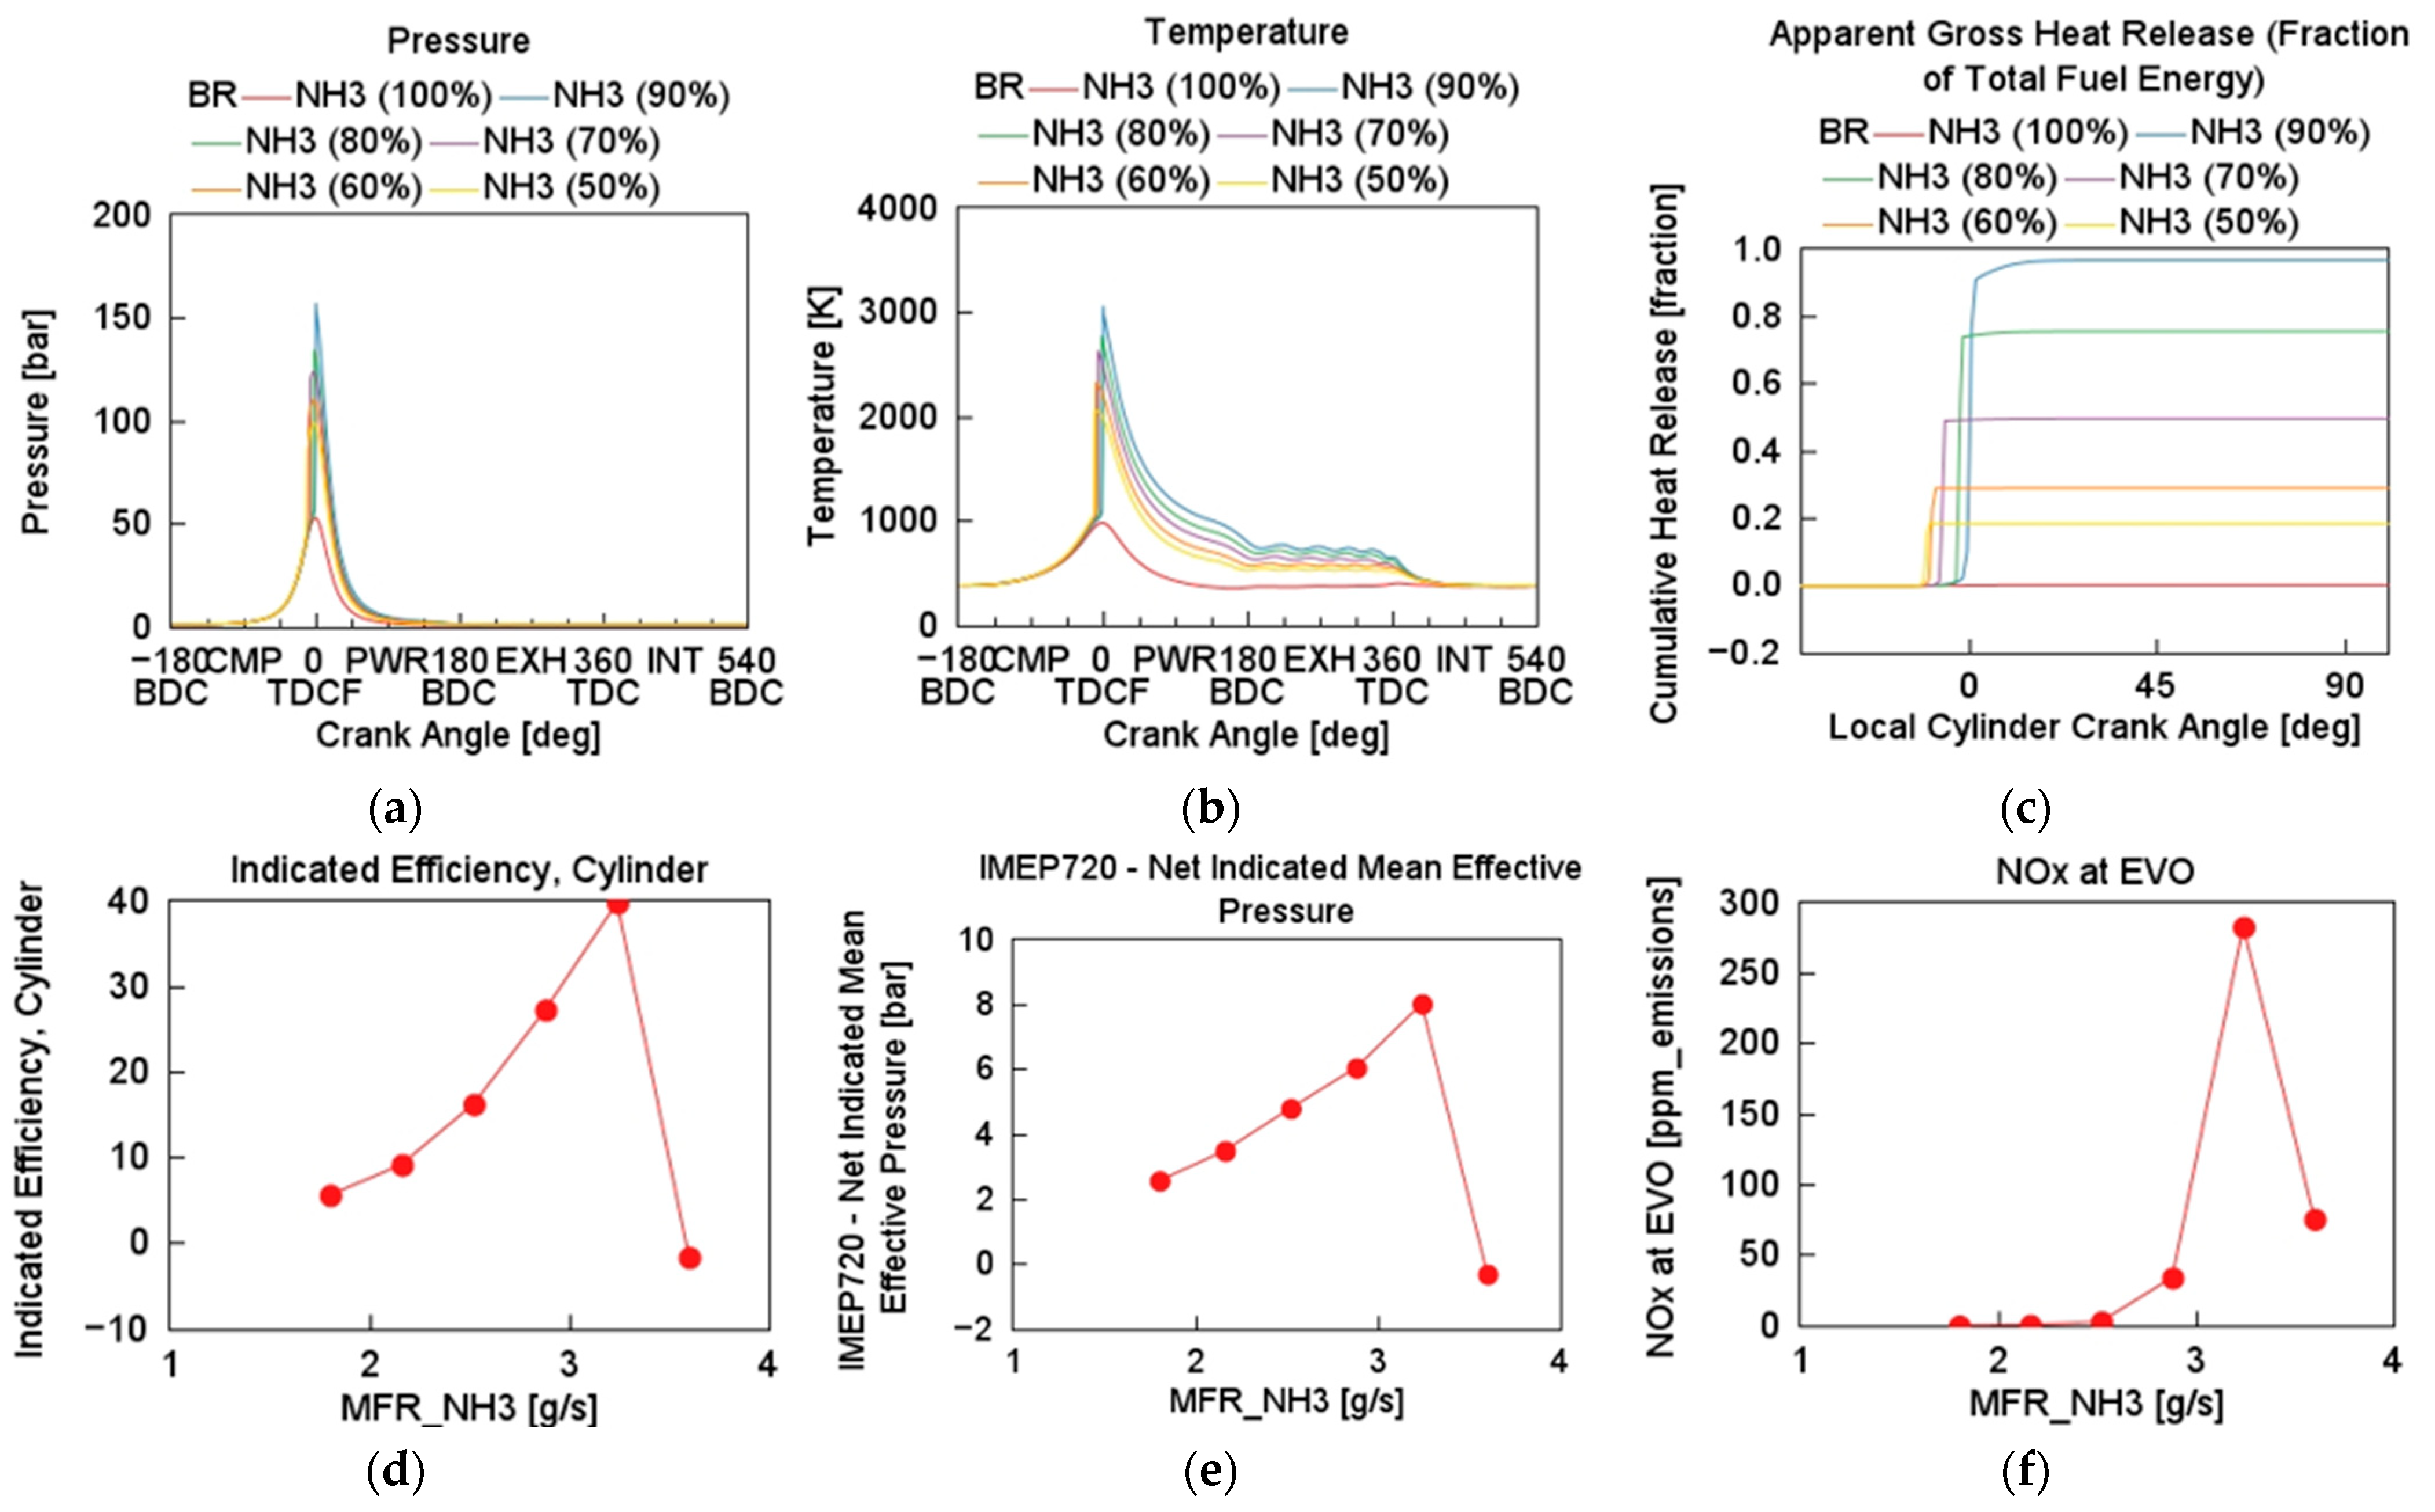
Figure 6 represents the effect of BR on the HCCI combustion and performance for fixed TFE of 67.6 MJ. For CR of 20, engine speed of 1500 rpm, λ of 1.5, and inlet temperature and pressure of 333 K and 1 bar, respectively, simulation tests were performed for NH3/H2 with BR of 100/0, 90/10, 80/20, 70/30, 60/40, and 50/50. Table 3 already presented the BRs from pure NH3 to NH3 (50%) in energy ratio (%), as a function of their MFR and LHV. Pure NH3 did not combust readily in the engine model as illustrated on the CHR in Figure 6. As the blend share of NH3 decreased from 90% to 50%, peak cylinder pressure decreased sharply. Combustion phasing advances towards TDC as H2 content increases, indicative of faster ignition due to hydrogen’s high flame speed and low ignition delay [27]. Tmax also shifts earlier and becomes more intense as H2 is added, exceeding 3000 K for 90% NH3 and 2000 K for 50% NH3. Pure NH3 showed slow and delayed CHR, indicating kinetic limitations and sluggish autoignition.
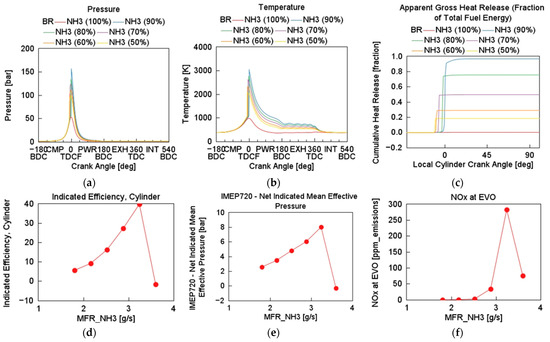
Figure 6.
Effect of varying NH3–H2 blend ratio on cylinder (a) pressure, (b) temperature, (c) cumulative heat release, (d) indicated efficiency, (e) IMEP720, and (f) NOx at EVO: CR = 20, ER = 1.5, P = 1 bar, T = 333 K, engine speed = 1500 rpm.
As the NH3 fraction increased, the heat release fraction rapidly approached one, demonstrating a more complete and phased combustion between 60 and 90% NH3 fraction. Indicated efficiency and IMEP720 decreased from 40 to 5%, and from 8 bar to 2.5 bar, respectively, as the hydrogen blend share increased from 10 to 50% H2 fraction. Despite NH3 being a nitrogen-based fuel, NOx emissions remain modest (<300 ppm) and decrease modestly (<50 ppm) with increasing H2 blend share.
3.2.5. Final Round Optimization on NH3/H2 Combustion HCCI Engine
A combination of operating conditions producing optimal engine performance and combustion phasing was used for the simulation of the final round of optimization. At fixed engine speed of 1500 rpm, CR of 20, TFE of 67.6 MJ, BR of NH3/H2 of 90/10, and inlet temperature and pressure of 333 K and 1 bar, respectively, λ was varied at 1, 1.2, and 1.4 to compare the combustion of the stoichiometry mixture and the slightly lean mixture. Table 6 shows that with an ER of value 1.2, engine performance metrics are better.
Table 6.
Engine performance and combustion metrics from final round of optimization. Engine speed = 1500 rpm, CR = 20, P = 1 bar, T = 333 K, BR = NH3 (90%).
As illustrated in Table 6, the influence of air–fuel ER on HCCI engine performance revealed a delicate balance between efficiency, combustion phasing and emissions. As λ increased from 1.0 to 1.4, Ieff improved significantly, reaching a peak of 39.1%, while IMEP720 plateaued near 7.4 bar. However, CA50 showed non-monotonic behavior by delaying at λ = 1.2 and recovering at λ = 1.4, affecting pressure development and thermal loading. Most notably, NOx emissions escalated exponentially with λ, rising from 39 ppm to almost 690 ppm, driven by in-cylinder elevated temperatures. Despite the carbon-neutral advantage of the fuel blend, the NOx emission level was however higher at a λ value of 1.4. This might be due to more oxygen radicals forming more bonds with the available nitrogen, as a result of the excess air–fuel ER value of 1 to 1.2 and to 1.4. The study observed a trend suggesting that operating conditions favoring higher thermal efficiency, such as high air–fuel ER, also led to elevated NOx emissions, thereby indicating a trade-off under the tested conditions. ER at 1.2 offers a better compromise between emissions and performance.
3.3. Cyclic Variability and Engine Comparability
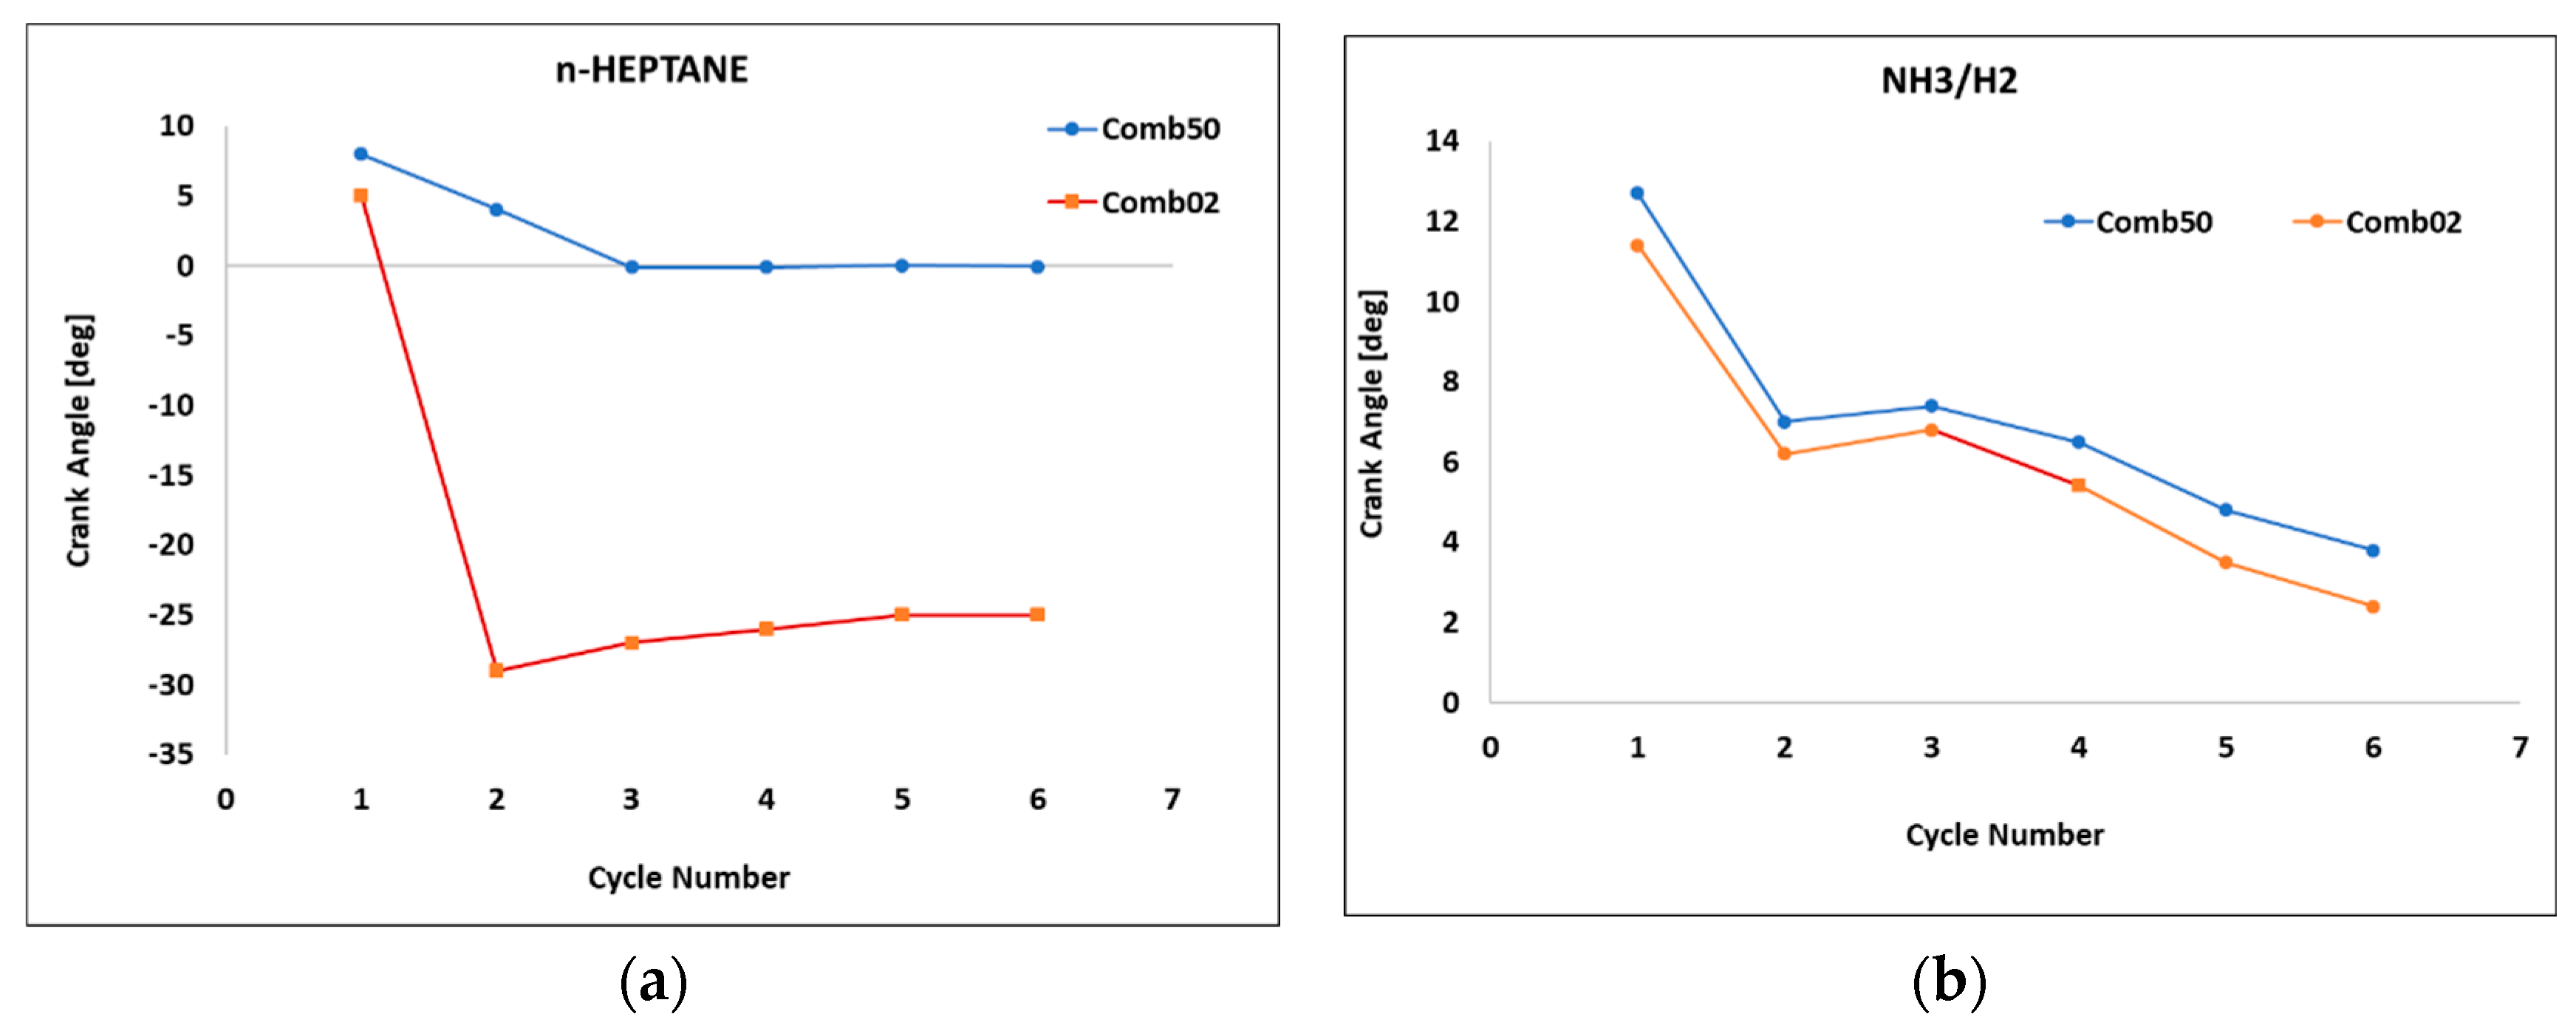
For ensuring the stability and reliability of the results, a cycle-to-cycle variability analysis was performed on the studied engine model at λ (1.4). The CA02 or Comb02 (crank angle at 2% total heat release) and CA50 were investigated against the cycle numbers, as illustrated in Figure 7. This was significant for understanding the combustion stability and assessing how efficiently the fuel combustion proceeded. In Figure 7a, the n-heptane plot shows significant CCV, especially in the early combustion phase (Comb02). The crank angle for Comb02 drops sharply from +5 to −29 CA°, with a large standard deviation of 12.91° and a range of 34°, indicating highly unstable ignition behavior. Combustion phasing CA50 (Comb50) is more stable, gradually declining from 8° to 0° with lower variability (standard deviation of 3.35°). This suggests that the baseline combustion suffers from irregular ignition timing in the initial combustion stage. However, CA50 was the more important parameter to be analyzed for optimal performance, efficiency and emissions. CA50 is observed to stabilize after the third cycle until convergence. In contrast, the NH3/H2 plots demonstrate more consistent combustion behavior. Both Comb02 and Comb50 showed smooth, gradually decreasing crank angles across cycles, with relatively low standard deviations (about 3.15°, slightly above the typical value) and narrow ranges (about 9°). This indicates good repeatability and controlled combustion phasing for both early and mid-stage combustion. However, six cycles are not statistically robust to draw strong conclusions on CCV, especially in HCCI combustion, where stochastic variations are significant. However, this study employed a six-cycle simulation horizon due to constraints in computational time and model convergence behavior, especially when using detailed chemical mechanisms. Previous work using 0D HCCI models with complex fuel chemistry has shown that combustion stability can still be inferred from early-cycle behavior, provided the model reaches convergence and no significant transience is observed beyond 3–4 cycles [9,15]. Post-transient convergence was also confirmed for all cases before data logging.
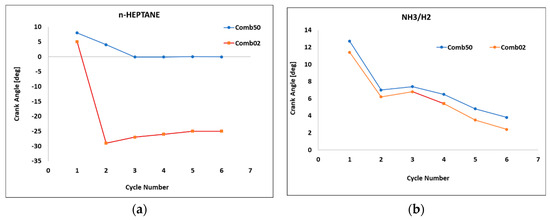
Figure 7.
Scatter plot for CA02/CA50 for all cycles in (a) n-heptane and (b) NH3/H2 engine models. Engine speed = 1500 rpm, CR = 20, P = 1 bar, T = 333 K, BR = NH3 (90%), ER = 1.4.
4. Discussion
4.1. Summary of the Simulation Results and Analysis of HCCI Combustion Behavior
This study investigated the effect of engine speed, NH3/H2 fuel BR, air–fuel ER, and CR on the engine performance metrics, combustion phasing and emission characteristics. Results reveled several consistent trends and mechanistic insights supported by existing literature. First, hydrogen enrichment significantly improved ammonia ignition. Pure NH3 failed to combust under the modeled conditions due to high autoignition temperature and low flame speed. However, as little as 10% H2 by energy share enabled stable combustion and shift combustion phasing earlier, due to H2’s low ignition energy and high diffusivity [27]. These findings are consistent with experimental results by Pochet et al. [2] and Akram et al. [5], who demonstrated similar enhancements in ignition behavior. Compression ratio had a substantial effect on both thermal efficiency and NOx emissions. Higher CR led to earlier CA50 and Pmax, consistent with improved adiabatic heating and kinetic rates. However, NOx emissions increased exponentially at CR of 20 or more due to elevated temperatures, consistent with Zeldovich NOx formation kinetics [25]. An optimal CR of 20–22 was identified, balancing ignition quality, pressure rise rate, and emissions. Air–fuel equivalence ratio was a dominant factor affecting thermal efficiency and NOx formation. Efficiency increased with λ up to about 1.5 due to improved combustion phasing and completeness. However, further increments caused efficiency to plateau and NOx to spike sharply, up to 7800 ppm at λ = 2.0. This behavior is attributed to increases in oxygen radical concentrations, facilitating thermal NOx pathways [28]. Meng et al. [28] noted similar behavior in pre-chamber ammonia combustion, linking high air–fuel ER to increased NOx via OH and HNO radicals. Thus, air–fuel ER = 1.2–1.4 was considered an optimal range for performance. Regarding fuel blending ratio, simulations confirmed that while higher H2 fractions improved ignition delay, they reduced the HRR intensity and overall work output due to H2’s lower energy density and shorter combustion duration [27,29]. Peak indicated efficiency and IMEP720 occurred near BR = 90/10, where H2 enhanced combustion without excessive dilution. Finally, cycle-to-cycle variability analysis showed that NH3/H2 fueling produced even lower variability in CA02 and CA50 compared to n-heptane. Despite the small six-cycle window, standard deviation remained low, indicating some level of combustion stability. While more cycles are desirable for full CCV characterization, these results are promising and consistent with those reported in controlled kinetic simulation [15].
4.2. Modeling Strengths and Limitations
The 0D single-zone GT-Suite model used in this study enabled fast simulations with detailed chemical kinetics, making it a suitable tool, as the solver also accurately captured CA50 and pressure trends validated against experimental data. However, some limitations must be acknowledged. The model assumes complete spatial homogeneity and thus cannot capture in-cylinder stratification effects or wall quenching dynamics. These phenomena are critical in real HCCI operation, especially for predicting early heat release (CA10) or late burn duration (CA90) [23]. Twall inputs were calibrated rather than measured, limiting absolute HRR fidelity. Future work should include spatially resolved thermal boundary conditions or use multizone frameworks like UVATZ [11]. The short simulation horizon (six cycles) limits the statistical rigor of the CCV analysis, although convergence was verified. High-fidelity operation should aim for >40 cycles for robust variability insights [22]. Despite these constraints, the trends predicted here are consistent with both experimental and theoretical findings in the literature, affirming the predictive capability of the kinetic solver for early-stage concept evaluation.
5. Conclusions
This study explored the combustion performance and emission behavior of NH3/H2 blends in an HCCI engine using a detailed 0D single-zone simulation model implemented in GT-Suite. A validated chemical kinetics mechanism was applied to systematically assess the influence of BR, air–fuel ER, CR, and engine speed on thermal efficiency, NOx emissions, and combustion stability. The study allowed us to draw the following conclusions:
- As little as 10 w/w% of H2 in the fuel blend improved the autoignition properties of NH3, although higher hydrogen fractions reduced cumulative heat release due to faster combustion and dilution effects.
- Engine speed significantly impacts combustion phasing and engine efficiency. The study identified 1500 rpm as the optimal speed for the modeled NH3/H2-fueled HCCI engine, proving stable combustion and improved thermal efficiency.
- CR between 20 and 22 was found to be optimal for NH3/H2-fueled engines, balancing combustion efficiency and mechanical reliability. Lower CR values resulted in incomplete combustion, while higher CR values caused excessive peaks in pressure.
- Air–fuel ER significantly influenced engine behavior. While efficiency improved with ER up to 1.4, NOx emissions increased exponentially beyond this limit. Leaner mixtures (air–fuel ER between 1.2 and 1.4) provided the best compromise between efficiency and emissions.
- Cycle-to-cycle variability testing proved that the NH3/H2 engine model achieved combustion stability after few cycles, even though more cycles are needed for full statistical robustness of the simulation approach under varying operating conditions.
Despite the limitations of the single-zone model, especially the absence of spatial stratification and real-time temperature gradients, the results demonstrated strong alignment with the experimental and theoretical literature, validating the use of detailed chemical kinetics in engine concept modeling. Future work should include implementing multizone or 3D CFD models. Likewise, experimental validation for this model will be conducted for ammonia combustion with hydrogen blends using the rapid compression and expansion machine (RCEM) to further investigated the proposed model and operating parameters in engine-like conditions. The experiment will validate the simulations for further applicability in the design of ammonia–hydrogen-fueled HCCI practical solutions.
Author Contributions
Conceptualization, F.B.; Methodology, F.B. and A.V.; Software, F.B. and M.M.; Formal analysis, F.B.; Investigation, A.V. and A.K.; Resources, M.M.; Data curation, F.B.; Writing—original draft, F.B.; Writing—review and editing, A.V., A.K., K.S. and M.M.; Supervision, K.S. and M.M. All authors have read and agreed to the published version of the manuscript.
Funding
This research received no external funding.
Data Availability Statement
The original contributions presented in this study are included in the article. Further inquiries can be directed to the corresponding author.
Acknowledgments
This article is a revised and expanded version of a paper entitled “Investigating HCCI engine operating parameters under simultaneous dual fueling of ammonia and hydrogen based on detailed chemical kinetics modeling”, which was presented at the THIESEL 2024 Conference on Thermo- and Fluid Dynamics of Clean Propulsion Powerplants, Spain, 2 September 2024 [30].
Conflicts of Interest
The author reports a relationship with the University of Vaasa that includes employment. The authors declare that they have no known competing financial interests or personal relationships that could have appeared to influence the work reported in this paper.
Abbreviations
The following abbreviations are used in this article:
| NH3 | Ammonia |
| H2 | Hydrogen |
| λ | Lambda |
| CA90 | Crank angle at 90% heat release |
| CA50/Comb50 | Crank angle at 50% heat release |
| CA10 | Crank angle at 10% heat release |
| CA02/Comb02 | Crank angle at 2% heat release |
| IVC | Intake Valve Closing |
| EVO | Exhaust Valve Closing |
| CR | Compression Ratio |
| ER | Equivalence Ratio (air–fuel) |
| IMEP720 | Indicated Mean Effective Pressure AT 720 °CA |
| Tmax | Maximum in-cylinder temperature |
| Pmax | Maximum in-cylinder pressure |
| NOx | Nitrogen oxides |
| Ieff | Indicated efficiency |
| ISFC | Indicated Specific Fuel Consumption |
| CHR | Cumulative Heat Release |
| EGR | Exhaust Gas Recirculation |
| TFE | Total Fuel Energy |
| LHV | Lower Heating Value |
| AFR | Air–Fuel Ratio |
| BR | Blending Ratio |
| HRR | Heat Release Rate |
| CFD | Computational Fluid Dynamics |
| HCCI | Homogeneous Charge Compression Ignition |
| TDC | Top Dead Center |
| MFR | Mass Flow Rate |
| RCEM | Rapid Compression and Expansion Machine |
| GT-Suite | Gamma Technologies Simulation Software Suite |
| 0D, 1D, 3D | Zero-dimensional, One-Dimensional, Three-Dimensional |
| DNS | Direct Numerical Simulation |
| COVIMEP | Coefficient of Variation of Indicated Mean Effective Pressure |
| ATDC | After Top Dead Center |
| Twall | Refers to Woschni’s heat transfer correlation model |
| UVATZ | University of Vaasa Thermo-Kinetic Zonal model |
| −180 BDC | 180° before Bottom Dead Center |
| CMP | Compression stroke |
| 0 TDCF | 0° Top Dead Center Firing |
| PWR | Power stroke |
| 180 BDC | 180° Bottom Dead center |
| EXH | Exhaust stroke |
| 360 TDC | 360° Top Dead Center |
| INT | Intake stroke |
| 540 BDC | 540° Bottom Dead Center |
References
- Manigandan, S.; Ryu, J.I.; Praveen Kumar, T.R.; Elgendi, M. Hydrogen and ammonia as a primary fuel—A critical review of production technologies, diesel engine applications, and challenges. Fuel 2023, 352, 129100. [Google Scholar] [CrossRef]
- Pochet, M.; Jeanmart, H.; Contino, F. A 22:1 Compression Ratio Ammonia-Hydrogen HCCI Engine: Combustion, Load, and Emission Performances. Front. Mech. Eng. 2020, 6, 43. [Google Scholar] [CrossRef]
- Alagumalai, A. Internal combustion engines: Progress and prospects. Renew. Sustain. Energy Rev. 2014, 38, 561–571. [Google Scholar] [CrossRef]
- Komninos, N.P.; Rakopoulos, C.D. Modeling HCCI combustion of biofuels: A review. Renew. Sustain. Energy Rev. 2012, 16, 1588–1610. [Google Scholar] [CrossRef]
- Akram, M.S.; Cheng, Q.; Yeganeh, M.; Kaario, O.; Larmi, M. Experimental Study on Engine Performance Fueled with Ammonia-Hydrogen Blend Ignited by Diesel Pilot. In SAE Technical Papers; SAE International: Amsterdam, The Netherlands, 2024. [Google Scholar] [CrossRef]
- Xu, W.; Zhang, M.; Zhang, Y.; Wang, J.; Huang, Z. Effects of temperature and composition inhomogeneity on the ignition characteristics of NH3/H2 co-firing fuels under HCCI operating conditions. Appl. Energy Combust. Sci. 2023, 15, 100194. [Google Scholar] [CrossRef]
- Wang, B.; Yang, C.; Wang, H.; Hu, D.; Duan, B.; Wang, Y. Study on Combustion and Emission Performance of Dual Injection Strategy for Ammonia/Hydrogen Dual-Fuel Engine. J. Phys. Conf. Ser. 2023, 2437, 012027. [Google Scholar] [CrossRef]
- Stagni, A.; Arunthanayothin, S.; Dehue, M.; Herbinet, O.; Battin-Leclerc, F.; Bréquigny, P.; Mounaïm-Rousselle, C.; Faravelli, T. Low- and intermediate-temperature ammonia/hydrogen oxidation in a flow reactor: Experiments and a wide-range kinetic modeling. Chem. Eng. J. 2023, 471, 144577. [Google Scholar] [CrossRef]
- Guo, H.; Neill, W.S.; Chippior, W.; Li, H.; Taylor, J.D. An experimental and modeling study of hcci combustion using n-heptane. In Proceedings of the ASME 2006 Internal Combustion Engine Division Fall Technical Conference, ICEF 2006, Sacramento, CA, USA, 5–8 November 2006; American Society of Mechanical Engineers (ASME): New York, NY, USA, 2006; pp. 187–197. [Google Scholar] [CrossRef]
- Vasudev, A.; Mikulski, M.; Balakrishnan, P.R.; Storm, X.; Hunicz, J. Thermo-kinetic multi-zone modelling of low temperature combustion engines. Prog. Energy Combust. Sci. 2022, 91, 100998. [Google Scholar] [CrossRef]
- Kakoee, A.; Vasudev, A.; Smulter, B.; Hyvonen, J.; Mikulski, M. A Predictive 1D Modeling Framework for Reactivity-Controlled Compression Ignition Engines, via a Chemistry-Based, Multizone Combustion Object. In Proceedings of the 16th International Conference on Engines & Vehicles, Naples, Italy, 10–14 September 2023; SAE International: Amsterdam, The Netherlands, 2023. [Google Scholar] [CrossRef]
- Gamma Technologies. GT-Suite v2022. 2024. Available online: https://www.gtisoft.com/ (accessed on 21 November 2024).
- Yelvington, P.; Rallo, M.; Liput, S.; Tester, J.; Green, W.; Yang, J. Prediction of performance maps for homogeneous-charge compression-ignition engines. Combust. Sci. Technol. Combust. Sci. Technol. 2004, 176, 1243–1282. [Google Scholar] [CrossRef]
- Gamma Technologies. Engine Performance Application Manual GT-SUITE 2 Engine Performance Application Manual; Gamma Technologies: Pune, India, 2022. [Google Scholar]
- Patel, A.; Kong, S.C.; Reitz, R. Development and Validation of a Reduced Reaction Mechanism for HCCI Engine Simulations; SAE International: Amsterdam, The Netherlands, 2004; Available online: https://api.semanticscholar.org/CorpusID:94555778 (accessed on 25 June 2024).
- Jia, M.; Peng, Z.J.; Xie, M.Z. Numerical investigation of soot reduction potentials with diesel homogeneous charge compression ignition combustion by an improved phenomenological soot model. Proc. Inst. Mech. Eng. Part D J. Automob. Eng. 2009, 223, 395–412. [Google Scholar] [CrossRef]
- Han, X.; Wang, Z.; Costa, M.; Sun, Z.; He, Y.; Cen, K. Experimental and kinetic modeling study of laminar burning velocities of NH3/air, NH3/H2/air, NH3/CO/air and NH3/CH4/air premixed flames. Combust. Flame 2019, 206, 214–226. [Google Scholar] [CrossRef]
- Heywood, J. Internal Combustion Engine Fundamentals; McGraw-Hill Series in Mechanical Engineering; McGraw-Hill Education: New York, NY, USA, 1988. [Google Scholar]
- Gurbuz, H.; Kose, Ş. A theoretical investigation on the performance and combustion parameters in an spark ignition engine fueled with different shale gas mixtures. J. Eng. Gas Turbines Power 2021, 143, 061015. [Google Scholar] [CrossRef]
- Choi, W.; Song, H.H. Composition-considered Woschni heat transfer correlation: Findings from the analysis of over-expected engine heat losses in a solid oxide fuel cell–internal combustion engine hybrid system. Energy 2020, 203, 117851. [Google Scholar] [CrossRef]
- Lhuillier, C.; Brequigny, P.; Contino, F.; Rousselle, C. Combustion Characteristics of Ammonia in a Modern Spark-Ignition Engine. In Proceedings of the Conference on Sustainable Mobility, Groningen, The Netherlands, 17–18 June 2019; SAE International: Amsterdam, The Netherlands, 2019. [Google Scholar] [CrossRef]
- Karvountzis-Kontakiotis, A.; Ntziachristos, L. Enquête de la variabilité cycle-à-cycle du NO dans la combustion homogène. Oil Gas Sci. Technol. 2015, 70, 111–123. [Google Scholar] [CrossRef]
- Vasudev, A.; Cafari, A.; Axelsson, M.; Mikulski, M.; Hyvonen, J. Towards Next Generation Control-Oriented Thermo-Kinetic Model for Reactivity Controlled Compression Ignition Marine Engines. In Proceedings of the SAE Powertrains, Fuels & Lubricants Conference & Exhibition, Krakow, Poland, 6–8 September 2022; SAE International: Amsterdam, The Netherlands, 2022. [Google Scholar] [CrossRef]
- Hasan, M.M.; Rahman, M.M.; Kadirgama, K.; Ramasamy, D. Numerical study of engine parameters on combustion and performance characteristics in an n-heptane fueled HCCI engine. Appl. Therm. Eng. 2018, 128, 1464–1475. [Google Scholar] [CrossRef]
- Guo, X.; Li, T.; Huang, S.; Zhou, X.; Chen, R.; Wei, W.; Wu, Z.; Wang, N.; Li, S. Characteristics of ignition, combustion and emission formation of premixed ammonia-hydrogen blends by hydrogen-fueled pre-chamber turbulent jets. Energy 2025, 322, 135573. [Google Scholar] [CrossRef]
- Zhu, Y.; Curran, H.J.; Girhe, S.; Murakami, Y.; Pitsch, H.; Senecal, K.; Yang, L.; Zhou, C.W. The combustion chemistry of ammonia and ammonia/hydrogen mixtures: A comprehensive chemical kinetic modeling study. Combust. Flame 2024, 260, 113239. [Google Scholar] [CrossRef]
- Han, W.; Dai, P.; Gou, X.; Chen, Z. A review of laminar flame speeds of hydrogen and syngas measured from propagating spherical flames. Appl. Energy Combust. Sci. 2020, 1–4, 100008. [Google Scholar] [CrossRef]
- Meng, X.; Zhao, C.; Qin, M.; Zhang, M.; Dong, D.; Long, W.; Bi, M. Study on chemical kinetics and NO behaviors in pre-chamber jet-induced ignition mode with ammonia. Fuel Process. Technol. 2023, 250, 107876. [Google Scholar] [CrossRef]
- Oakley, A.; Zhao, H.; Ladommatos, N.; Ma, T. Dilution effects on the controlled auto-ignition (CAI) combustion of hydrocarbon and alcohol fuels. In SAE Technical Papers; SAE International: Amsterdam, The Netherlands, 2001. [Google Scholar] [CrossRef]
- Balogun, F.; Vasudev, A.; Kakoee, A.; Sirviö, K.; Mikulski, M. Investigating HCCI Engine Operating Parameters Under the Simultaneous Dual Fueling of Ammonia and Hydrogen Based on Detailed Chemical Kinetics Modelling. In Proceedings of the THIESEL 2024: Conference on Thermo-and Fluid Dynamics of Clean Propulsion Powerplants, Valencia, Spain, 10–13 September 2024; pp. 208–225. [Google Scholar] [CrossRef]
Disclaimer/Publisher’s Note: The statements, opinions and data contained in all publications are solely those of the individual author(s) and contributor(s) and not of MDPI and/or the editor(s). MDPI and/or the editor(s) disclaim responsibility for any injury to people or property resulting from any ideas, methods, instructions or products referred to in the content. |
© 2025 by the authors. Licensee MDPI, Basel, Switzerland. This article is an open access article distributed under the terms and conditions of the Creative Commons Attribution (CC BY) license (https://creativecommons.org/licenses/by/4.0/).