Abstract
The strong heterogeneity of carbonate reservoirs poses significant technical challenges in reservoir classification and permeability evaluation. This study proposes a new method for reservoir classification based on nuclear magnetic resonance (NMR) logging data for the Asmari formation of the Middle East M Oilfield, a carbonate reservoir. By integrating NMR T2 spectrum characteristic parameters (such as T2 geometric mean, T2R35/R50/R65, and pore volume fraction) with principal component analysis (PCA) for dimensionality reduction and an improved slope method, this study achieves fine reservoir type classification. The results are compared with core pressure curves and petrographic pore types. This study reveals that the Asmari reservoir can be divided into four categories (RT1 to RT4). RT1 reservoirs are characterized by large pore throats (maximum pore throat radius >3.8 μm), low displacement pressure (<0.2 MPa), and high permeability (average 22.16 mD), corresponding to a pore structure dominated by intergranular dissolution pores. RT4 reservoirs, on the other hand, exhibit small pore throats (<1 μm), high displacement pressure (>0.7 MPa), and low permeability (0.66 mD) and are primarily composed of dense dolostone or limestone. The classification results show good consistency with capillary pressure curves and petrographic pore types, and the pore–permeability relationships of each reservoir type have significantly higher fitting goodness (R2 = 0.48~0.68) compared with the unclassified model (R2 = 0.24). In the new well application, the root mean square error (RMSE) of permeability prediction decreased from 0.34 mD using traditional methods to 0.21 mD, demonstrating the method’s effectiveness. This approach does not rely on a large number of mercury injection experiments and can achieve reservoir classification solely through NMR logging. It provides a scalable technological paradigm for permeability prediction and development scheme optimization of highly heterogeneous carbonate reservoirs, offering valuable references for similar reservoirs worldwide.
1. Introduction
Carbonate reservoirs hold a significant position in global oil and gas resources, particularly those in the Middle East, as these reservoirs possess substantial potential for exploration and development, making them a focal point for global petroleum exploration and exploitation [1,2,3]. Approximately two-thirds of the world’s total oil production originates from the Middle East, with 80% of the oil-bearing reservoirs being carbonate reservoirs [4,5]. However, these reservoirs present numerous technical challenges for exploration and development due to the complexity of their depositional types, their strong heterogeneity, and poor reservoir permeability [6,7,8]. To conduct a more refined study of the flow capabilities in heterogeneous carbonate reservoirs, reservoir classification can be applied to the target oil reservoir. This process, carried out during the reservoir description phase, involves dividing the reservoir into several relatively homogeneous categories in the context of strong heterogeneity. The goal is to study the reservoir’s storage and permeability capabilities and predict the spatial distribution of physical properties, ultimately facilitating more efficient oil and gas reservoir development [9].
For reservoir classification, the ideal outcome is that each category of reservoir reflects similar depositional and diagenetic processes, exhibiting identical pore structures. Under conditions of consistent wettability, these reservoirs should display uniform porosity–permeability relationships, analogous capillary pressure curves, and similar relative permeability distributions [10]. However, in practice, there is no unified classification standard for reservoirs, and many scholars have conducted research in this area. A summary of previous studies on carbonate reservoirs revealed that the earliest differentiation method was based on geological sub-layers [11]. However, in practical application, it became evident that while this method is simple, it lacks specificity and fails to address the heterogeneity of the reservoirs [12]. Additionally, core coverage is often insufficient to cover all stratigraphic layers. Similarly, attempts to classify reservoirs based on lithology have been made, but these models fail to resolve the heterogeneity issue [13]. For example, in the case of the Mishrif formation in the Middle East, despite being a pure pore-type limestone reservoir, extensive research shows that its heterogeneity is extremely high [9,14]. Lithology-based classification methods are therefore not applicable. Based on subsequent research findings, commonly used methods can be categorized into three main types: geological, petrophysical, and production dynamic methods [10]. Geological methods typically combine depositional environment and diagenetic processes, classifying rocks based on geological factors such as carbonate composition or structural genesis [15]. Petrophysical methods, on the other hand, rely on core experimental data, such as physical parameters like porosity and permeability or capillary pressure curve parameters obtained from mercury injection experiments, to extract petrophysical characteristics as the basis for classification [16,17]. Production dynamic methods use production dynamic parameters such as oil and gas production development data as the classification basis. Regarding these methods, geological approaches involve numerous categories, making it difficult to establish corresponding log response characteristics, thus limiting direct application in actual development [18,19]. As for dynamic reservoir parameters, while they can identify macroscopic flow units, they fail to reveal microscopic features and cannot ensure that the extracted dynamic parameters are unaffected by engineering factors.
The prevailing methods in this field remain those based on rock physics, which can be broadly classified into two categories. The first category involves classification based on pore throat radius, where specific pore throat radii or combinations thereof corresponding to distinct features of the mercury injection capillary pressure (MICP) curves are used as classification parameters [20,21]. For instance, the Swanson parameter, derived from the inflection point of the capillary pressure curve in a double logarithmic plot, serves as a key parameter for classification [22]. Alternatively, the pore throat radius corresponding to specific cumulative saturations on the MICP curve, such as R35 at a cumulative saturation of 35%, can also be used for classification [23]. Among these methods, the Winland R35 has been particularly influential and is widely applied in the classification of carbonate reservoirs. The second category involves the use of the flow zone indicator (FZI) or rock quality index (RQI) as classification criteria to identify rock types with similar permeability–pore relationships [24,25]. This approach was first proposed by Amaefule in 1993 [26], and as one of the classical methods, it has been continuously refined through numerous subsequent studies [25,27,28]. Despite the theoretical innovations introduced in these updates, both method categories share a common challenge: difficulty in representing the model parameters using logging data, thereby limiting their widespread applicability. In practical applications, these methods perform well for reservoirs with similar capillary pressure curves, such as clastic rocks and relatively homogeneous carbonate reservoirs [29]. However, for carbonate reservoirs exhibiting strong heterogeneity and complex capillary pressure curves, which contain multiple pore types, including micropores and cavities, with multiple modes of pore throat radii, these methods are no longer applicable [30].
To address this issue while considering the generalizability of reservoir classification methods, this study proposes a novel approach using nuclear magnetic resonance (NMR) logging phases for the classification of carbonate reservoir types. First, given that NMR logging data can finely describe the pore space characteristics of reservoirs, multiple parameters are extracted from the T2 distribution of NMR data. A combination of principal component analysis and the improved rolling stone method is employed to classify new NMR logging phases as the basis for reservoir classification. Additionally, the rock physics and geological interpretations of these phases are provided based on core experimental data. The study also presents the porosity–permeability relationships for each reservoir type derived from the phase classification results. This method is applied to carbonate reservoirs in the Asmari formation in the Middle East, offering a novel, generalizable approach for classifying reservoir types and calculating permeability in the Asmari formation. The proposed method holds significant practical geological and engineering value for the study area.
2. Geological Survey and Core Data Analysis
2.1. Geological Survey of the Study Area
The study area is the M Oilfield in the Middle East, located across the southeastern part of Iraq and the southern side of the Iran–Iraq border. The reservoir core is composed of the Paleogene Asmari formation carbonate strata. From a structural background analysis, the oilfield is situated in the transitional zone between the northern Persian Gulf Basin’s Mesopotamian Basin and the Zagros Foreland Basin [31]. Its formation and evolution are directly controlled by the Zagros Orogeny, caused by the collision of the Eurasian plate and the African–Arabian plates. The structural morphology within the block is dominated by an asymmetric, narrow anticline trending northwest–southeast. The central region features a normal fault system aligned in the same northwest–southeast direction, while the western part is primarily characterized by a strike-slip fault system [32,33]. This study focuses on the reservoir of the Asmari formation in the M Oilfield.
2.2. Core Data Analysis
The analysis of core data from the Asmari formation in the M Oilfield shows several key findings, as depicted in Figure 1, which presents the porosity and permeability cross plot for the core samples. It should be noted that the porosity and permeability data from the core experiments were subjected to overburden correction. Figure 1 illustrates that the porosity distribution of the target layer ranges from 0.1% to 30%, with the majority of values concentrated between 3% and 20%. The average porosity is 12.87%. As for the permeability, it spans from 0.012 mD to 1000 mD, with the majority of values concentrated between 0.1 mD and 10 mD. The average permeability is 88.51 mD. Additionally, the Asmari formation reservoir exhibits strong heterogeneity, as evidenced by the fact that the permeability corresponding to a given porosity can vary by up to three orders of magnitude.
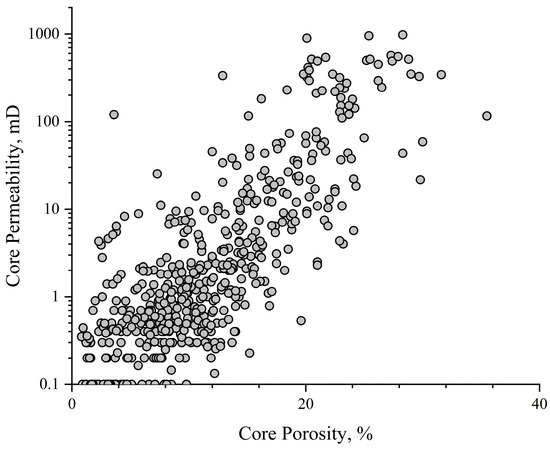
Figure 1.
The cross plot of core porosity and permeability of the Asmari formation in the M oilfield.
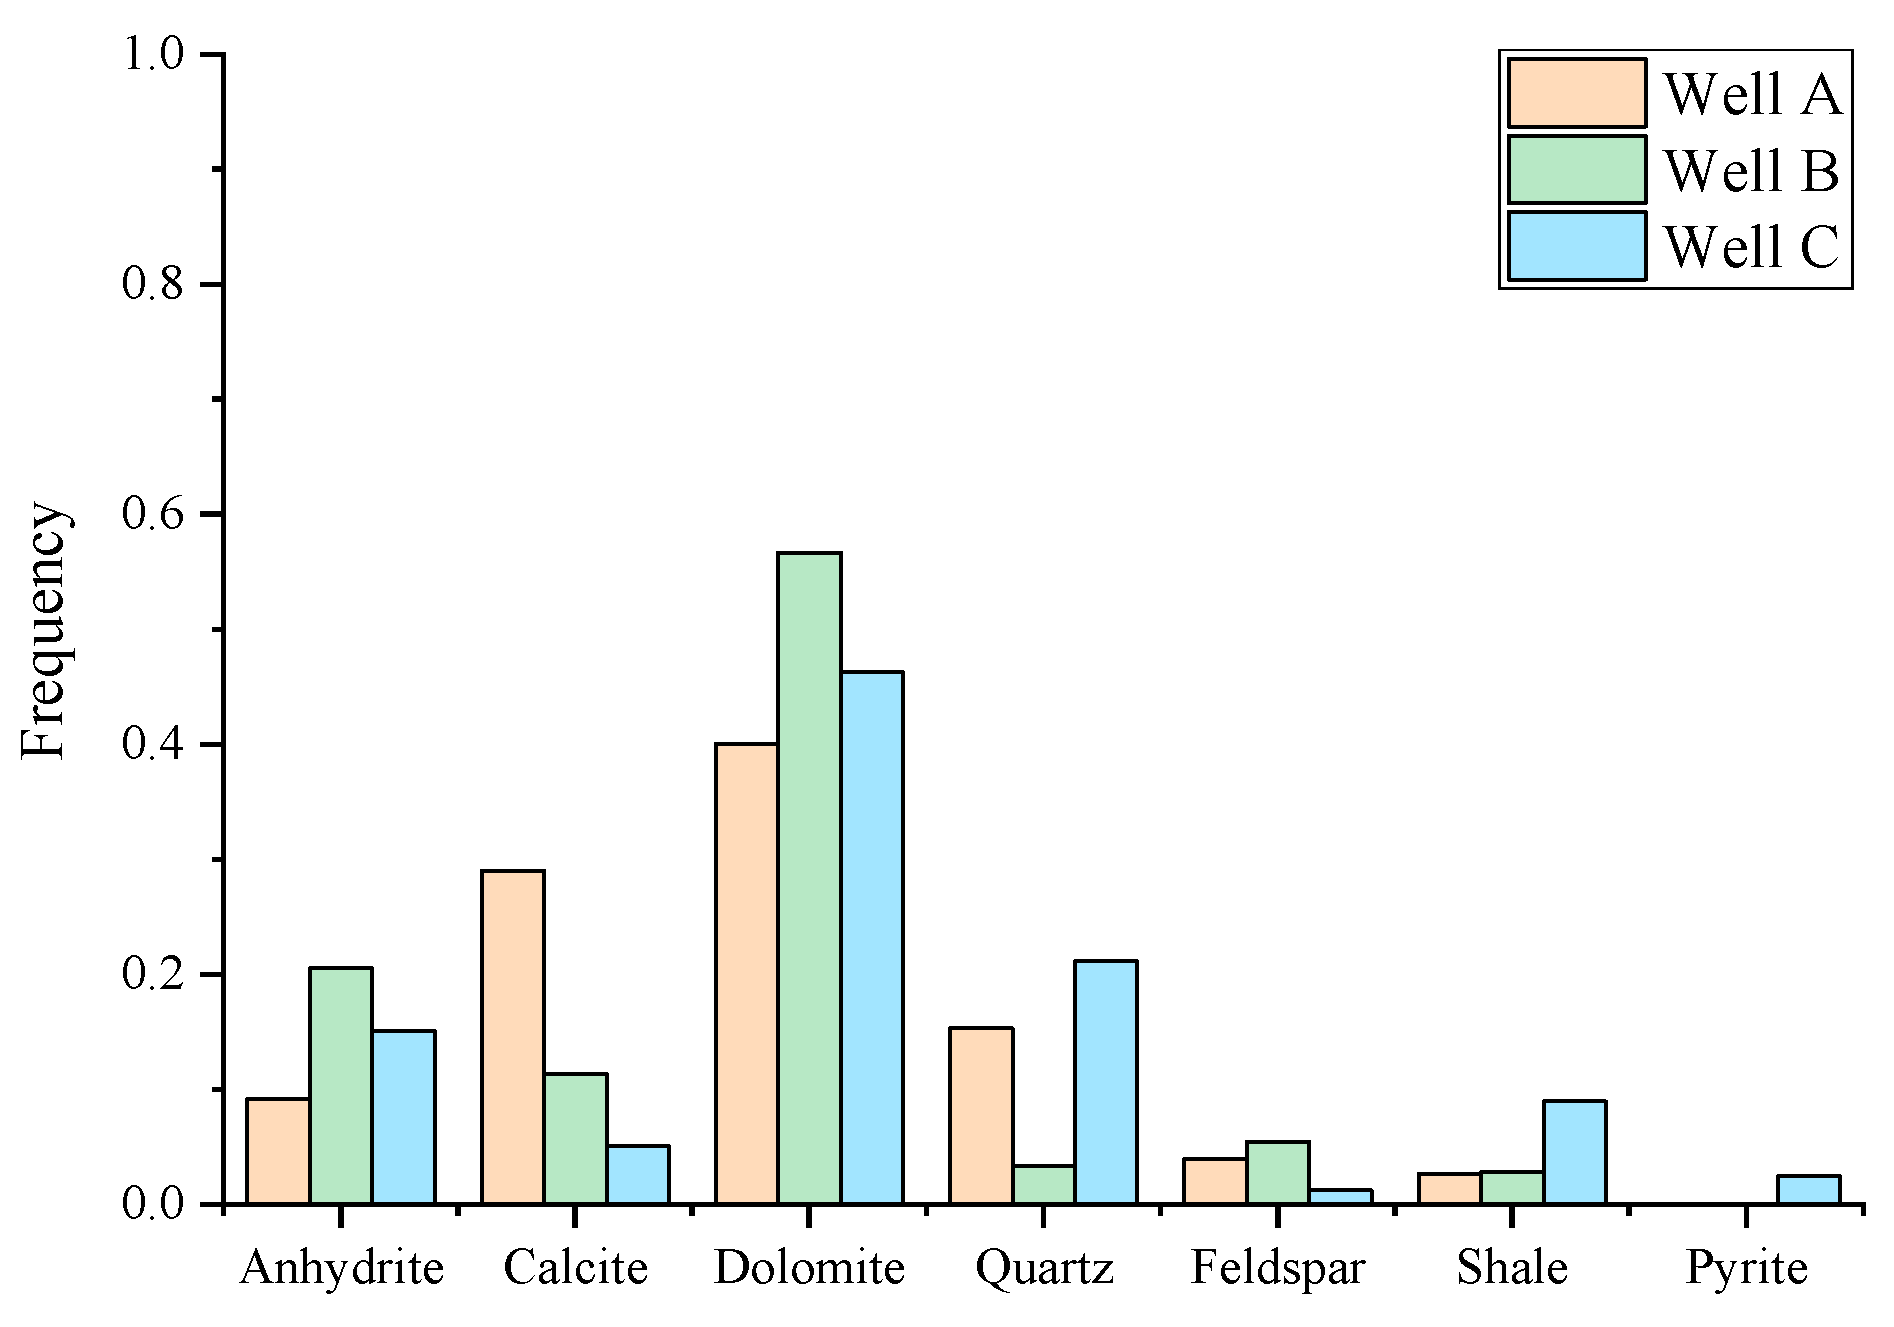
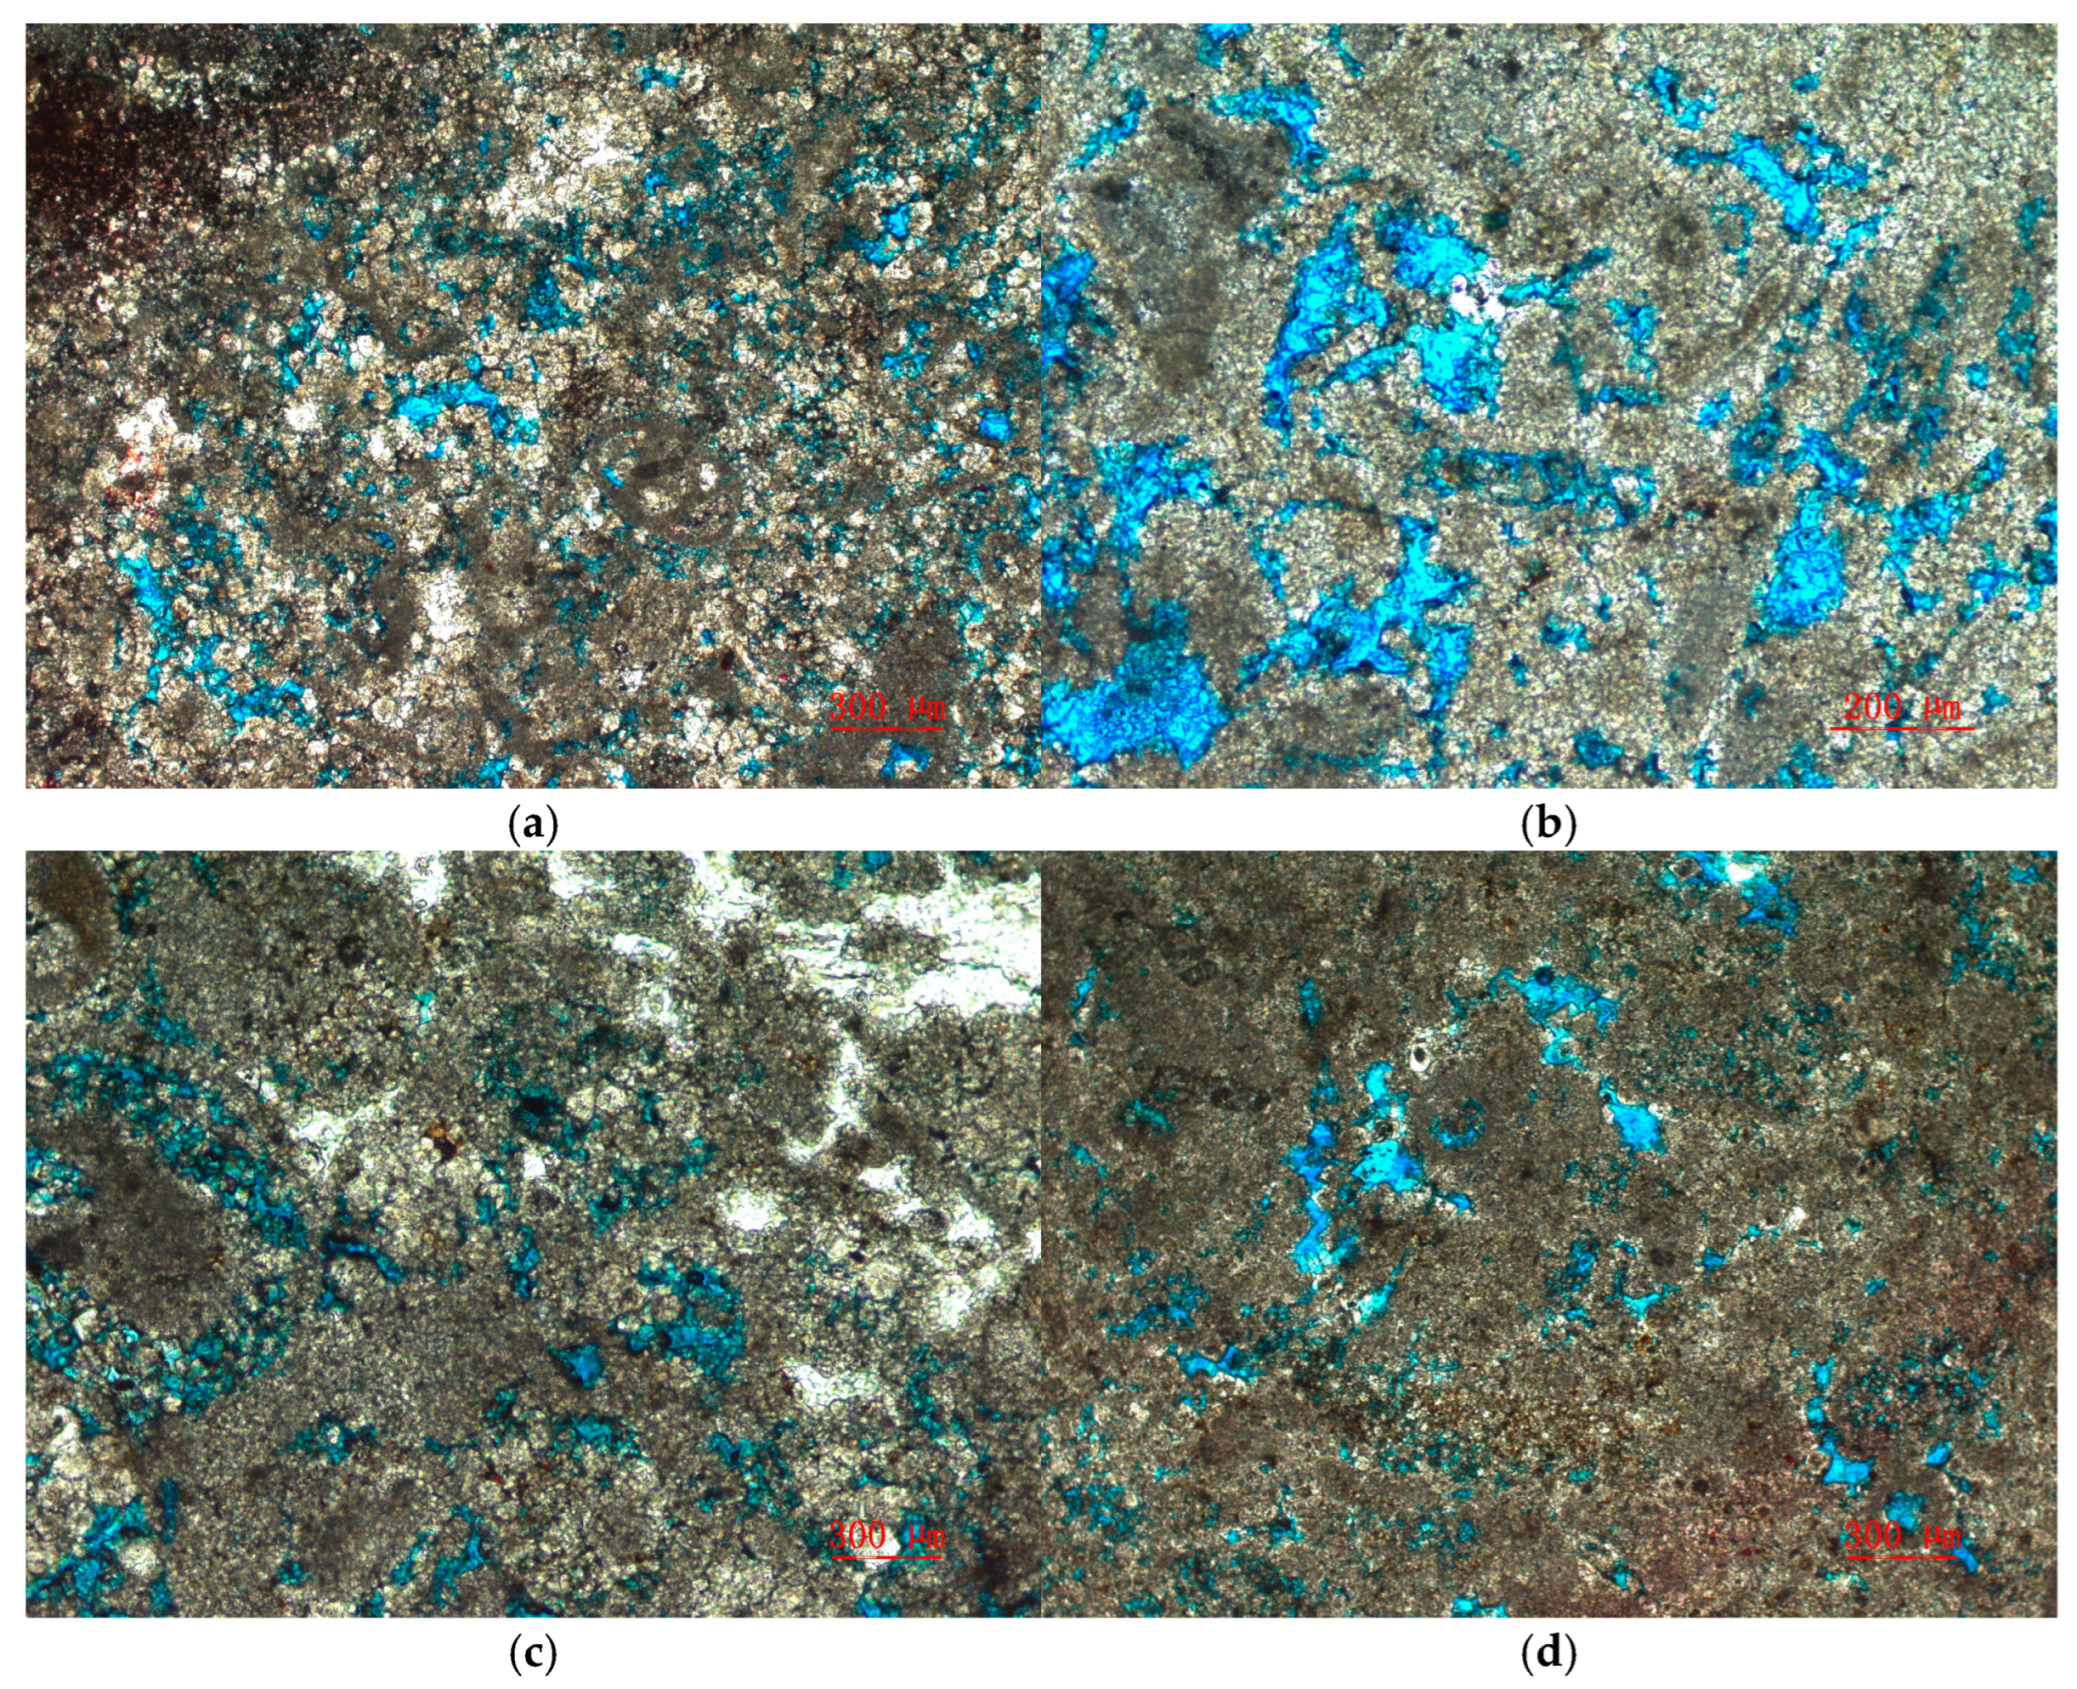
An analysis of the lithology and pore space characteristics of the target reservoir was conducted using core X-ray diffraction (XRD) experimental data and cast thin section data. Figure 2 shows the mineral composition and distribution obtained from the core XRD data. The core data reveal that the target formation is predominantly composed of siliceous clastic sediments and carbonate sediments, with lithologies primarily consisting of bioclastic limestone, mudstone–dolomite limestone, and dolomite. Locally, small amounts of gypsum and sandstone–mudstone are also present. Regarding the core cast thin section data, the types and quantities of pore structures were statistically analyzed. Figure 3 showcases representative images of core cast thin sections. Figure 3a displays intercrystalline pores in dolomite, Figure 3b illustrates the development of solution pores, Figure 3c shows the coexistence of intergranular and solution pores, and Figure 3d highlights the presence of intercrystalline pores, biocavity pores, and minor fractures.

Figure 2.
Histogram showing the mineral content distribution of the core XRD results of three wells in the study area.
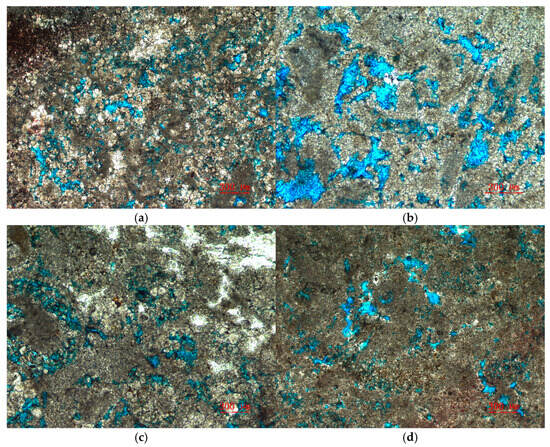
Figure 3.
The core casting thin section image of the Asmari formation in the study area: (a) intercrystalline pores of dolomite; (b) solution pores; (c) intergranular pores and dissolved pores; (d) intergranular pores, biological cavity pores, and fractures.
Figure 4 shows a histogram of the statistical analysis of pore structure types. The data indicate that the Asmari formation in the study area is primarily characterized by intercrystalline pores in dolomite and solution pores, with a small number of fractures also developed. Combined with the actual stratigraphic distribution, it is observed that the lithology in Area A of the study region is predominantly dolomite, with the development of both primary and secondary pores as well as fractures. In contrast, Area B is composed of a mixture of dolomite, limestone, and sandstone, with fractures and microfractures developed within the dolomite and limestone. The presence of sandstone significantly enhances the porosity of the reservoir.
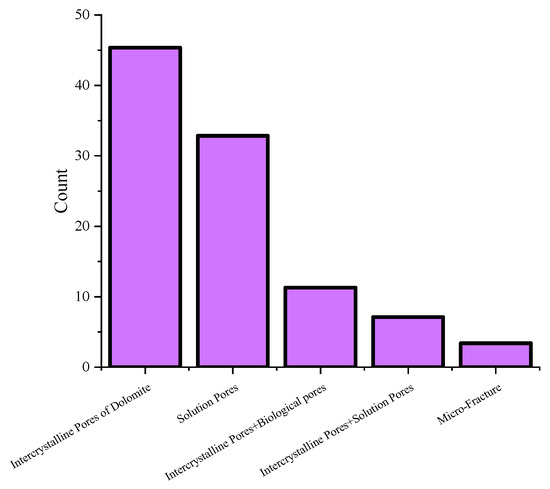
Figure 4.
Histogram of the pore structure type based on the statistics of casting thin section data in the study area.
In summary, the Asmari formation in the M oil field exhibits complex lithology, primarily composed of carbonate rocks with a small amount of sandstone. The pore structure types are diverse, resulting in a complex relationship between core porosity and permeability. All core experimental data indicate strong heterogeneity within this reservoir section, necessitating a reasonable classification of reservoir types in order to evaluate key parameters such as permeability.
3. Methods
3.1. The Principle of Nuclear Magnetic Resonance Logging and T2 Spectrum Parameter Extraction
NMR is a physical phenomenon where the magnetic moment of atomic nuclei, induced by their spin, interacts with an external magnetic field. Under the influence of an alternating magnetic field, nuclei absorb electromagnetic waves at specific frequencies, causing transitions from lower to higher energy levels. In NMR, relaxation is a key physical quantity, referring to the process by which the magnetization vector, after being excited by a radio frequency field, returns to its equilibrium state from a displaced state. In rock physics, the relaxation rate is influenced by the physical properties of the rock and the characteristics of the fluids. The transverse relaxation time (T2) is commonly used to analyze the pore structure of rocks [34].
In the water-saturated state of rock samples, the distribution of the T2 spectrum can effectively reflect the heterogeneity of pore sizes: short relaxation times correspond to small pores, while long relaxation times are associated with larger pores. Through spectral analysis, the pore volume distribution can be quantitatively obtained, providing key insights for reservoir evaluation. The transverse relaxation time can be expressed as follows:
In Equation (1), T2s, T2B, and T2D correspond to the surface relaxation time, bulk relaxation time, and diffusion relaxation time of the rock, respectively, with units in milliseconds (ms).
In rock physics, for a uniform magnetic field with smaller echo signals, the rock’s bulk relaxation time and diffusion relaxation time can be neglected. Therefore, Equation (1) can be written as follows:
In Equation (2), represents the transverse surface relaxation intensity of the rock, with units in μm/ms; S is the pore surface area, with units in μm2; V is the pore volume, with units in μm3; is the geometric shape factor, which is dimensionless; and Rc corresponds to the pore radius, with units in μm.
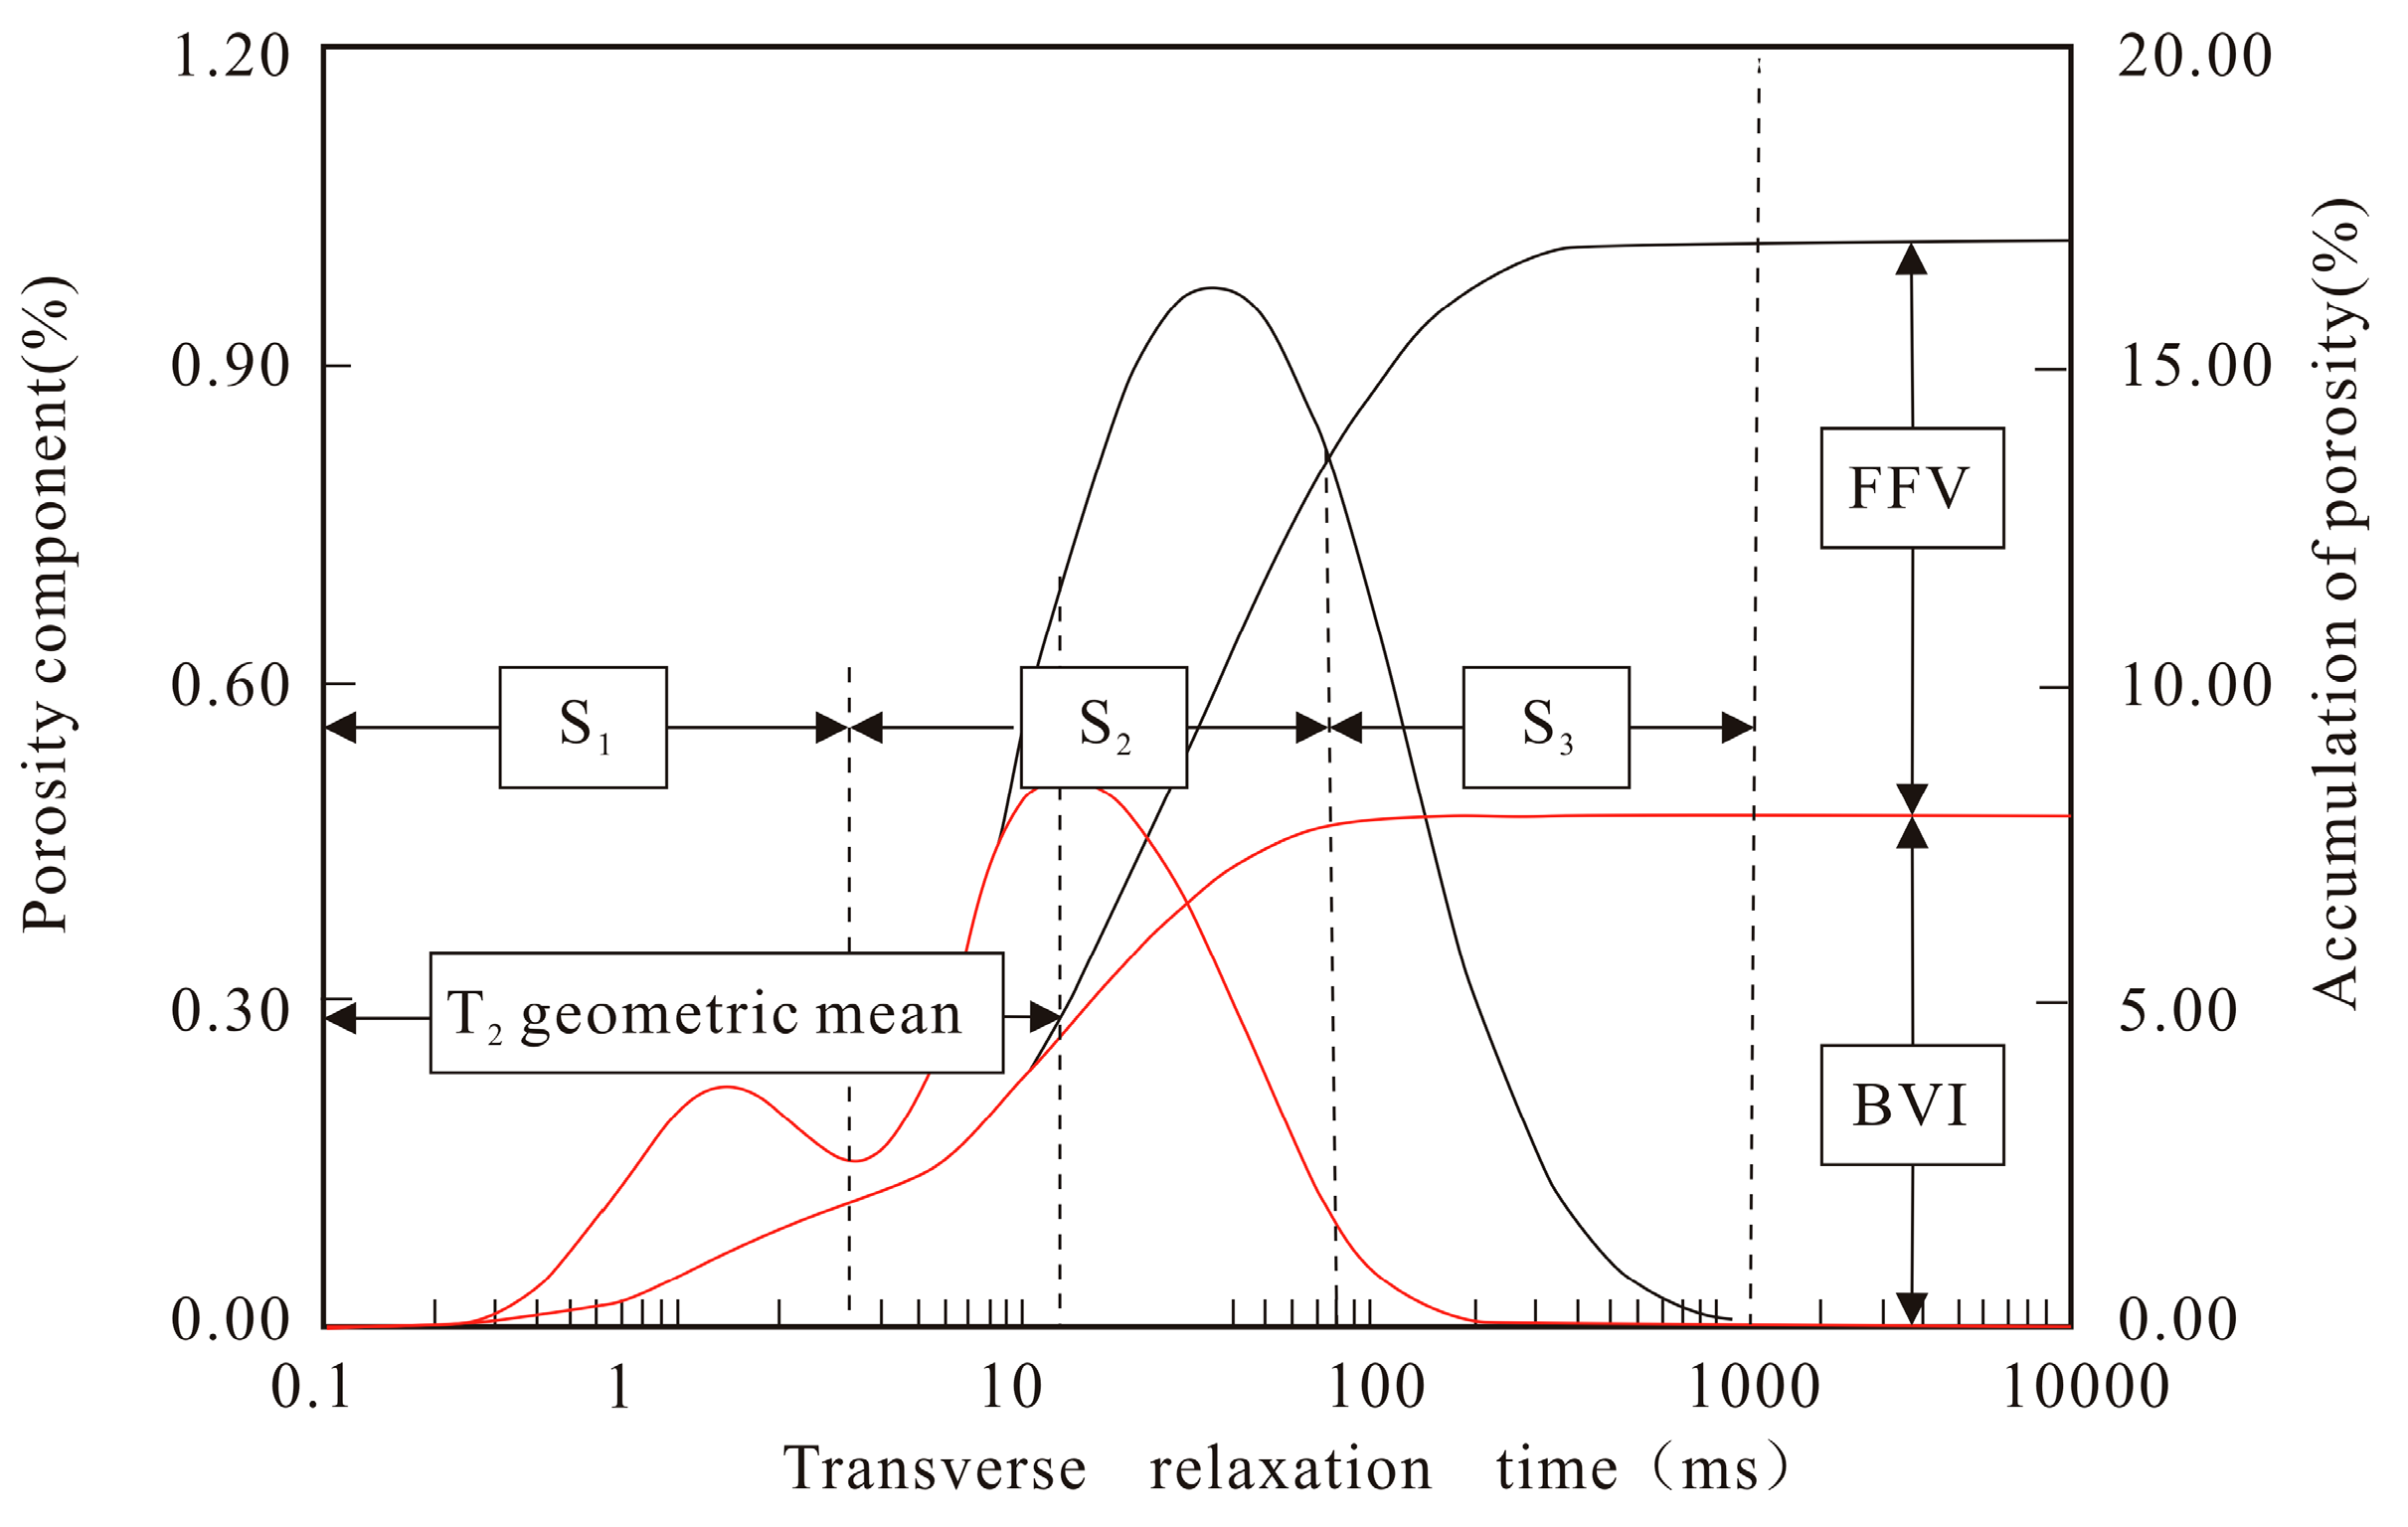
Considering that NMR logging data are widely available in the study area, NMR logging, which detects reservoirs by applying an external magnetic field to the hydrogen nuclei in the formation, is almost unaffected by the rock framework. The NMR transverse relaxation spectrum obtained through multi-exponential inversion fitting of the echo series from the relaxation phenomena can accurately reflect the distribution of hydrogen-bearing fluids inside the rock. The normal probability curve can effectively characterize the pore throat size and distribution in the capillary pressure curve and the NMR T2 spectrum. Therefore, the graphical features of the normal distribution can be used to analyze the NMR T2 spectrum and the cumulative porosity. By quantifying the relaxation times and pore components in the NMR T2 spectrum and extracting the graphical features from the T2 NMR spectrum and the mathematical feature parameters from the normal probability distribution, it is possible to obtain a wealth of derived parameters that can quantitatively characterize the reservoir pore size, pore connectivity, and pore distribution. This can be used to quantify the rock pore throat size and distribution. Figure 5 shows a schematic diagram of the T2 spectrum.
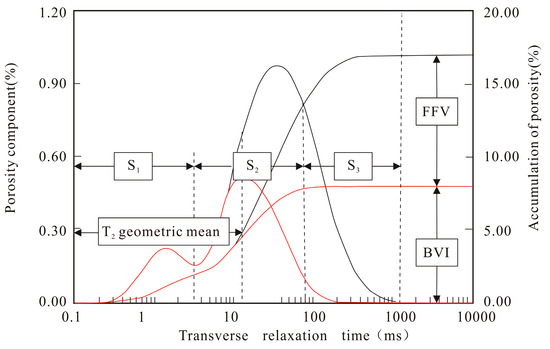
Figure 5.
Nuclear magnetic resonance T2 spectrum diagram [9].
Various parameters are included in the schematic diagram of the T2 spectrum in Figure 5, e.g., the geometric mean of T2, BVI corresponding to bound fluid pores, FFV corresponding to movable fluid pores, and others. These parameters primarily reflect the microscopic pore structure characteristics of the rock. Related parameters such as T2R35, T2R50, and T2R65 are extracted based on the pore component cumulative curve from the T2 spectrum. These parameters can reflect the pore size, with the three values representing the transverse relaxation time when the cumulative nuclear magnetic pore component reaches 35%, 50%, and 65%, respectively. S1, S2, and S3 are also shown in Figure 5, which in previous sandstone reservoirs represent clay-bound, capillary-bound, and movable fluids, respectively. The T2 cutoff values are determined by two sets of T2 cutoff values, but in carbonate reservoirs, the selection of T2 cutoff values is not particularly standardized in the industry. Given the previous research literature [6,9] and considering that the actual results show that the T2 cutoff values in carbonate rocks are highly variable, ranging from 30 ms to 100 ms, the cutoff values of 3 ms and 92 ms are set as the cutoff values for defining the T2 cutoff values of S1, S2, and S3, respectively. It should also be noted that the study used microporous, mesoporous, and macroporous to describe the parameters when defining them. S1 represents the proportion of small-sized pore components in the total nuclear magnetic porosity, referring to pores with relaxation times ranging from 0 to 3 ms. S2 represents the percentage content of medium-sized pore components in the total porosity; it mainly represents capillary-bound water, typically referring to pores with relaxation times between 3 and 92 ms. S3 represents the percentage content of large-sized pore components in the total porosity; it mainly represents the pore proportion of movable fluids with relaxation times greater than 92 ms. Certain quantification parameters for pore sorting features, such as sorting coefficient and coefficient of variation, derived from mathematical feature extraction based on the T2 spectrum, cannot be incorporated into the diagram. Table 1 presents the corresponding calculation formulas for the parameters extracted from the T2 spectrum.

Table 1.
Parameter extraction formulas based on nuclear magnetic resonance from the T2 spectrum.
3.2. Reservoir Type Division Method and Principle
The pore structure of a reservoir significantly influences its storage space and the flow channels for fluids. Under consistent conditions, a better pore structure generally correlates with improved production capacity. NMR logging, through the multi-exponential inversion fitting of echo trains based on relaxation phenomena, provides a T2 spectrum that effectively reflects the distribution of hydrogen-containing fluids within the rock. The parameters in Table 1 represent physically meaningful parameters derived from the T2 spectrum, which can effectively characterize the reservoir’s pore structure. The geometric mean of T2 is used to describe the average growth rate of pore fractions in the T2 spectrum; the sorting coefficient measures the dispersion of T2 spectrum pore fractions, with smaller values indicating more concentrated pore distributions; the coefficient of variation is a comprehensive parameter for evaluating both the distribution and the mean position of the pores. In the same formation, it can be used to assess the quality of the pore structure, with higher values indicating a poorer pore structure. However, it is important to note that there is a correlation between the various extracted feature parameters from the T2 spectrum, and the excessive use of parameters in reservoir classification can reduce the applicability of the method. Therefore, dimensionality reduction methods are applied to reduce feature dimensions while retaining as much original information as possible.
3.2.1. Principal Component Analysis
Quantitative parameters that can characterize the pore space features are extracted from the T2 spectrum of NMR. Principal component analysis (PCA) is then applied to reduce feature dimensionality. PCA is a reliable and widely used dimensionality reduction method. This technique reduces high-dimensional data to lower dimensions, transforming multiple indicators into fewer composite indicators with minimal information loss [35]. These composite indicators are called principal components, with each principal component being a linear combination of the original variables. Moreover, the principal components are uncorrelated, making them superior to the original variables in certain aspects.
The main process of performing PCA on the sample set from the study area is as follows:
- (1)
- The collected sample set is standardized using the Z-score standardization method to eliminate the dimensional influences between the different extracted parameters;
- (2)
- A correlation coefficient matrix is established between the different variables, and the eigenvalues and eigenvectors of the correlation coefficient matrix are computed;
- (3)
- The number of principal components is determined based on the variance contribution rate of the selected parameters;
- (4)
- Finally, the standardized sample set is transformed using the eigenvalues and component matrix of the correlation coefficient matrix, and the principal components are calculated to obtain the final evaluation indicators.
3.2.2. Reservoir Classification Method Based on the Improved Slope Method
Al-Qenae proposed a rock physics reservoir classification method based on the mathematical approach of Winland R35 [36]. His specific approach arranges the R35 parameter in ascending order and plots it on a semi-logarithmic scale, where the x-axis represents the R35 value (logarithmic scale), and the y-axis represents the sequence number (linear scale). Different slopes represent different pore structures, which are then used to classify various reservoir types. Based on this idea, this study replaces the R35 parameter with the derived parameters from the T2 spectrum, which are the evaluation indicators obtained after performing principal component analysis. Additionally, considering the strong heterogeneity of actual reservoirs and the complexity of the pore structures, it becomes difficult to effectively identify inflection points.
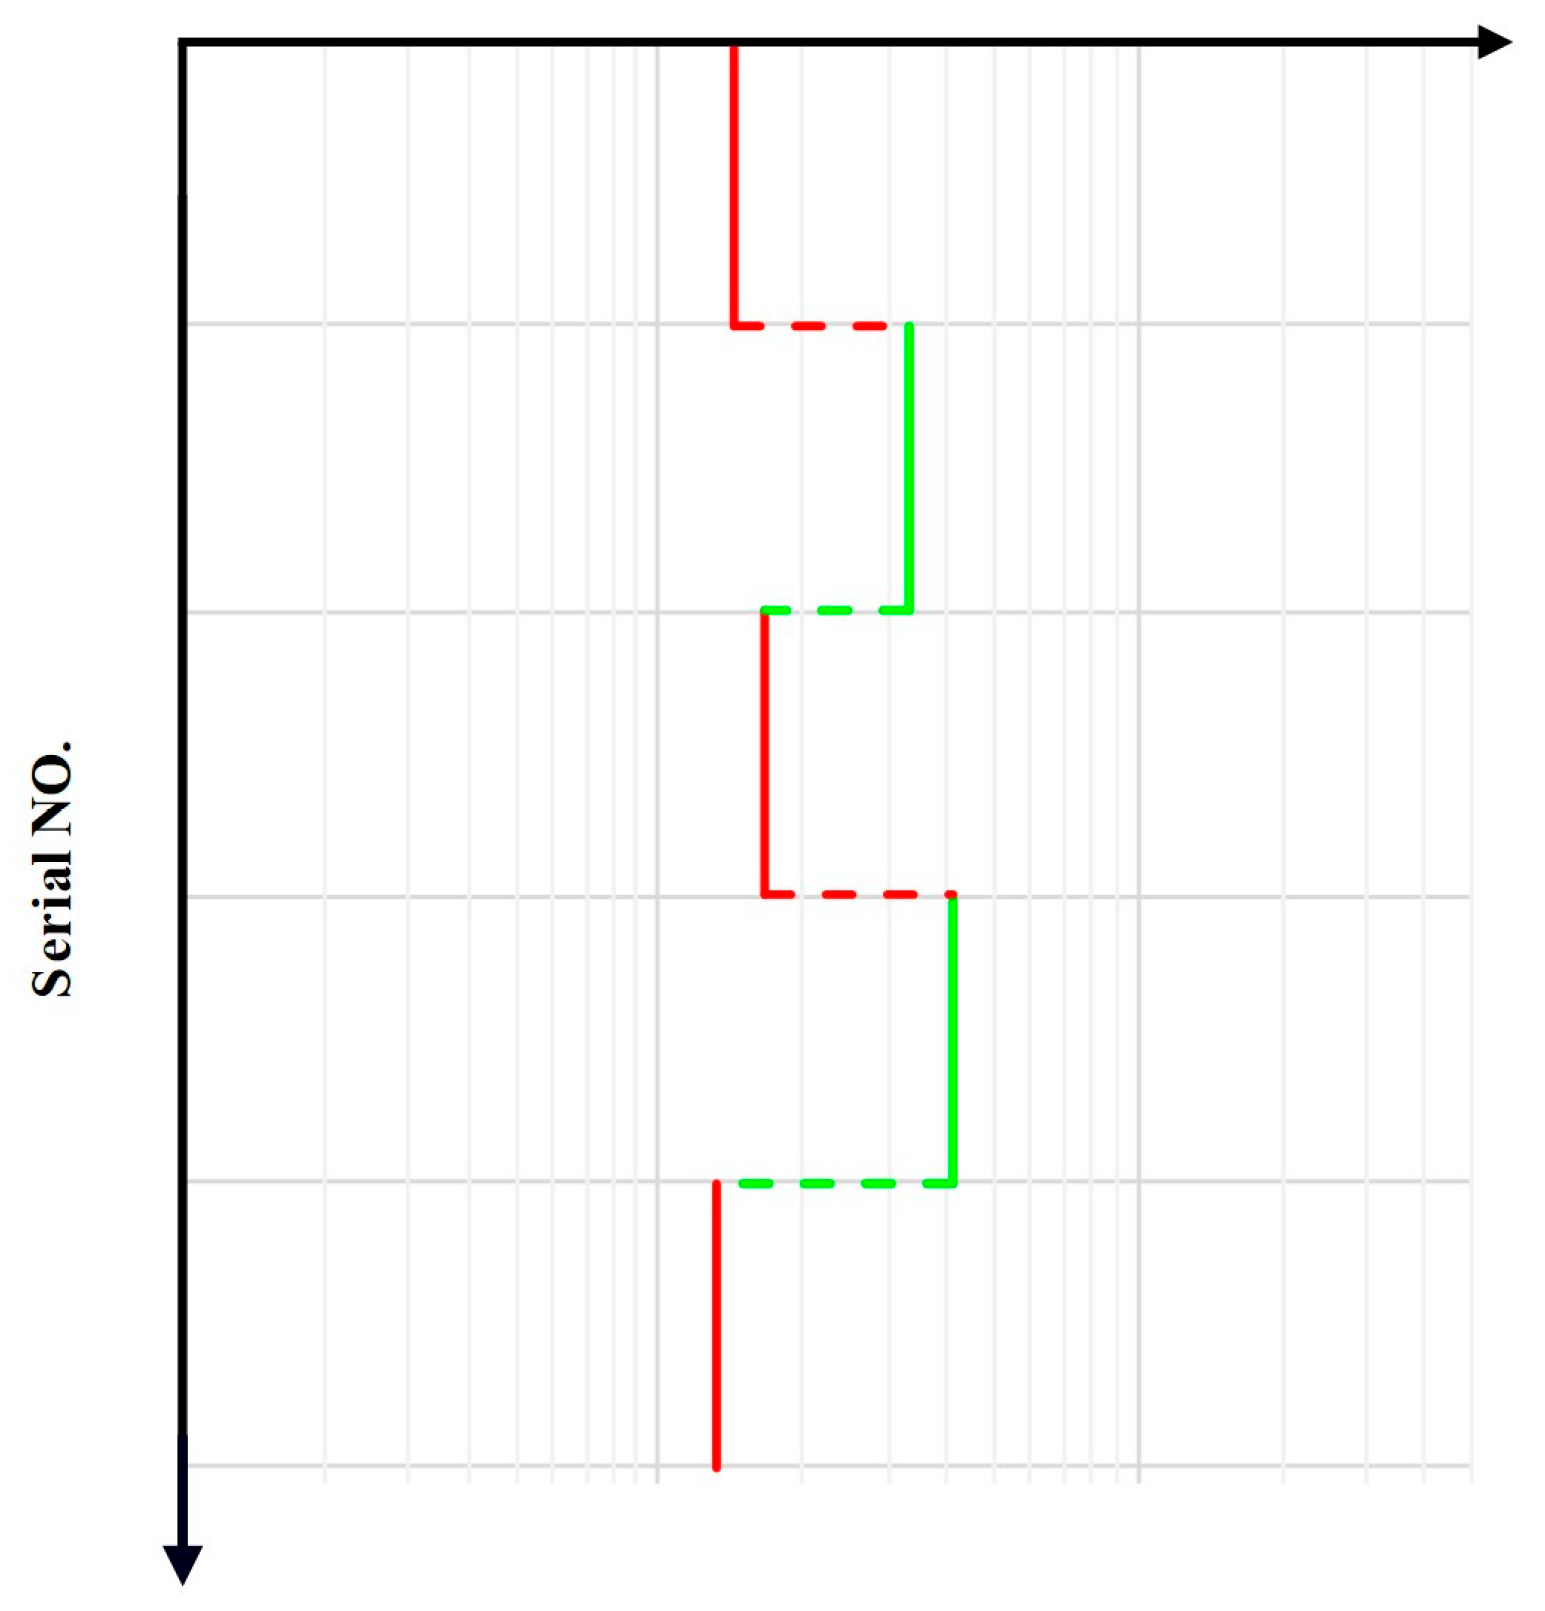
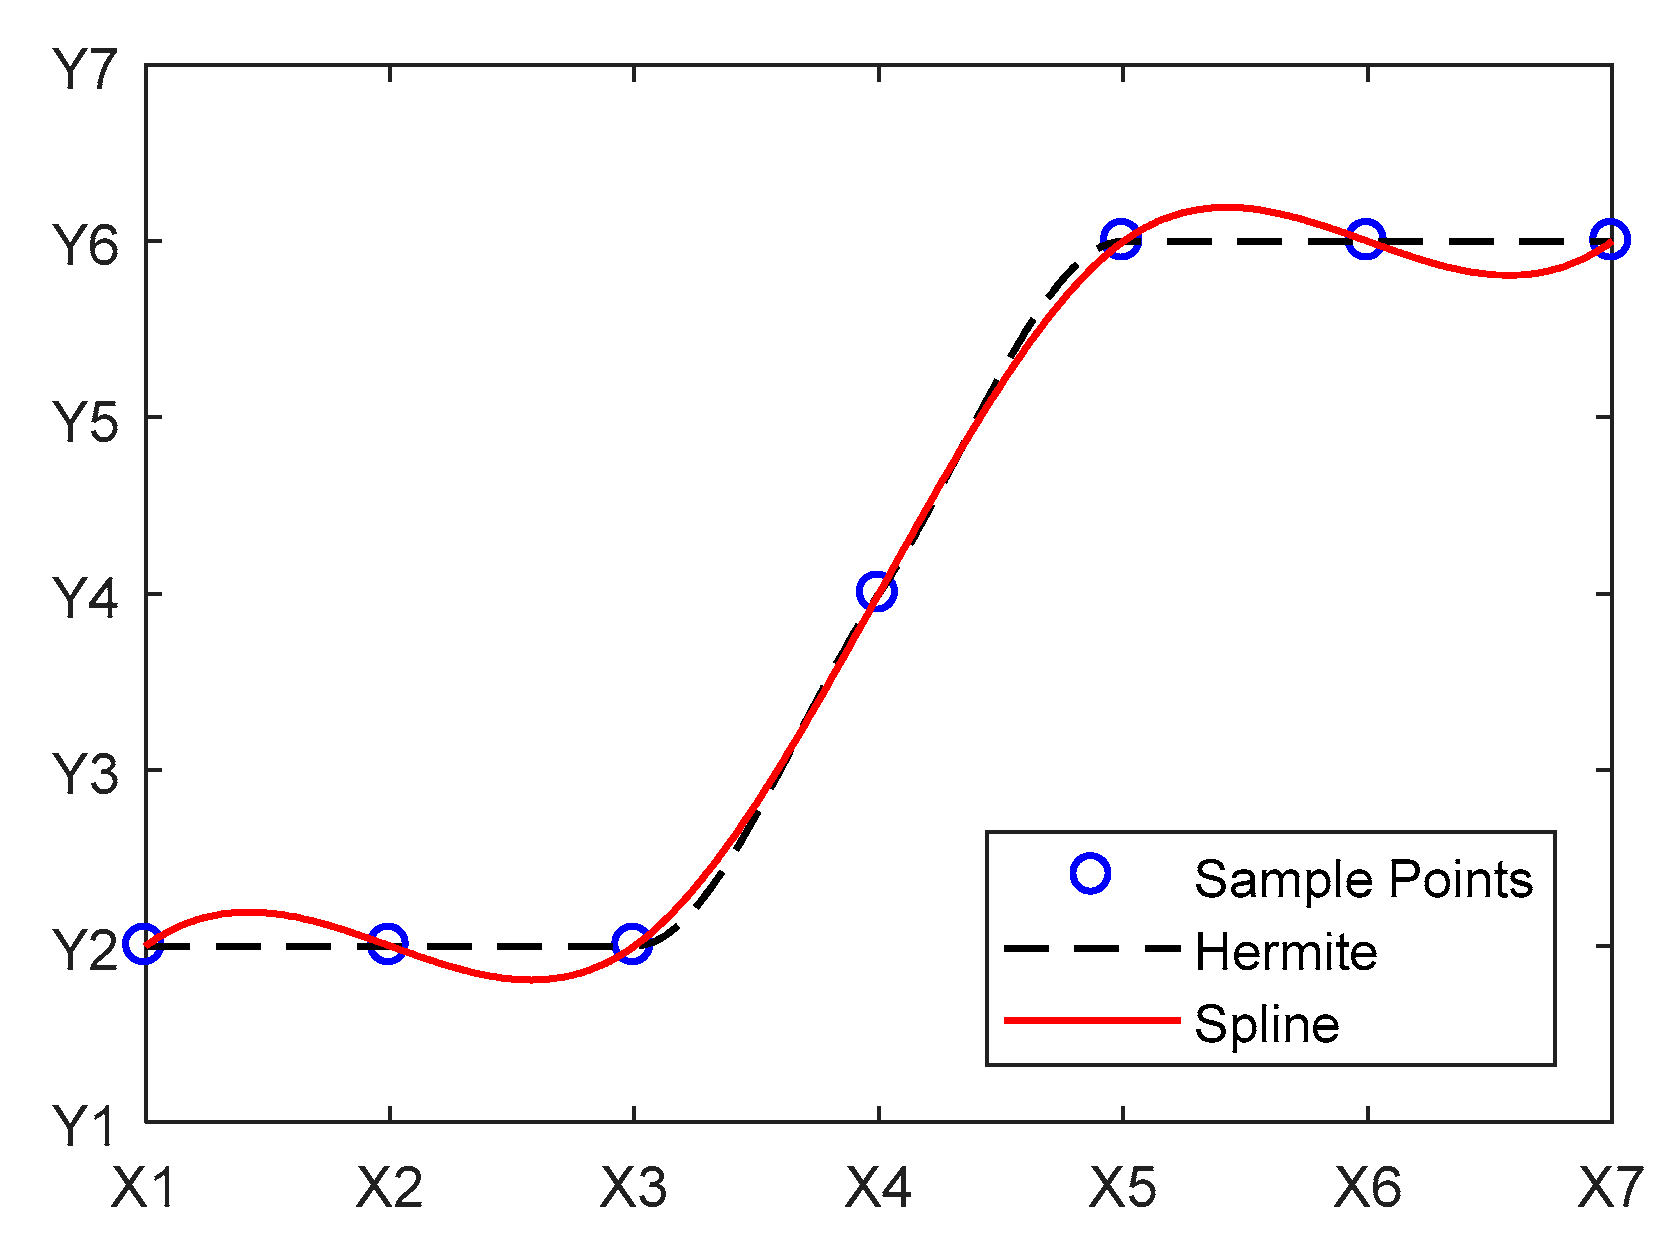
To address the aforementioned issue, this study improves upon the original method. The x-axis of the original slope method is replaced with the reciprocal of the difference between the later and earlier terms of the evaluation indicator. This has mathematical significance when performing differentiation on the indicator (Figure 6). At the same time, considering the large number of evaluation indicators and the excessively sharp variations in the computed curves, an interpolation method is applied to preserve the shape of the ascending curve. The curve is interpolated, and the derivative of the interpolated curve sequence is calculated. The computed curve is then subjected to filtering interpolation to prevent excessively abrupt changes. A cubic spline interpolation function is used for filtering interpolation, which, compared with other interpolation functions, has the advantage of ensuring the smoothness of the curve (Figure 7) and eliminating large-scale curvature mutations. Finally, different reservoir types are determined based on the change interval of the filtered curve.
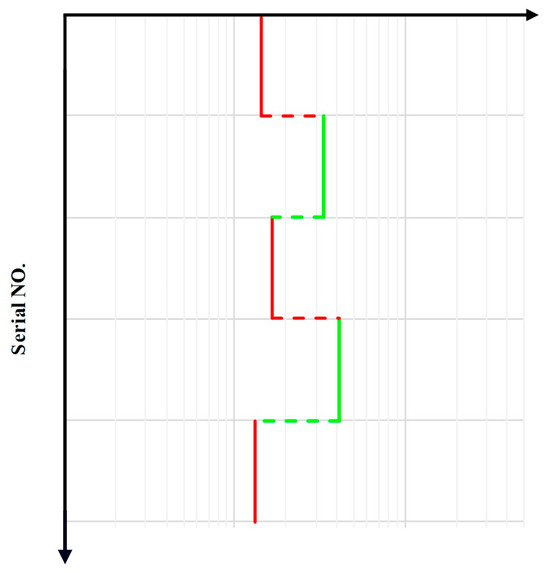
Figure 6.
Slope approach semi-log plot.

Figure 7.
Comparison of spline and Hermite.
In summary, the new reservoir classification involves deriving new evaluation indicators from the T2 spectrum after performing principal component dimensionality reduction. These indicators are then arranged in ascending order, and interpolation is used to reduce the number of original sample points while preserving the shape of the original curve. The reciprocal of the difference between the later and earlier terms is calculated to obtain a new curve. After applying cubic spline interpolation to the new curve, points where the slope changes are selected as the markers for reservoir type classification. In this study, the criterion for selecting slope mutation points to divide the reservoir types is based on the n standard points with the largest slopes. This allows the reservoir to be classified into n + 1 types. In theory, each inflection point of the slope can be considered a change node for reservoir types. However, using all inflection points would result in an excessively large number of reservoir types. Therefore, in this study, the reservoirs in the target area are divided into four classes by selecting the first three points with the most significant slope changes.
4. Reservoir Type Division Results and Rock Physical Significance
4.1. Reservoir Type Classification Results
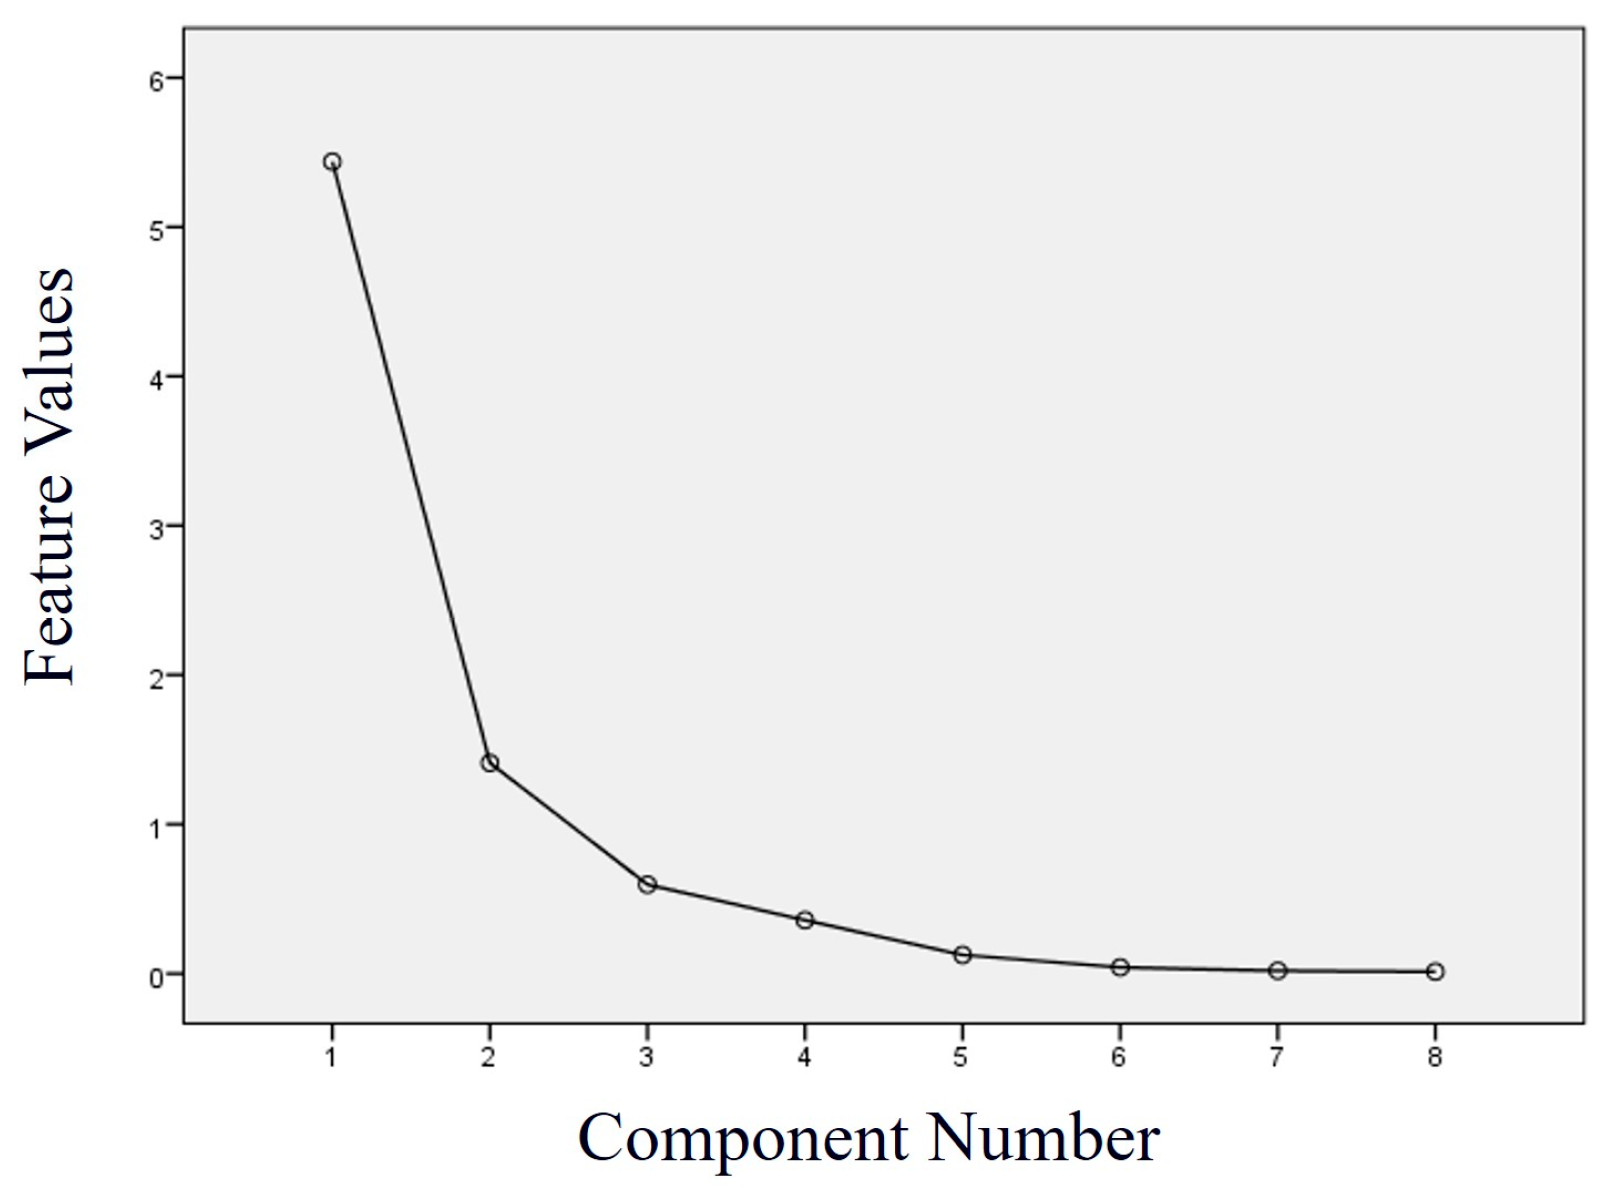
Based on the method’s principles, PCA dimensionality reduction is first applied to the T2 spectrum-derived parameters. Figure 8 shows the corresponding scree plot. Combining it with the principal component analysis table (Table 2) shows that the first two principal components after dimensionality reduction account for 85.598% of the total information in the original data. This variance contribution rate indicates that the majority of the valid information from the selected sample set in the study area can be retained through principal components Y1 and Y2.
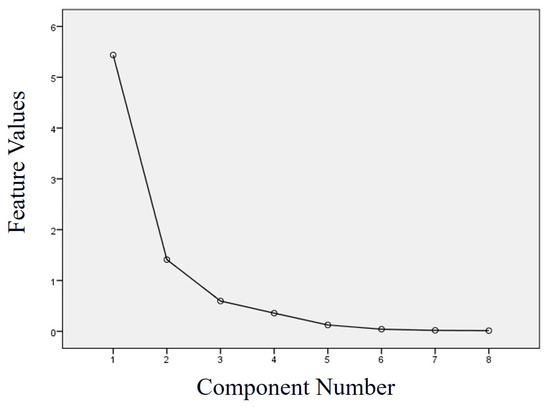
Figure 8.
A scree plot of the principal component analysis results.
Table 2.
Principal component analysis table.
Table 3 presents the component matrix from the principal component analysis, which details the specific composition of the two principal components. Analysis of Table 3 shows that principal component Y1 primarily consists of the first six parameters, excluding the sorting coefficient and variation coefficient. These parameters mainly reflect the pore size and the proportion of pore intervals in reservoir rocks, meaning that principal component Y1 mainly characterizes the pore structure of the reservoir rock. On the other hand, principal component Y2 has significantly lower values for the first six coefficients that represent pore size and pore interval proportion, and is mainly composed of the sorting coefficient and variation coefficient, which reflect the sorting characteristics of the pores. Thus, the principal component Y2 primarily characterizes the morphological features of the NMR relaxation spectrum.
Table 3.
Table of the proportion coefficients of the original parameters in each principal component of the two groups of principal components.
By using the principal component analysis matrix and the variance contribution rate table, the specific calculation formulas for principal component 1 (Y1) and principal component 2 (Y2) are derived as follows:
After determining the expressions for the two principal components, the comprehensive evaluation index can be written based on the variance percentages as follows:
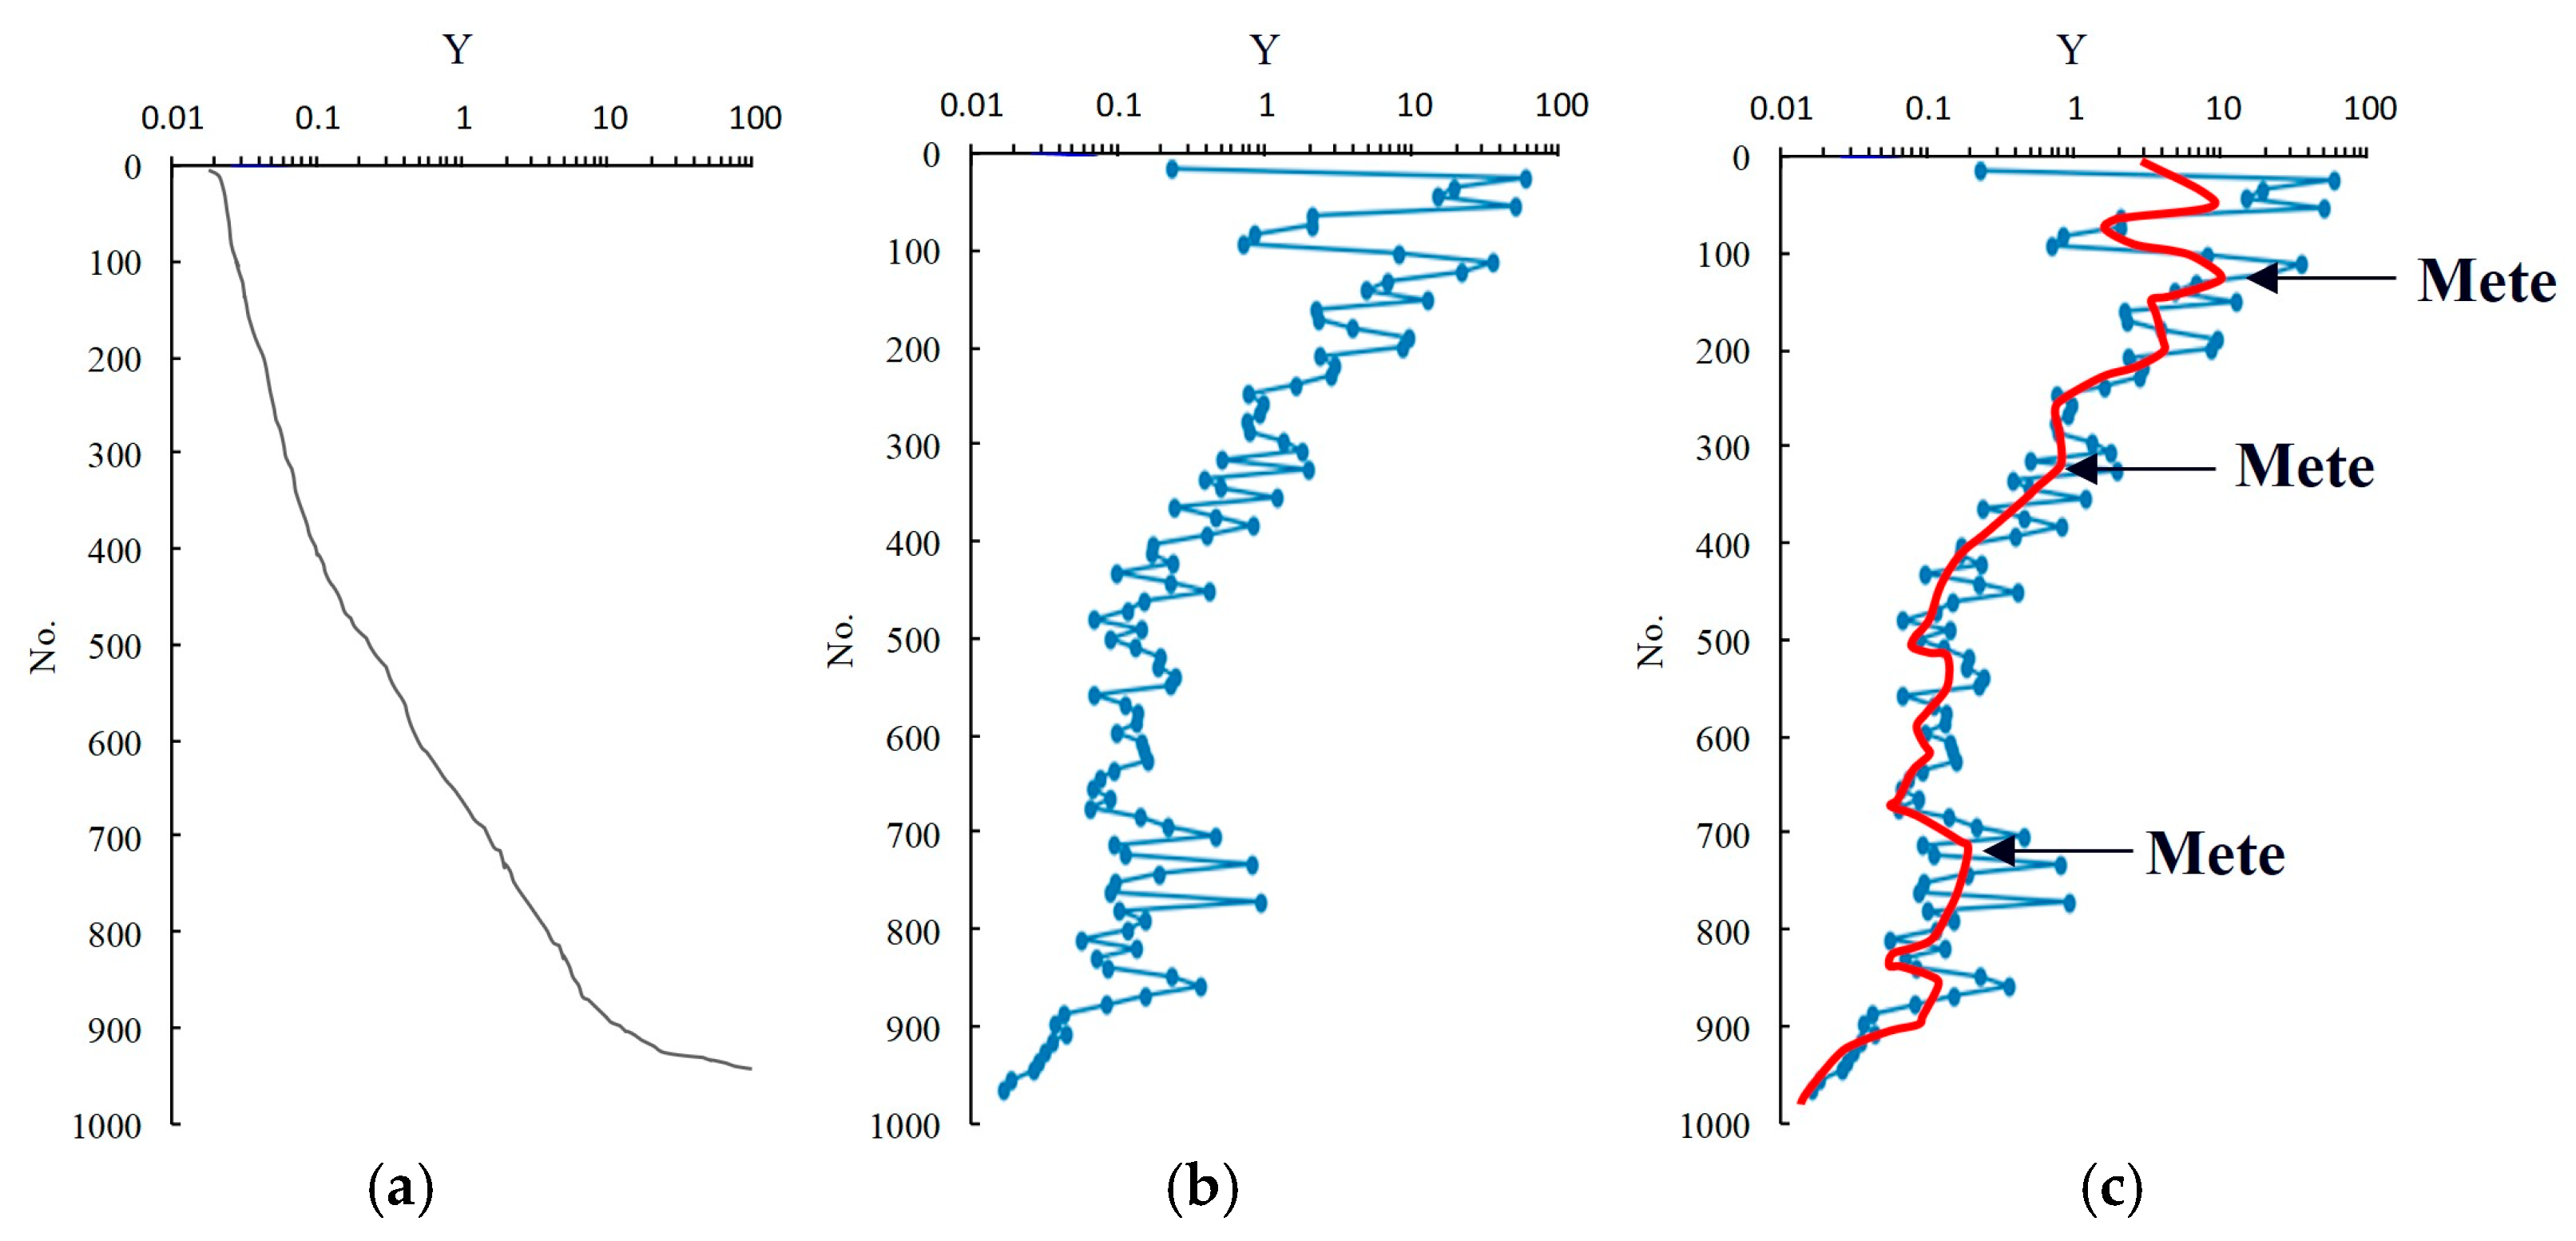
Equation (5) serves as the evaluation criterion in this study. Based on this new metric, a classification method is employed to categorize reservoir types. Given that the focus of this research is carbonate reservoirs, data from the sandstone sections were excluded. The new metric derived from the carbonate data was then ordered and interpolated (Figure 9a). The reciprocal difference between subsequent and preceding values was calculated (Figure 9b), and the curve was smoothed through cubic interpolation to identify the inflection points. It is important to note that, due to the complex and diverse pore structures of the reservoirs, if each inflection point were to be used as a basis for classification, an excessive number of reservoir types would result. Therefore, three points with the most significant changes in slope were selected as inflection points (Figure 9c). Consequently, the carbonate reservoirs were divided into four categories: Reservoir Type 1 (RT1), Reservoir Type 2 (RT2), Reservoir Type 3 (RT3), and Reservoir Type 4 (RT4). Table 4 presents the boundary values of the indicators for each reservoir type.

Figure 9.
The process map of carbonate reservoir type classification of the Asmari formation in the study area: (a) calculate the shape of the curve of the interpolation after the evaluation index Y is sorted; (b) calculate the derivative of the two differences; (c) determine three inflection points after smoothing the curve. The blue lines are the calculation results of the reciprocal of the difference, and the red lines are the smoothed and filtered curves.
Table 4.
The range of the reservoir type division index of this method.
4.2. Reservoir Characteristics and Petrophysical Significance
After categorizing the reservoir types using the method outlined in this study, the characteristics and petrophysical significance of each reservoir type were determined. From the perspective of the indicator itself, a higher value indicates a larger T2 geometric mean, a higher proportion of macropores, and better sorting. In other words, as the evaluation indicator decreases, the pore throat sizes of the reservoirs become smaller, and their permeability deteriorates. This conclusion was validated using core experimental data.
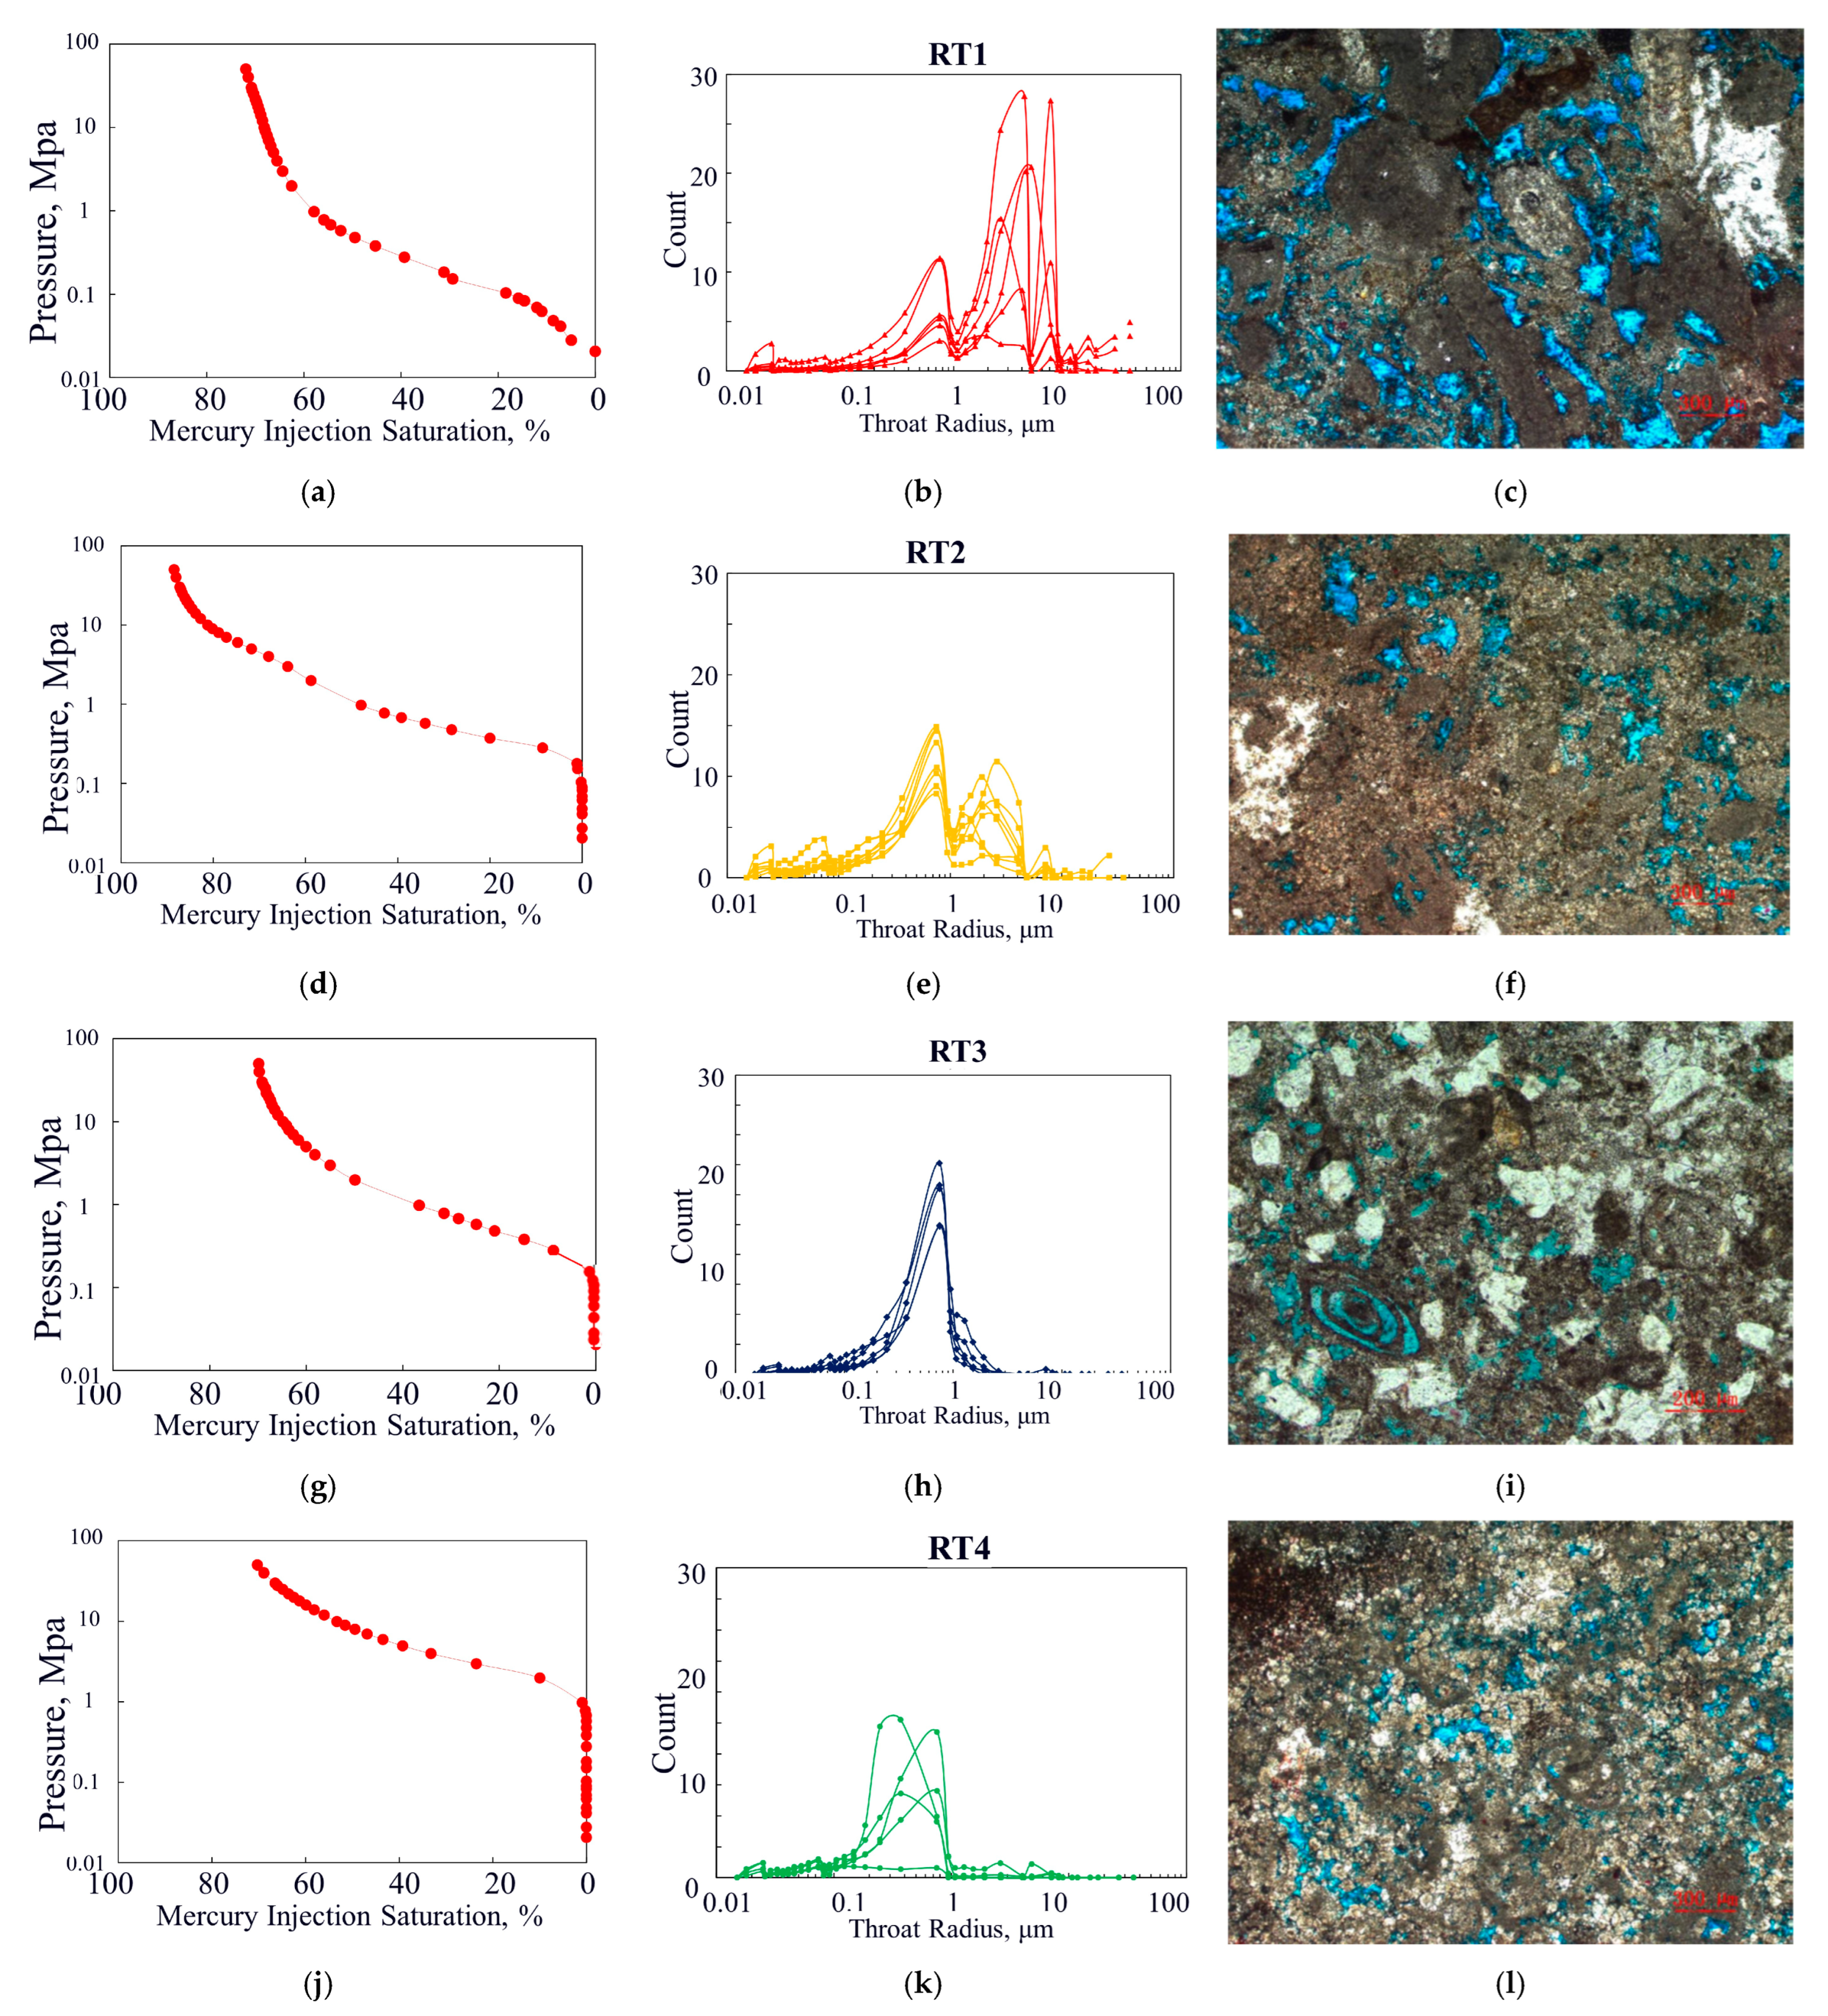
For the RT1 reservoir, the capillary pressure curve is located at the bottom of the graph (Figure 10a). This type of sample represents the reservoir with the best pore structure, exhibiting excellent petrophysical properties, with an average porosity of 15.1% and an average permeability of 22.16 mD. In terms of pore structure parameters, the maximum throat radius is greater than 3.8 μm, with an average of 11.79 μm. The displacement pressure is less than 0.2 MPa, with an average value of 0.10 MPa, which is smaller than other reservoir types. The pore throat distribution frequency shows a multimodal pattern, with 3–4 peak values, and the coarsest throat typically falls within the 3–8 μm range (Figure 10b). The pore types in this sample are relatively simple (Figure 10c), primarily consisting of intergranular solution pores.
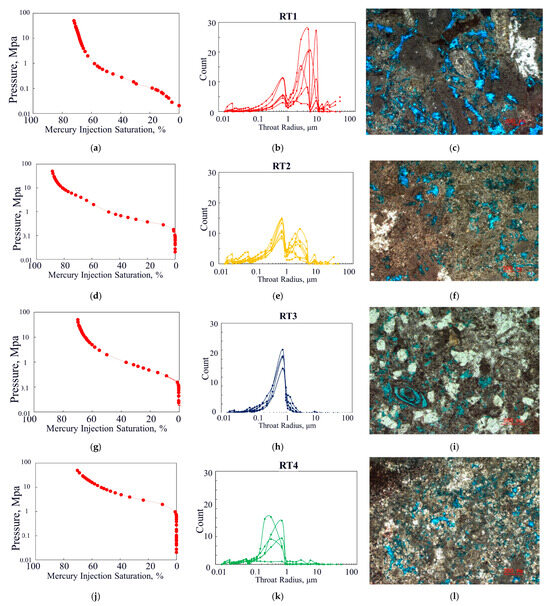
Figure 10.
The capillary pressure curve characteristics, pore throat distribution characteristics, and typical core casting thin section images of the carbonate reservoir of the Asmari formation in the study area: (a) capillary pressure curve of RT1 reservoir; (b) the pore throat radius distribution map of RT1 reservoir; (c) core casting thin sections of RT1 reservoir; (d) capillary pressure curve of RT2 reservoir; (e) the pore throat radius distribution map of RT2 reservoir; (f) core casting thin sections of RT2 reservoir; (g) capillary pressure curve of RT3 reservoir; (h) the pore throat radius distribution map of RT3 reservoir; (i) core casting thin sections of RT3 reservoir; (j) capillary pressure curve of RT4 reservoir; (k) the pore throat radius distribution map of RT4 reservoir; (l) core casting thin sections of RT4 reservoir.
For the RT2 reservoir, the capillary pressure curve exhibits a relatively steep plateau section (Figure 10d). The average porosity of the reservoir is 9.53%, with an average permeability of 6.61 mD. The maximum throat radius ranges from 1.5 to 3.8 μm, with an average of 3.06 μm. The displacement pressure ranges from 0.2 to 0.45 MPa, with an average of 0.29 MPa. The pore throat distribution frequency shows a bimodal pattern, with the primary focus on the region corresponding to the smaller throats in the post-peak value range. The first peak occurs at values greater than 1 μm, while the second peak is located at 0.7 μm (Figure 10e). The pore types in this sample are diverse, including dolomite intergranular pores, intergranular solution pores, biogenic cavity pores, and microfractures (Figure 10f).
For the RT3 reservoir, compared with RT2, the capillary pressure curve exhibits a much flatter plateau section (Figure 10g). The average porosity of the reservoir is 14.52%, with an average permeability of 1.31 mD. The maximum throat radius ranges from 1 to 1.5 μm, with an average of 1.17 μm. The displacement pressure ranges from 0.45 to 0.7 MPa, with an average of 0.64 MPa (Figure 10h). This reservoir type, compared with RT2, has a higher porosity but a significantly lower permeability, increased displacement pressure, and decreased maximum throat radius, sorting coefficient, and variation coefficient. Its pore structure is poorer than that of RT2. The pore throat distribution frequency follows a unimodal pattern, with the majority concentrated at around 0.7 μm. The primary pore types are dolomite intergranular pores and a small amount of intergranular solution pores (Figure 10i).
For the RT4 reservoir, the capillary pressure curve is positioned at the uppermost part of the figure (Figure 10j), with an average porosity of 8.40% and an average permeability of 0.66 mD. The maximum pore throat radius is less than 1 μm, with a mean value of 0.75 μm. The displacement pressure exceeds 0.7 MPa, with a mean of 1.29 MPa (Figure 10k). This reservoir type is characterized by poor physical properties, a small maximum pore throat radius, and high displacement pressure. The pore throat distribution frequency exhibits a unimodal pattern, with a peak frequency lower than that of RT3 and a wider peak distribution interval compared with RT3. In comparison to RT3, the pore throat radius is finer, distributed between 0.2 and 0.7 μm. Pores are poorly developed in such samples, with occasional intercrystalline pores in dolomite and minor microfractures (Figure 10l).
The comparative analysis presented above indicates that as the evaluation parameters decrease, the permeability of the reservoir diminishes correspondingly. This is reflected in both the morphology and distribution of the capillary pressure curves as well as the radius dimensions of the maximum pore throat system. Specifically, from RT1 to RT4 reservoirs, the mercury injection pressure progressively increases, the capillary pressure uplift becomes increasingly gradual, and the maximum pore throat radius steadily diminishes. This typically suggests a continual decline in the reservoir’s permeability. Existing thin section data reveal that RT1 reservoirs are primarily composed of dolomite and arenaceous limestone, RT2 reservoirs are predominantly characterized by magnesian dolomite with some dolomitic limestone, RT3 reservoirs consist mainly of limestone, while RT4 reservoirs are more complex in lithology, exhibiting poor pore development and limited connectivity, and they are characterized by relatively dense dolomite or limestone. It should also be noted that the limited thin-section samples from the Asmari formation in the study area do not provide a definitive representation of the pore space types.
To further elucidate the differences in NMR characteristics across various reservoir types, a more in-depth analysis was conducted by combining the classification results with the T2 NMR spectrum features. The classification indicator (Y) is derived from two principal components, Y1 and Y2, which are computed based on the T2 spectrum-derived parameters. Figure 11 presents box plots that illustrate the distribution of four parameters indicative of pore throat characteristics across different reservoir types. Panel 11a shows the variation in the proportion of medium-sized pores. Given the difficulty in accurately determining the T2 cutoff value for carbonate reservoirs, the assumed cutoff values in this study are 3 ms and 92 ms. This metric can be interpreted as the proportion of capillary-bound fluids. Panel 11b illustrates the variation in the proportion of large pores, representing the pore space where the transverse relaxation time exceeds 92 ms. This can be interpreted as the proportion of movable fluids. In theory, a T2 spectrum with a greater rightward shift typically reveals a larger pore space and a higher proportion of large pores. Upon examining the box plots of these two indicators, it is evident that, from RT1 to RT4 reservoirs, the proportion of medium-sized pores increases while the proportion of large pores decreases. This trend suggests that, as the flow capacity of the reservoir decreases, the proportion of bound fluids increases, while the proportion of movable fluids decreases. These findings are consistent with core analysis results. For example, the mercury injection data for RT1 reservoirs indicate that this reservoir type has the largest pore throat radii, with the NMR T2 spectrum predominantly representing large pore components and the highest proportion of movable fluids compared with other reservoir types. Similarly, the proportion of bound fluids in RT1 reservoirs is lower than that of the other reservoir types. Panel 11c illustrates the response of T2R65 across various reservoir types. T2R65 corresponds to the transverse relaxation time at which the pore volume in the T2 spectrum reaches 65%, and it reflects the pore throat size. A larger T2R65 value indicates that the peak of the corresponding NMR T2 spectrum shifts toward a longer relaxation time, signifying a larger pore space in the reservoir. Panel 11d shows the T2 geometric mean, which is the logarithmic average of the T2 relaxation times. A higher T2 geometric mean typically corresponds to a larger pore throat radius. Figure 11c,d demonstrate that RT1 reservoirs exhibit the largest values for both T2R65 and the T2 geometric mean compared with other reservoir types, indicating that RT1 reservoirs have the largest pore spaces. As the permeability of the reservoir decreases, both T2R65 and the T2 geometric mean gradually decrease from RT1 to RT4 reservoirs, signifying a reduction in pore space and a gradual decrease in pore throat size.
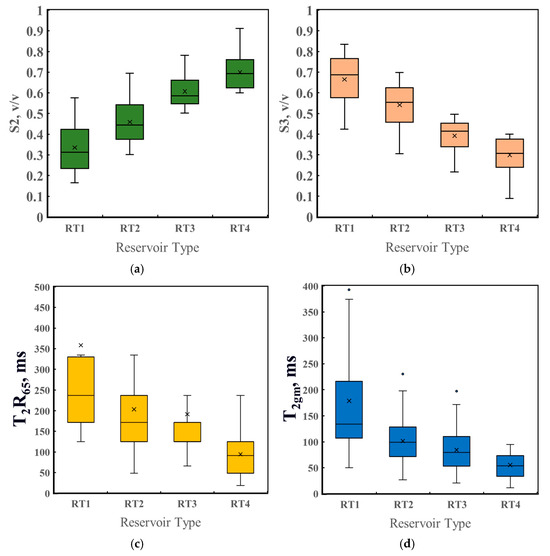
Figure 11.
Box plots of T2 spectrum derivative parameters for different types of reservoirs: (a) the proportion of S2; (b) the proportion of S3; (c) T2R65; (d) T2 geometric mean.
This section provides an explanation of the core experiments and the classification results of reservoir types based on the NMR T2 spectra. The study shows that there are significant differences in the permeability of the four reservoir types classified within the Asmari formation carbonate rock in the research area. Moreover, indicator Y used for classification retains most of the information from the NMR T2 spectra, effectively reflecting the pore structure characteristics and pore throat sizes of the reservoirs.
4.3. Reservoir Permeability Evaluation
Based on the four classified reservoir types, further characterization is conducted by combining core porosity–permeability data. Figure 12 shows the cross-plot of core porosity and core permeability for the study area, illustrating the relationship between porosity and permeability for the four core types. Table 5 provides the permeability fitting formulas for each reservoir type. It should also be noted that some cores belonging to RT1 or RT2 reservoir types contain fractures. Although the porosity of these cores does not exceed 10%, their permeability is relatively high, and these samples were excluded from the permeability fitting. Analysis of the fitting results reveals that the RT4 reservoir type has the lowest goodness of fit for permeability calculation, with a value of 0.48. As the reservoir permeability increases, the formula coefficients and exponents increase. For the RT1 reservoir type, the goodness of fit for permeability calculation reaches 0.68. When no reservoir classification is applied and porosity–permeability fitting performed directly, the goodness of fit for the permeability formula is only 0.24. In contrast, after classification, the fitting accuracy of permeability is significantly improved.
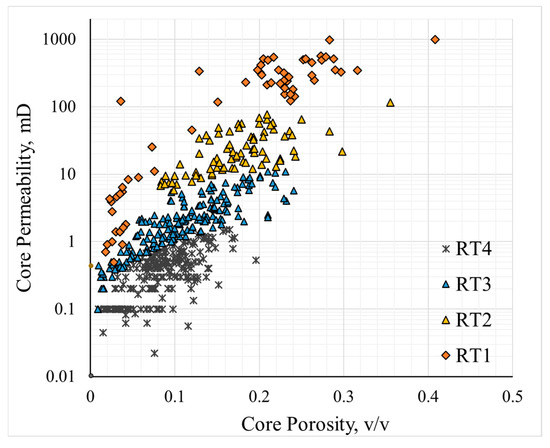
Figure 12.
Cross-plot of core porosity and core permeability in different reservoirs.
Table 5.
The fitting formulas for core porosity and core permeability under different conditions.
5. Discussion
This study proposes a reservoir classification method based on nuclear magnetic resonance logging data and discusses three aspects with regard to this method.
5.1. Advantages of the New Method
The reservoir classification method proposed in this study is based on nuclear magnetic resonance logging data. The evaluation index can finely characterize pore throat size and pore space. Compared with the Winland R35 method, the method in this study does not require a large amount of mercury injection test data. In the study area, the number of core experiments is limited, and the number of mercury injection test samples is small, making it difficult to establish a relationship between the logging curve and reservoir types. Therefore, the Winland R35 method is not applicable in this block. Additionally, the Winland R35 method considers relatively few factors, whereas the new method makes full use of the information in the nuclear magnetic resonance T2 spectrum, providing a higher information coverage rate than the Winland R35 method.
In previous studies, Zhu et al. [37] considered using the T2 spectrum to construct pseudo-capillary curves. In practical applications, especially when dealing with carbonate reservoirs with strong heterogeneity, the difficulty and accuracy of constructing pseudo-capillary curves need to be considered. In the method proposed in this study, the construction significance of the T2R35 and T2R65 parameters is similar to that of R35 and R65 in the capillary curves, and no further conversion is required, thus avoiding the introduction of iterative errors.
The FZI method relies on a large amount of core porosity and permeability data. Although the classification results obtained using the FZI method show a good pore–permeability relationship for each type of reservoir, its interpretability is poor, and its correlation with logging data is weak, limiting its generalizability. There are few core samples in the study area, making the use of the FZI method difficult; additionally, the delineated types are not necessarily representative, which is a technical challenge in this study area; however, future research can develop this idea further, and the boundaries of reservoir type delineation can be combined with the FZI method when core data are sufficiently large to further supplement the correlation with flow units. The new method proposed in this study is based on nuclear magnetic resonance logging data, significantly improving its generalizability; moreover, the core experimental data verify that the correlation of core porosity–permeability relationships is significant for each type of reservoir classified using this method.
5.2. Improvement of Permeability Accuracy
The accuracy of permeability evaluation serves as a critical benchmark for assessing reservoir classification methods. In this study, a newly drilled well in the research area was selected for analysis, and reservoir classification was performed using NMR data. Permeability was then determined using the formula provided in Table 5. For comparison, permeability was also determined using the conventional method of geological layer subdivision. Figure 13a presents a cross-plot of permeability values obtained via the traditional method versus core permeability, while Figure 13b displays a cross-plot of permeability derived from the new model, based on the reservoir classification method proposed in this study. The results in Figure 13 indicate that the permeability model developed using the new classification method exhibits higher accuracy when applied to the new well. Of the 78 sample sets, only two displayed errors greater than 1, whereas the conventional geological layer-based permeability evaluation method demonstrated relatively lower accuracy. This disparity arises from the challenges in capturing the strong heterogeneity of the reservoir using traditional methods. The root mean square error (RMSE) was reduced from 0.34 mD to 0.21 mD, and the magnitude of permeability error decreased from 0.58 to 0.40. These results further substantiate the efficacy and broader applicability of the proposed reservoir classification method.
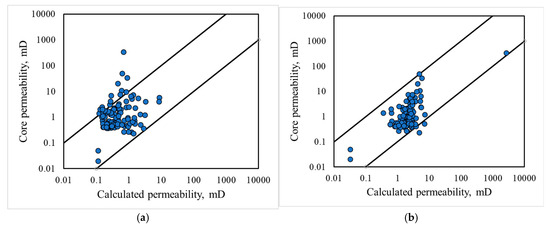
Figure 13.
Cross-plot of permeability measurement results and core permeability: (a) cross-plot of the permeability measured using the traditional model and the core permeability; (b) cross-plot of the results of the new model and the core results after the reservoir is divided based on the method proposed in this study.
5.3. Limitations of the Method
This method has certain limitations, which are discussed in three aspects:
- Generalizability: While the proposed method improves upon the traditional approach in terms of generalizability, it faces challenges when applied to wells lacking NMR logging data. In such cases, one possible solution is to develop a data-driven model that maps conventional logging curves to reservoir-type labels using data from wells with NMR data. However, this approach is not without its drawbacks, as it inevitably introduces errors that may affect the subsequent calculation of reservoir parameters;
- Number of Reservoir Types: The number of reservoir types can be controlled to some extent. If the coverage of NMR logging data is extensive in the study area, it is possible to increase the number of reservoir types to enhance the accuracy of reservoir characterization and parameter evaluation. However, this requires more core data to support the classification. In practical scenarios, many development wells lack NMR logging data, which limits the number of reservoir types that can be defined. An excessive number of types would lead to increased errors in generalization, thereby reducing the reliability of parameter evaluation. In this study, four reservoir types were classified (with three inflection points), considering both the quantity of core data and its coverage. Additionally, while this method addresses the classification of pore-type reservoirs, it is not applicable to fracture-type reservoirs, as NMR data cannot effectively characterize fractured reservoirs;
- Stability of NMR Data: The detection range of NMR logging data is limited, and data distortion can occur in enlarged borehole sections. Therefore, when applying the method proposed in this study, it is essential to carefully check the quality of the NMR logging data;
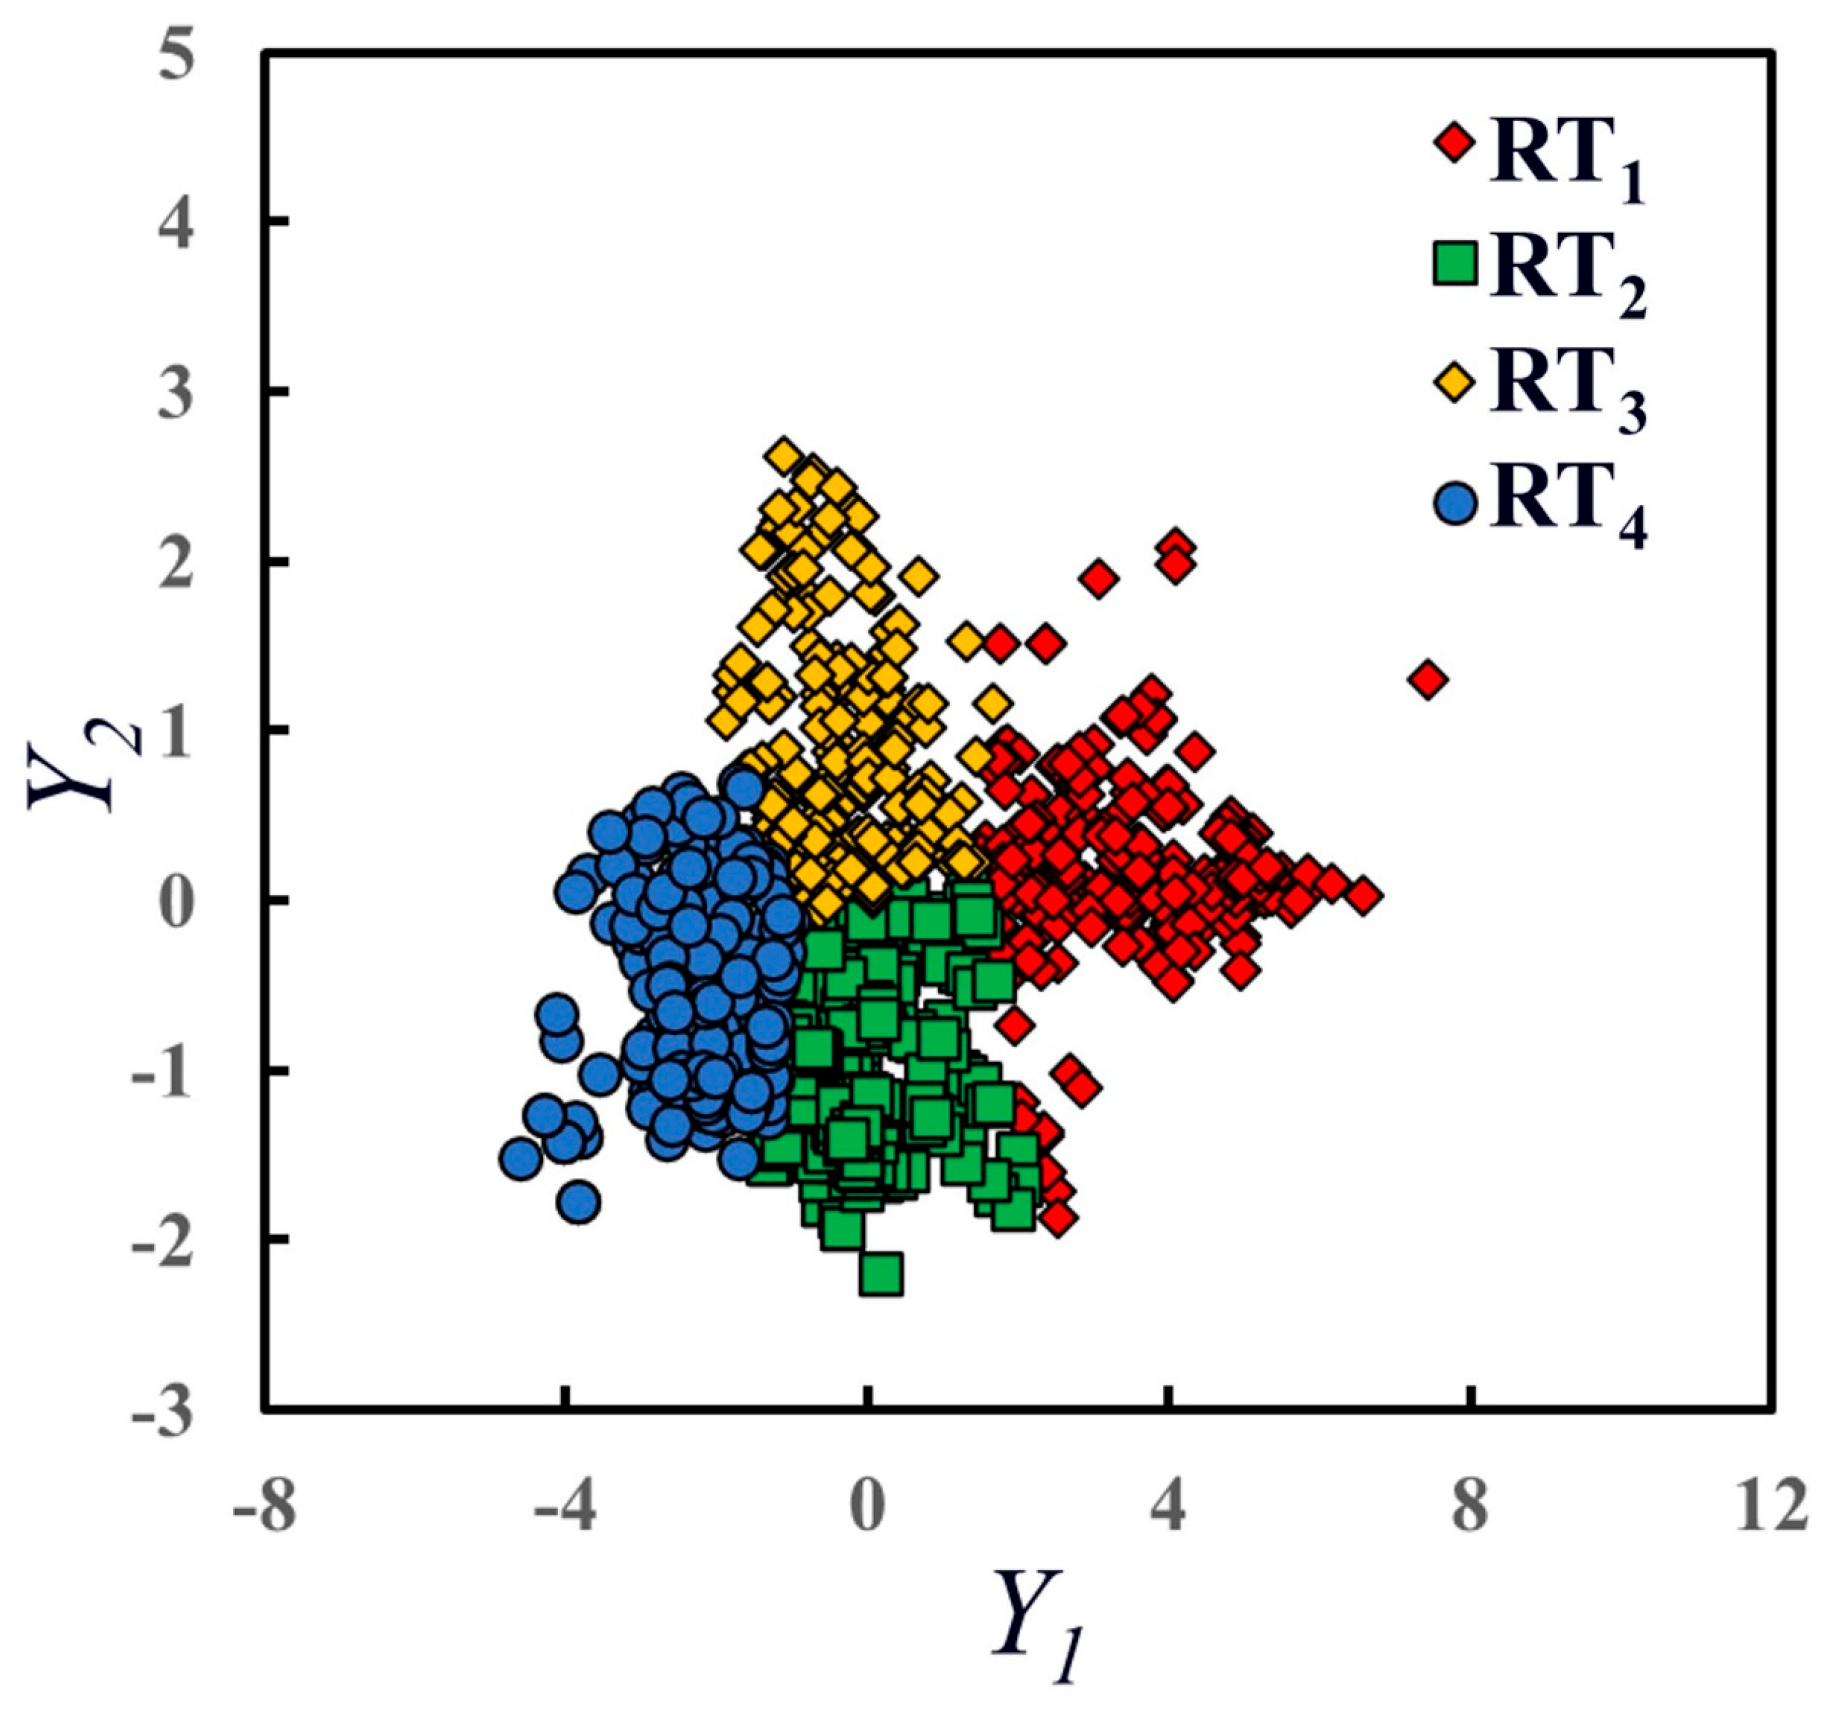
- Improvable forms of reservoir typing methods: In this study, the improved slope method is applied to classify reservoir types, though other mathematical methods, such as cluster analysis, can also be used for classification. Figure 14 shows the results of clustering based on the principal components Y1 and Y2, using the K-means clustering method to categorize the reservoirs into four types. However, it is challenging to interpret the geological significance of these four reservoir types after classification, particularly because the significance represented by the two principal components differs greatly. Furthermore, future research could explore automated algorithms and testing approaches to reduce the influence of human factors. It is important to note that the method used to classify reservoir types should be based on the richness of actual data and information in the study area, especially when determining the number of reservoir types.
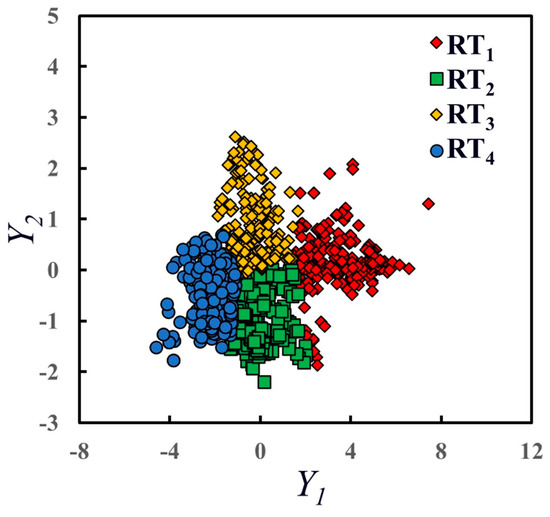 Figure 14. Plot of the results of K-means clustering for both principal components.
In summary, this method offers a classification approach for carbonate reservoirs in the Asmari formation of the M oil field. When dealing with carbonate reservoirs in different geological contexts, it is crucial to integrate actual data and reservoir types with the proposed method for classification. Additionally, if imaging or array acoustic data are available to characterize fractured sections, they can be further combined with other specialized logging data to refine the classification of reservoir types.
6. Conclusions
This study addresses the challenge of strong heterogeneity in the carbonate reservoirs of the Asmari formation in the M oil field, located in the Middle East. A new reservoir classification method based on NMR logging facies is proposed. By integrating multi-dimensional pore structure characterization with mathematical dimensionality reduction techniques, the method effectively divides complex reservoir types. The main conclusions are as follows:
- (1)
- A reservoir classification method suitable for highly heterogeneous carbonate reservoirs is established based on pore structure parameters extracted from the NMR T2 distribution (e.g., T2 geometric mean, T2R35/R50/R65, and pore component ratios), combined with PCA for dimensionality reduction and an improved slope method. This method uses a comprehensive evaluation index (Y) that reflects pore throat size, connectivity, and distribution characteristics to classify the Asmari formation carbonate reservoirs into four types (RT1 to RT4). The classification results show good consistency with capillary pressure curves and cast thin-section pore types, validating the reliability of the method;
- (2)
- The various reservoir types exhibit significantly different porosity–permeability relationships: the R2 of permeability of the RT1 to RT4 reservoirs are 0.68, 0.62, 0.57, and 0.48, respectively, all of which are notably higher than the global goodness-of-fit (0.24) when not classified. The new method, by precisely characterizing pore structure differences, addresses the issue of multiple solutions in traditional permeability prediction using only porosity. In the application to new wells, the RMSE of permeability calculations decreased from 0.34 mD with traditional layering methods to 0.21 mD, and the magnitude error was reduced from 0.58 to 0.40, confirming its superiority in permeability prediction;
- (3)
- Compared with traditional rock physics methods (such as Winland R35, FZI), this method does not need to rely on a large number of mercury injection experiments or core physical property data, and only nuclear magnetic resonance logging can achieve reservoir classification, which is significantly enhanced. However, its limitation is that it relies on the coverage of nuclear magnetic resonance data, and its applicability to fractured reservoirs is insufficient. It is also greatly affected by the quality of logging data (such as borehole enlargement). In the future, it can be combined with imaging logging or machine learning models to further expand its application scenarios in complex reservoirs.
This study provides a new approach for the detailed evaluation of highly heterogeneous carbonate reservoirs. The established reservoir classification system can directly serve in permeability prediction, flow unit division, and development plan optimization. It holds significant reference value for the exploration and development of carbonate reservoirs with similar geological backgrounds in the Middle East and globally.
Author Contributions
Conceptualization, B.G., J.G. and H.L.; methodology, J.G., H.L. and Z.Z.; software, C.H., H.L., J.H. and J.H.; validation, J.G., H.L. and B.G.; formal analysis, C.H. and J.H.; investigation, C.H. and J.H.; resources, B.G.; data curation, Z.Z. and B.G.; writing—original draft preparation, J.G.; writing—review and editing, Z.Z.; visualization, C.H.; supervision, J.H.; project administration, J.H.; funding acquisition, B.G., J.H. and J.G. All authors have read and agreed to the published version of the manuscript.
Funding
This work was financially sponsored by the Open Fund of the Key Laboratory of Exploration, Technologies for Oil and Gas Resources, Ministry of Education (No. K2023-02), and Major Science and Technology Projects of CNOOC Limited under the 14th Five-Year Plan (KJGG2022-0905).
Data Availability Statement
The original contributions presented in this study are included in the article. Further inquiries can be directed to the corresponding author.
Acknowledgments
The authors express their most sincere gratitude to the field workers in the M. Oilfield.
Conflicts of Interest
Authors Baoxiang Gu, Juan He, and Chen Hui were employed by CNOOC International Ltd. The remaining authors declare that the research was conducted in the absence of any commercial or financial relationships that could be construed as a potential conflict of interest.
Abbreviations
The following abbreviations are used in this manuscript:
| NMR | Nuclear magnetic resonance |
| PCA | Principal component analysis |
| RMSE | Root mean square error |
| MICP | Mercury injection capillary pressure |
| XRD | X-ray diffraction |
| T2 | Transverse relaxation time |
References
- Tong, X.; Zhang, G.; Wang, Z.; Wen, Z.; Tian, Z.; Wang, H.; Ma, F.; Wu, Y. Distribution and potential of global oil and gas resources. Pet. Explor. Dev. 2018, 45, 779–789. [Google Scholar] [CrossRef]
- Osman, M.; Farouk, S.; Sarhan, M.A. Integrated 3D reservoir modelling for the unconventional reservoir prospects: A case study of Upper Cretaceous Brown Limestone reservoir, South Geisum field, Gulf of Suez, Egypt. Geomech. Geophys. Geo-Energy Geo-Resour. 2025, 11, 15. [Google Scholar] [CrossRef]
- Hollis, C.; Vahrenkamp, V.; Tull, S.; Mookerjee, A.; Taberner, C.; Huang, Y. Pore system characterisation in heterogeneous carbonates: An alternative approach to widely-used rock-typing methodologies. Mar. Pet. Geol. 2010, 27, 772–793. [Google Scholar] [CrossRef]
- Hussein, H.S.; Mansurbeg, H.; Bábek, O. A new approach to predict carbonate lithology from well logs: A case study of the Kometan formation in northern Iraq. Heliyon 2024, 10, e25262. [Google Scholar] [CrossRef]
- Qiao, Z.; Zhu, G.; Li, S.; Shao, G.; Kang, W.; Sun, X.; Yao, Q.; Zhang, Y. Architectural characterization of carbonate tidal channels in the Mishrif formation, Southeastern Iraq. Pet. Sci. 2024, 21, 3790–3803. [Google Scholar] [CrossRef]
- Wang, M.; Xie, J.; Guo, F.; Zhou, Y.; Yang, X.; Meng, Z. Determination of NMR T2 cutoff and CT scanning for pore structure evaluation in mixed siliciclastic–carbonate rocks before and after acidification. Energies 2020, 13, 1338. [Google Scholar] [CrossRef]
- Vincent, B.; Fleury, M.; Santerre, Y.; Brigaud, B. NMR relaxation of neritic carbonates: An integrated petrophysical and petrographical approach. J. Appl. Geophys. 2011, 74, 38–58. [Google Scholar] [CrossRef]
- Clerke, E.A.; Mueller III, H.W.; Phillips, E.C.; Eyvazzadeh, R.Y.; Jones, D.H.; Ramamoorthy, R.; Srivastava, A. Application of Thomeer Hyperbolas to decode the pore systems, facies and reservoir properties of the Upper Jurassic Arab D Limestone, Ghawar field, Saudi Arabia: A “Rosetta Stone” approach. GeoArabia 2008, 13, 113–160. [Google Scholar] [CrossRef]
- Guo, J.; Zhang, Z.; Zhang, C.; Zhao, Q.; Tang, X. Enhanced water saturation evaluation method using an improved electrical efficiency model: A case study of the Mishrif Formation, Iraq. J. Appl. Geophys. 2025, 236, 105656. [Google Scholar] [CrossRef]
- Tang, X.; Zhou, W.; Yang, W.; Zhang, C.; Zhang, C. An improved method in petrophysical rock typing based on mercury-injection capillary pressure data. Energy Sources Part A 2024, 46, 12647–12662. [Google Scholar] [CrossRef]
- Liu, H.; Tian, Z.; Liu, B.; Guo, R.; Shi, K.; Ye, Y. Classification and prediction of giant thick strongly heterogeneous carbonate reservoirs in the Middle East area:a case study of Mid-Cretaceous Mishrif Formation in the W oilfield of Iraq. Acta Pet. Sin. 2019, 40, 677–691. [Google Scholar]
- Salman, S.M.; Bellah, S. Rock typing: An integrated reservoir characterization tool to construct a robust geological model in Abu Dhabi carbonate oil field. In Proceedings of the SPE Reservoir Characterisation and Simulation Conference and Exhibition, Abu Dhabi, United Arab Emirates, 19 October 2009; p. SPE–125498-MS. [Google Scholar] [CrossRef]
- Martin, A.J.; Solomon, S.T.; Hartmann, D.J. Characterization of petrophysical flow units in carbonate reservoirs. AAPG Bull. 1997, 81, 734–759. [Google Scholar] [CrossRef]
- Guo, J.; Ling, Z.; Xu, X.; Zhao, Y.; Yang, C.; Wei, B.; Zhang, Z.; Zhang, C.; Tang, X.; Chen, T.; et al. Saturation Determination and Fluid Identification in Carbonate Rocks Based on Well Logging Data: A Middle Eastern Case Study. Processes 2023, 11, 1282. [Google Scholar] [CrossRef]
- Lucia, F.J. Petrophysical parameters estimated from visual descriptions of carbonate rocks: A field classification of carbonate pore space. J. Pet. Technol. 1983, 35, 629–637. [Google Scholar] [CrossRef]
- Slijkerman, W.F.; Hofman, J.P.; Looyestijn, W.J.; Volokitin, Y. A practical approach to obtain primary drainage capillary pressure curves from NMR core and log data. Petrophysics 2001, 42, SPWLA-2001-v42n4a3. [Google Scholar]
- Kassem, A.A.; Abdel Fattah, M.; Hassan, Z.; Radwan, A.E. Reservoir rock discrimination based on integrated image logs and petrographic analysis: A case study from the Early Miocene Nukhul Carbonate, Southern Gulf of Suez, Egypt. Arab. J. Sci. Eng. 2025, 50, 305–326. [Google Scholar] [CrossRef]
- Mirshadi, A.; Javaherian, A.; Khoshdel, H.; Saberi, M.R.; Kadkhodaie, A. Identification of the bound and free fluid pore types in an Iranian carbonate reservoir through the integration of well logs, rock physics modeling, and 3D seismic data. J. Pet. Explor. Prod. Technol. 2025, 15, 108. [Google Scholar] [CrossRef]
- Chandra, V.; Barnett, A.; Corbett, P.; Geiger, S.; Wright, P.; Steele, R.; Milroy, P. Effective integration of reservoir rock-typing and simulation using near-wellbore upscaling. Mar. Pet. Geol. 2025, 67, 307–326. [Google Scholar] [CrossRef]
- Aliakbardoust, E.; Rahimpour-Bonab, H. Effects of pore geometry and rock properties on water saturation of a carbonate reservoir. J. Pet. Sci. Eng. 2013, 112, 296–309. [Google Scholar] [CrossRef]
- Nazari, M.H.; Tavakoli, V.; Rahimpour-Bonab, H.; Sharifi-Yazdi, M. Investigation of factors influencing geological heterogeneity in tight gas carbonates, Permian reservoir of the Persian Gulf. J. Pet. Sci. Eng. 2019, 183, 106341. [Google Scholar] [CrossRef]
- Ngo, V.T.; Lu, V.D.; Le, V.M. A comparison of permeability prediction methods using core analysis data for sandstone and carbonate reservoirs. Geomech. Geophys. Geo-Energy Geo-Resour. 2018, 4, 129–139. [Google Scholar] [CrossRef]
- Kolodzie, S., Jr. Analysis of pore throat size and use of the Waxman-Smits equation to determine OOIP in Spindle Field, Colorado. In Proceedings of the SPE Annual Technical Conference and Exhibition, Dallas, TX, USA, 21–24 September 1980. SPE-9382-MS. [Google Scholar]
- Izadi, M.; Ghalambor, A. A new approach in permeability and hydraulic-flow-unit determination. SPE Res. Eval. Eng. 2013, 16, 257–264. [Google Scholar] [CrossRef]
- Nooruddin, H.A.; Hossain, M.E. Modified Kozeny–Carmen correlation for enhanced hydraulic flow unit characterization. J. Pet. Sci. Eng. 2011, 80, 107–115. [Google Scholar] [CrossRef]
- Amaefule, J.O.; Altunbay, M.; Tiab, D.; Kersey, D.G.; Keelan, D.K. Enhanced reservoir description: Using core and log data to identify hydraulic (flow) units and predict permeability in uncored intervals/wells. In Proceedings of the SPE Annual Technical Conference and Exhibition, Houston, TX, USA, 3–6 October 1993; SPE-26436-MS. [Google Scholar] [CrossRef]
- Ferreira, F.C.; Booth, R.; Oliveira, R.; Carneiro, G.; Bize-Forest, N.; Wahanik, H. New rock-typing index based on hydraulic and electric tortuosity data for multi-scaledynamic characterization of complex carbonate reservoirs. In Proceedings of the SPE Annual Technical Conference and Exhibition, Houston, TX, USA, 28–30 September 2015. [Google Scholar] [CrossRef]
- Mirzaei-Paiaman, A.; Ostadhassan, M.; Rezaee, R.; Saboorian-Jooybari, H.; Chen, Z. A new approach in petrophysical rock typing. J. Pet. Sci. Eng. 2018, 166, 445–464. [Google Scholar] [CrossRef]
- Wang, R.; Wang, Z.; Osumanu, A.; Zhang, G.; Li, B.; Lu, Y. Grid density overlapping hierarchical algorithm for clustering of carbonate reservoir rock types: A case from Mishrif Formation of West Qurna-1 oilfield, Iraq. J. Pet. Sci. Eng. 2019, 182, 106209. [Google Scholar] [CrossRef]
- Al-Jawad, S.N.A.; Ahmed, M.A.; Saleh, A.H. Integrated reservoir characterization and quality analysis of the carbonate rock types, case study, southern Iraq. J. Pet. Explor. Prod. Technol. 2020, 10, 3157–3177. [Google Scholar] [CrossRef]
- Jafari, J.A.L.I.L.; Mahboubi, A.; Moussavi-Harami, R.; Al-Aasm, I.S. The effects of diagenesis on the petrophysical and geochemical attributes of the Asmari Formation, Marun oil field, southwest Iran. Pet. Sci. 2020, 17, 292–316. [Google Scholar] [CrossRef]
- Sadeghi, R.; Vaziri-Moghaddam, H.; Taheri, A. Microfacies and sedimentary environment of the Oligocene sequence (Asmari Formation) in Fars sub-basin, Zagros Mountains, southwest Iran. Facies 2011, 57, 431–446. [Google Scholar] [CrossRef]
- Moradi, S.; Kalantari, N.; Charchi, A. Geomorphology of karst features in the northeast of Khuzestan, Iran. Carbonates Evaporites 2018, 33, 107–121. [Google Scholar] [CrossRef]
- Liu, T.; Jun, Y.; Jie, Y.; Xu, F.; Ma, Z. Theoretical mechanism and application of sphere–cylinder model in nmr for oil–water porous media. Pure Appl. Geophys. 2012, 169, 1257–1267. [Google Scholar] [CrossRef]
- Liu, Y.; Liu, Y.; Zhang, Q.; Li, C.; Feng, Y.; Wang, Y.; Xue, Y.; Ma, H. Petrophysical static rock typing for carbonate reservoirs based on mercury injection capillary pressure curves using principal component analysis. J. Pet. Sci. Eng. 2019, 181, 106175. [Google Scholar] [CrossRef]
- Al-Qenae, K.J.; Al-Thaqafi, S.H. New approach for the classification of rock typing using a new technique for iso-pore throat lines in Winland’s plot. In Proceedings of the SPE Annual Caspian Technical Conference, Baku, Azerbaijan, 4 November 2015. Paper Number: SPE-177327-MS. [Google Scholar] [CrossRef]
- Zhu, L.; Ma, Y.; Cai, J.; Zhang, C.; Wu, S.; Zhou, X. Key factors of marine shale conductivity in southern China—Part II: The influence of pore system and the development direction of shale gas saturation models. J. Pet. Sci. Eng. 2022, 209, 109516. [Google Scholar] [CrossRef]


Disclaimer/Publisher’s Note: The statements, opinions and data contained in all publications are solely those of the individual author(s) and contributor(s) and not of MDPI and/or the editor(s). MDPI and/or the editor(s) disclaim responsibility for any injury to people or property resulting from any ideas, methods, instructions or products referred to in the content. |
© 2025 by the authors. Licensee MDPI, Basel, Switzerland. This article is an open access article distributed under the terms and conditions of the Creative Commons Attribution (CC BY) license (https://creativecommons.org/licenses/by/4.0/).