Article

Deep-Learning-Enhanced Hybrid WOA-FMO Algorithm for Accurate PV Parameter Estimation in Single-, Double-, and Triple-Diode Models

by
Hatem A. Farag Embaresh
1,
Selçuk Alparslan Avci
1,
Javad Rahebi
2,* and
Raheleh Ghadami
3
1
Department of Electrical and Electronics Engineering, Karabuk University, Karabuk 78050, Turkey
2
Department of Software Engineering, Istanbul Topkapi University, Istanbul 34662, Turkey
3
Department of Computer Engineering, Istanbul Topkapi University, Istanbul 34662, Turkey
*
Author to whom correspondence should be addressed.
Processes 2025, 13(7), 2023; https://doi.org/10.3390/pr13072023
Submission received: 2 May 2025 / Revised: 9 June 2025 / Accepted: 17 June 2025 / Published: 26 June 2025
(This article belongs to the Section Energy Systems)

Abstract

The accurate modeling of photovoltaic (PV) systems is crucial in optimizing energy efficiency and operational reliability. To address challenges in parameter estimation under dynamic conditions, a hybrid deep learning (DL)-based optimization scheme is proposed. It is hypothesized that combining the global search capabilities of the Whale Optimization Algorithm (WOA) with local refinement of Fishier Mantis Optimization (FMO), supported by long short-term memory (LSTM)-based predictions, enhances accuracy and robustness. The method was validated through simulations on single-, double-, and triple-diode models (SDM, DDM, and TDM) using MATLAB 2021a version. The hybrid model achieved the lowest root mean square error (RMSE) of 6.96 × 10⁻⁴ across all models, outperforming standard metaheuristics and showing strong stability over multiple runs. These findings confirm the method’s superior accuracy and efficiency for PV parameter extraction.

1. Introduction

PV systems play a crucial role in the transition to sustainable energy because of their environmental benefits and constantly decreasing realization costs [1,2]. However, accurately estimating the parameters of PV panels remains a considerable challenge, primarily due to the nonlinear behavior of solar cells under varying environmental conditions [3]. Traditional analytical and deterministic methods often struggle to address this complexity as they are typically sensitive to initial conditions and lack the flexibility needed for diverse operating scenarios [4]. To address these limitations, this research suggests a hybrid optimization model by integrating the WOA with FMO, which is further enhanced by DL techniques.

1.1. Literature Review

Recent research has explored a wide range of optimization techniques for accurate parameter estimation in PV. A PV panel, which converts light into direct current (DC) power, is typically represented as a current source [5,6]. Numerous methods have been proposed in the literature, broadly categorized into deterministic and heuristic [7]. Deterministic techniques such as Newton-Raphson and Levenberg-Marquardt are known for their computational efficiency but can often exhibit sensitivity to the initial conditions, which can lead to convergence to inaccurate solutions [8]. These methods usually rely on approximated objective functions, which can compromise solution accuracy and increase computational complexity [8].
To overcome such limitations, intelligent algorithms inspired by natural phenomena have gained traction for their ability to approximate global optima [9]. For instance, Ye et al. (2009) applied a bee colony optimization algorithm to extract solar cell parameters, although this approach suffers from long convergence time [10].
Similarly, heuristic techniques such as Particle Swarm Optimization (PSO) and Genetic Algorithm (GA) have demonstrated better global search capability but are often constrained by high computational demands and slower convergence speed [11]. Recently developed metaheuristic algorithms like the Rat Swarm Optimizer (RSO) and War Strategy Optimization (WSO) offer a more balanced trade-off between exploration and exploitation, thereby improving estimation accuracy [11,12].
Among the novel methods, the Marine Walrus Inspired Optimization Algorithm (WaOA) has shown superior performance in terms of convergence speed and RMSE reduction across multiple diode models [8]. Likewise, the Fully Informed Search Algorithm (FISA) has demonstrated strong parameter estimation performance for single-diode models, outperforming several alternatives in both stability and convergence rate [13]. Another promising method, the Generalized Normal Distribution Optimization (GNDO), has proven effective for both single- and double-diode models, achieving low RMSE values [14].
Moreover, Ishaque et al. used the differential evolution algorithm to find the parameters of the single-diode model of the photovoltaic cell [15]. In their method, they used only the single-diode model and the other diode module; this algorithm was not implemented and tested. Rao and Patel [16] presented a parameter determination technique for a single diode and diode pair model using the WOA, which was valued for its ease of implementation and efficiency. However, their approach was limited to these two models, and its extension to other types of photovoltaic modules was not considered.
Reference [17], using the partial differential equation (P-DE) method, estimated key parameters of the PV components and demonstrated better precision and faster convergence in contrast to other methods. Their approach requires fewer control parameters. However, a limitation of their method is the occurrence of singularities due to incorrect modeling and other unaddressed constraints.
This research [18] presents a new and scalable tool for real-time PV system analysis and is extendable to emerging technologies, such as perovskite and hybrid solar cells.
Other algorithms, including the particle assembly algorithm [19], the genetic algorithm [20], and several hybrid techniques, have also been implemented for parameter extraction in single- and dual-diode models, each presenting distinct advantages and drawbacks [21,22]. Despite their differences, all methods share the common goal of minimizing the errors between experimental observations and simulated outputs of the equivalent PV critical models.
However, a number of the previously discussed methods face challenges, such as convergence instability, limited scalability to multi-diode models, and high computational complexity. These constraints underscore the need for a comprehensive hybrid approach that effectively combines global and local optimization capabilities—an objective achieved in this study through the integration of WOA and FMO algorithms, further supported by DL techniques.
In reference [23], researchers applied neural networks for the enhancement of datasets from photovoltaic cells and an improved equilibrium optimizer (EO) for parameter identification in single, double, and TDMs. In the enhanced optimizer, a backpropagation neural network enables more efficient optimization with a refined fitness function. However, the method is limited by increased time consumption required for data handling.
In this regard, a new algorithm, the fractal chaotic Henon Harris hawks optimization (FCHHHO), was developed in [24], which updates the random parameter of the HHO technique using the fractal Henon chaotic map. Although it has been applied to various benchmark functions, its tendency to converge to the local optima reduces the reliability of the global minimum determination.
In [25], a PV cell model was employed for uncertainty analysis based on functional failure, utilizing a Monte Carlo-based global sensitivity analysis to evaluate the impact of parameter fluctuations on failure probability. The study yielded good results, with five variables in the single-diode module; however, as more variables with various constraints were added, the method became time-consuming and computationally expensive.
Traditionally, methods of determining the unknown parameters in models have been divided into two groups: optimization and analytical approaches. Analytical approaches focus on identifying specific characteristic points on the current-voltage characteristic curve to construct a mathematical model [4,26,27,28,29,30], but their effectiveness heavily depends on the choice of these points. Poor choices lead to significant errors, undermining the credibility of the results. This paper employs a modified WOA for solving these problems, which proves to be more accurate than other algorithms such as MLBSA, IJAYA, GOTLBO, GA, and CS. The modified version of WOA [31] shows faster convergence and integrates Mantegna-Lévy distribution with a velocity operator to enhance accuracy and population diversity.

1.2. Contribution

This study presents a novel hybrid optimization approach by integrating the WOA with the FMO method to improve the accuracy of parameter estimation in PV models. The proposed approach is tested on various PV models, including the Single-Diode Model (SDM), Double-Diode Model (DDM), and Three-Diode Model (TDM), under varying environmental conditions and population sizes. Comparative performance evaluations with some of the best metaheuristic algorithms, such as GA, PSO, WHHO, and IJAYA, confirm the superiority of the new approach. Also, DL techniques are incorporated to enhance prediction accuracy and model initialization, resulting in reduced root mean square error (RMSE) and faster convergence. Contrary to prior studies that primarily focus on single- or double-diode models, the new framework is comprehensively validated on single-diode (SDM), double-diode (DDM), and triple-diode (TDM) configurations. It uniquely integrates DL to improve both initialization and prediction accuracy—an approach not previously reported in the literature.
This study directly addresses key gaps, including the limited robustness of multi-diode models and the computational inefficiency of existing metaheuristic methods. By combining the WOA and FMO with DL, the framework achieves lower RMSE and improved parameter stability across various PV configurations.
Specifically, a DL model, such as LSTM, is applied after optimization to capture temporal patterns in I–V characteristics, thereby reducing estimation errors in real-time applications.
Although existing approaches are diverse, many continue to suffer from slow convergence, poor generalizability, and limited scalability. The proposed hybrid approach effectively overcomes these limitations by using the complementary strengths of WOA, FMO, and DL in a unified framework.

1.3. Organization

The organization of this paper is as follows. In Section 2, the proposed WOA-FMO hybrid framework is introduced. Section 3 discusses the problem formulation and modeling of solar cells (PV) in detail. In Section 4, the experimental results obtained from applying this framework to SDM, DDM, and TDM models are discussed, along with statistical evaluations, including confidence intervals and box plots. Finally, Section 5 summarizes the paper, and Section 6 is devoted to outlining future research directions.

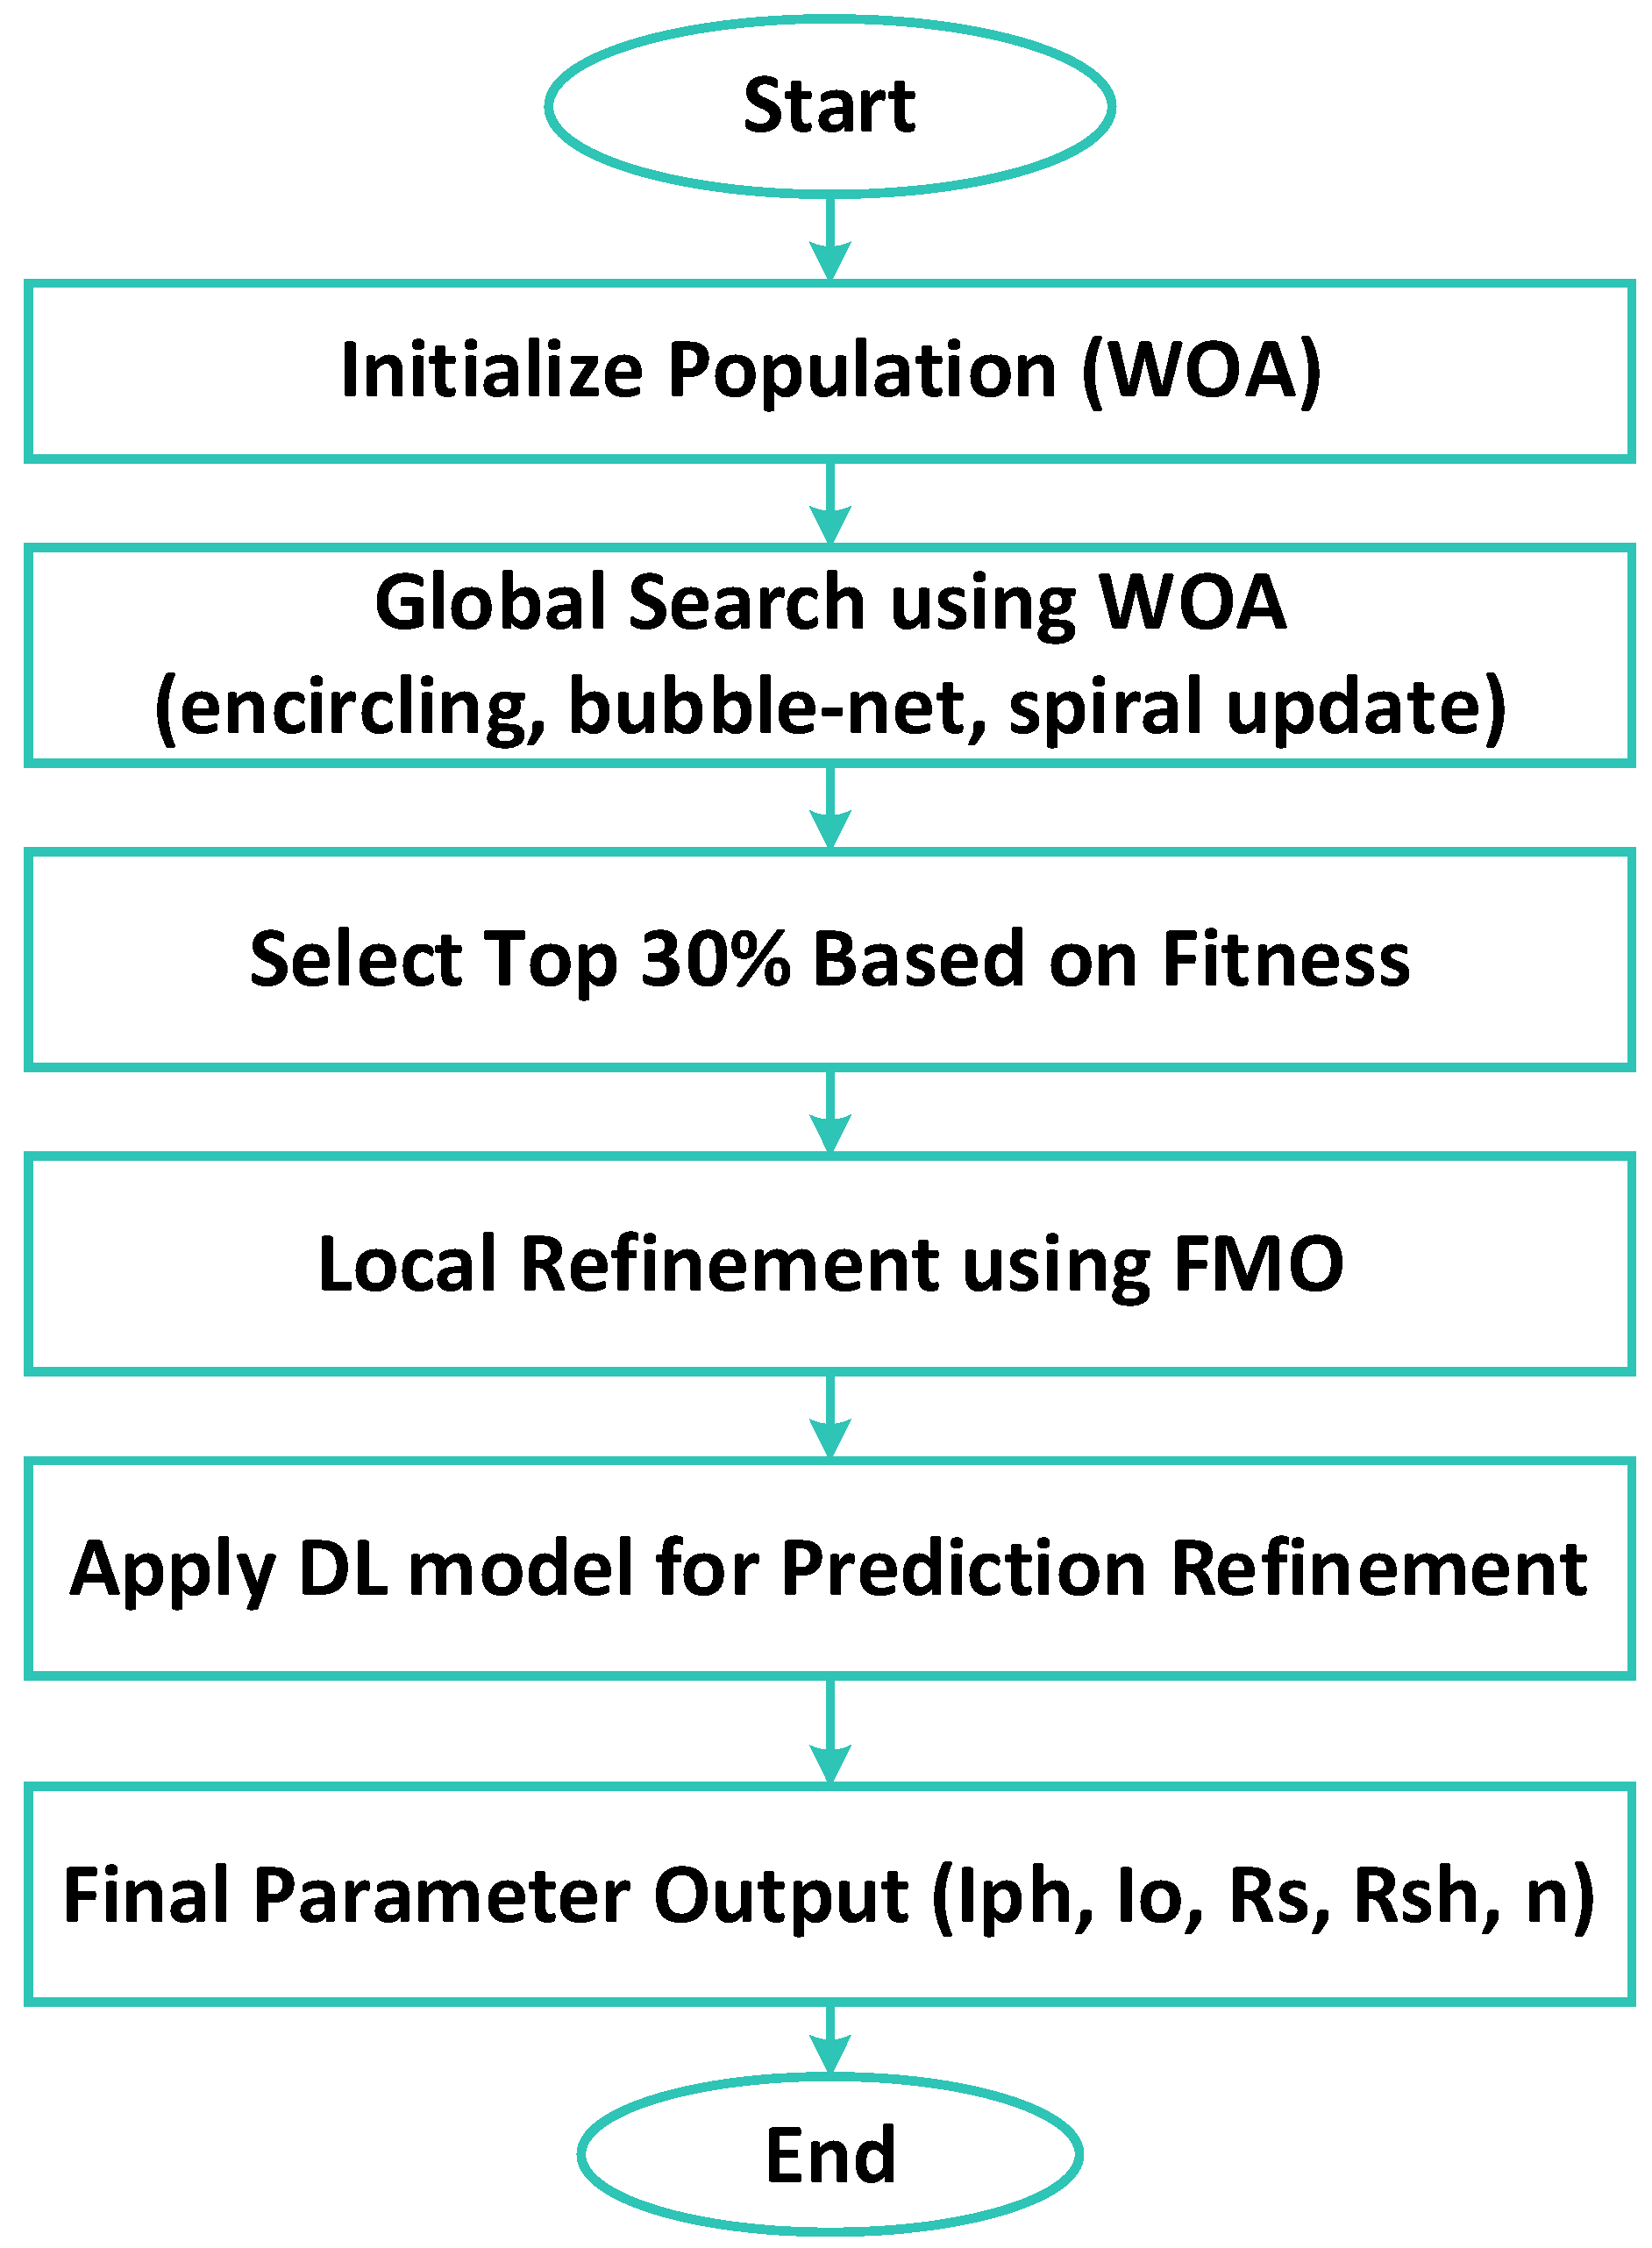
2. Proposed Framework

This research proposes a hybrid optimization framework that integrates the WOA with the FMO strategy, reinforced by DL for enhanced parameter estimation in PV modeling. The suggested WOA-FMO framework aims to integrate the strengths of global exploration and local exploitation while employing DL to improve prediction quality, accelerate convergence, and reduce the RMSE. The structure begins by generating a population of candidate solutions, randomly distributed within predefined bounds. Every candidate represents a potential parameter configuration for PV models, such as the SDM, DDM, or TDM. The RMSE serves as the fitness measure, quantifying the accuracy of each candidate by comparing predicted values with actual data. In the global search phase, WOA directs the population through processes like encircling, spiral revolving, and bubble-net feeding, with adaptive parameters updating across generations to balance exploration and exploitation. Subsequently, the top 30% of candidates, selected based on fitness, proceed into the local refinement stage. The FMO algorithm is applied to these superior instances and prevents premature convergence by incorporating random interactions with the global best and similar individuals while enhancing local exploitation in promising regions. Updated solutions are reintegrated into the population, normalized for stability, and re-evaluated to assess fitness improvements. Throughout the optimization process, the global best solution is continuously tracked and updated upon discovery of a better-performing candidate. Following the optimization, a DL model further refines the output. The new method (WOA-FMO) has been rigorously tested on various PV configurations under various environmental conditions. Comparative evaluation against well-known metaheuristic algorithms, including GA, PSO, WHHO, and IJA-YA, highlights the superior robustness and estimation precision of the WOA-FMO. DL integration plays a vital role in enhancing model initialization and faster convergence, resulting in consistently lower RMSE values across all test scenarios. To provide a clear presentation of the new approach, the pseudocode of the WOA-FMO algorithm integrating deep learning is presented below (Algorithm 1).
Algorithm 1: Hybrid WOA-FMO enhanced with DL Integration
Start
1. Initial configuration
  • P = 100: Population size
  • G = 50: Number of generations
  • dim = 5: Number of problem parameters (number of search variables)
  • a = 2: Initial value of a for WOA
  • b = 1: Constant value for spiral movement
  • lambda_ dl = 0.5: Weighting factor for the DL model
  • max_ iter = 100: Maximum number of iterations
2. Fitness function
def fitness_ function(solution):
    • Calculate RMSE or any other suitable evaluation metric
return np. sqrt (np. mean (solution ** 2))
                                       M i n       θ R M S E = 1 N i = 1 N y i m e a s u r e d y i s i m u l a t e d θ 2
3. Position Update Function for WOA (Encircling Prey)
def update_ position_ WOA (X_ best, X_ current, A, C):
D = np. abs (C * X_ best − X_ current)
new_ position = X_ best − A * D
return new_ position
4. Position update function for FMO
def update _ position_ FMO (X_ i, X _best, X _j, X _k, beta1, beta2):
randn1 = np. random. randn ()
rand1 = np. random. rand ()
rand2 = np. random. rand ()
new_ position = X _i + beta1 * randn1 * (X _best − X _i) + beta2 * rand1 * (X _j − X _k)
                                                                return new _position
5. Population initialization function
def initialize_ population (P, dim):
                                        return np. random. uniform (−10, 10, (P, dim))
6. Hybrid WOA-FMO algorithm
def WOA_FMO (P, G, dim, max_ iter):
1)Initialize population
population = initialize _ population (P, dim)
fitness = np. array ([fitness _function(pop) for pop in population])
best_solution = population [np. argmin (fitness)]
best_ fitness = np. min(fitness)
2)Generations loop
for g in range(G):
Update a and C
    • a = 2 − (2 * g / G)
      A = 2 * a * np. random. rand () − a
      C = 2 * np. random. rand ()
3)Global search with WOA
for i in range(P):
    • population[i] = update_ position_ WOA (best_solution, population[i], A, C)
    • fitness[i] = fitness_ function(population[i])
4)Select the top 30% to transfer to FMO
sorted_ indices = np. argsort (fitness)
top_30_percent = population [sorted_ indices [:int (0.3 * P)]]
5)Local exploitation with FMO
for i in range (int (0.3 * P)):
    • X_ best = top_30_percent[i]
    • X_ j, X_ k = top_30_percent [np. random. randint (0, int (0.3 * P), 2)]
    • top_30_percent[i] = update_ position_ FMO (X_ best, best_solution, X_ j, X_ k, beta1=1.5, beta2=1.5)
6)Update population with FMO
population [sorted_ indices [:int (0.3 * P))] = top_30_percent
7)Fitness evaluation
fitness = np. array ([fitness_ function(pop) for pop in population])
Update best solution
  • current_ best = population [np. argmin(fitness)]
    current_ best_ fitness = np. min(fitness)
if current_ best_ fitness < best_ fitness:
    • best_solution = current_ best
    • best_ fitness = current_ best_ fitness
    • print (f” Generation {g+1}, Best Fitness: {best_ fitness}”)
return best_solution, best_ fitness
7. Final algorithm for improving prediction
def deep_ learning_ prediction (I_ sim, I_DL_ pred, lambda _dl):
I_ final = lambda _dl * I_ sim + (1 − lambda _dl) * I_DL_ pred
return I_ final
8. Calling the WOA-FMO algorithm
    • best_solution, best_ fitness = WOA_FMO (P, G, dim, max_ iter)
    • print (f” Best Solution: {best_solution}”)
    • print (f” Best Fitness: {best_ fitness}”)
9.Using the DL model for prediction
  • I_ sim = np. random. uniform (0, 1, 10) (Simulated value)
    I_DL_ pred = np. random. uniform (0, 1, 10) (DL model prediction)
    I_ final = deep_ learning _prediction (I_ sim, I_DL_ pred, lambda_ dl)
    print (f” Final Refined Current: {I _final}”)
End
Figure 1 presents a unified framework integrating optimization and prediction techniques. It employs the global search strength of the WOA, the fine-tuning capabilities of the FMO method, and the adaptive power of a DL model. By combining those elements, the approach ensures efficient coverage of the solution space, precise local refinement, and enhanced prediction accuracy. The stepwise structure allows for a broad initial search, followed by focused adjustments and intelligent data-driven estimation, resulting in reliable determination of electrical parameters for modeling and characterization.

3. Problem Formulation

The accurate modeling of PV modules is essential for maximizing energy generation, improving conversion efficiency, and ensuring optimal performance of solar energy systems under variable conditions. The task of parameter estimation involves identifying a set of unknown variables that best reproduce the actual current-voltage (I–V) and power-voltage (P–V) characteristics observed in experimental data. This process is framed as a nonlinear optimization problem, where the goal is to minimize the error between measured and simulated data.

3.1. Objective Function

The error metric used to evaluate the fitness of a candidate parameter set is the RMSE. The RMSE measures the average deviation between the measured values and those simulated using a PV model:
M i n       θ R M S E = 1 N i = 1 N y i m e a s u r e d y i s i m u l a t e d θ 2
where:
  • n : Is the number of data points
  • y i m e a s u r e d : Is the measured current or power at voltage
  • y i s i m u l a t e d : Is the corresponding simulated value using model parameters
  • θ : is the vector of unknown parameters to be optimized
The optimization aims to find the optimal parameter vector θ such that
arg min R M S E θ θ = θ *
The objective is to find the optimal θ that minimizes RMSE, ensuring the simulated curves closely match the experimental I–V or P–V data.

3.2. Parameter Sets by Model

To improve understanding and make the content more accessible to readers who may not necessarily be in photovoltaic modeling, diagrams of the equivalent circuits for the single-, double-, and triple-diode models are provided. Figure 2, Figure 3 and Figure 4 emphasize the key components and the differences among the models, thereby facilitating the better understanding of the parameter extraction methodology.
Each PV model has a distinct number of unknown parameters, as follows:
  • Single-Diode Model (SDM):
S D M θ = Ι p h , Ι 0 , n , R s , R s h
  • Double-Diode Model (DDM):
D D M θ = Ι p h , Ι 01 , Ι 02 , n 1 , n 2 , R s , R s h
  • Triple-Diode Model (TDM):
T D M θ = Ι p h , Ι 01 , Ι 02 , Ι 03 , n 1 , n 2 , n 3 , R s , R s h

3.3. Physical Constraints

To ensure physical realism, all the parameters are restricted to be positive:
θ j 0 j 1,2 , , θ
1 n i 2 , f o r   a l l                 i 1,2 , 3
Also, certain parameters such as the diode ideality factors n i are usually constrained within realistic limits, typically 1 n i 2 depending on the semiconductor material and operating conditions.

3.4. Mathematical Models of PV

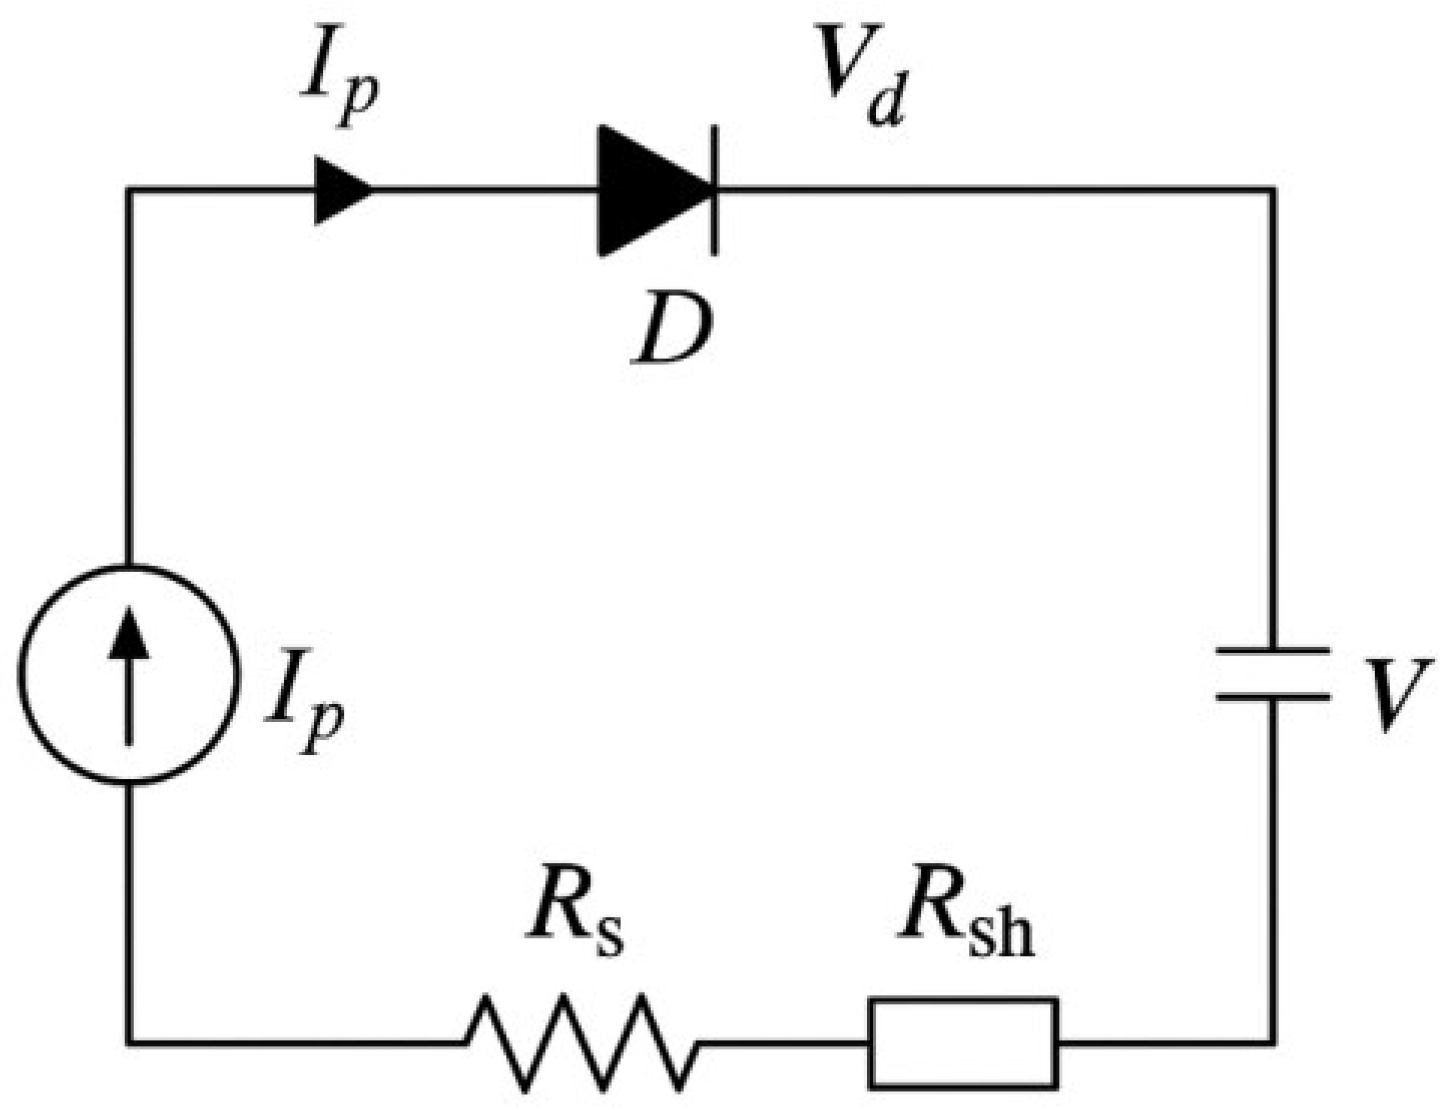
3.4.1. Single-Diode Model (SDM)

The maximum current and voltage generated by a PV panel are functions of panel temperature and solar irradiance, the intensity of the light absorbed, measured in watts per square meter (W/m2). The equivalent circuit of the SDM is shown in:
Ι = Ι p h Ι 0 exp q V I R S n κ Τ 1 V I R S R S h
where:
  • Ι p h : photo-generated current
  • Ι 0 : diode reverse saturation current Rs (series resistance)
  • R S h : series and shunt resistance
  • n : ideality factor of the diode
  • q : elementary charge
  • Τ : cell temperature in Kelvin
  • κ : Boltzmann constant

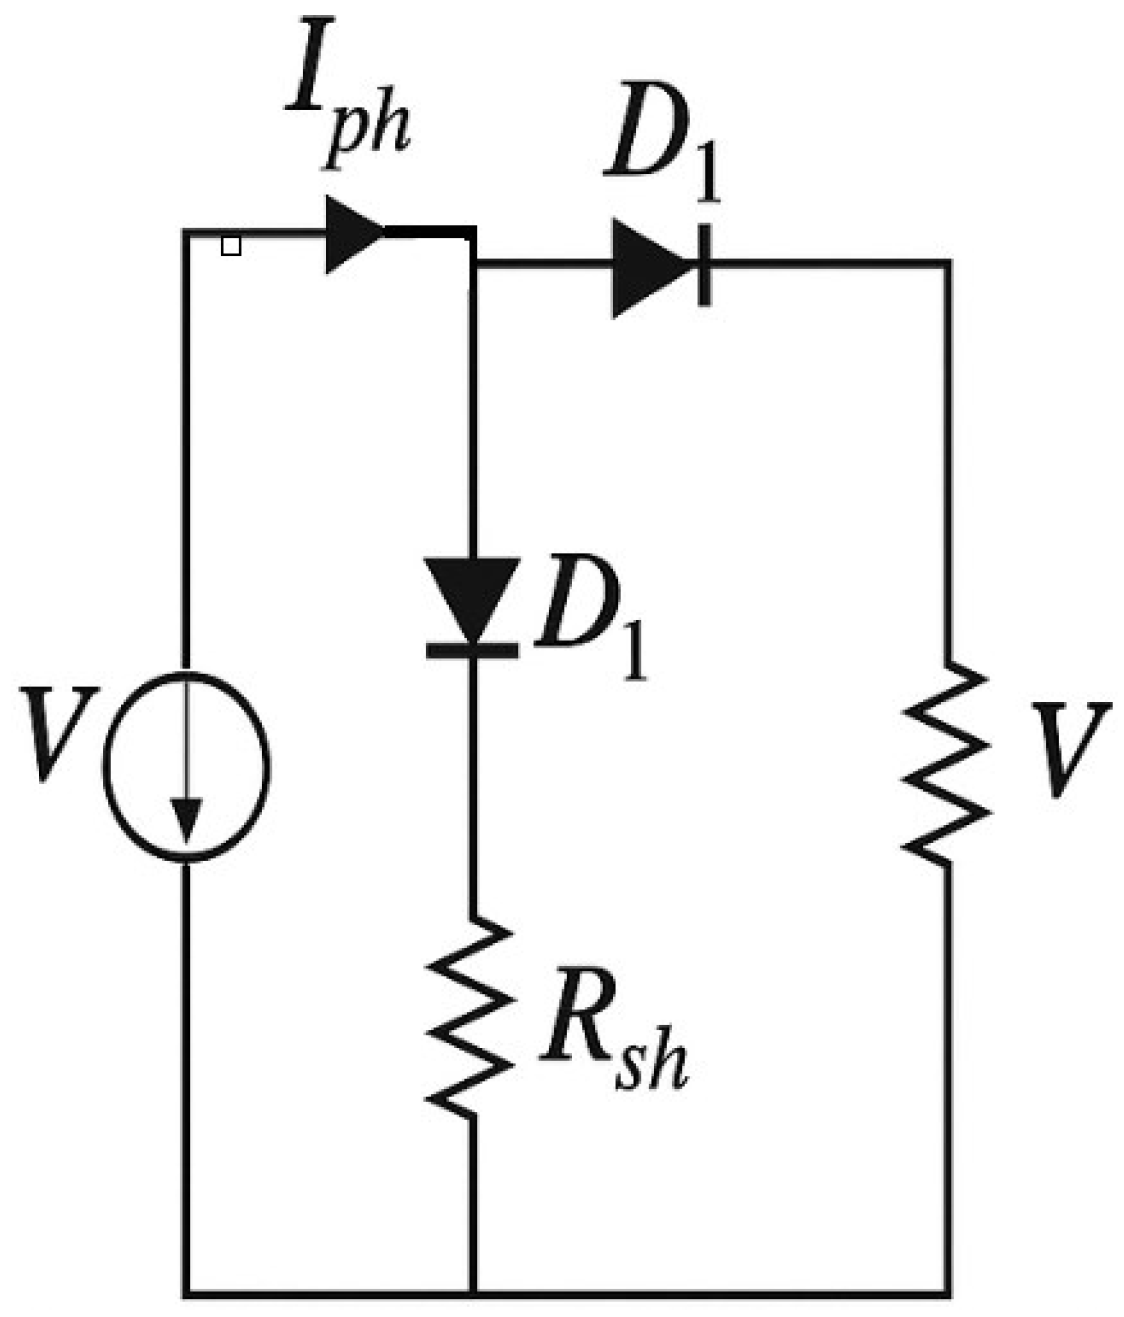
3.4.2. Double-Diode Model (DDM)

The DDM introduces a second diode to better represent recombination losses:
Ι = Ι p h Ι 01 exp q V I R S n 1 κ Τ 1 Ι 02 exp q V I R S n 2 κ Τ 1 V I R S R S h
where:
  • Ι 01 , Ι 02 : Saturation currents of two diodes.
  • n 1 , n 2 : ideality factor of the diodes

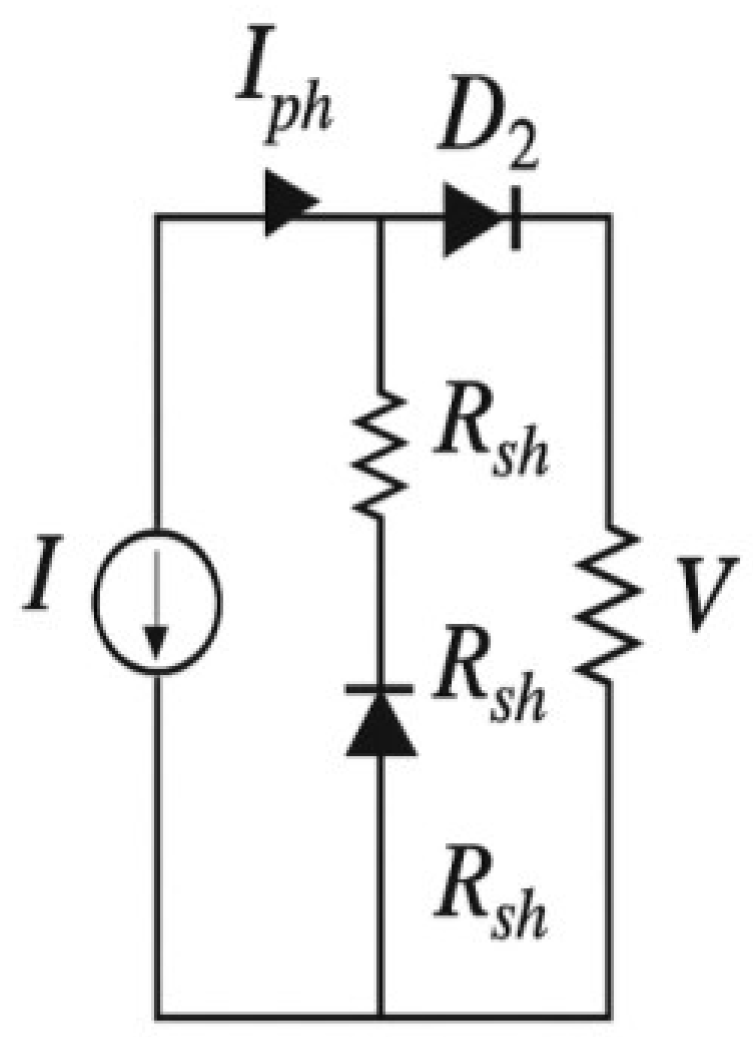
3.4.3. Triple-Diode Model (TDM)

For even more accurate modeling, a third diode is added in the TDM:
Ι = Ι p h i = 1 3 Ι 0 i exp q V I R S n i κ Τ 1 V I R S R S h
where:
  • Ι 0 i : Saturation current of the i-th diode
  • n i : Ideality factor of the i-th diode
Therefore, parameter estimation is considered a constrained nonlinear optimization problem. The objective of this optimization is to find the optimal parameter vector θ that minimizes the RMSE between the measured and simulated I-V or P-V characteristics while maintaining physical feasibility.

4. Materials and Methods

The study uses a hybrid metaheuristic approach that combines the WOA and FMO. The optimization process starts with the WOA algorithm, which extensively explores the solution space using prey encirclement, bubble network attack, and random search methods. Next, the FMO algorithm improves the best solutions found by WOA by imitating the predator behavior and dynamically changing the position of them. Finally, the quality of the obtained parameter set is measured using the RMSE metric against standard solar cell models (SDM, DDM, TDM). DL models are also used to improve the initial setup and reduce the final error. All experiments were performed in MATLAB 2021a with multiple runs and different whale populations. While standard MATLAB functions were used for basic numerical operations, the hybrid optimization framework—combining the WOA, FMO, and DL models—was entirely custom-developed by the authors. This implementation enables flexible parameter configuration, improved control over the optimization process, and seamless applicability to all three PV models, thereby enhancing the overall efficiency and flexibility of the proposed approach.

5. Results

In this section, the results obtained from simulations conducted within the MATLAB 2021a version software environment are presented. The optimal parameters for the modeled PV panel were determined using the WOA. The results were then compared to those derived from other optimization methods to achieve the objectives outlined in this study.

5.1. Characteristics of the Solar Cell Utilized

The PV panel used in this study is the well-known model and is very commonly used in research on the modeling of PV panels. This commercial silicon PV panel manufactured by R.T.C. Paris, France has a diameter of 57 mm. The results include practical tests of voltage and current at the solar cell terminals, recorded under conditions of 1000 W/m2 radiation and a temperature of 33 °C.
To emphasize the research-level significance of the findings, the results are further analyzed in terms of statistical reliability and comparison to recent state-of-the-art metaheuristic methods.

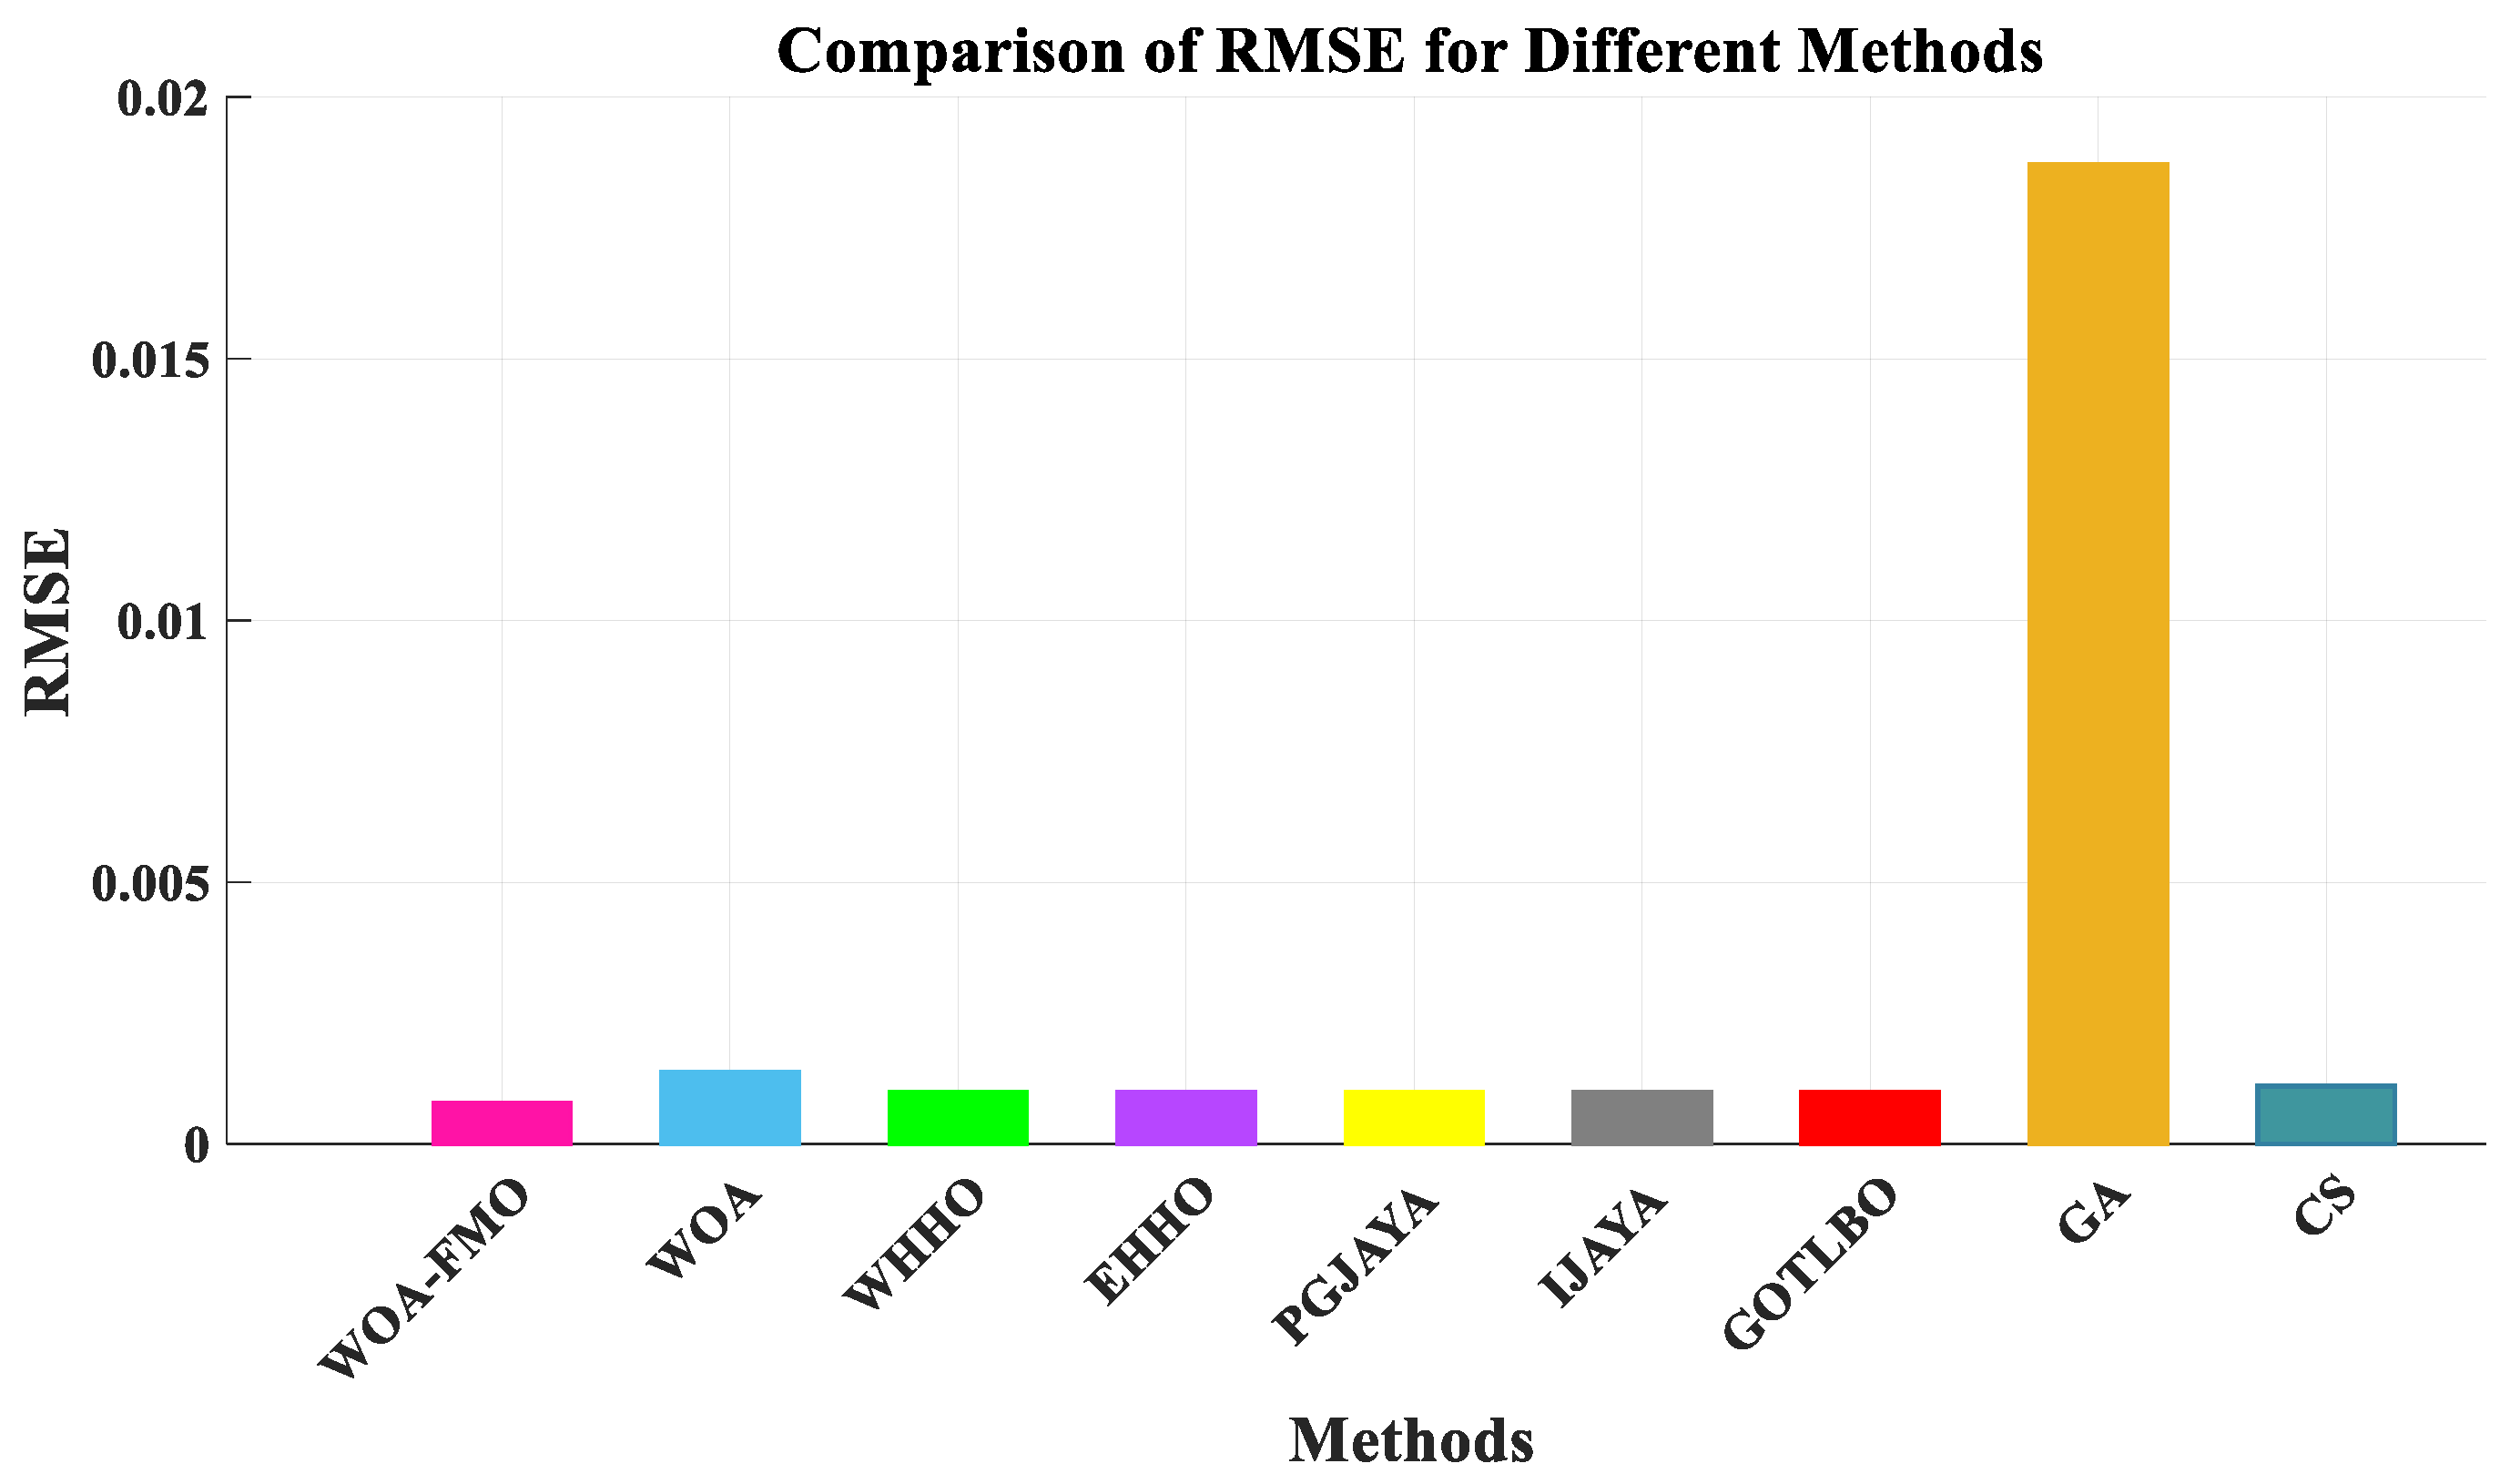
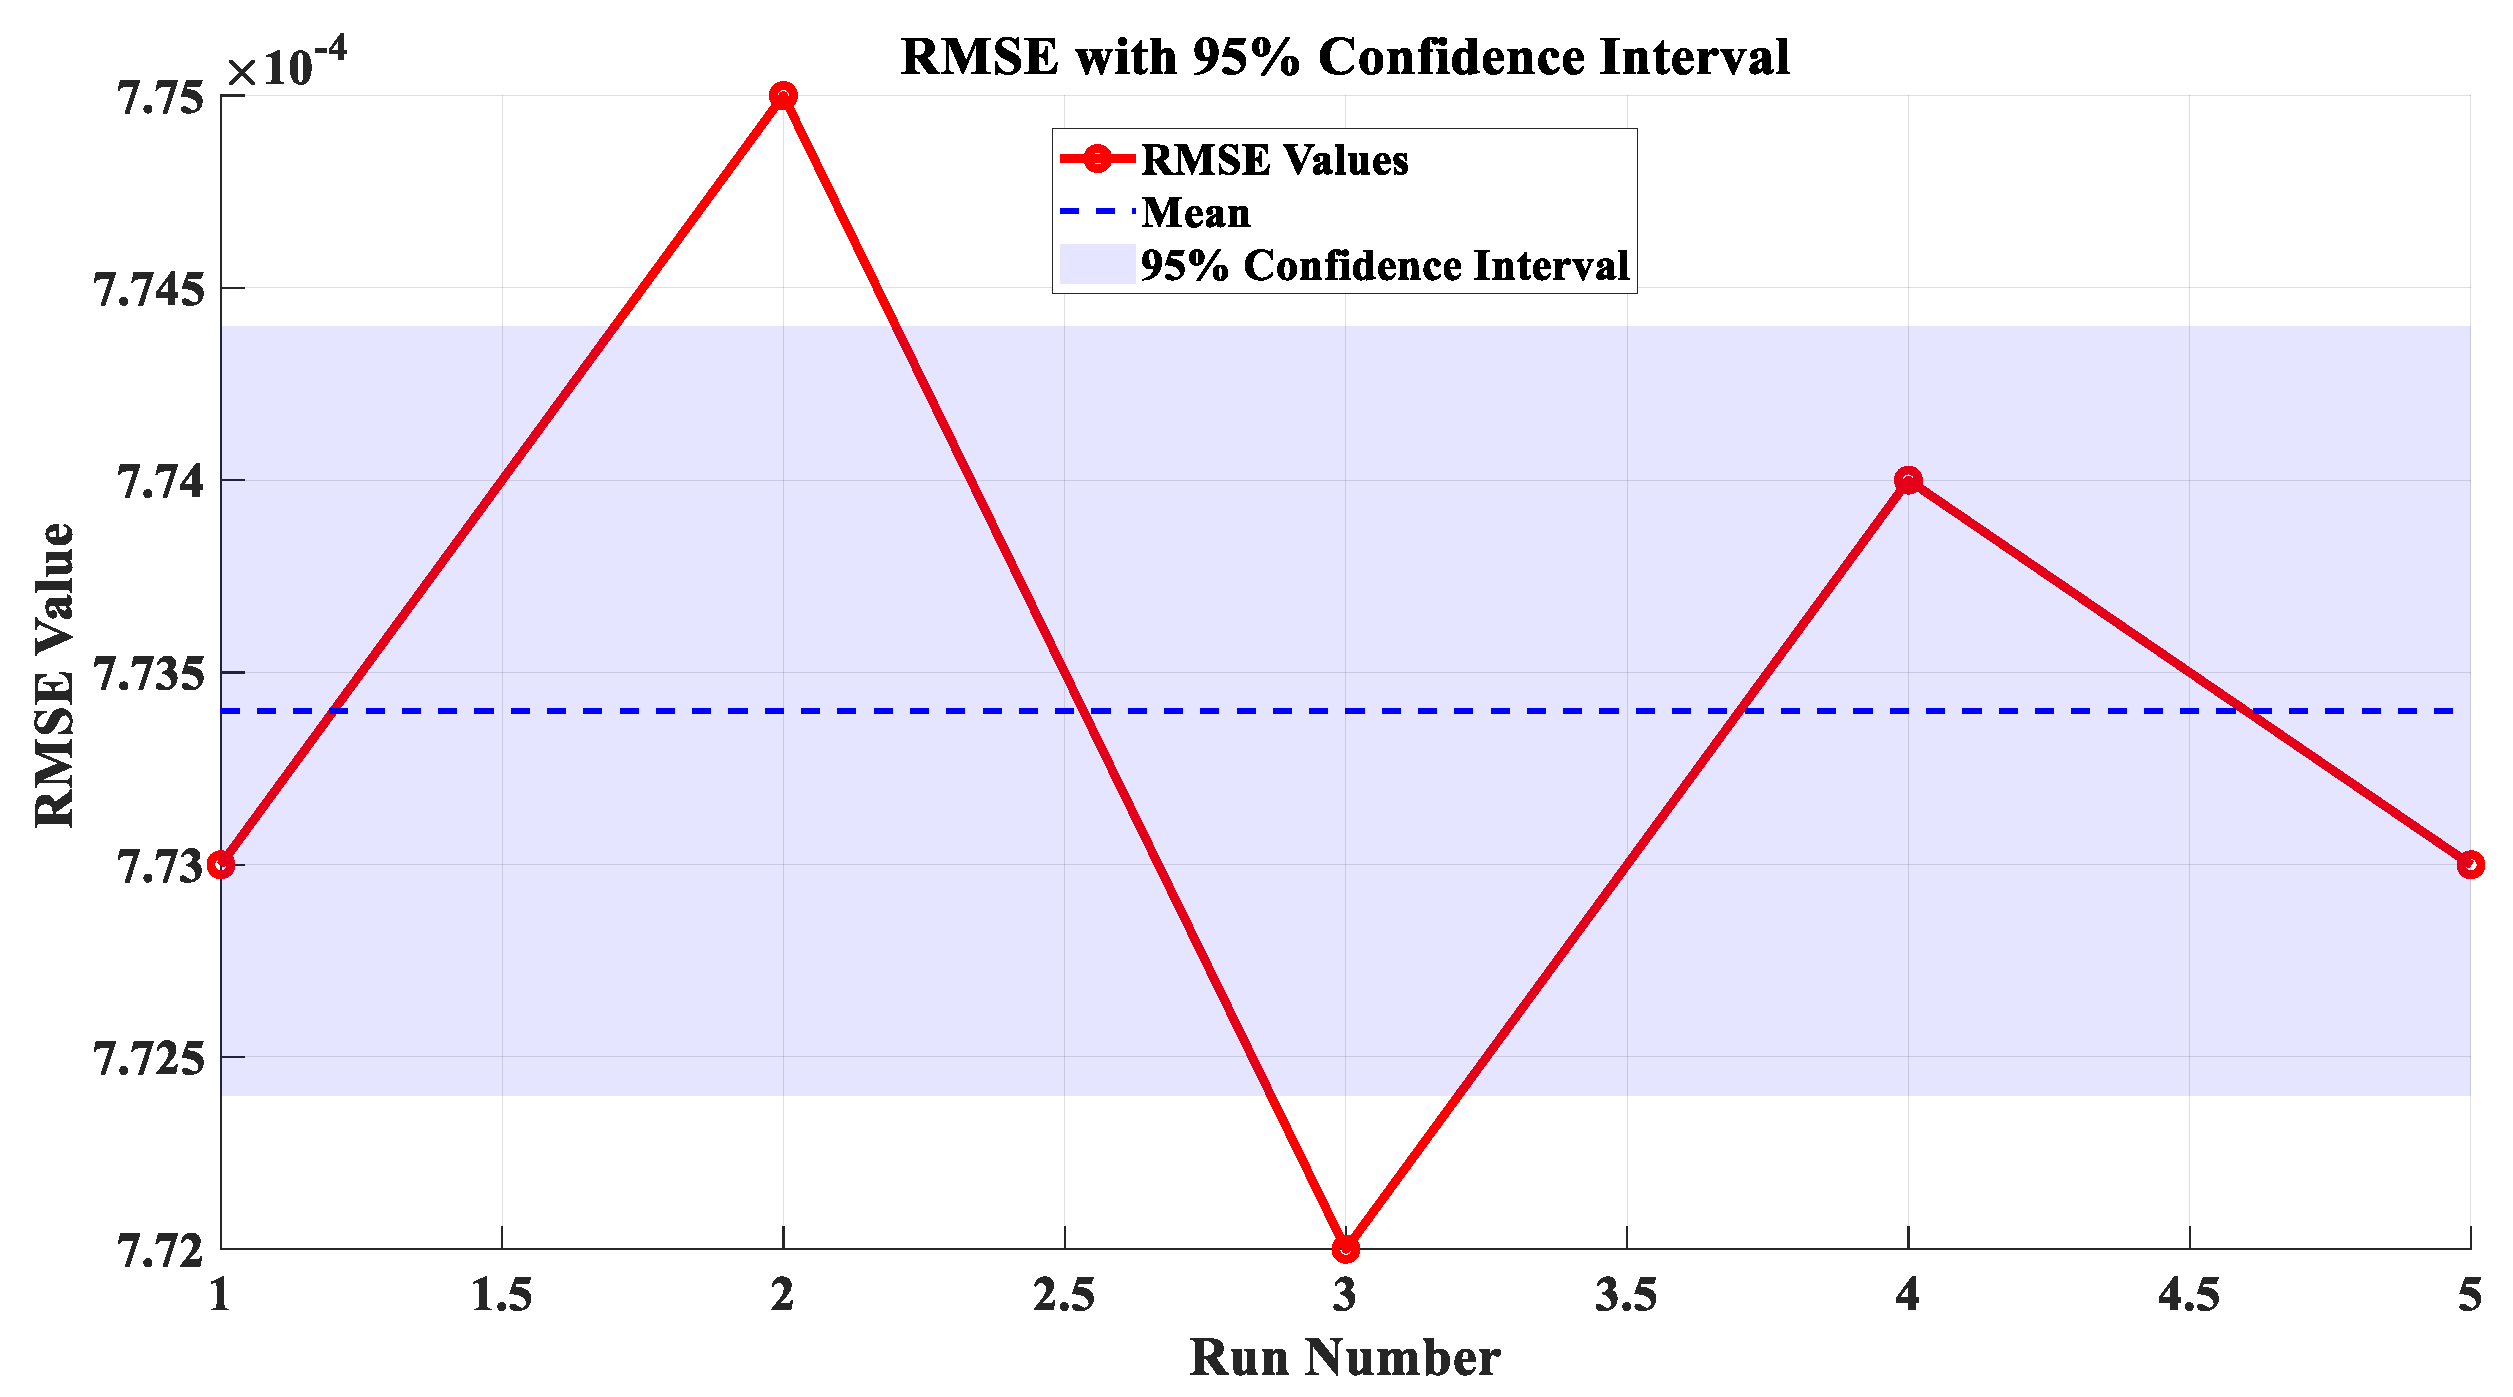
5.2. Optimization Results for Single-Diode Model

This section presents the results obtained from simulating the single-diode PV model using the WOA. The optimization process was conducted in MATLAB and executed six times, each with a different population size (number of whales), to evaluate the algorithm’s performance consistency and robustness under varying conditions.
To provide a concise statistical summary, Table 1 lists the mean, standard deviation (Std.Dev), and corresponding mean value plus or minus the standard deviation (mean ± std) of each estimated parameter over five independent runs with a population size of 15. These results indicate high stability in the WOA output and form the foundation for determining variation in subsequent experiments.
For further analysis, Table 2 depicts the detailed outcomes of six simulation runs of the single-diode PV model using WOA with different whale population sizes: 15, 25, 45, 65, 85, and 100. Every row reflects the value of a specific model parameter or error metric obtained in each case. Observe that the results of other methods were copied directly from literature, and the work in [32,33,34] was the specific one.
As can be seen in Table 2, all parameters show little variation across different whale populations. In particular, the value of I p h remains constant at 0.7608 μA and I o experiences only minor variations between 0.3104 and 0.3106. Similarly, the values of R S h and R S are relatively stable and fluctuate within narrow ranges. The ideality coefficient N S also remains approximately constant at 1.4773. It is noteworthy that the stability of the RMSE value at 7.73 × 10⁻⁴ indicates the high accuracy and convergence reliability of the WOA algorithm regardless of the population size. These findings confirm that increasing the number of whales does not significantly affect the quality of the optimization and highlight the efficiency of the algorithm even with smaller populations.
To visually verify the effectiveness of the WOA-based optimization, the simulated I-V and P-V curves obtained from the model were compared with experimental data obtained from a PV cell from the French RTC. These comparisons are shown in Figure 5.
In Figure 5a,b, the measured I-V and P-V data are shown by blue lines, respectively, while the simulated outputs from the WOA algorithm are marked by brown triangles. The close alignment between the experimental and estimated curves proves the accuracy of the proposed algorithm in modeling the PV cell behavior. Both curves show very small deviations between the actual and simulated values, thus confirming the robustness and modeling accuracy of the optimized single-diode approach using WOA.
Table 3 compares the obtained RMSE values of the proposed algorithm with these optimization techniques, such as WHHO, EHHO, PGAYA, IJAYA, CS, GA, and the standard WOA. The outcomes of autonomous evaluation presented in Table 3 show that the innovative approach outperforms the alternative methods.
The WOA-FMO method showed the best accuracy, with I p h = 0.7608 (A), I 0 = 0.3103 (µA), R S = 0.0365 (Ω), R S h = 52.8729 (Ω), N = 1.4772, and the lowest RMSE of 7.7299 × 10⁻⁴, demonstrating superior optimization capabilities. In comparison, the standard WOA achieved slightly higher I 0 = 0.41228 (µA) but had a larger RMSE of 1.38 × 10⁻³. Hybrid methods like WHHO, EHHO, PGJAYA, and IJAYA delivered similar results with RMSE values around 9.8602 × 10⁻⁴ and marginal parameter differences. Traditional algorithms such as GA and CS showed higher errors, with GA having the largest RMSE of 1.8704 × 10⁻² due to significant deviations in parameters. Overall, WOA-FMO was the most effective approach for accurate parameter estimation. To further validate the significance of performance differences between optimization algorithms, a one-way ANOVA test was conducted on RMSE values for all methods. The result confirmed that WOA-FMO significantly outperforms the other algorithms, with a p-value < 0.05, indicating statistically significant estimation improvements in estimation accuracy.
These results demonstrate that WOA-FMO not only produces minimal errors but also has consistent performance, highlighting its suitability for robust PV system design under real-world operating conditions.
Figure 6 shows a bar chart comparing the RMSE values obtained from different optimization methods in estimating the parameters of a single-diode solar cell model. The lower height of the bars indicates the lower RMSE and the more favorable performance of the corresponding algorithm.
The WOA-FMO algorithm has the highest accuracy level among the methods studied by achieving the lowest RMSE value. Other algorithms such as WOA, WHHO, EHHO, PGJAYA, IJAYA, GOTLBO, and CS also provide relatively low RMSE values and have acceptable performance.
In contrast, the GA algorithm, having the tallest bar, shows the highest RMSE value and, consequently, the lowest accuracy in estimating the parameters. Overall, the WOA-FMO algorithm performs better in this comparison and provides the most accurate estimates, while the GA algorithm faces the highest error rate.
Table 4 shows a review of the result acquired from executing the SDM method five times with WOA = 15.
The outcomes from five test scenarios demonstrate the stability and accuracy of the optimization process across key photovoltaic parameters. The I p h exhibited minimal variation, ranging from 0.760787963 (A) to 0.760789725 (A), reflecting high consistency. Similarly, the Ι 0 showed slight fluctuations between 0.310364064 (µA) and 0.310684044 (µA). The R S h   values were steady, from 52.8356559 (Ω) to 52.890785 (Ω), while the R S   varied slightly from 0.036546862 (Ω) to 0.036551305 (Ω). The N varied slightly and had values of approximately 1.4772 throughout. The RMSE was very small for all the tests, approximately 0.000772986, indicating the strength and confidence of the optimization process. These results confirm the validity and effectiveness of the approach to parameter estimation with robust performance under varying conditions.
Figure 7 depicts a line graph of the RMSE changes over five runs of the algorithm, along with a 95% confidence interval. The light blue shaded area represents this interval around the mean value, indicating that there is a 95% probability that the RMSE values in future runs will fall within this range. The title of the graph is (RMSE with 95% Confidence Interval).
The narrowness of the confidence interval indicates minimal fluctuation in the RMSE values and their statistical stability. The 95% confidence interval was calculated based on the standard deviation of RMSE values obtained from five independent simulation runs, assuming a normal distribution. It was computed using the formula ± 1.96 × (σ/√n), where σ denotes the standard deviation and n is the number of runs (in this case, five), providing a statistically significant estimation of the variability and reliability of the optimization results. This confirms the accuracy of the optimization process and the reliability of the parameter estimates of the single-diode model (SDM) based on the WOA algorithm and demonstrates the stability of the RMSE values over multiple runs.

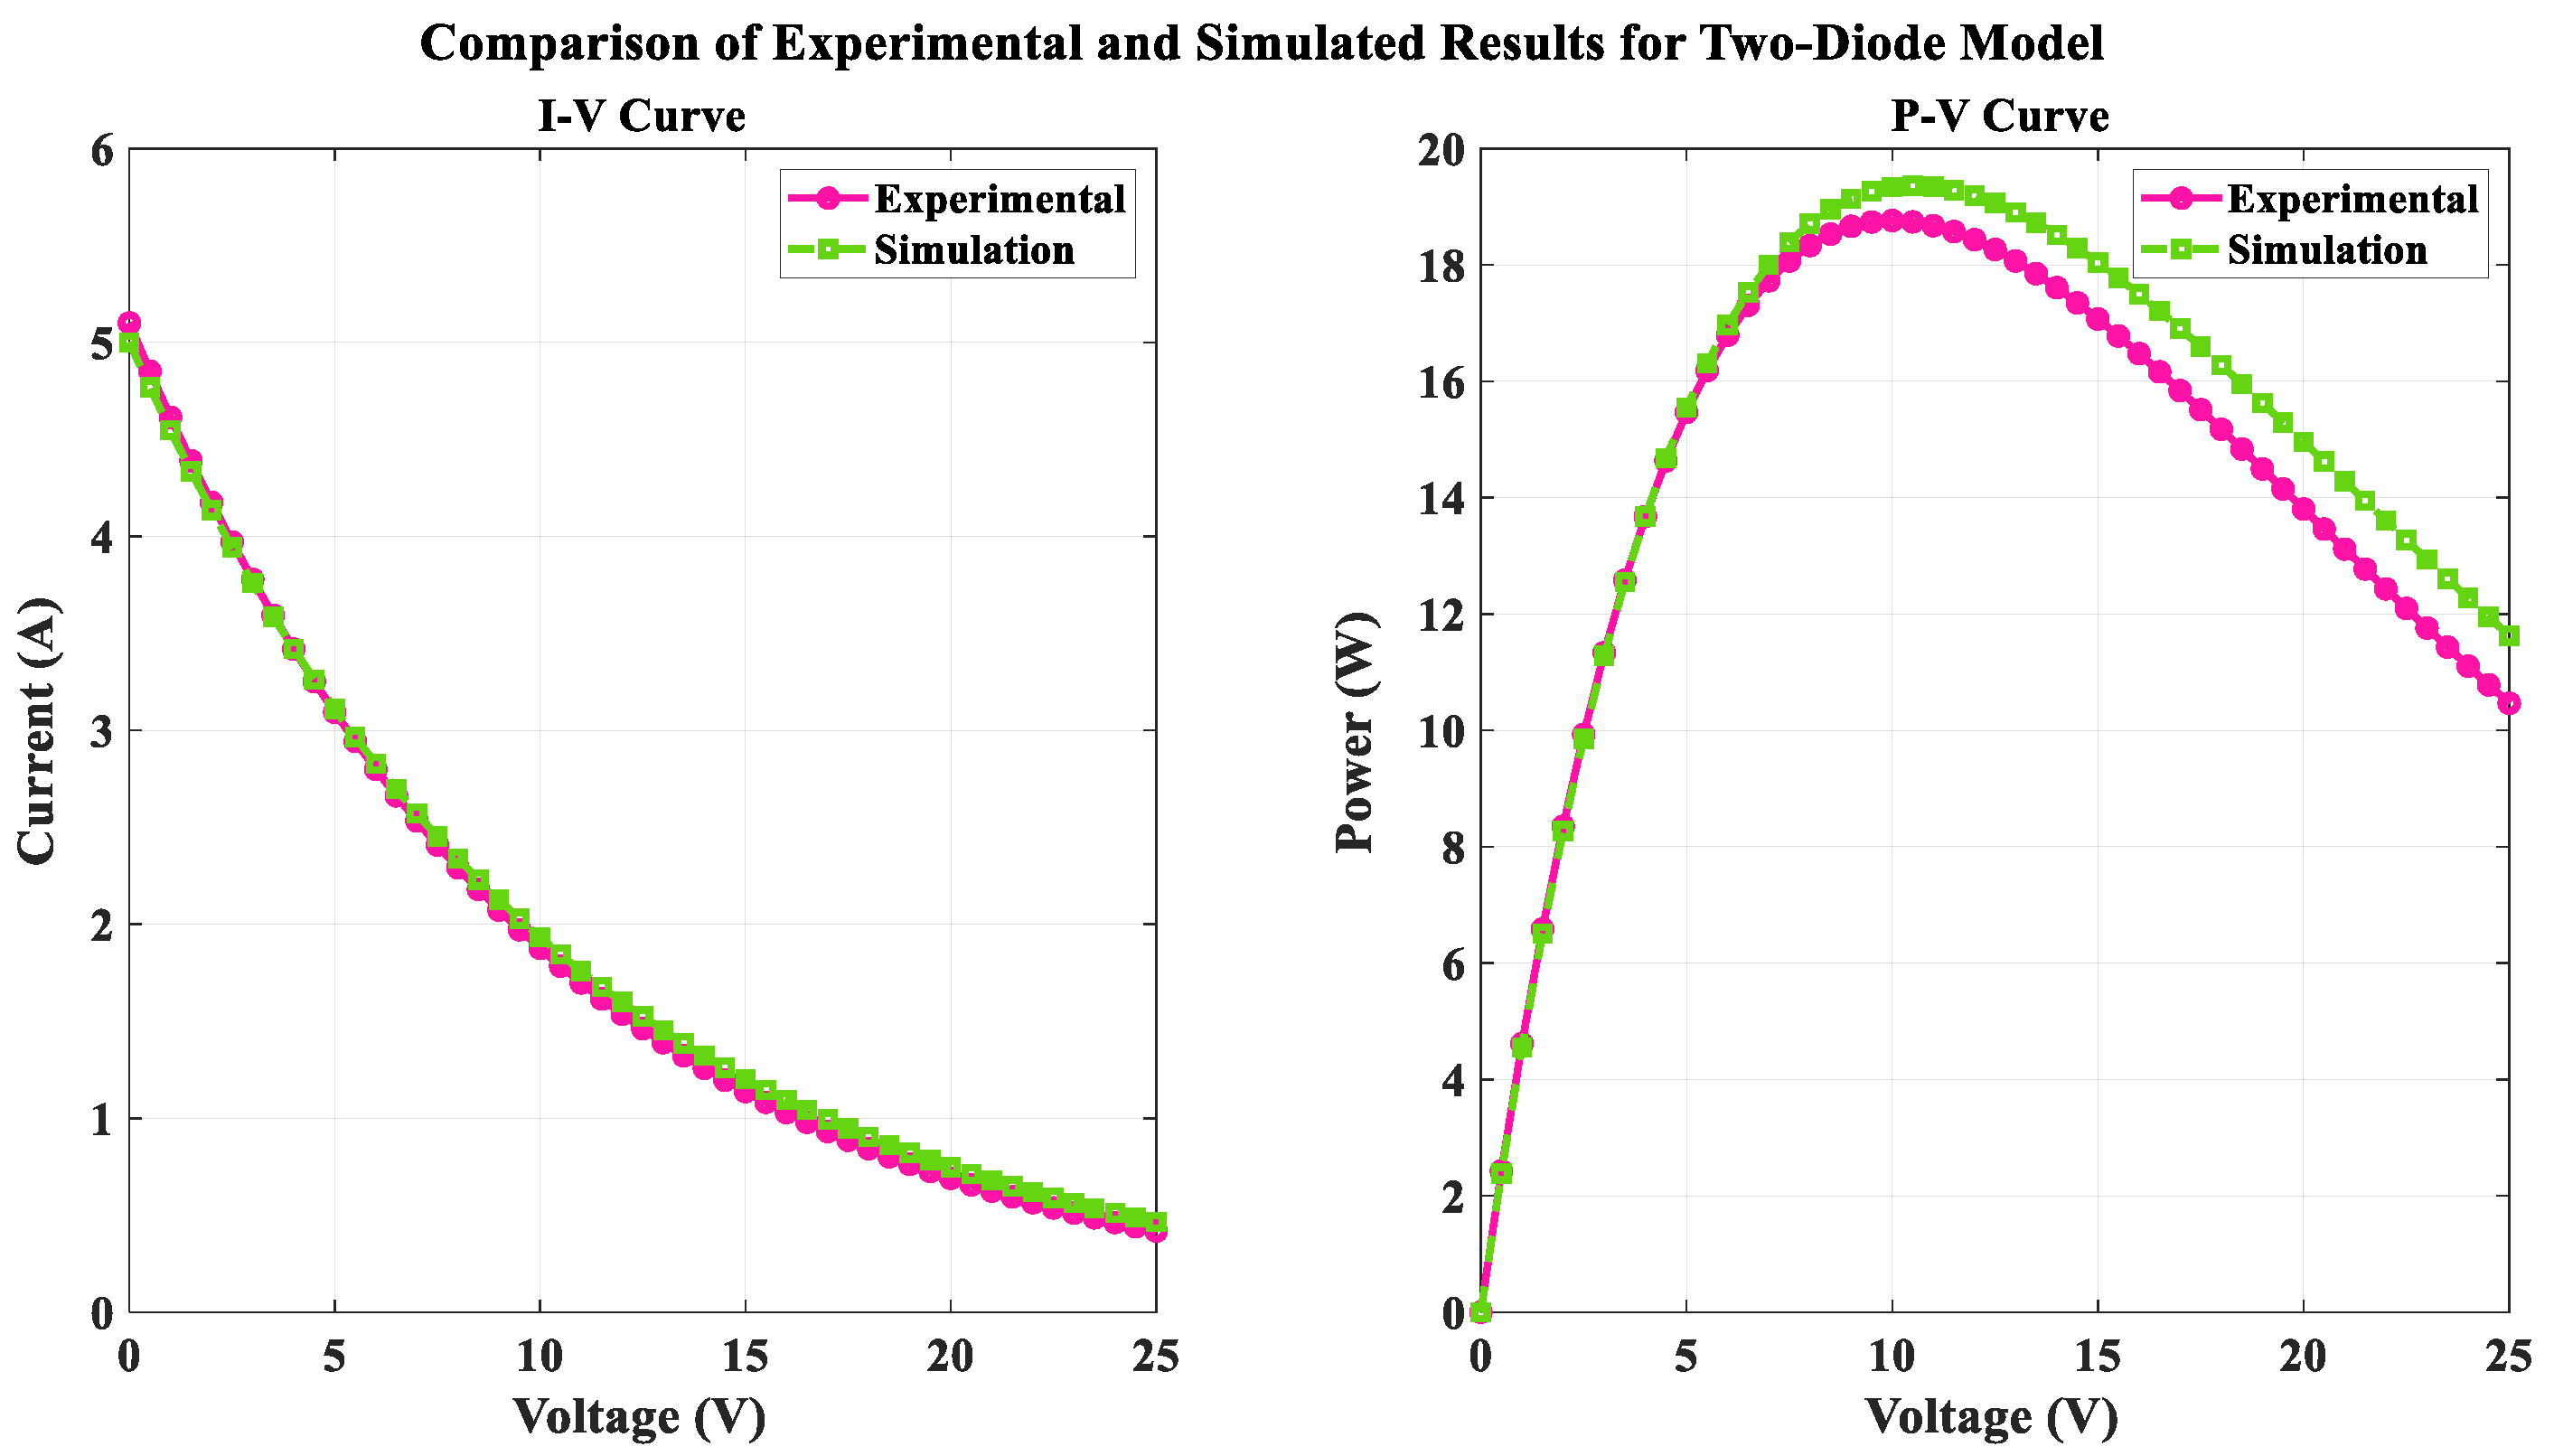
5.3. Improvement Outcomes for Double-Diode Model

The performance of the framework was tested by running it for 10 iterations of each WOA setting. The outputs of the simulations, as given in Table 5, are the best solutions obtained from such runs. This practice ensures that the reported outputs truly reflect the algorithm’s optimum performance and remain consistent over a number of runs.
WOA performance was examined for various numbers of whales (15, 35, 55, 75, 85, and 100), taking the primary parameters of I p h , Ι 01 , Ι 02 , R S h , R S , n 1 , n 2 , and RMSE. For all instances, the I p h was highly consistent at around 0.7607–0.7608 (A), reflecting stability within the optimization process.
The Ι 01 , Ι 02 varied significantly, indicating sensitivity to the population size, with values ranging from 0.2146 to 1.0000 (µA) for Ι 01 and 0.0725 to 0.4991 (µA) for Ι 02 . R S h exhibited an increasing trend with a maximum of 70.5001 Ω at 55 whales, while Rs showed a slight decline, stabilizing around 0.0351–0.0354 (Ω). The ( n 1 , n 2 ) also demonstrated variability, particularly at higher population sizes, yet remained within acceptable bounds for photovoltaic modeling. The RMSE values were consistently low, with the smallest error of 0.00069661 observed at 100 whales, signifying the algorithm’s high accuracy. In addition to RMSE, statistical metrics such as MSE, the coefficient of determination (R2), and Residual Standard Error (RSE) were calculated in order to provide a comprehensive assessment of model accuracy. The WOA-FMO framework consistently achieved high R2 values (>0.99) and low MSE for all test runs, indicating strong predictive performance and confirming the robustness of the proposed method.
Overall, the results highlight WOA’s capability to optimize parameters effectively, with population size influencing specific parameter variability and precision.
To validate the reliability of the WOA-FMO improvement technique, the program was run ten times, and the outputs from five of these runs are presented in Table 6. Comparing the outputs indicates that there is a negligible variation in the objective function among these runs. This consistency confirms that the algorithm’s reliable effectiveness is not due to chance.
The results from five test scenarios demonstrate the variability and reliability of the optimization approach across photovoltaic parameters.
The I p h was constant with slight fluctuations, ranging from 0.7600 to 0.7611 (A), demonstrating steady performance. The ( I 01 and I 02 ) exhibited larger fluctuations, with I 01 ranging from 0.1639 to 0.3386 (µA) and I 02 from 0.1222 to 0.3293 (µA), demonstrating sensitivity to test conditions. The shunt resistance ( R S h ) showed a wide range of values, from 48.0595 (Ω) to 77.7590 (Ω), while the series resistance ( R S ) was invariable, fluctuating between 0.0352 (Ω) and 0.0372 (Ω). The n 1   ,   n 2 also showed variability, with n 1 ranging from 1.4459 to 1.6490 and n 2 ranging from 1.4238 to 1.6268. Despite all these modifications, RMSE values were consistently low, with the minimum error being 0.00069661 for Test 1, which indicated that the method was highly precise and stable. These results highlight the method’s effectiveness in maintaining reliable parameter optimization under diverse testing conditions.
Table 7 presents that the execution with the lowest WOA-FMO value and minimum error provides the optimal outcomes from the method. This optimal outcome of the method can then be examined with other methods, which are presented in Table 7. The outputs of other algorithms are extracted from references.
The comparative analysis of optimization methods highlights their performance in estimating key photovoltaic parameters, including R S h , R S , I p h , I 01 , I 02 , n 1 , n 2 , and RMSE. Among the methods, the WOA-FMO achieved the lowest RMSE (7.28 × 10⁻⁴), showcasing its superior accuracy. It also maintained stable parameter values, such as R S = 0.0359 (Ω), and R S h   = 57.2398 (Ω), with reasonable I 01   = 0.2038 (µA), I 02 = 0.3059 (µA). In contrast, GOTLBO and WOA yielded slightly higher RMSE values of 9.8742 × 10⁻⁴ and 9.8638 × 10⁻⁴, respectively, with Rs and R S h values closely aligned with WOA-FMO. Methods like IJAYA and PGJAYA exhibited significant variability in I 02   (like PGJAYA: 0.88534 (µA), IJAYA: 0.75094 (µA) and R S h , yet maintained competitive RMSE values near 9.8263 × 10⁻⁴. The GA displayed the poorest performance, with an RMSE of 3.60 × 10⁻¹ and extreme deviations in I 01 and I 02 (both near zero), indicating lower reliability. Overall, WOA-FMO demonstrated the most balanced performance, excelling in accuracy and consistency, making it a robust choice for photovoltaic parameter optimization.
As shown in Figure 8, the solution from the GA algorithm has the worst value, whereas the solution determined by using the WOA algorithm is smaller than the other solutions.
Figure 9 presents a comparative analysis between experimental measurements and simulation results for a two-diode solar cell model. The figure includes two subplots: an I-V curve and a P-V curve.
  • Current-voltage (I-V) curve
The effectiveness of the two-diode model in predicting the actual output current of the solar cell at different voltage levels. Ideally, the simulation curve should follow the experimental curve, indicating a strong agreement between the model predictions and real-world performance.
  • Power-voltage (P-V) curve
The P-V curve is crucial for identifying the maximum power point (MPP) of the solar cell—the operating point at which maximum power is delivered. The peak of each curve represents the MPP. A comparison between the simulated and experimental P-V curves highlights the success of the model in predicting the output power and accurately estimating the MPP.
In summary, this figure provides a visual assessment of the accuracy of the two-diode model by comparing simulated and measured current and power values over a wide range of voltages. The closer the simulation curves are to the experimental data, the better the model represents the actual behavior of the solar cell.

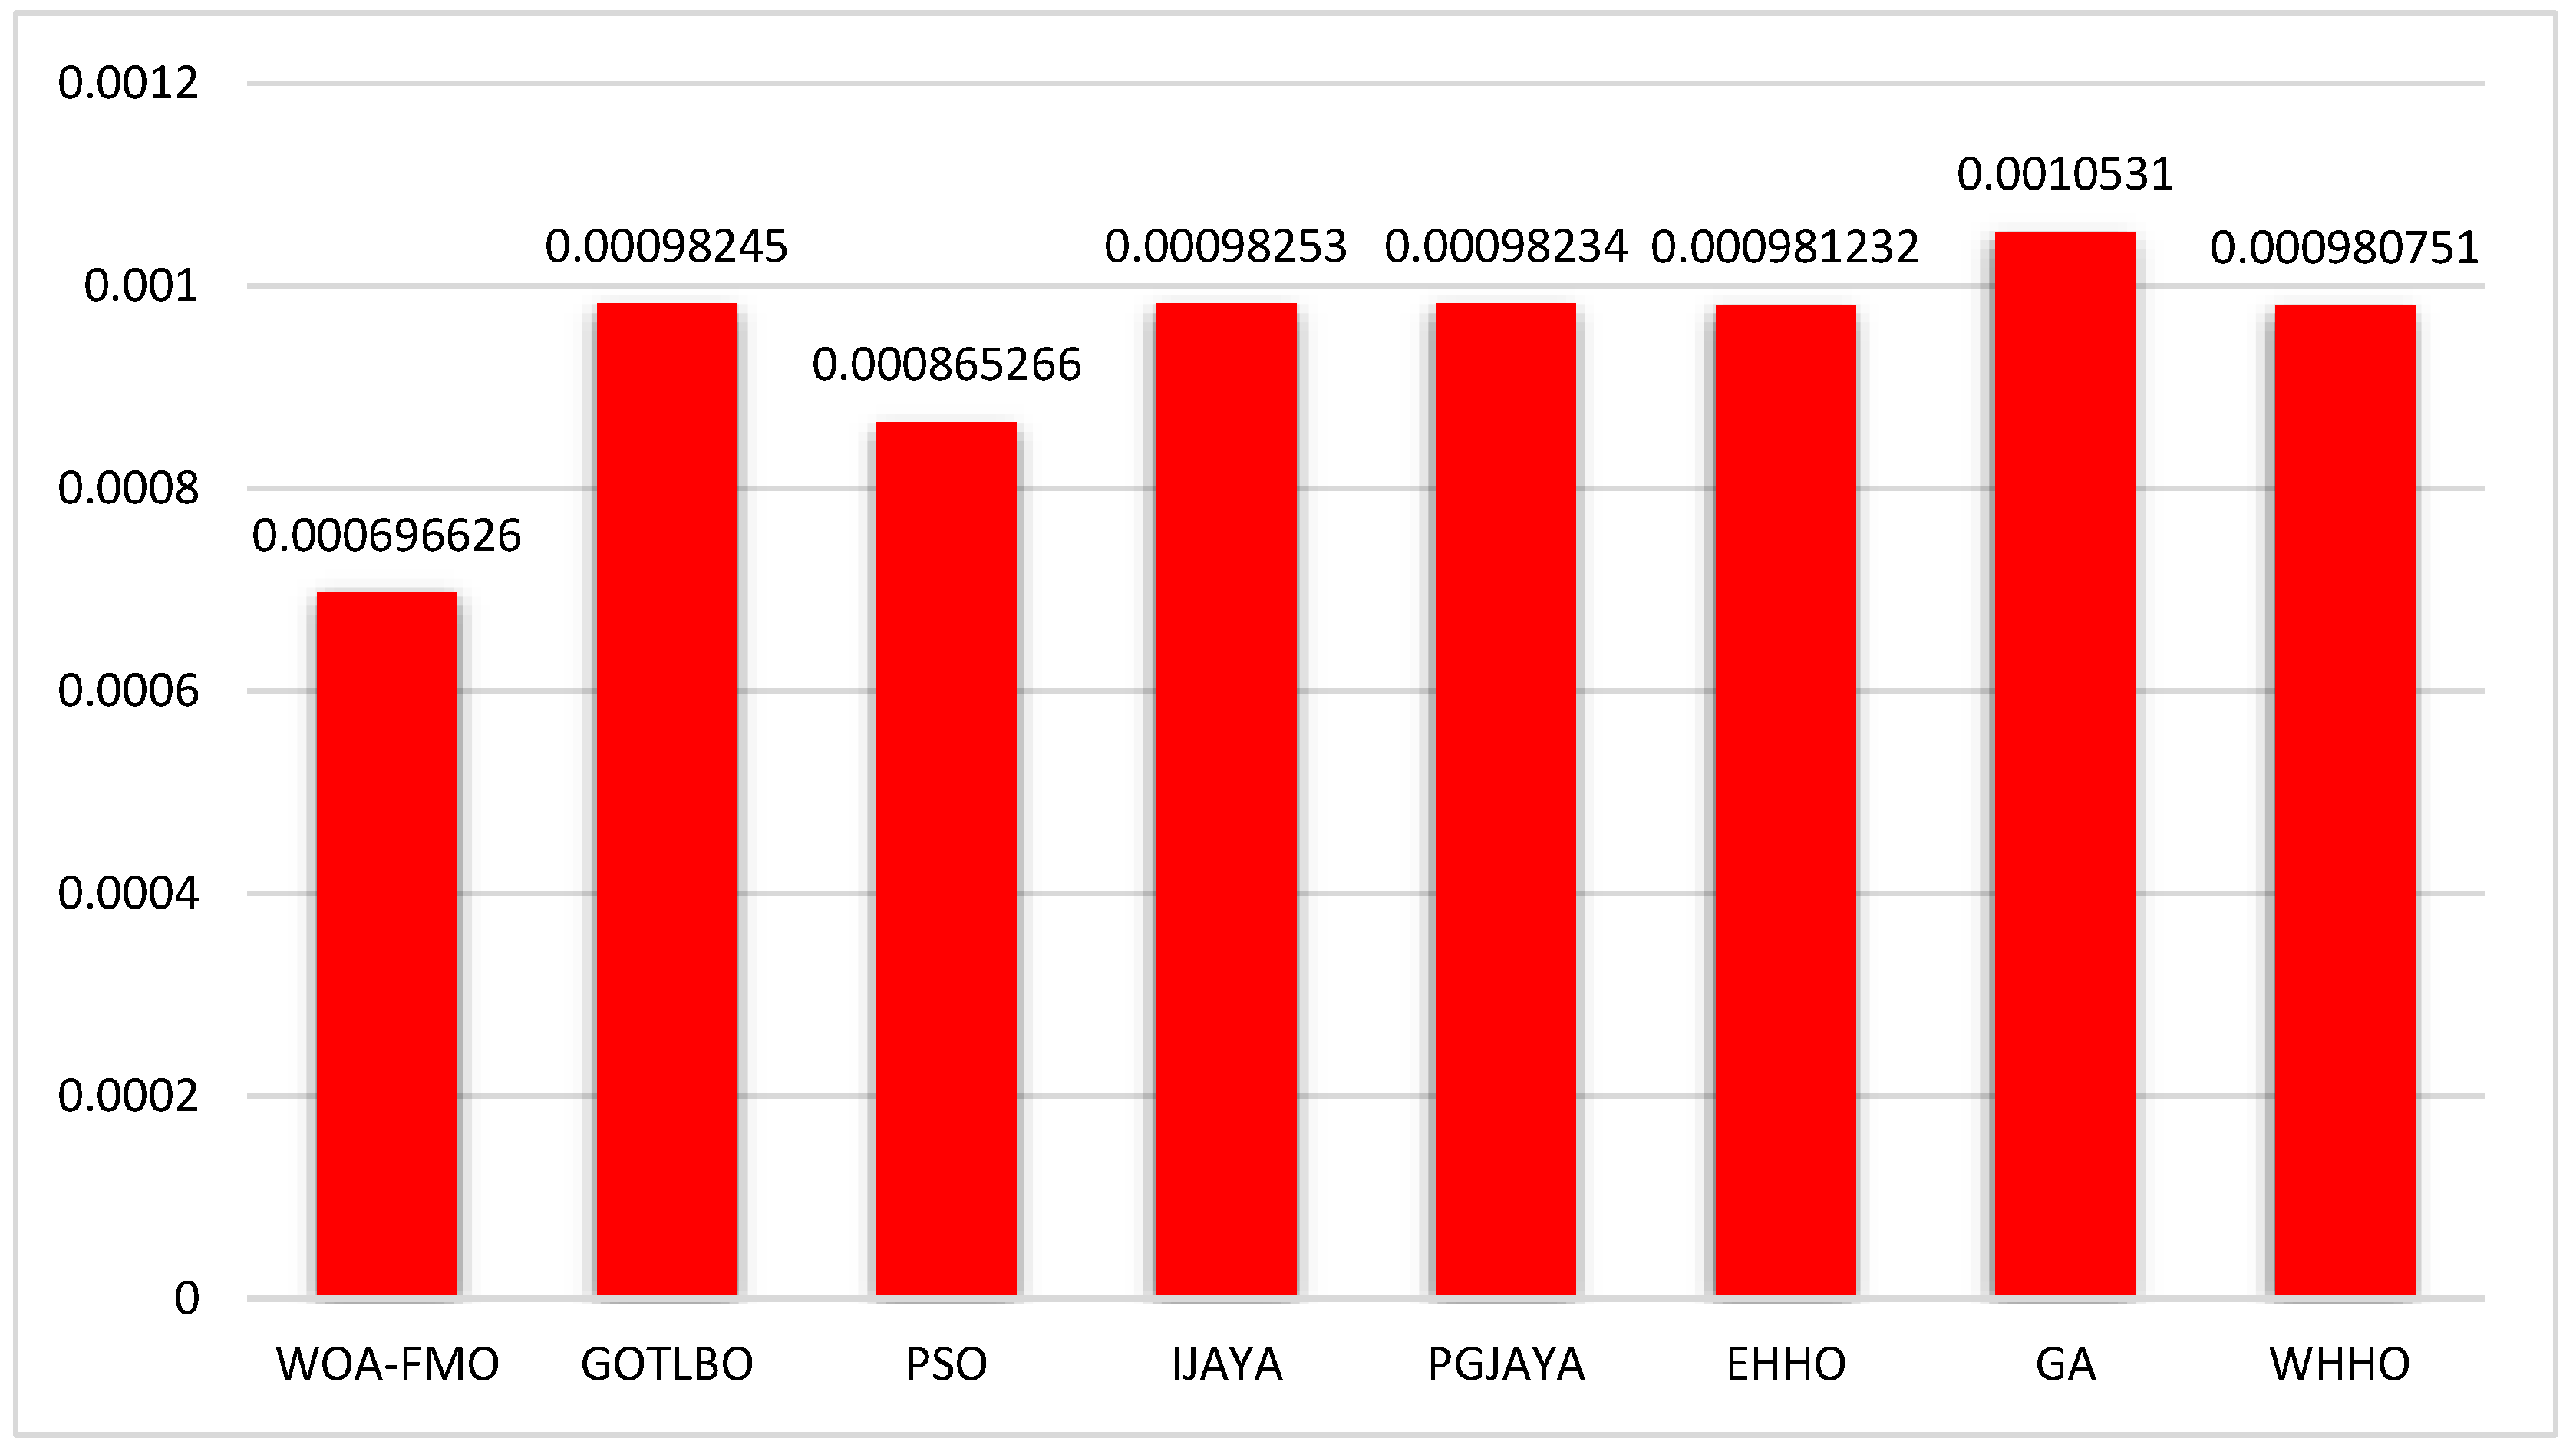
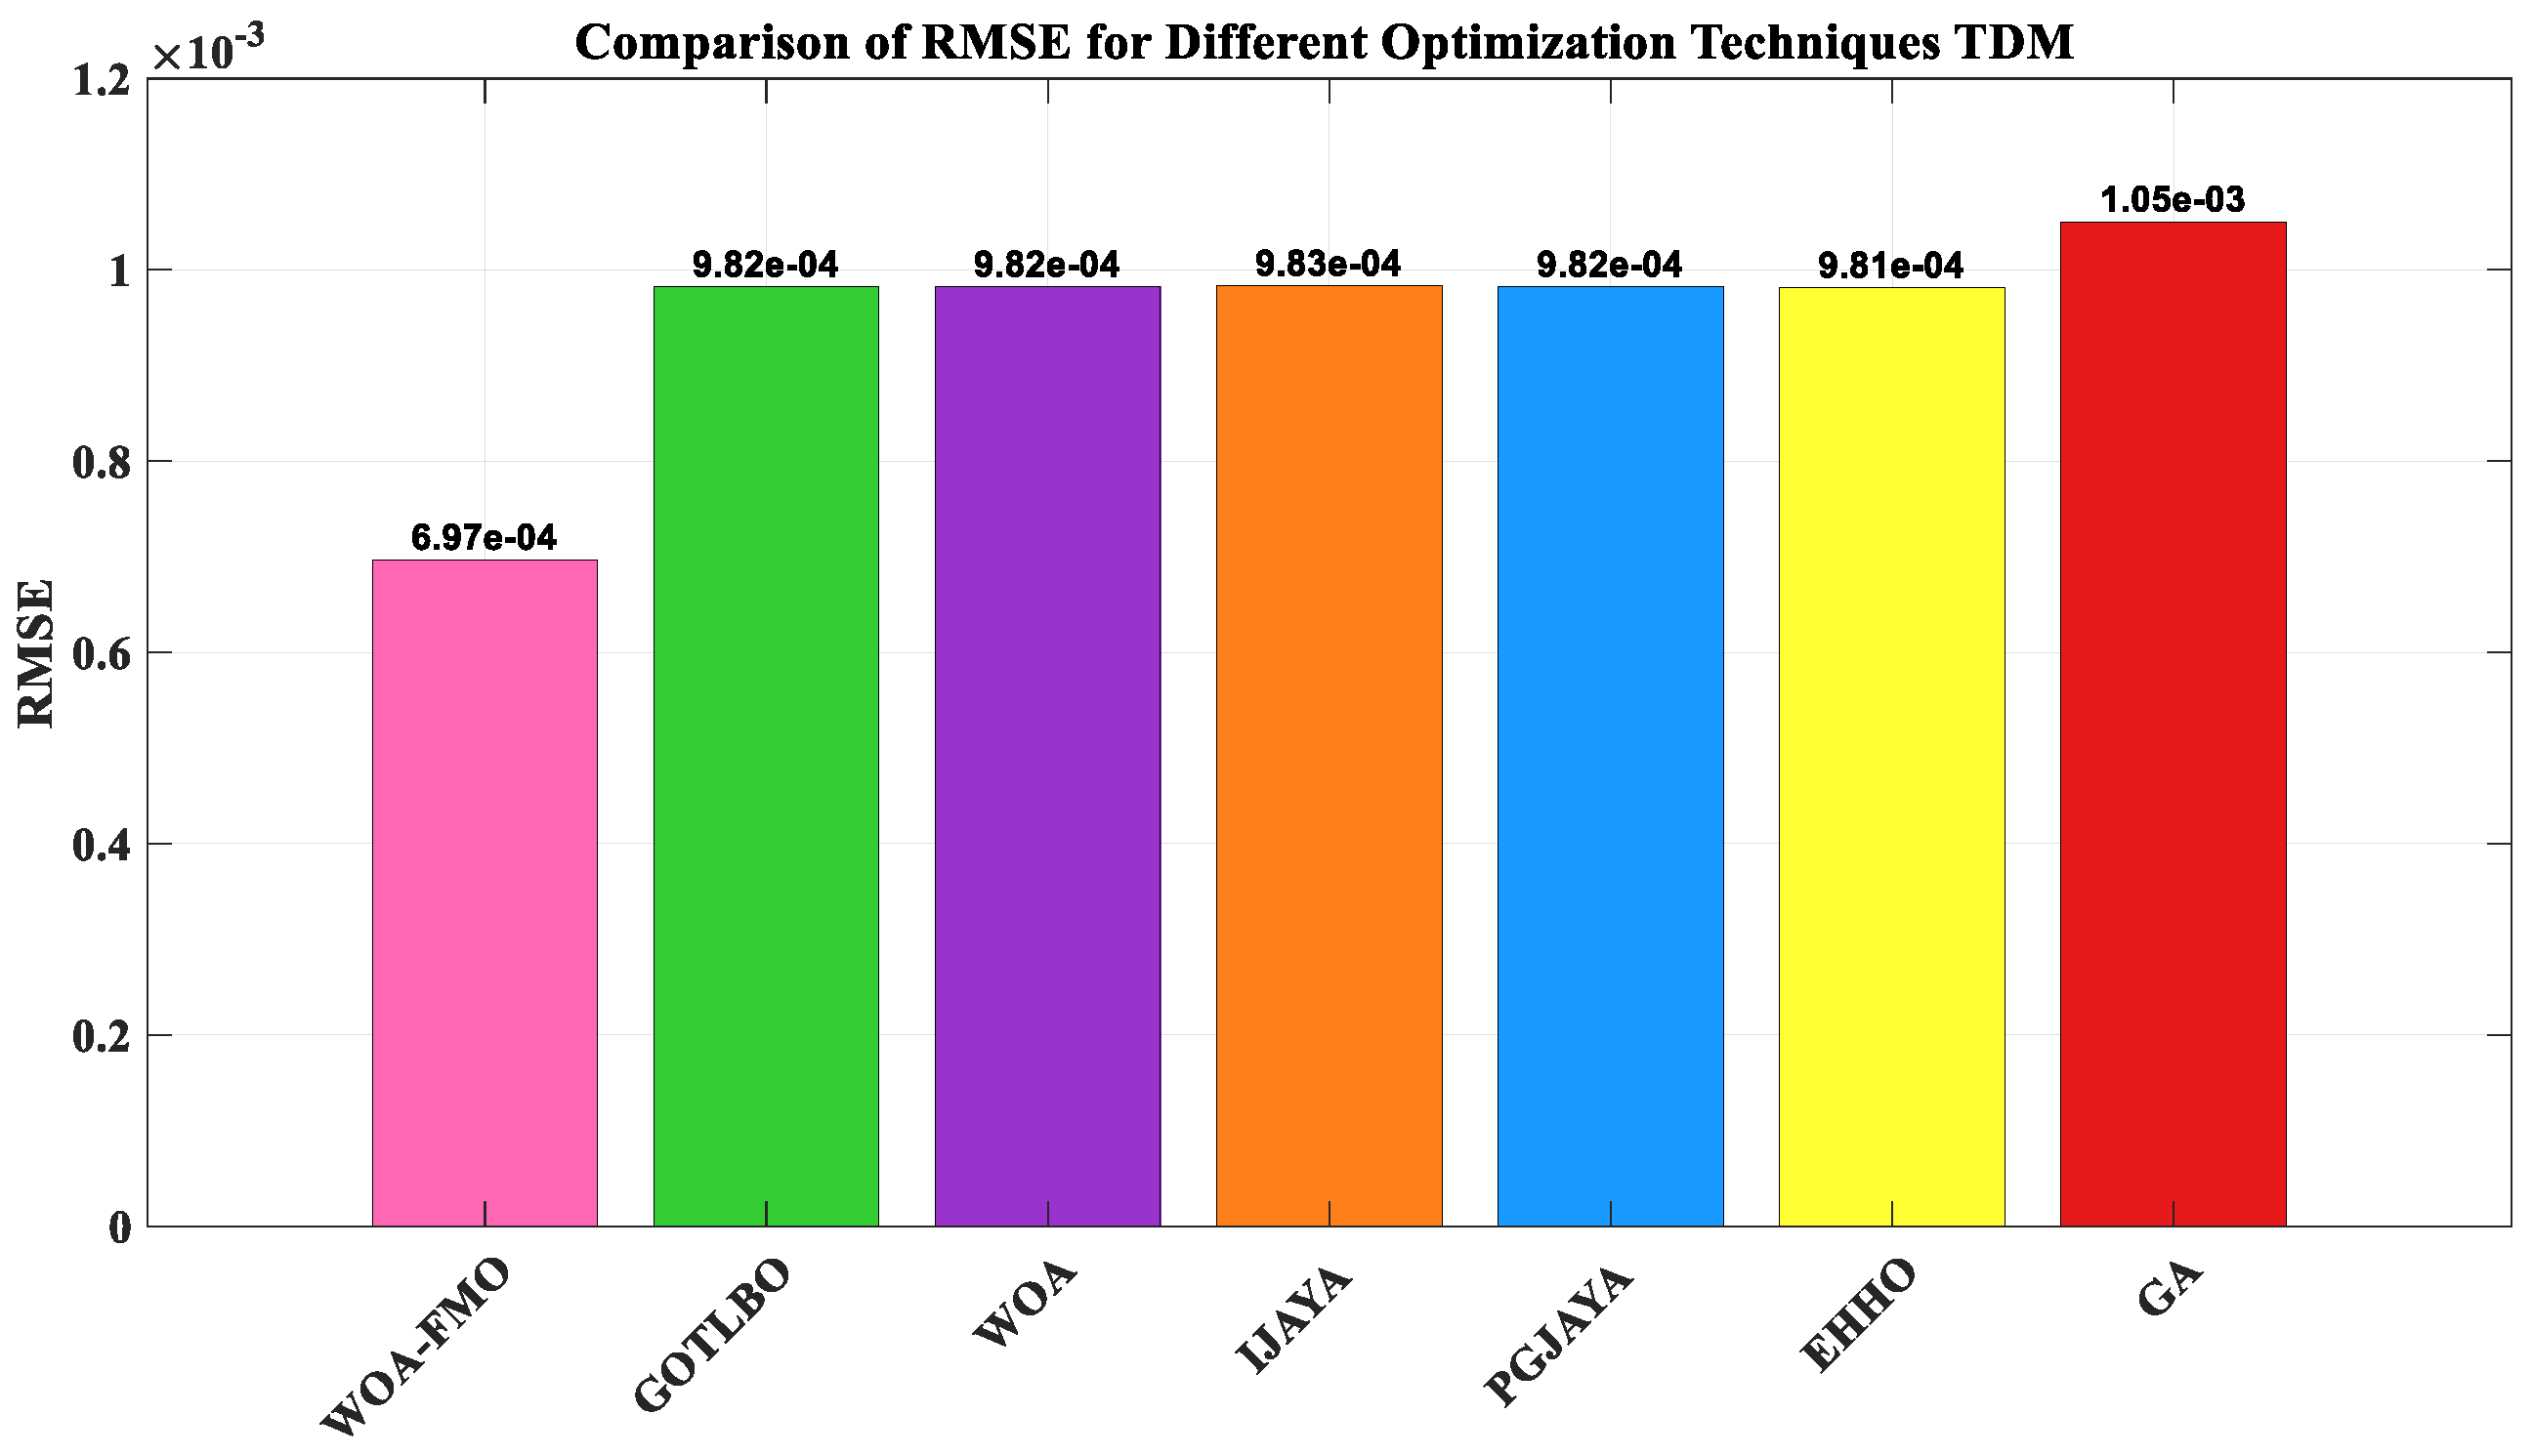
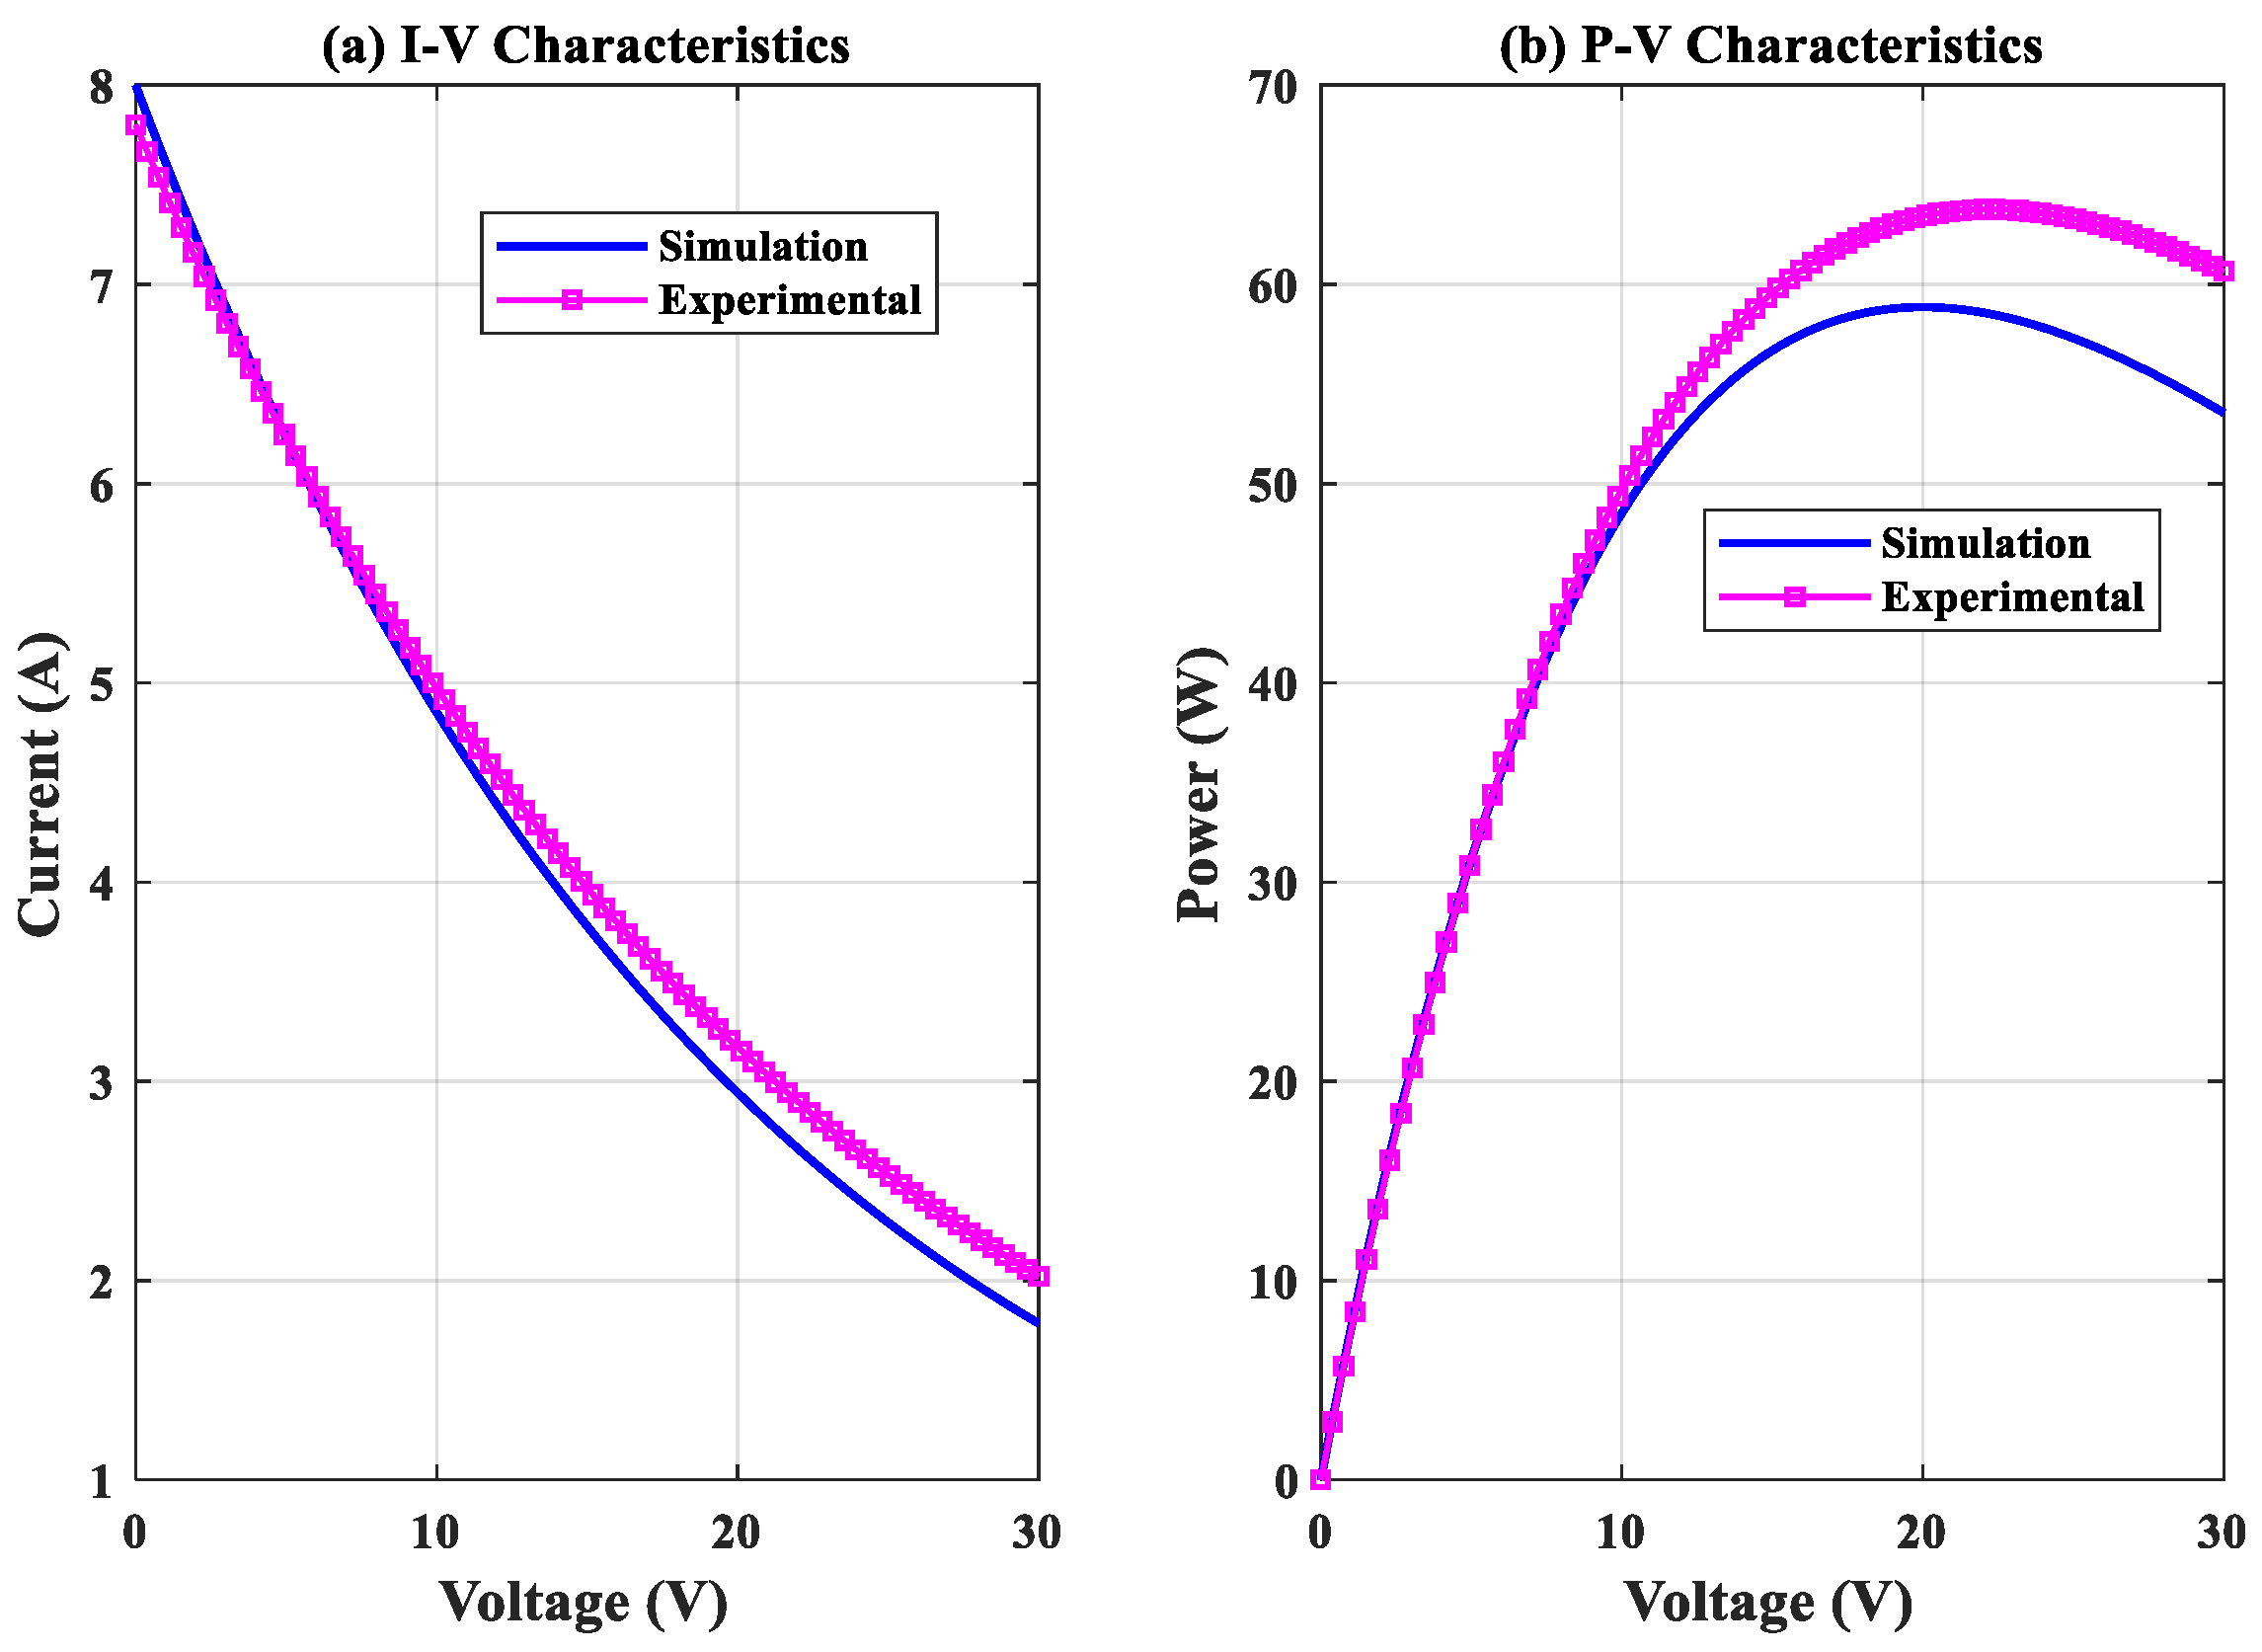
5.4. Outcomes of Optimization of the TDM

The algorithm was executed 10 times for the various configurations of WOA, and simulation results are summarized in Table 8. This table displays a contrast of the outputs from ten runs of the WOA-FMO method applied to the triple-diode photovoltaic model.
The performance of the WOA was systematically investigated under different population sizes to assess its robustness in estimating photovoltaic parameters. The results showed that the I p h exhibited remarkable stability, with only minor variations observed in different population settings. While the I 01 , I 02 , I 03 exhibited moderate variability, especially at larger population sizes, their overall behavior remained within an acceptable range. In addition, the R S and R S h experienced limited deviation and remained stable throughout the simulations. n 1 , n 2 ,   a n d   n 3 were mostly stable, however, a gradual increase in n 2 was observed as the population size increased. Notably, the RMSE remained consistently low at 6.966 × 10⁻⁴ across all population sizes tested, underscoring the accuracy and reliability of WOA. These findings suggest that increasing the population size does not provide a significant advantage in terms of accuracy and thus confirm the algorithm’s efficiency even with smaller populations.
To verify the correctness of the WOA-FMO technique, the code was run five times, and the outcomes are illustrated in Table 9. Through analyzing the outputs, there is little difference in the value of the objective function between these five runs. This consistency is a sign that the robustness of the algorithm is not due to chance.
The results from five test scenarios highlight the performance of the optimization process across critical photovoltaic parameters. The I p h   demonstrated high consistency, ranging narrowly between 0.7603 (A) and 0.7614 (A). Saturation currents ( I 01 , I 02 , and I 03 ) showed variability, with I 01 fluctuating from 0.1237 (µA) to 0.3307 (µA), I 02 from 0.0848 (µA) to 0.3380 (µA), and I 03 exhibiting a broader range from 0.1518 (µA) to 0.9257 (µA). R S h displayed significant variation, spanning from 48.1124 (Ω) to 81.3038 (Ω), while R S   remained relatively stable, ranging from 0.03528 (Ω) to 0.03806 (Ω). The ideality factors ( n 1 , n 2 , and n 3 ) also varied across tests, with n 1 increasing to a maximum of 1.7264 and n 3 reaching a peak of 2 in Test 1. Despite these fluctuations, the RMSE remained consistently low, with the smallest error of 0.00068758 observed in Test 2, underscoring the accuracy and reliability of the optimization process. These results reflect the method’s robustness while highlighting minor sensitivities to parameter variations across tests. It is important to mention that the outcomes from other approaches are sourced from reference [32].
Table 10 shows the performance of seven optimization algorithms (IJAYA, PGJAYA, EHHO, and GA) in estimating the nine parameters of the three-diode solar cell model and evaluates their accuracy by the RMSE criterion. The WOA-FMO algorithm with the lowest RMSE performs best. Comparing the estimated values for each parameter across algorithms provides insights into the stability and characteristics of each algorithm and demonstrates the superiority of WOA-FMO in this evaluation.
WOA-FMO showed the highest accuracy with the lowest RMSE value of 6.966263 × 10⁻⁴ and maintained stable values for most parameters, such as I p h = 0.760718 (A) and R S h = 0.035933 (Ω). In contrast, other methods such as GA showed RMSE significantly higher than 1.05 × 10⁻³, with less consistent results, such as higher R S = 0.0357 (Ω) and lower I p h = 0.7605 (A). WOA and GOTLBO gave similar results, with RMSE values of about 9.82 × 10⁻⁴ and almost identical photocurrents of 0.7607 (A), but some variations in ( I 01 , I 02 ) and ideality factors ( n 1 , n 2 , and n 3 ). IJAYA, PGJAYA, and EHHO showed slightly higher RMSE values compared to WOA and WOA-FMO, while EHHO showed significant variations in parameters such as I 03   = 0.5861 (µA). Despite these differences, all the methods performed relatively well in optimizing the parameters, but WOA-FMO emerged as the most reliable algorithm in terms of accuracy and stability. Figure 10 shows the objective function RMSE values for the different techniques. From the figure, it is clear that the highest value is given by the GA algorithm and the lowest RMSE is given by the WOA technique, which outperforms all other techniques.
Figure 11 compares the RMSE values obtained by different optimization techniques. A lower RMSE value means better performance in terms of prediction accuracy and data fitting process. Considering all the analyzed methods, the WOA algorithm achieves the lowest RMSE value of 6.966263 × 10⁻⁴, demonstrating superior accuracy and high precision. This indicates that the WOA optimization technique provides more stable and accurate results than other algorithms tested.
The results from the new approach are contrasted with real test results, as may be realized from Figure 11, indicating the power voltage and current voltage characteristics.
  • I-V (current-voltage) characteristics
This figure illustrates the relationship between the voltage (V) across the solar cell (horizontal axis) and the current (A) produced by it (vertical axis). A comparison of these two curves shows how well the simulated model is able to accurately predict the current-voltage behavior of the real solar cell. The closer the two curves are to each other, the more accurate the model is. In this graph, it can be seen that at low voltages, there is a relatively good agreement between the simulation and experimental results, but as the voltage increases, a slight difference between the two curves is observed.
  • P-V Characteristics
This graph shows the relationship between the voltage (V) across the solar cell (horizontal axis) and the power (W) output from it (vertical axis). Power is the product of voltage and current ( P = V × Ι ).
The P-V curve is very important for determining the maximum power point (MPP) of the solar cell. This point shows the voltage and current at which the cell produces the most power. The peak of each curve represents the MPP. In this graph, it is observed that the maximum power point occurs at approximately the same voltage in the simulation and experimental results, but the power value in the simulation is slightly lower than the value measured in the experiment.
In summary, this figure shows that the TDM is somewhat able to predict the electrical behavior (current and power) of the real solar cell, although at some points, especially at higher voltages, there are discrepancies between the simulation and experimental results. This comparison helps to evaluate the accuracy and efficiency of the model used.
Figure 12 depicts the results of five independent runs of the SDM, DDM, and TDM models in order to assess their stability and robustness. In Figure 12a, box plots of the distribution of RMSE values for each model are shown. These plots confirm the concentration of data in narrow ranges and the absence of outliers for all three models, indicating the consistency of their performance. In Figure 12b, a comparison of the mean RMSE values along with 95% confidence intervals for each model is presented. The very narrow confidence intervals for the SDM (0.000773, 0.000773), DDM (0.000812, 0.000812), and TDM (0.000696, 0.000696) models indicate the low variability and high reliability of the results obtained using the WOA-FMO approach in all three models.

6. Conclusions

This study introduces a hybrid optimization method based on deep learning, WOA-FMO, for estimating the parameters of PV models. Simulation results on single-diode (SDM), double-diode (DDM), and triple-diode (TDM) models showed that the proposed WOA-FMO algorithm consistently outperforms other algorithms in reducing the RMSE error and maintaining parameter stability. This new method (WOA-FMO) has high flexibility and stability against population size changes, which makes it suitable for practical implementation in troubleshooting and designing PV systems.
The use of the whale optimization algorithm (WOA) in the process of estimating solar cell and module parameters has opened new horizons in the research and development of renewable energies. The ability of WOA to balance search and exploitation improves the accuracy and efficiency of nonlinear parameter estimation and is computationally efficient. These features increase the reliability and efficiency of solar systems.
In addition to high accuracy, the iterative structure of WOA allows for rapid convergence to the optimal response, making it very suitable for practical applications in various climate conditions and PV technologies. However, there is still room for further development of this method.
In conclusion, the study demonstrates that the WOA-FMO algorithm achieves very small RMSE values, reaching as little as 6.966 × 10⁻⁴, while maintaining strong stability on various tested photovoltaic models. In addition, the demonstrated robustness suggests that this technique could be effectively applied to other advanced PV technologies, such as perovskite and tandem solar cells, which exhibit complex current-voltage characteristics and demand highly accurate parameter estimation.
Future research should focus on implementing this method in real-time scenarios under various environmental conditions and extending its application to emerging technologies such as perovskite solar cells.

7. Limitations and Future Research Directions

Current Limitations: The present method requires significant computational resources due to its hybrid nature. Also, its performance can be affected by instantaneous changes in radiation and temperature.
Future Research Directions: In the future, online learning models can be integrated to dynamically adapt parameters to environmental conditions. In addition, testing this method in integrated microgrid systems and developing the model to consider the effects of partial shading and solar cell depreciation will be research priorities. Also, future research could investigate combining the WOA with other intelligent algorithms or evaluating its performance under variable operating conditions.

Author Contributions

Methodology, H.A.F.E., S.A.A. and J.R.; Software, J.R.; Validation, H.A.F.E. and J.R.; Formal analysis, J.R. and R.G.; Writing—original draft, H.A.F.E.; Writing—review & editing, S.A.A. and R.G.; Visualization, H.A.F.E.; Supervision, S.A.A. All authors have read and agreed to the published version of the manuscript.

Funding

This research received no external funding.

Data Availability Statement

The datasets generated during and analyzed during the current study are available from the corresponding author on reasonable request.

Conflicts of Interest

The authors declare no conflict of interest.

Abbreviations

The following abbreviations are used in this manuscript:
WOAWhale Optimization Algorithm
FMOFishier Mantis Optimization
SDMSingle-Diode Model
DDMDouble-Diode Model
TDMThree-Diode Model
RMSERoot Mean Square Error
GAGenetic Algorithm
PSOParticle Swarm Optimization
CNNConvolutional Neural Network
DLDeep Learning
IphPhotocurrent
IoSaturation Current
RsSeries Resistance
RshShunt Resistance
nIdeality Factor

References

  1. Tawalbeh, M.; Al-Othman, A.; Kafiah, F.; Abdelsalam, E.; Almomani, F.; Alkasrawi, M. Environmental impacts of solar photovoltaic systems: A critical review of recent progress and future outlook. Sci. Total Environ. 2021, 759, 143528. [Google Scholar] [CrossRef] [PubMed]
  2. Izam, N.S.M.N.; Itam, Z.; Sing, W.L.; Syamsir, A. Sustainable development perspectives of solar energy technologies with focus on solar Photovoltaic—A review. Energies 2022, 15, 2790. [Google Scholar] [CrossRef]
  3. Tripathi, A.K.; Aruna, M.; Elumalai, P.V.; Karthik, K.; Khan, S.A.; Asif, M.; Rao, K.S. Advancing solar PV panel power prediction: A comparative machine learning approach in fluctuating environmental conditions. Case Stud. Therm. Eng. 2024, 59, 104459. [Google Scholar] [CrossRef]
  4. Gu, Z.; Xiong, G.; Fu, X. Parameter extraction of solar photovoltaic cell and module models with metaheuristic algorithms: A review. Sustainability 2023, 15, 3312. [Google Scholar] [CrossRef]
  5. Rahman, M.W.; Bathina, C.; Karthikeyan, V.; Prasanth, R. Comparative analysis of developed incremental conductance (IC) and perturb & observe (P&O) MPPT algorithm for photovoltaic applications. In Proceedings of the 2016 10th International Conference on Intelligent Systems and Control (ISCO), Coimbatore, India, 7–8 January 2016; IEEE: Piscataway, NJ, USA, 2016; pp. 1–6. [Google Scholar]
  6. Martins, F.R.; Pereira, E.B.; Abreu, S.L. Satellite-derived solar resource maps for Brazil under SWERA project. Sol. Energy 2007, 81, 517–528. [Google Scholar] [CrossRef]
  7. Nunes, H.G.G.; Silva, P.N.C.; Pombo, J.A.N.; Mariano, S.; Calado, M.R.A. Multiswarm spiral leader particle swarm optimisation algorithm for PV parameter identification. Energy Convers. Manag. 2020, 225, 113388. [Google Scholar] [CrossRef]
  8. Dev, A.; Kumar, V.; Pathak, D.; Tummala, A.S.L.V.; Sharma, S.; Kuppan, V. Improved Extraction of Parameters of Solar PV Cell Diode Model using Marine Walrus Inspired Optimization Algorithm. IEEE Access 2024, 12, 181217–181231. [Google Scholar] [CrossRef]
  9. Tzanetos, A.; Dounias, G. Nature inspired optimization algorithms or simply variations of metaheuristics? Artif. Intell. Rev. 2021, 54, 1841–1862. [Google Scholar] [CrossRef]
  10. Ye, M.; Wang, X.; Xu, Y. Parameter extraction of solar cells using particle swarm optimization. J. Appl. Phys. 2009, 105, 094502. [Google Scholar] [CrossRef]
  11. Singla, M.K.; Gupta, J.; Nijhawan, P.; Singh, P.; Giri, N.C.; Hendawi, E.; Abu El-Sebah, M.I. Parameter estimation techniques for photovoltaic system modeling. Energies 2023, 16, 6280. [Google Scholar] [CrossRef]
  12. Jeridi, A. Optimizing Photovoltaic Solar Model Parameters. Res. Sq. 2024. [Google Scholar] [CrossRef]
  13. Bensidhoum, T.; Lekouaghet, B.; Touil, S.-A. Photovoltaic model parameters estimation via the fully informed search algorithm. Int. J. Robot. Control Syst. 2024, 4, 929–940. [Google Scholar] [CrossRef]
  14. Ghetas, M.; Elshourbagy, M. Parameters extraction of photovoltaic models using enhanced generalized normal distribution optimization with neighborhood search. Neural Comput. Appl. 2024, 36, 14035–14052. [Google Scholar] [CrossRef]
  15. Ishaque, K.; Salam, Z.; Taheri, H.; Shamsudin, A. A critical evaluation of EA computational methods for Photovoltaic cell parameter extraction based on two diode model. Sol. Energy 2011, 85, 1768–1779. [Google Scholar] [CrossRef]
  16. Rao, R.V.; Patel, V. An elitist teaching-learning-based optimization algorithm for solving complex constrained optimization problems. Int. J. Ind. Eng. Comput. 2012, 3, 535–560. [Google Scholar] [CrossRef]
  17. Easwarakhanthan, T.; Bottin, J.; Bouhouch, I.; Boutrit, C. Nonlinear minimization algorithm for determining the solar cell parameters with microcomputers. Int. J. Sol. Energy 1986, 4, 1–12. [Google Scholar] [CrossRef]
  18. Spampinato, C.; La Magna, P.; Valastro, S.; Smecca, E.; Arena, V.; Bongiorno, C.; Mannino, G.; Fazio, E.; Corsaro, C.; Neri, F. Infiltration of CsPbI3: EuI2 Perovskites into TiO2 Spongy Layers Deposited by gig-lox Sputtering Processes. Solar 2023, 3, 347–361. [Google Scholar] [CrossRef]
  19. Orioli, A.; Di Gangi, A. A procedure to calculate the five-parameter model of crystalline silicon photovoltaic modules on the basis of the tabular performance data. Appl. Energy 2013, 102, 1160–1177. [Google Scholar] [CrossRef]
  20. Sandrolini, L.; Artioli, M.; Reggiani, U. Numerical method for the extraction of photovoltaic module double-diode model parameters through cluster analysis. Appl. Energy 2010, 87, 442–451. [Google Scholar] [CrossRef]
  21. Bonanno, F.; Capizzi, G.; Graditi, G.; Napoli, C.; Tina, G.M. A radial basis function neural network based approach for the electrical characteristics estimation of a photovoltaic module. Appl. Energy 2012, 97, 956–961. [Google Scholar] [CrossRef]
  22. Amrouche, B.; Guessoum, A.; Belhamel, M. A simple behavioural model for solar module electric characteristics based on the first order system step response for MPPT study and comparison. Appl. Energy 2012, 91, 395–404. [Google Scholar] [CrossRef]
  23. Wang, J.; Yang, B.; Li, D.; Zeng, C.; Chen, Y.; Guo, Z.; Zhang, X.; Tan, T.; Shu, H.; Yu, T. Photovoltaic cell parameter estimation based on improved equilibrium optimizer algorithm. Energy Convers. Manag. 2021, 236, 114051. [Google Scholar] [CrossRef]
  24. Garip, Z. Parameters estimation of three-diode photovoltaic model using fractional-order Harris Hawks optimization algorithm. Optik 2023, 272, 170391. [Google Scholar] [CrossRef]
  25. Zhang, F.; Wang, X.; Wang, W.; Zhang, J.; Du, R.; Li, B.; Liu, W. Uncertainty analysis of photovoltaic cells to determine probability of functional failure. Appl. Energy 2023, 332, 120495. [Google Scholar] [CrossRef]
  26. Yusupov, Z.; Yaghoubi, E.; Yaghoubi, E. Controlling and tracking the maximum active power point in a photovoltaic system connected to the grid using the fuzzy neural controller. In Proceedings of the 2023 14th International Conference on Electrical and Electronics Engineering (ELECO), Bursa, Turkiye, 30 November–2 December 2023; IEEE: Piscataway, NJ, USA, 2023; pp. 1–5. [Google Scholar]
  27. Ocaya, R.O.; Yakuphanoglu, F. A new symmetry-based extraction method of Schottky diode parameters from resistance-compensated IV characteristics. arXiv 2021, arXiv:2106.12324. [Google Scholar]
  28. Macabebe, E.Q.B.; Sheppard, C.J.; Van Dyk, E.E. Parameter extraction from I–V characteristics of PV devices. Sol. Energy 2011, 85, 12–18. [Google Scholar] [CrossRef]
  29. Tay, S.; Lim, I.; Ye, Z.; Yang, D.; Garrigós, A. PV parameter identification using reduced IV data. In Proceedings of the IECON 2017-43rd Annual Conference of the IEEE Industrial Electronics Society, Beijing, China, 29 October–1 November 2017; IEEE: Piscataway, NJ, USA, 2017; pp. 2653–2657. [Google Scholar]
  30. Jahromi, M.Z.; Yaghoubi, E.; Yaghoubi, E. Optimal generation and distribution planning in smart microgrids under conditions of multi-microgrid disconnection using a hierarchical control strategy. Electr. Eng. 2025, 1–20. [Google Scholar] [CrossRef]
  31. Mirjalili, S.; Lewis, A. The whale optimization algorithm. Adv. Eng. Softw. 2016, 95, 51–67. [Google Scholar] [CrossRef]
  32. AlHajri, M.F.; El-Naggar, K.M.; AlRashidi, M.R.; Al-Othman, A.K. Optimal extraction of solar cell parameters using pattern search. Renew. Energy 2012, 44, 238–245. [Google Scholar] [CrossRef]
  33. Fan, Y.; Wang, P.; Heidari, A.A.; Chen, H.; Mafarja, M. Random reselection particle swarm optimization for optimal design of solar photovoltaic modules. Energy 2022, 239, 121865. [Google Scholar] [CrossRef]
  34. Naeijian, M.; Rahimnejad, A.; Ebrahimi, S.M.; Pourmousa, N.; Gadsden, S.A. Parameter estimation of PV solar cells and modules using Whippy Harris Hawks Optimization Algorithm. Energy Rep. 2021, 7, 4047–4063. [Google Scholar] [CrossRef]
Figure 1. Proposed framework for model parameter extraction using multi-stage optimization and deep modeling.
Processes 13 02023 g001
Figure 2. Equivalent Circuit of SDM.
Processes 13 02023 g002
Figure 3. Equivalent Circuit of DDM.
Processes 13 02023 g003
Figure 4. Equivalent Circuit of TDM.
Processes 13 02023 g004
Figure 5. (a) I-V characteristic curve, (b) P-V characteristic curve.
Processes 13 02023 g005
Figure 6. Comparison of the performance of optimization algorithms in estimating single-diode model parameters.
Processes 13 02023 g006
Figure 7. Changes in RMSE and its confidence interval over five runs of the algorithm.
Processes 13 02023 g007
Figure 8. Comparison of RMSE Values for Various Algorithms in the Two-Diode Model.
Processes 13 02023 g008
Figure 9. Comparison of experimental and simulation results for the output current and output power of a two-diode solar cell.
Processes 13 02023 g009
Figure 10. Objective Function Values RMSE of Various techniques in the TDM.
Processes 13 02023 g010
Figure 11. Evaluation of practical test and simulation results in the TDM, (a) terminal current; (b) output power.
Processes 13 02023 g011
Figure 12. Assessing the robustness of SDM, DDM, and TDM models through RMSE statistical analysis: (a) Boxplots presenting RMSE for each model; (b) Comparison of mean RMSE values along with 95% confidence intervals for each model.
Processes 13 02023 g012
Table 1. Statistical Summary for SDM Results (WOA = 15, 5 runs).
ParameterMean Std. DevMean ± Std
Iph (A) 0.760790.0000007 0.76079 ± 0.0000007
Io (µA) 0.31052 0.00012 0.31052 ± 0.00012
Rsh (Ω) 52.87 0.0252.87 ± 0.02
Rs (Ω) 0.03655 0.000002 0.03655 ± 0.000002
Ns 1.4772 0.00004 1.4772 ± 0.00004
RMSE 7.73 × 10−40.00 (7.73 ± 0) × 10−4
Table 2. Analysis of Outcomes from Six Iterations of the WOA Applied to the Photovoltaic Model.
ParameterWOA = 15WOA = 25WOA = 45WOA = 65WOA = 85WOA = 100
I p h 0.76080.76080.76080.76080.76080.7608
I o 0.31060.31050.31060.31070.31070.3104
R S h 52.880452.890552.886752.916352.908452.8917
R S 0.0365470.0365470.0365490.0365470.036550.036547
N S 1.47721.47731.47731.47731.47731.4773
RMSE7.73 × 10−47.73 × 10−47.73 × 10−47.73 × 10−47.73 × 10−47.73 × 10⁻⁴
Table 3. Assessment of Algorithm Performance in the Single-Diode PV panel Model [34].
ParameterWOA-FMOWOAWHHOEHHOPGJAYAIJAYAGOTLBOGACS
I p h 0.76080.760540.7607760.7607750.76080.76080.76080.76190.7604
I 0 0.31030.412280.3230.3230.3230.32280.32970.80870.34421
R S 0.03650.0354090.0363770.0363750.03640.03640.03630.02990.03632
R S h 52.872962.25353.7186753.7428253.718553.759553.366442.372957.238
N 1.47721.50621.4811081.4812381.48121.48111.48331.57511.4877
RMSE7.7299 × 10−41.38 × 10−39.8602 × 10−49.8602 × 10−49.8602 × 10−49.8603 × 10−49.8856 × 10−41.8704 × 10−21.1085 × 10−3
Table 4. Comparative Analysis of Algorithm Outputs for the Single-Diode PV panel Model.
Results I p h I 0 R S h R S n RMSE
Test 10.7607879630.31068388952.8907850.0365468621.4772693660.000773
Test 20.7607880560.31068404452.83565590.0365468671.4772694250.000773
Test 30.7607885370.31046545452.882040.036549891.4771989220.000773
Test 40.7607886130.31036406452.862750920.0365513051.4771661780.000773
Test 50.7607897250.31040332452.887062230.0365503861.4771791730.000773
Table 5. Evaluation of the Performance of the WOA Algorithm by 10 Iterations for the Two-Diode PV panel Model.
ParameterWOA = 15WOA = 35WOA = 55WOA = 75WOA = 85WOA = 100
I p h 0.76080.76080.76070.76070.76070.7607
Ι 01 0.45660.21460.32510.2550.4151
I 02 0.1399150.499099290.07252650.241650770.151778470.27480144
R S h 59.994449261.118478370.500160966.775348864.056257867.9573234
R S 0.035885380.035644280.035381920.035168330.03538120.03544677
n 1 1.530716821.542062451.553221321.551233311.612045391.57876809
Table 6. Analysis of Algorithm Performance for the Two-Diode PV panel Model.
Results I p h I 01 I 02 R S h R S n 1 n 2 RMSE
Test 10.76080.26880.198257.43630.03571.6151.46070.00069661
Test 20.76080.16390.329356.8870.03591.44591.62680.0014
Test 30.76060.33860.122261.06180.03571.5761.44140.00091667
Test 40.760.18830.253777.7590.03521.52681.50440.00075928
Test 50.76110.25980.146448.05950.03721.6491.42380.0012
Table 7. Evaluation of Outputs from Various Algorithms in the Two-Diode PV panel Model.
ResultsWOA-FMOWHHOPGJAYAIJAYAEHHOWOAGOTLBOGA
R S (Ω)0.03590.036730.03680.03760.036590.036510.03650.0364
R S h (Ω)57.239855.426455.813577.851955.639453.17353.405853.7185
I p h (A)0.76080.7607810.76080.76010.760770.76080.76080.7608
I 01 (µA)0.20380.2285740.210310.005040.5861840.30290.138940.0001
I 02 (µA)0.30590.7271820.885340.750940.2409650.0887340.262090.0001
n 1 1.55641.4518951.4451.21861.96841.47531.72541.3355
n 2 1.5173221.62471.456921.46581.481
RMSE7.28 × 10−49.82487 × 10−49.8263 × 10−49.8293 × 10−49.83606 × 10−49.8638 × 10−49.8742 × 10−43.60 × 10⁻¹
Table 8. Assessment of WOA-FMO Algorithm Performance in Ten Runs for the Three-Diode PV panel Model.
Parameter I p h I 01 I 02 I 03 R S h R S n 1 n 2 n 3 RMSE
WOA = 150.760679940.297323430.253154490.3591651867.58780820.03511821.587032781.612334891.61543626.97 × 10−4
WOA = 250.760670810.11729620.280674810.1853579167.04708840.035236171.600675511.624391541.603925496.97 × 10−4
WOA = 450.760705430.351884470.353273240.1072262666.29484030.035175121.610331081.646702981.606284556.97 × 10−4
WOA = 650.760636190.185447090.123463590.1584106766.83884730.035243581.615033141.658731791.63069976.97 × 10−4
WOA = 850.760630870.10727680.001154860.2445934766.00964120.035354781.601294321.659161611.613695726.97 × 10−4
WOA = 1000.760609020.120051120.161241260.5767993966.34271720.035446141.607028341.666934641.609350726.97 × 10−4
Table 9. Comparative Analysis of the Algorithm’s outcomes for the Three-Diode PV panel Model.
Results I p h I 01 I 02 I 03 R S h R S n 1 n 2 n 3 RMSE
Test 10.76080.19950.25910.92566756.285080.038057751.44221.996720.00069663
Test 20.76080.12370.1870.151808855.07070.035423371.42461.65171.58040.00068758
Test 30.76050.14890.13260.2346807660.76480.03528431.57161.43251.68120.00071209
Test 40.76140.33070.08480.337864348.11240.035417981.7091.38721.71190.00071958
Test 50.76030.18550.3380.334759781.30380.036329621.72641.72081.70270.00070875
Table 10. Evaluating the outcomes of various techniques in the three-diode PV panel system.
Techniques I p h I 01 I 02 I 03 R S h R S n 1 n 2 n 3 RMSE
WOA-FMO0.7607180.7460980.2819890.00970880.03593363.3907781.6410421.6068811.6546046.966263 × 10−4
GOTLBO0.76070.22380.75830.01840.036755.47431.450122.31919.82 × 10−4
WOA0.76070.22590.74910.00230.036755.475711.450922.31569.82 × 10−4
IJAYA0.76080.23490.22970.22970.036755.26411.45411.869529.83 × 10−4
PGJAYA0.76070.21440.80590.11780.036855.751.446422.29829.82 × 10−4
EHHO0.760781970.228542890.579997420.58610.0367620655.77064031.4502935922.396553459.81 × 10−4
GA0.76050.32510.360800.035758.60861.48431.99752.20991.05 × 10−3
Disclaimer/Publisher’s Note: The statements, opinions and data contained in all publications are solely those of the individual author(s) and contributor(s) and not of MDPI and/or the editor(s). MDPI and/or the editor(s) disclaim responsibility for any injury to people or property resulting from any ideas, methods, instructions or products referred to in the content.

