
Enhancing Optical Properties and Cost-Effectiveness of Sol–Gel TiO2 Nanomaterials Through Experimental Design


 ,
,  and
and
Abstract
1. Introduction
2. Materials and Methods
2.1. Materials and Instrumentation
2.2. Synthesis of TiO2 Nanostructures
2.3. Statistical Analyses
2.4. Cost Analyses
3. Results and Discussion
4. Conclusions
Supplementary Materials
Author Contributions
Funding
Data Availability Statement
Acknowledgments
Conflicts of Interest
References
- Khan, H.; Shah, M.U.H. Modification Strategies of TiO2 Based Photocatalysts for Enhanced Visible Light Activity and Energy Storage Ability: A Review. J. Environ. Chem. Eng. 2023, 11, 111532. [Google Scholar] [CrossRef]
- Armaković, S.J.; Savanović, M.M.; Armaković, S. Titanium Dioxide as the Most Used Photocatalyst for Water Purification: An Overview. Catalysts 2022, 13, 26. [Google Scholar] [CrossRef]
- e Silva, F.A.; Rodrigues, T.S. Recent Advances in the Use of Controlled Nanocatalysts in Methane Conversion Reactions. Methane 2024, 3, 359–379. [Google Scholar] [CrossRef]
- Aschauer, U.; Pfenninger, R.; Selbach, S.M.; Grande, T.; Spaldin, N.A. Strain-Controlled Oxygen Vacancy Formation and Ordering in CaMnO3/Mn. Phys. Rev. B 2013, 88, 054111. [Google Scholar] [CrossRef]
- Ren, G.; Ren, Q.; Ren, Z.; Chen, P.; Yue, M.; Sun, N.; Gao, J.; Wu, J.; Fu, Y.; Ma, J. Laser Solid-Phase Synthesis of TiO2 Anatase/Rutile Homojunctions for Efficient Photocatalytic Hydrogen Evolution. Opt. Express 2025, 33, 13682. [Google Scholar] [CrossRef]
- Gagliardi, S.; Rondino, F.; Paoletti, C.; Falconieri, M. On the Morphology of Nanostructured TiO2 for Energy Applications: The Shape of the Ubiquitous Nanomaterial. Nanomaterials 2022, 12, 2608. [Google Scholar] [CrossRef]
- Mutsak Ahmed, R.; Hasan, I. A Review on Properties and Applications of TiO2 and Associated Nanocomposite Materials. Mater. Today Proc. 2023, 81, 1073–1078. [Google Scholar] [CrossRef]
- Gupta, T.; Samriti; Cho, J.; Prakash, J. Hydrothermal Synthesis of TiO2 Nanorods: Formation Chemistry, Growth Mechanism, and Tailoring of Surface Properties for Photocatalytic Activities. Mater. Today Chem. 2021, 20, 100428. [Google Scholar] [CrossRef]
- Puga, M.L.; Venturini, J.; ten Caten, C.S.; Bergmann, C.P. Influencing Parameters in the Electrochemical Anodization of TiO2 Nanotubes: Systematic Review and Meta-Analysis. Ceram. Int. 2022, 48, 19513–19526. [Google Scholar] [CrossRef]
- Zakir, O.; Ait-Karra, A.; Idouhli, R.; Khadiri, M.; Dikici, B.; Aityoub, A.; Abouelfida, A.; Outzourhit, A. A Review on TiO2 Nanotubes: Synthesis Strategies, Modifications, and Applications. J. Solid State Electrochem. 2023, 27, 2289–2307. [Google Scholar] [CrossRef]
- Hsu, C.-Y.; Mahmoud, Z.H.; Abdullaev, S.; Ali, F.K.; Ali Naeem, Y.; Mzahim Mizher, R.; Morad Karim, M.; Abdulwahid, A.S.; Ahmadi, Z.; Habibzadeh, S.; et al. Nano Titanium Oxide (Nano-TiO2): A Review of Synthesis Methods, Properties, and Applications. Case Stud. Chem. Environ. Eng. 2024, 9, 100626. [Google Scholar] [CrossRef]
- Gatou, M.-A.; Syrrakou, A.; Lagopati, N.; Pavlatou, E.A. Photocatalytic TiO2-Based Nanostructures as a Promising Material for Diverse Environmental Applications: A Review. Reactions 2024, 5, 135–194. [Google Scholar] [CrossRef]
- e Silva, F.; Salim, V.; Rodrigues, T. Controlled Nickel Nanoparticles: A Review on How Parameters of Synthesis Can Modulate Their Features and Properties. AppliedChem 2024, 4, 86–106. [Google Scholar] [CrossRef]
- da Silva, M.V.; Fajardo, H.V.; Rodrigues, T.S.; e Silva, F.A.; Bergamaschi, V.S.; Dias, A.; Siqueira, K.P.F. Synthesis of NiMoO4 Ceramics by Proteic Sol-Gel Method and Investigation of Their Catalytic Properties in Hydrogen Production. Mater. Chem. Phys. 2021, 262, 124301. [Google Scholar] [CrossRef]
- Zadehnazari, A. Chemical Synthesis Strategies for Metal Oxide Nanoparticles: A Comprehensive Review. Inorg. Nano-Met. Chem. 2025, 55, 734–773. [Google Scholar] [CrossRef]
- Qamar, O.A.; Jamil, F.; Hussain, M.; Bae, S.; Inayat, A.; Shah, N.S.; Waris, A.; Akhter, P.; Kwon, E.E.; Park, Y.-K. Advances in Synthesis of TiO2 Nanoparticles and Their Application to Biodiesel Production: A Review. Chem. Eng. J. 2023, 460, 141734. [Google Scholar] [CrossRef]
- Rodrigues, T.S.; e Silva, F.A.; Candido, E.G.; da Silva, A.G.M.; Geonmonond, R.D.S.; Camargo, P.H.C.; Linardi, M.; Fonseca, F.C. Ethanol Steam Reforming: Understanding Changes in the Activity and Stability of Rh/MxOy Catalysts as Function of the Support. J. Mater. Sci. 2019, 54, 11400–11416. [Google Scholar] [CrossRef]
- Makuła, P.; Pacia, M.; Macyk, W. How To Correctly Determine the Band Gap Energy of Modified Semiconductor Photocatalysts Based on UV–Vis Spectra. J. Phys. Chem. Lett. 2018, 9, 6814–6817. [Google Scholar] [CrossRef]
- Farooq, N.; Kallem, P.; ur Rehman, Z.; Imran Khan, M.; Kumar Gupta, R.; Tahseen, T.; Mushtaq, Z.; Ejaz, N.; Shanableh, A. Recent Trends of Titania (TiO2) Based Materials: A Review on Synthetic Approaches and Potential Applications. J. King Saud. Univ. Sci. 2024, 36, 103210. [Google Scholar] [CrossRef]
- Sopan Mahato, S.; Mahata, D.; Panda, S.; Mahata, S. Perspective Chapter: Sol-Gel Science and Technology in Context of Nano-Materials—Recent Advances; IntechOpen: London, UK, 2023. [Google Scholar]
- Liu, H.; Ma, L.; Zhao, J.; Liu, J.; Yan, J.; Ruan, J.; Hong, F. Biochemical Toxicity of Nano-Anatase TiO2 Particles in Mice. Biol. Trace Elem. Res. 2009, 129, 170–180. [Google Scholar] [CrossRef]
- Yang, P.; Lu, C.; Hua, N.; Du, Y. Titanium Dioxide Nanoparticles Co-Doped with Fe3+ and Eu3+ Ions for Photocatalysis. Mater. Lett. 2002, 57, 794–801. [Google Scholar] [CrossRef]
- Ranjitha, A.; Muthukumarasamy, N.; Thambidurai, M.; Velauthapillai, D. Enhanced Photovoltaic Performance of Quantum Dot Sensitized Solar Cells with Ag-Doped TiO2 Nanocrystalline Thin Films. J. Mater. Sci. Mater. Electron. 2014, 25, 2724–2729. [Google Scholar] [CrossRef]
- Kőrösi, L.; Dékány, I. Preparation and Investigation of Structural and Photocatalytic Properties of Phosphate Modified Titanium Dioxide. Colloids Surf. A Physicochem. Eng. Asp. 2006, 280, 146–154. [Google Scholar] [CrossRef]
- Adachi, M.; Murata, Y.; Takao, J.; Jiu, J.; Sakamoto, M.; Wang, F. Highly Efficient Dye-Sensitized Solar Cells with a Titania Thin-Film Electrode Composed of a Network Structure of Single-Crystal-like TiO2 Nanowires Made by the “Oriented Attachment” Mechanism. J. Am. Chem. Soc. 2004, 126, 14943–14949. [Google Scholar] [CrossRef] [PubMed]
- Cot, F.; Larbot, A.; Nabias, G.; Cot, L. Preparation and Characterization of Colloidal Solution Derived Crystallized Titania Powder. J. Eur. Ceram. Soc. 1998, 18, 2175–2181. [Google Scholar] [CrossRef]
- Rani, M.; Abbas, S.J.; Tripathi, S.K. Influence of Annealing Temperature and Organic Dyes as Sensitizers on Sol–Gel Derived TiO2 Films. Mater. Sci. Eng. B 2014, 187, 75–82. [Google Scholar] [CrossRef]
- Jia, H.; Zheng, Z.; Zhao, H.; Zhang, L.; Zou, Z. Nonaqueous Sol–Gel Synthesis and Growth Mechanism of Single Crystalline TiO2 Nanorods with High Photocatalytic Activity. Mater. Res. Bull. 2009, 44, 1312–1316. [Google Scholar] [CrossRef]
- Joo, J.; Kwon, S.G.; Yu, T.; Cho, M.; Lee, J.; Yoon, J.; Hyeon, T. Large-Scale Synthesis of TiO2 Nanorods via Nonhydrolytic Sol−Gel Ester Elimination Reaction and Their Application to Photocatalytic Inactivation of E. coli. J. Phys. Chem. B 2005, 109, 15297–15302. [Google Scholar] [CrossRef]
- Jun, Y.; Casula, M.F.; Sim, J.-H.; Kim, S.Y.; Cheon, J.; Alivisatos, A.P. Surfactant-Assisted Elimination of a High Energy Facet as a Means of Controlling the Shapes of TiO2 Nanocrystals. J. Am. Chem. Soc. 2003, 125, 15981–15985. [Google Scholar] [CrossRef]
- Su, C.; Hong, B.-Y.; Tseng, C.-M. Sol–Gel Preparation and Photocatalysis of Titanium Dioxide. Catal. Today 2004, 96, 119–126. [Google Scholar] [CrossRef]
- Joo, J.B.; Zhang, Q.; Dahl, M.; Lee, I.; Goebl, J.; Zaera, F.; Yin, Y. Control of the Nanoscale Crystallinity in Mesoporous TiO2 Shells for Enhanced Photocatalytic Activity. Energy Environ. Sci. 2012, 5, 6321–6327. [Google Scholar] [CrossRef]
- Eid, M.R.; Al-Hossainy, A.F. Synthesis, DFT Calculations, and Heat Transfer Performance Large-Surface TiO2: Ethylene Glycol Nanofluid and Coolant Applications. Eur. Phys. J. Plus 2020, 135, 596. [Google Scholar] [CrossRef]
- Barringer, E.A.; Bowen, H.K. High-Purity, Monodisperse TiO2 Powders by Hydrolysis of Titanium Tetraethoxide. 1. Synthesis and Physical Properties. Langmuir 1985, 1, 414–420. [Google Scholar] [CrossRef]
- Look, J.L.; Zukoski, C.F. Alkoxide-Derived Titania Particles: Use of Electrolytes to Control Size and Agglomeration Levels. J. Am. Ceram. Soc. 1992, 75, 1587–1595. [Google Scholar] [CrossRef]
- Chen, S.; Fan, X.; Zhang, C.; Wei, A.; Chen, W. Synthesis of Hierarchical and Flower-like TiO2 Nanowire Microspheres as Bio-compatible Cell Carriers. Mater. Sci. Eng. C 2021, 126, 112118. [Google Scholar] [CrossRef]
- Gundiah, G.; Mukhopadhyay, S.; Tumkurkar, U.G.; Govindaraj, A.; Maitra, U.; Rao, C.N.R. Hydrogel Route to Nanotubes of Metal Oxides and Sulfates. J. Mater. Chem. 2003, 13, 2118. [Google Scholar] [CrossRef]
- Rodríguez-Reyes, M.; Dorantes-Rosales, H.J. A Simple Route to Obtain TiO2 Nanowires by the Sol–Gel Method. J. Solgel Sci. Technol. 2011, 59, 658–661. [Google Scholar] [CrossRef]
- Farheen; Fouad, H.; Ansari, S.G.; Khan, A.A.; Ansari, Z.A. Europium Doped TiO2: An Efficient Photoanode Material for Dye Sen-sitized Solar Cell. J. Mater. Sci. Mater. Electron. 2017, 28, 6873–6879. [Google Scholar] [CrossRef]
- Farhadian Azizi, K.; Bagheri-Mohagheghi, M.-M. Transition from Anatase to Rutile Phase in Titanium Dioxide (TiO2) Nanoparticles Synthesized by Complexing Sol–Gel Process: Effect of Kind of Complexing Agent and Calcinating Temperature. J. Solgel Sci. Technol. 2013, 65, 329–335. [Google Scholar] [CrossRef]
- Pan, J.H.; Wang, X.Z.; Huang, Q.; Shen, C.; Koh, Z.Y.; Wang, Q.; Engel, A.; Bahnemann, D.W. Large-Scale Synthesis of Urchin-like Mesoporous TiO2 Hollow Spheres by Targeted Etching and Their Photoelectrochemical Properties. Adv. Funct. Mater. 2014, 24, 95–104. [Google Scholar] [CrossRef]
- Liu, Z.; Guo, B.; Hong, L.; Jiang, H. Preparation and Characterization of Cerium Oxide Doped TiO2 Nanoparticles. J. Phys. Chem. Solids 2005, 66, 161–167. [Google Scholar] [CrossRef]
- Wang, C.-C.; Ying, J.Y. Sol−Gel Synthesis and Hydrothermal Processing of Anatase and Rutile Titania Nanocrystals. Chem. Mater. 1999, 11, 3113–3120. [Google Scholar] [CrossRef]
- Pavasupree, S.; Suzuki, Y.; Pivsa-Art, S.; Yoshikawa, S. Synthesis and Characterization of Nanoporous, Nanorods, Nanowires Metal Oxides. Sci. Technol. Adv. Mater. 2005, 6, 224–229. [Google Scholar] [CrossRef]
- Xu, Y.; Zeng, Z. The Preparation, Characterization, and Photocatalytic Activities of Ce-TiO2/SiO2. J. Mol. Catal. A Chem. 2008, 279, 77–81. [Google Scholar] [CrossRef]
- Chauhan, R.; Kumar, A.; Chaudhary, R.P. Structural and Optical Characterization of Ag-Doped TiO2 Nanoparticles Prepared by a Sol–Gel Method. Res. Chem. Intermed. 2012, 38, 1443–1453. [Google Scholar] [CrossRef]
- Chauhan, R.; Kumar, A.; Chaudhary, R.P. Structural and Photocatalytic Studies of Mn Doped TiO2 Nanoparticles. Spectrochim. Acta A Mol. Biomol. Spectrosc. 2012, 98, 256–264. [Google Scholar] [CrossRef] [PubMed]
- Tseng, Y.-H.; Kuo, C.-S.; Huang, C.-H.; Li, Y.-Y.; Chou, P.-W.; Cheng, C.-L.; Wong, M.-S. Visible-Light-Responsive Nano-TiO2 with Mixed Crystal Lattice and Its Photocatalytic Activity. Nanotechnology 2006, 17, 2490–2497. [Google Scholar] [CrossRef]
- Dubey, R.S. Temperature-Dependent Phase Transformation of TiO2 Nanoparticles Synthesized by Sol-Gel Method. Mater. Lett. 2018, 215, 312–317. [Google Scholar] [CrossRef]
- Yang, J.; Mei, S.; Ferreira, J.M.F. In Situ Preparation of Weakly Flocculated Aqueous Anatase Suspensions by a Hydrothermal Technique. J. Colloid. Interface Sci. 2003, 260, 82–88. [Google Scholar] [CrossRef]
- Zhao, D.; Yu, Y.; Long, H.; Cao, Y. Improved Photocatalytic Activity of Self-Assemble TiO2 Nanobelts with Au Nanoparticles. Appl. Surf. Sci. 2014, 315, 247–251. [Google Scholar] [CrossRef]
- Yu, J.; Zhou, M.; Cheng, B.; Zhao, X. Preparation, Characterization and Photocatalytic Activity of in Situ N,S-Codoped TiO2 Powders. J. Mol. Catal. A Chem. 2006, 246, 176–184. [Google Scholar] [CrossRef]
- Li, B.; Wang, X.; Yan, M.; Li, L. Preparation and Characterization of Nano-TiO2 Powder. Mater. Chem. Phys. 2003, 78, 184–188. [Google Scholar] [CrossRef]
- Chang, C.; Rad, S.; Gan, L.; Li, Z.; Dai, J.; Shahab, A. Review of the Sol–Gel Method in Preparing Nano TiO2 for Advanced Oxi-dation Process. Nanotechnol. Rev. 2023, 12, 20230150. [Google Scholar] [CrossRef]
- De, A.; Kim, M.S.; Adhikari, A.; Patel, R.; Kundu, S. Sol–Gel-Derived Nanostructured Electrocatalysts for Oxygen Evolution Reaction: A Review. J. Mater. Chem. A Mater. 2024, 12, 19720–19756. [Google Scholar] [CrossRef]
- 5Rajaram, P.; Jeice, A.R.; Jayakumar, K. Review of Green Synthesized TiO2 Nanoparticles for Diverse Applications. Surf. Interfaces 2023, 39, 102912. [Google Scholar] [CrossRef]
- e Silva, F.A.; Batista, A.M.; Pacheco, H.P.; Salim, V.M.M.; Rodrigues, T.S. How the Incorporation Synthesis Method of the Active Phase Affects the Catalytic Behavior: Ni/CeO2 Nanowires towards Ethanol Steam Reforming. Emergent Mater. 2024, 7, 2469–2493. [Google Scholar] [CrossRef]
- Rivera-Quintero, P.; Patience, G.S.; Patience, N.A.; Boffito, D.C.; Banquy, X.; Schieppati, D. Experimental Methods in Chemical Engineering: Karl Fischer Titration. Can. J. Chem. Eng. 2024, 102, 2980–2997. [Google Scholar] [CrossRef]
- Popescu, G.; Radulov, I.; Iordănescu, O.A.; Orboi, M.D.; Rădulescu, L.; Drugă, M.; Bujancă, G.S.; David, I.; Hădărugă, D.I.; (Banciu), C.A.L.; et al. Karl Fischer Water Titration—Principal Component Analysis Approach on Bread Products. Appl. Sci. 2020, 10, 6518. [Google Scholar] [CrossRef]
- Mohadesi, M.; Sanavi Fard, M.; Shokri, A. The Application of Modified Nano-TiO2 Photocatalyst for Wastewater Treatment: A Review. Int J Environ Anal. Chem. 2024, 104, 2571–2592. [Google Scholar] [CrossRef]
- Barcelos, D.A.; Gonçalves, M.C. Daylight Photoactive TiO2 Sol-Gel Nanoparticles: Sustainable Environmental Contribution. Materials 2023, 16, 2731. [Google Scholar] [CrossRef]
- Karmaoui, M.; Jorge, A.B.; McMillan, P.F.; Aliev, A.E.; Pullar, R.C.; Labrincha, J.A.; Tobaldi, D.M. One-Step Synthesis, Structure, and Band Gap Properties of SnO2 Nanoparticles Made by a Low Temperature Nonaqueous Sol–Gel Technique. ACS Omega 2018, 3, 13227–13238. [Google Scholar] [CrossRef] [PubMed]
- Hong, S.M.; Lee, S.; Jung, H.J.; Yu, Y.; Shin, J.H.; Kwon, K.-Y.; Choi, M.Y. Simple Preparation of Anatase TiO2 Nanoparticles via Pulsed Laser Ablation in Liquid. Bull. Korean Chem. Soc. 2013, 34, 279–282. [Google Scholar] [CrossRef]
- Jafarkhani, P.; Dadras, S.; Torkamany, M.J.; Sabbaghzadeh, J. Synthesis of Nanocrystalline Titania in Pure Water by Pulsed Nd:YAG Laser. Appl. Surf. Sci. 2010, 256, 3817–3821. [Google Scholar] [CrossRef]
- Barreca, F.; Acacia, N.; Barletta, E.; Spadaro, D.; Currò, G.; Neri, F. Small Size TiO2 Nanoparticles Prepared by Laser Ablation in Water. Appl. Surf. Sci. 2010, 256, 6408–6412. [Google Scholar] [CrossRef]
- Spiridonova, J.; Katerski, A.; Danilson, M.; Krichevskaya, M.; Krunks, M.; Oja Acik, I. Effect of the Titanium Isopropox-ide:Acetylacetone Molar Ratio on the Photocatalytic Activity of TiO2 Thin Films. Molecules 2019, 24, 4326. [Google Scholar] [CrossRef]
- Ong, W.-J.; Tan, L.-L.; Chai, S.-P.; Yong, S.-T.; Mohamed, A.R. Highly Reactive {001} Facets of TiO2-Based Composites: Synthesis, Formation Mechanism and Characterization. Nanoscale 2014, 6, 1946. [Google Scholar] [CrossRef]
- Kignelman, G.; Thielemans, W. Synergistic Effects of Acetic Acid and Nitric Acid in Water-Based Sol–Gel Synthesis of Crystalline TiO2 Nanoparticles at 25 °C. J. Mater. Sci. 2021, 56, 16877–16886. [Google Scholar] [CrossRef]
- Parra, R.; Góes, M.S.; Castro, M.S.; Longo, E.; Bueno, P.R.; Varela, J.A. Reaction Pathway to the Synthesis of Anatase via the Chemical Modification of Titanium Isopropoxide with Acetic Acid. Chem. Mater. 2008, 20, 143–150. [Google Scholar] [CrossRef]
- Djaoued, Y.; Badilescu, S.; Ashrit, P.V.; Bersani, D.; Lottici, P.P.; Robichaud, J. Study of Anatase to Rutile Phase Transition in Nanocrystalline Titania Films. J. Solgel Sci. Technol. 2002, 24, 255–264. [Google Scholar] [CrossRef]
- Behnajady, M.A.; Eskandarloo, H.; Modirshahla, N.; Shokri, M. Sol-Gel Low-Temperature Synthesis of Stable Anatase-Type TiO2 Nanoparticles Under Different Conditions and Its Photocatalytic Activity. Photochem. Photobiol. 2011, 87, 1002–1008. [Google Scholar] [CrossRef]
- Kignelman, G.; Thielemans, W. Meta-Analysis of TiO2 Nanoparticle Synthesis Strategies to Assess the Impact of Key Reaction Pa-rameters on Their Crystallinity. J. Mater. Sci. 2021, 56, 5975–5994. [Google Scholar] [CrossRef]
- Ismagilov, Z.R.; Tsikoza, L.T.; Shikina, N.V.; Zarytova, V.F.; Zinoviev, V.V.; Zagrebelnyi, S.N. Synthesis and Stabilization of Nano-Sized Titanium Dioxide. Russ. Chem. Rev. 2009, 78, 873–885. [Google Scholar] [CrossRef]
- Ye, J.; Liu, W.; Cai, J.; Chen, S.; Zhao, X.; Zhou, H.; Qi, L. Nanoporous Anatase TiO2 Mesocrystals: Additive-Free Synthesis, Re-markable Crystalline-Phase Stability, and Improved Lithium Insertion Behavior. J. Am. Chem. Soc. 2011, 133, 933–940. [Google Scholar] [CrossRef]
- Andrade-Guel, M.; Díaz-Jiménez, L.; Cortés-Hernández, D.; Cabello-Alvarado, C.; Ávila-Orta, C.; Bartolo-Pérez, P.; Gamero-Melo, P. Microwave Assisted Sol–Gel Synthesis of Titanium Dioxide Using Hydrochloric and Acetic Acid as Catalysts. Boletín De La Soc. Española De Cerámica Y Vidr. 2019, 58, 171–177. [Google Scholar] [CrossRef]
- Leyva-Porras, C.; Toxqui-Teran, A.; Vega-Becerra, O.; Miki-Yoshida, M.; Rojas-Villalobos, M.; García-Guaderrama, M.; Agui-lar-Martínez, J.A. Low-Temperature Synthesis and Characterization of Anatase TiO2 Nanoparticles by an Acid Assisted Sol–Gel Method. J. Alloys Compd. 2015, 647, 627–636. [Google Scholar] [CrossRef]
- Siwińska-Stefańska, K.; Zdarta, J.; Paukszta, D.; Jesionowski, T. The Influence of Addition of a Catalyst and Chelating Agent on the Properties of Titanium Dioxide Synthesized via the Sol–Gel Method. J. Solgel Sci. Technol. 2015, 75, 264–278. [Google Scholar] [CrossRef]


| Experiment | TTIP (mL) (DOE Parameter) | Isopropanol (mL) (DOE Parameter) | Acetic Acid (mL) (DOE Parameter) | Acetone (mL) |
|---|---|---|---|---|
| S1—30 mL | 10.0 (0) | 10.3 (0) | 7.6 (0) | - |
| S2—30 mL | 10.0 (0) | 10.3 (0) | 7.6 (0) | - |
| S3—30 mL | 10.0 (0) | 10.3 (0) | 7.6 (0) | - |
| S4—30 mL | 5.0 (−1) | 5.1 (−1) | 11.4 (+1) | - |
| S5—30 mL | 5.0 (−1) | 15.4 (+1) | 3.8 (−1) | - |
| S6—30 mL | 15.0 (+1) | 5.1 (−1) | 3.8 (−1) | - |
| S7—30 mL | 15.0 (+1) | 15.4 (+1) | 11.4 (+1) | - |
| S1—15 mL | 5.0 (0) | 5.2 (0) | 3.8 (0) | - |
| S2—15 mL | 5.0 (0) | 5.2 (0) | 3.8 (0) | - |
| S3—15 mL | 5.0 (0) | 5.2 (0) | 3.8 (0) | - |
| S4—15 mL | 2.5 (−1) | 2.6 (−1) | 5.7 (+1) | - |
| S5—15 mL | 2.5 (−1) | 7.7 (+1) | 1.9 (−1) | - |
| S6—15 mL | 7.5 (+1) | 2.6 (−1) | 1.9 (−1) | - |
| S7—15 mL | 7.5 (+1) | 7.7 (+1) | 5.7 (+1) | - |
| S8—Acetone | 10.0 (0) | 10.3 (0) | 7.6 (0) | 30.0 |
| S9—Acetic acid | 10.0 (0) | 10.3 (0) | 7.6 (0) + 30.0 | - |
| S10—Isopropanol | 10.0 (0) | 10.3 (0) + 30.0 | 7.6 (0) | - |
| Sample | Water Content (wt%) | |
|---|---|---|
| Analyzed (wt%) | Label (wt%) | |
| Isopropanol | 0.06 | 0.2 |
| Acetic acid | 0.23 | 0.3 |
| Sample | Morphology | Size (nm) | Crystalline Size (nm) | Cross-Section Area of UV–Vis Spectra (a.u. nm) | Band Gap (eV) | Cost Per Gram (USD g−1) |
|---|---|---|---|---|---|---|
| S1—30 mL | Undefined | 1047 | 9.97 | 2.0 | 2.4 | 0.68 |
| S2—30 mL | Undefined | 2622 | 7.24 | 5.2 | 3.7 | 0.49 |
| S3—30 mL | Undefined | 157 | 6.48 | 26.3 | 1.8 | 0.79 |
| S4—30 mL | Undefined | 3817 | 6.60 | 5.4 | 3.2 | 0.68 |
| S5—30 mL | Undefined | 118 | 11.46 | 2.6 | 3.2 | 0.68 |
| S6—30 mL | Undefined | 3035 | 6.90 | 1.9 | 3.6 | 1.11 |
| S7—30 mL | Undefined | 1275 | 6.63 | 4.3 | 2.4 | 0.68 |
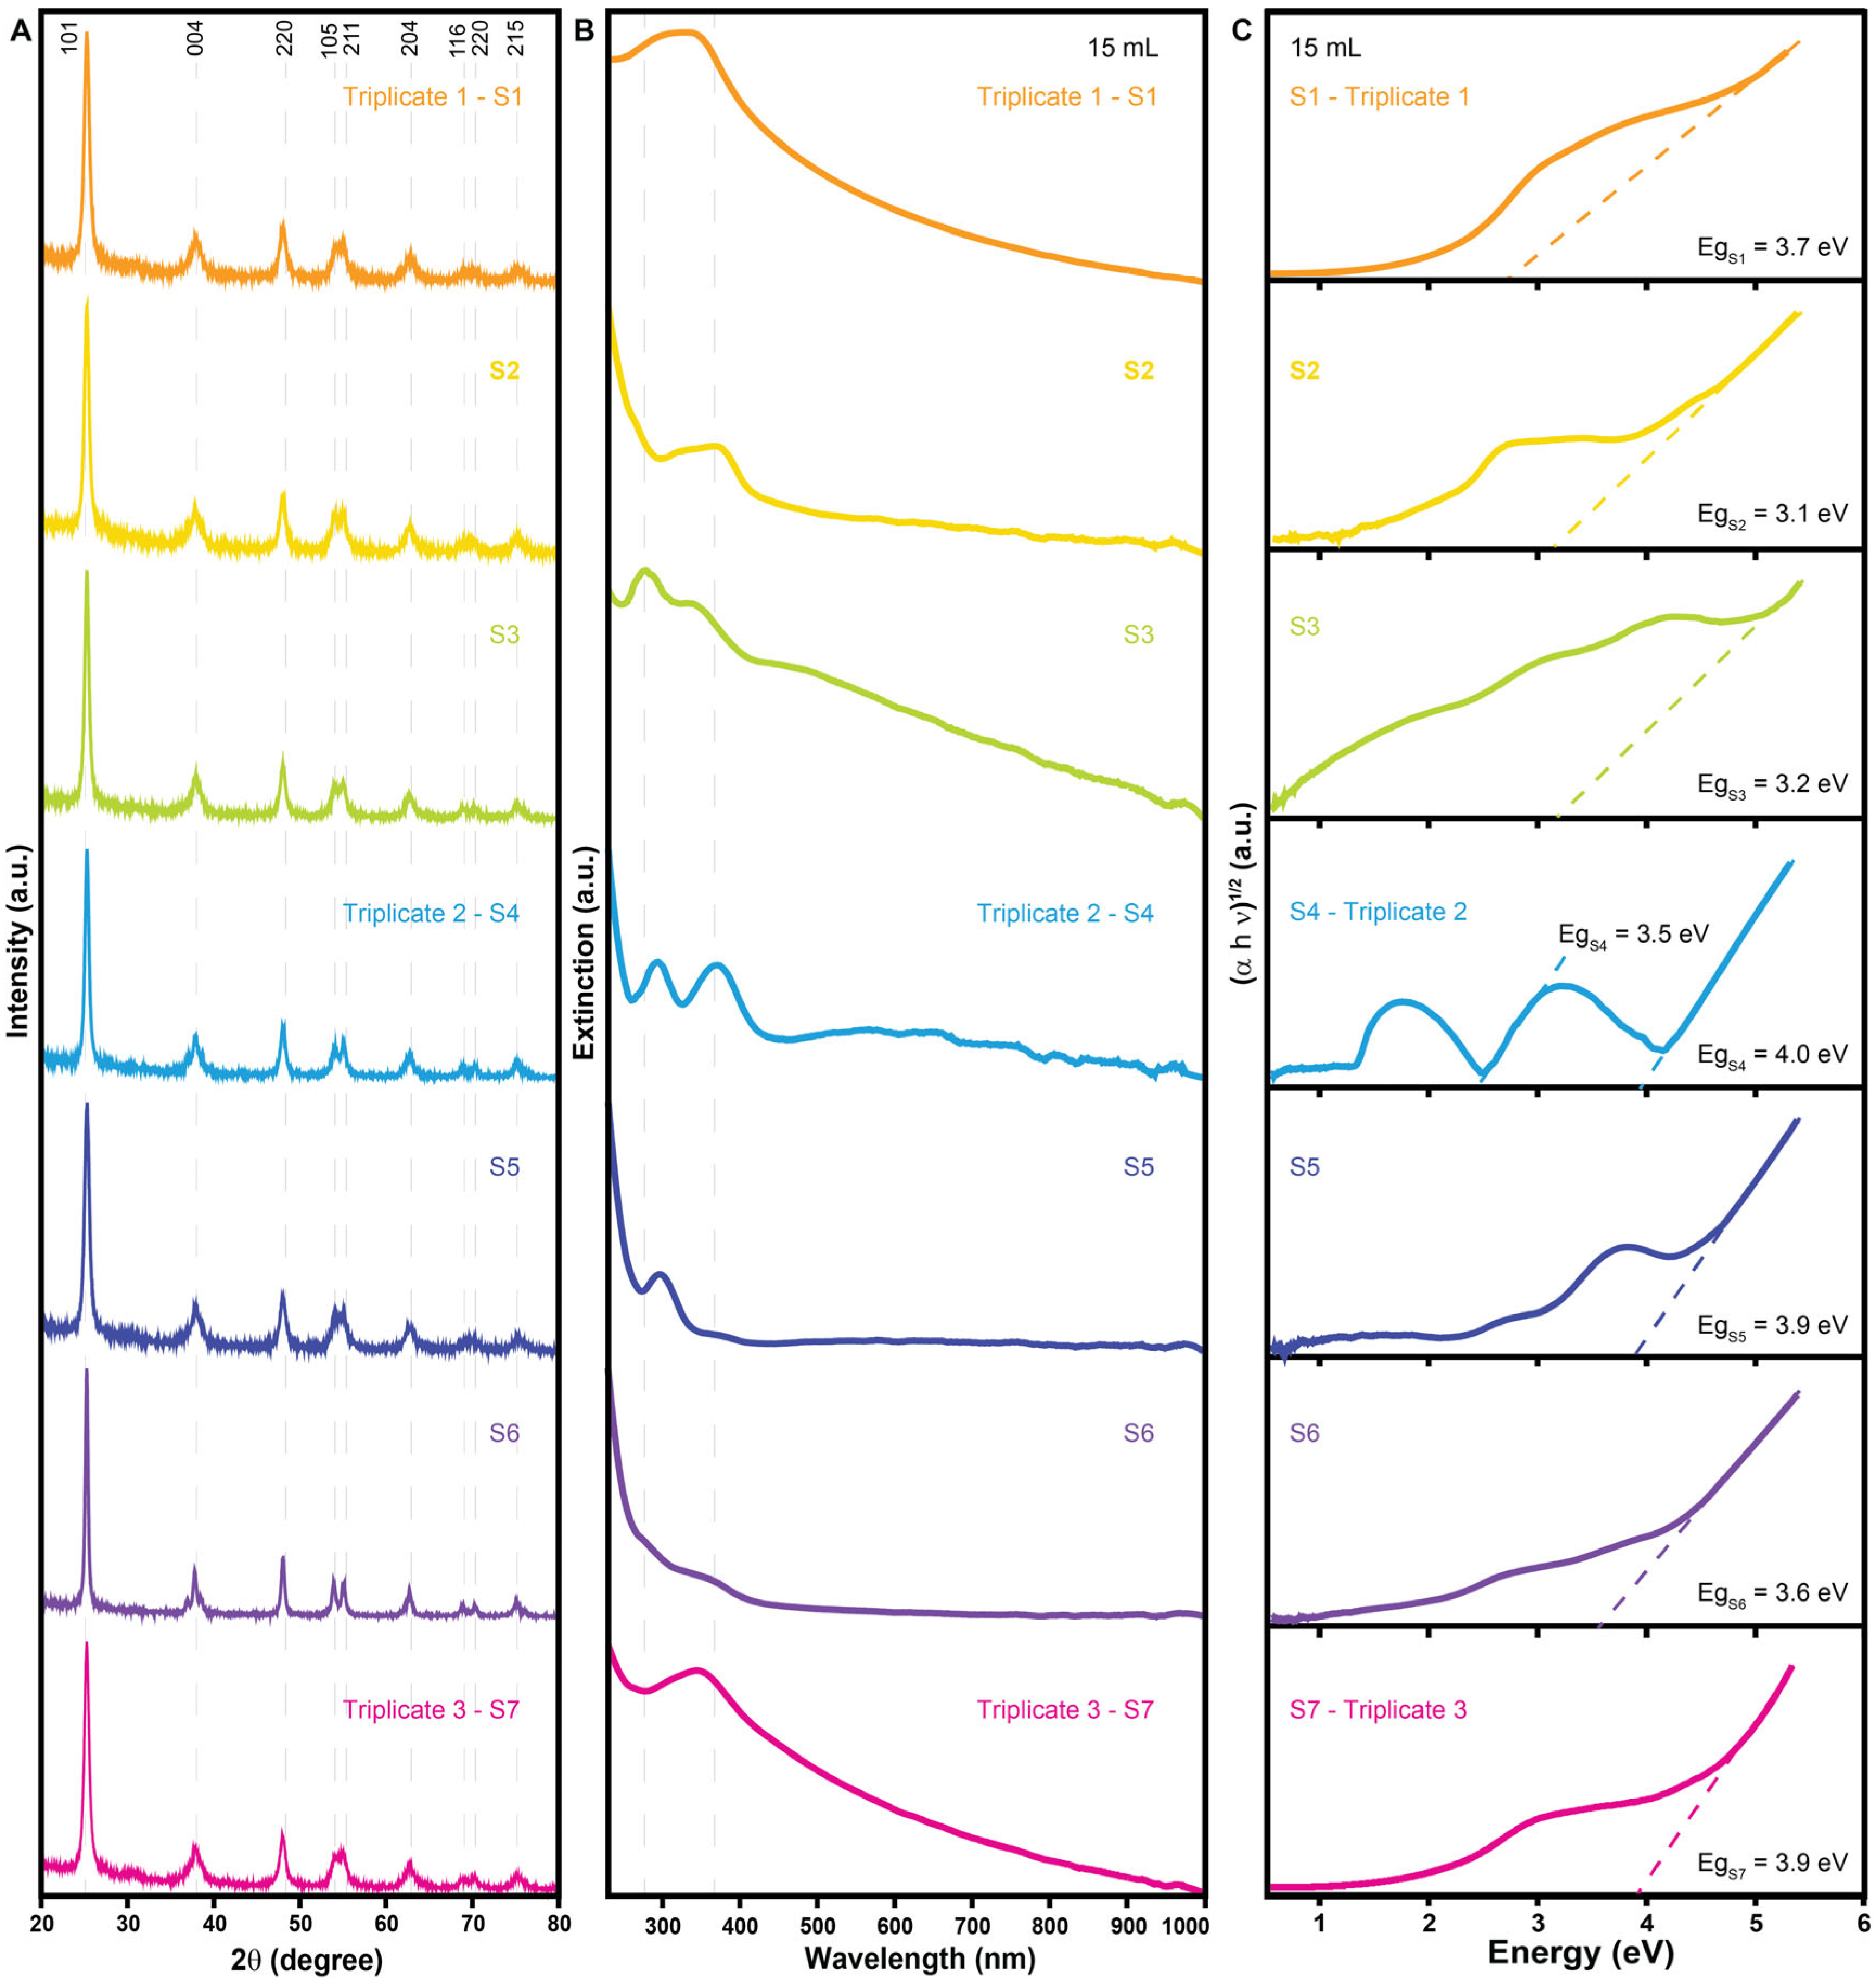
| S1—15 mL | Rods and undefined | 134 | 11.44 | 86.1 | 3.7 | 0.68 |
| S2—15 mL | Undefined | 101 | 12.49 | 2.4 | 3.1 | 0.49 |
| S3—15 mL | Plates and undefined | 140 | 15.43 | 12.6 | 3.2 | 0.79 |
| S4—15 mL | Undefined | 183 | 15.01 | 1.8 | 4.0 | 0.68 |
| S5—15 mL | Undefined | 695 | 12.48 | 3.4 | 3.9 | 0.68 |
| S6—15 mL | Plates and undefined | 552 | 21.87 | 10.4 | 3.6 | 1.11 |
| S7—15 mL | Rods | 52 | 12.56 | 23.4 | 3.9 | 0.68 |
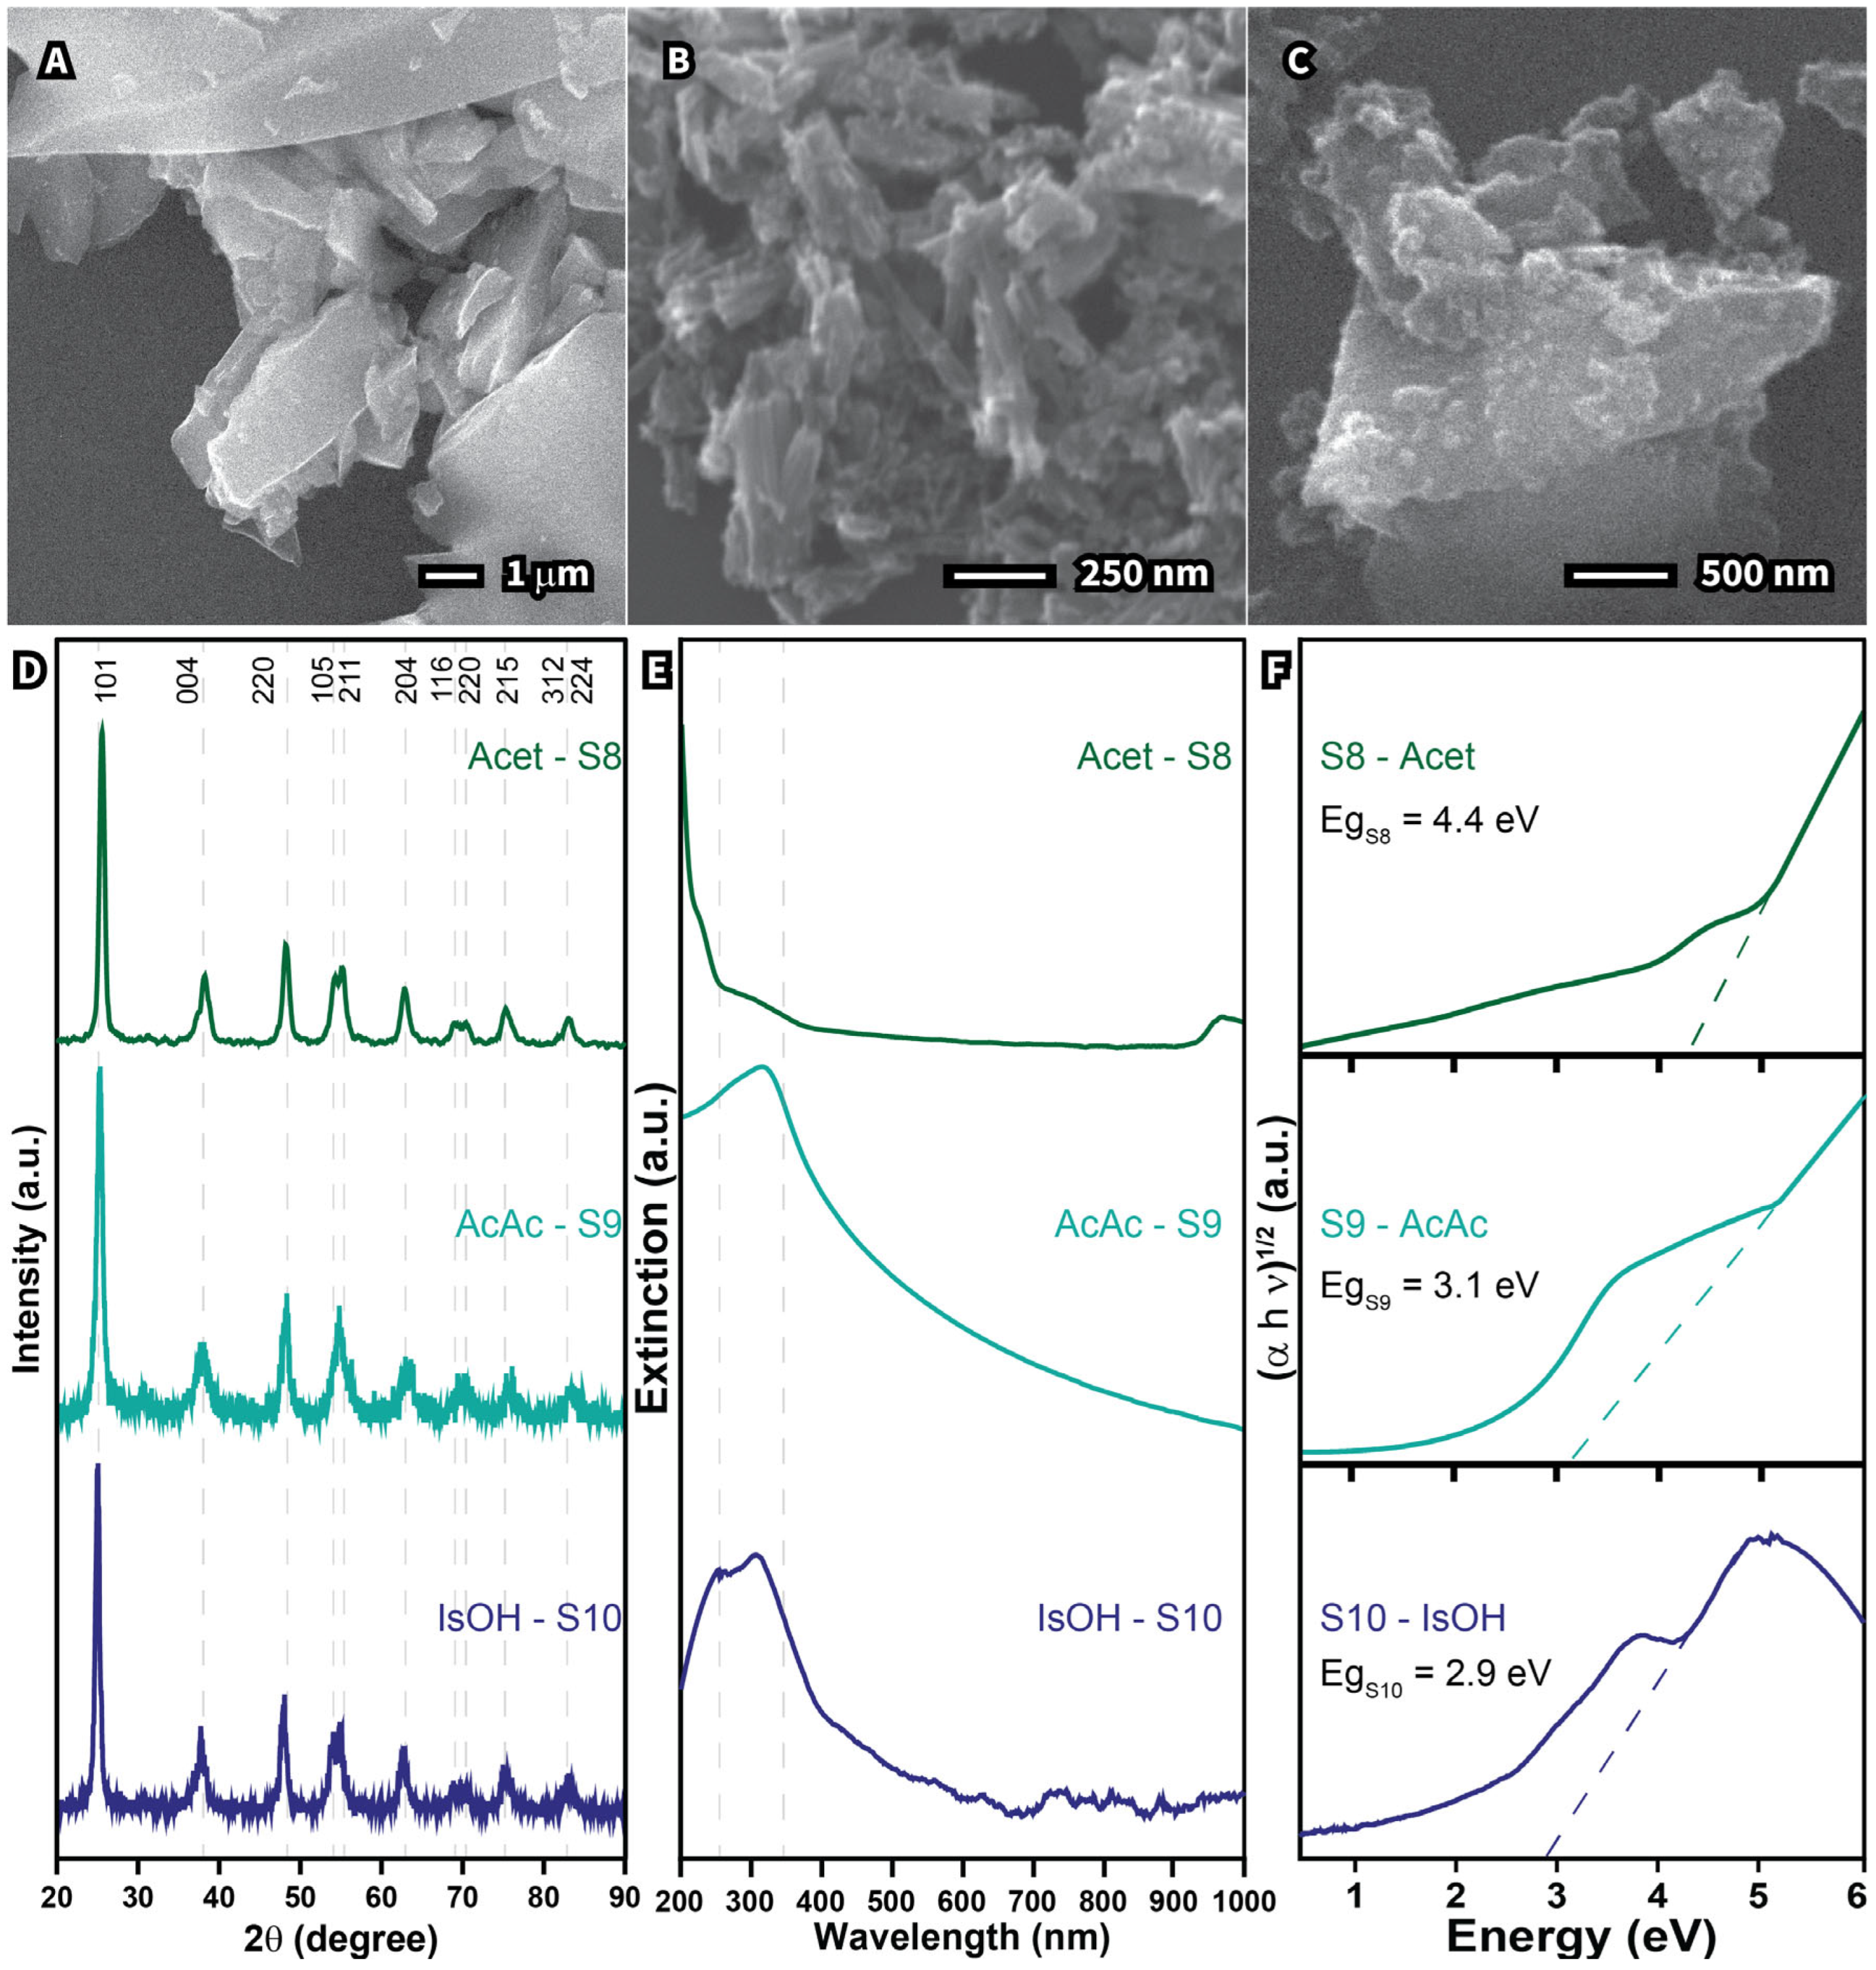
| S8—Acetone | Undefined | 5627 | 6.85 | 1.8 | 4.4 | 0.95 |
| S9—Acetic acid | Rods | 109 | 10.68 | 82.2 | 3.1 | 0.89 |
| S10—Isopropanol | Undefined | 573 | 14.35 | 9.9 | 2.9 | 1.31 |
| Variable | Synthesis at 30 mL | Synthesis at 15 mL |
|---|---|---|
| TTIP | −0.06 | 0.08 |
| IsOH | 0.05 | 0.82 |
| AcAc | −0.76 | 0.15 |
| Variable | Factor 1 to 30 mL | Factor 1 to 15 mL |
|---|---|---|
| TTIP | −0.078377 | −0.096930 |
| IsOH | 0.064852 | −0.937607 |
| AcAc | −0.933243 | −0.169627 |
| Particle size | 0.938771 | −0.957745 |
| Expl. Var | 1.762581 | 1.834550 |
| Prp. Total | 0.440645 | 0.458638 |
| Principal Components | % Total Variance | Cumulative Eigenvalue |
|---|---|---|
| 30 mL | 44.06453 | 1.762581 |
| 15 mL | 45.86376 | 1.834550 |
Disclaimer/Publisher’s Note: The statements, opinions and data contained in all publications are solely those of the individual author(s) and contributor(s) and not of MDPI and/or the editor(s). MDPI and/or the editor(s) disclaim responsibility for any injury to people or property resulting from any ideas, methods, instructions or products referred to in the content. |
© 2025 by the authors. Licensee MDPI, Basel, Switzerland. This article is an open access article distributed under the terms and conditions of the Creative Commons Attribution (CC BY) license (https://creativecommons.org/licenses/by/4.0/).
Share and Cite
Anchieta e Silva, F.; de Almeida, T.A.; Secchi, A.R.; Pinto, J.C.; Rodrigues, T.S. Enhancing Optical Properties and Cost-Effectiveness of Sol–Gel TiO2 Nanomaterials Through Experimental Design. Processes 2025, 13, 1988. https://doi.org/10.3390/pr13071988
Anchieta e Silva F, de Almeida TA, Secchi AR, Pinto JC, Rodrigues TS. Enhancing Optical Properties and Cost-Effectiveness of Sol–Gel TiO2 Nanomaterials Through Experimental Design. Processes. 2025; 13(7):1988. https://doi.org/10.3390/pr13071988
Chicago/Turabian StyleAnchieta e Silva, Felipe, Timóteo Adorno de Almeida, Argimiro R. Secchi, José Carlos Pinto, and Thenner Silva Rodrigues. 2025. "Enhancing Optical Properties and Cost-Effectiveness of Sol–Gel TiO2 Nanomaterials Through Experimental Design" Processes 13, no. 7: 1988. https://doi.org/10.3390/pr13071988
APA StyleAnchieta e Silva, F., de Almeida, T. A., Secchi, A. R., Pinto, J. C., & Rodrigues, T. S. (2025). Enhancing Optical Properties and Cost-Effectiveness of Sol–Gel TiO2 Nanomaterials Through Experimental Design. Processes, 13(7), 1988. https://doi.org/10.3390/pr13071988