Article

Assessment of the Productivity of Hydrogen and Nano-Carbon Through Liquid-Plasma Cracking of Waste Organic Solvent Using PrxNiyFeO3 Perovskite Catalysts

Department of Environmental Engineering, Sunchon National University, 255 Jungangro, Sunchon 57922, Jeonnam, Republic of Korea
*
Author to whom correspondence should be addressed.
Processes 2024, 12(12), 2932; https://doi.org/10.3390/pr12122932
Submission received: 9 December 2024 / Revised: 18 December 2024 / Accepted: 20 December 2024 / Published: 21 December 2024
(This article belongs to the Special Issue Metal Oxides and Their Composites for Photocatalytic Degradation)

Abstract

:
In this study, a process for the simultaneous production of hydrogen and carbon from waste organic solvents using liquid plasma was investigated. Ferrite-based perovskites were introduced as catalysts to evaluate the productivity of hydrogen and carbon. A novel ferrite-based perovskite composite, PrxNiyFeO3, was synthesized. The waste organic solvent was converted into liquid hydrocarbons, primarily composed of toluene, through a simple distillation process. Hydrogen (>98%) and nanocarbon were produced through the liquid plasma reaction of the purified organic solvent. The ferrite-based perovskites demonstrated excellent absorption capacities for visible light. Among them, PrxNiyFeO3 exhibited the highest absorption capacities for both UV and visible light and had the smallest band gap energy (approximately 1.72 eV). In the liquid plasma decomposition of organic solvents, the ferrite-based perovskites enhanced the hydrogen production rate and carbon yield. The highest hydrogen production rate and carbon yield were achieved with the newly synthesized PrxNiyFeO3 perovskite composite. PrxNiyFeO3, which has the narrowest band gap compared to other catalysts, is highly sensitive to the strong visible light emitted from plasma and exhibits excellent catalytic activity. This catalyst also demonstrated remarkable reaction activity sustainability and the potential for recycling through regeneration.

Graphical Abstract

1. Introduction

Recently, perovskites have attracted much attention for their photocatalytic applications in the fields of energy conversion and environmental purification [1,2]. The perovskite structure is notable for its excellent light absorption properties and electronic-structural flexibility, making it suitable for various photocatalytic applications. In particular, perovskites can play a crucial role in reactions such as hydrogen production, carbon dioxide reduction, and pollutant decomposition [3,4,5,6]. They have the ability to absorb light and generate electrons, which contribute to the hydrogen production process. Research aimed at increasing the efficiency of photoelectrochemical hydrogen production by doping various metal ions into perovskites is gaining attention [7,8]. Furthermore, perovskites can enhance carbon dioxide reduction efficiency due to their outstanding charge separation and transfer properties in the photocatalytic conversion of CO2 into useful compounds [9,10]. Additionally, perovskites exhibit excellent catalytic performance for the decomposition of organic pollutants in the UV and visible range, attributable to their high activation energy and advantageous electronic structure [11].
While perovskites are known for their excellent photocatalytic performance in the UV range, recent research has focused on expanding their applications to the visible light spectrum. To achieve this, various non-metallic and metallic ion doping technologies have been explored to extend the light absorption range of perovskites [12,13]. In particular, methods have been developed to control the electronic band gap of perovskites by doping with graphitized metals or transition metals, thereby increasing absorption rates in the visible light range [14,15,16,17]. This approach has enabled a broader light absorption range and significantly improved reactivity under visible light. Active research is ongoing to enhance electron transfer efficiency in the visible light range by synthesizing perovskites in single crystal or nanostructured forms, thus increasing surface area [18,19,20]. Moreover, studies on nanostructured perovskites aim to improve structural stability while maintaining excellent performance in high-temperature and high-humidity environments [21,22]. Although organic–inorganic hybrid perovskites may face stability issues [23], research is being conducted to enhance optical and electrical stability by integrating chloride-based perovskites or other heterogeneous materials [24].
Research is ongoing to create an electronic structure suitable for photocatalytic reactions by controlling the positions of the conduction band and valence band of perovskite. This approach aims to improve the catalytic reaction mechanism in the visible light range [25], enabling efficient charge separation and movement, which can enhance the photocatalytic reaction rate. A significant factor in visible light reactions is the interaction between the photocatalyst and the electrolyte [26]. Researchers are also exploring methods to control the surface properties of perovskites to facilitate the efficient movement of electrons and holes, thereby increasing the selectivity and efficiency of catalytic reactions [27]. The research related to the photocatalytic applications of perovskites still holds much potential. Notably, investigations into methods to enhance visible light reactivity and improve structural stability represent important trends, and such research is expected to be actively pursued in the future. This technology is likely to play a crucial role in addressing energy efficiency and environmental challenges. Ferrite-based perovskites have high electrical conductivity by promoting efficient transport of electrons and holes. In addition, they can absorb a wide range of light, including visible and infrared wavelengths, resulting in high energy conversion efficiency. The biggest advantage is that the band gap can be adjusted by controlling the composition of the material [28].
Plasma has demonstrated high energy efficiency in the reaction process for liquid raw materials, which has sparked interest in using plasma for hydrogen production. When liquid alcohol is used as a raw material, it can yield a significantly larger amount of hydrogen. Moreover, alcohol has several advantages, including high solubility in water, biodegradability, a low boiling point, and a low hydrogen conversion temperature [29]. Various methods for producing hydrogen from alcohol using plasma, generated from electromagnetic surface wave discharge [30], dielectric barrier discharge [31], microwave discharge [32,33], AC discharge [34,35], and glow discharge [36], have been investigated in related studies. One major advantage of plasma is that it allows for processes such as silent discharge [37,38], corona discharge [39], gliding arc [40], plasmatron arc [41], and liquid-in-liquid discharge [42], which are much more cost-effective than maintaining high reaction temperatures in the thermocatalytic steam reforming processes used for hydrogen production [43]. Research on plasma-based hydrogen production using liquid hydrocarbons as feedstock has also garnered attention [44,45]. Liquid hydrocarbons, composed solely of carbon and hydrogen, such as benzene, have the advantage of only producing hydrogen and carbon during plasma decomposition, without generating carbon dioxide. Additionally, physically purified waste organic solvents like benzene, toluene, and xylene can be used as feedstock for plasma decomposition, which may have value in terms of waste recycling and clean hydrogen energy production.
In this study, we investigated the reaction to produce hydrogen and carbon through the decomposition of waste organic solvents using liquid-phase plasma, utilizing ferrite-based perovskites as catalysts. We focused on a newly synthesized PrxNiyFeO3-type perovskite composite, which demonstrated significantly improved visible light sensitivity and reduced band gap energy. The physicochemical and optical properties of this novel perovskite composite were thoroughly examined. The waste organic solvent underwent refinement through a simple distillation process, and we analyzed the characteristics of the decomposition reaction employing liquid-phase plasma with the catalyst. Additionally, we evaluated the reaction characteristics based on the type of catalyst used and investigated the underlying mechanism of the decomposition reaction.

2. Materials and Methods

2.1. Preparation of Ferrite-Based Perovskites

PrxNiyFeO3 (PNF) was synthesized using a solvothermal synthesis process combined with the sol–gel method. The raw materials for PNF synthesis included praseodymium(III) nitrate hydrate (Pr(NO3)3·xH2O, 99.9% (REO), Thermo Scientific Chemicals, MA, USA) at 0.1 M, nickel chloride hexahydrate (NiCl2·6H2O, 98%, Duksan, Seoul, Republic of Korea) at 0.1 M, iron nitrate nonahydrate (Fe(NO3)3·9H2O, 98%, Duksan, Seoul, Republic of Korea) at 0.1 M, and citric acid (CA) at 0.1 M. First, praseodymium(III) nitrate hydrate was dissolved in 180 mL of distilled water (DW). Nickel chloride hexahydrate was then added to this solution, which was stirred to prepare solution A (Sol A). Meanwhile, CA was dissolved in another 180 mL of DW. Iron nitrate nonahydrate was added to this solution to prepare solution B (Sol B). Sol A was slowly injected into Sol B, and the mixture was stirred vigorously and reacted at 80 °C for 5 h. The solution was dried in a desiccator at 140 °C for 20 h. The dried powder was calcined in an electric muffle furnace at 800 °C for 10 h.
PrFeO3 (PFO) was synthesized and used as a control. The raw material reagents for PFO synthesis included praseodymium(III) nitrate hydrate at 0.1 M, iron nitrate nonahydrate (Fe(NO3)3·9H2O; Duksan, 98%) at 0.1 M, and CA at 0.1 M. Praseodymium(III) nitrate hydrate was dissolved in 180 mL of DW (Sol C). Meanwhile, CA was first dissolved in another 200 mL of DW, and then iron nitrate nonahydrate was dissolved to prepare solution D (Sol D). Sol D was slowly added to Sol C and stirred for 12 h. The solution was dried in a desiccator at 150 °C for one day. The dried powder was calcined in an electric furnace at 800 °C for 6 h to obtain the final PFO powder. BiFeO3 (BFO) was also prepared using the sol–gel method. First, 200 mL of ethylene glycol (98%, Taesung, Seoul, Republic of Korea) was prepared, and 0.1 M of bismuth(III) nitrate pentahydrate (Duksan, 99%) was added and dissolved. Iron nitrate nonahydrate (0.1 M) was added into this solution and dissolved. The resulting mixture was stirred at 25 °C for 5 h. After stirring at 90 °C for 8 h, the sol was prepared. The BFO sol was dried at 130 °C for 10 h and then calcined at 700 °C for 10 h to prepare the BFO perovskite powder. TiO2 (P25, Evonik, Essen, Germany) was also introduced into the experiment.

2.2. Cracking of Waste Organic Solvent Using Liquid Plasma

Waste organic solvent (WOS) was supplied by YNC Co., Ltd. (Yochon, Republic of Korea) as industrial waste generated in large quantities from washing the reactor at a toluene production plant. The waste organic solvent was refined through a simple distillation process to obtain a refined organic solvent (ROS).
A schematic diagram of the reaction apparatus and a photograph of the reactor used for the liquid plasma cracking reaction experiment are shown in Figure S1 of the Supplementary Material. ROS served as the reactant for the liquid plasma cracking reaction. The amounts of the reactant and catalyst were set at constant values of 150 mL and 1.0 g, respectively. The liquid plasma was directly discharged into the liquid reactant through the plasma generator. The discharge conditions of plasma were adjusted at 250 V, with a frequency of 30 kHz and a pulse width of 5 µs. The discharge power of the plasma generator was adjusted 1 kW during the reaction. The reactant temperature inside the reactor was maintained at a constant 10 °C by circulating water. The components of the gaseous products generated from the cracking reaction were analyzed using gas chromatography (GC). The flow rate of the generated hydrogen gas was measured using a hydrogen-only mass flow meter (MFM; TS-D2200, MFC Korea, Seoul, Republic of Korea). The plasma was pulsed between the anode electrode bars, which were made of tungsten. The hydrogen evolution rate (HER) is defined as the amount of H2 generated after 1 h of process time, expressed as the amount of H2 produced per gram of catalyst.

2.3. Physicochemical Properties of the Perovskites

The physicochemical and optical properties of the synthesized catalysts were investigated using various instrumental analysis techniques. Table S1 in the Supplementary Material summarizes the names and specifications of the analytical instruments used to evaluate the physicochemical properties of the catalysts and solid products prepared in this study. The table also describes the equipment, such as the optical emission spectrometer for plasma analysis and the instrument used to measure the amount of hydrogen produced.

3. Results and Discussion

3.1. Refinement of the WOS

Composition of the WOS and ROS are listed in Table 1. The WOS mainly consisted of approximately 47% toluene and about 43% water. It also contained small amounts of various hydrocarbons, such as benzene. Since water must be removed for the liquid plasma cracking reaction to prevent the generation of carbon dioxide, the WOS was refined through a simple distillation process. The ROS contained approximately 98.7% toluene, with the water completely removed. The content of other hydrocarbons, such as benzene, decreased to approximately 1.3%.

3.2. Physicochemical and Optical Properties of Ferrite-Based Perovskites

The XRD patterns of synthesized PNF and PFO, which were measured using a Ni-filtered CuKα discharge (with a wavelength of 1.5405 Å), are shown in Figure 1a. The diffraction peaks display well-indexed results, with the standard XRD data (JCPDS 18-9725) for PFO presented in the figure. The characteristic peaks of the synthesized PFO XRD pattern align well with those of JCPDS 18-9725 [46], and all peaks can be indexed to the orthorhombic structure. The XRD pattern of PNF also exhibits well-indexed diffraction peaks; however, since PNF is a newly synthesized material in this study, there is no standard XRD data available. In both XRD patterns, characteristic peaks of PrFeO3, Pr(Fe0.7Ni0.3)O3, and NiFeO3 were detected alongside the peaks of PrFeO3. These peaks are considered the most similar materials due to the absence of standard characteristic peaks for PNF in the database. From these characteristic peaks, it can be inferred that PNF is a Pr-Ni-Fe-O-bonded composite. The XRD pattern of BFO is shown in Figure S2 of the Supplementary Material. The XRD diffraction peaks of BFO are in good agreement with the characteristic peaks presented in the standard data, JCPDS card (01-073-0548). Figure 1b displays the FTIR analysis results of PNF. The spectrum of the synthesized nanomaterial was collected in the wavenumber region of 4000–400 cm−1. The spectrum indicates that the metal–oxygen vibration occurs around 600–400 cm−1. All compositions show an absorption peak at 438–442 cm−1 due to the metal–oxygen bond vibration (M–O) and an absorption peak at 567–584 cm−1 corresponding to the Fe–O bending and stretching vibrations representing the octahedral FeO6 group of the perovskite crystal structure.
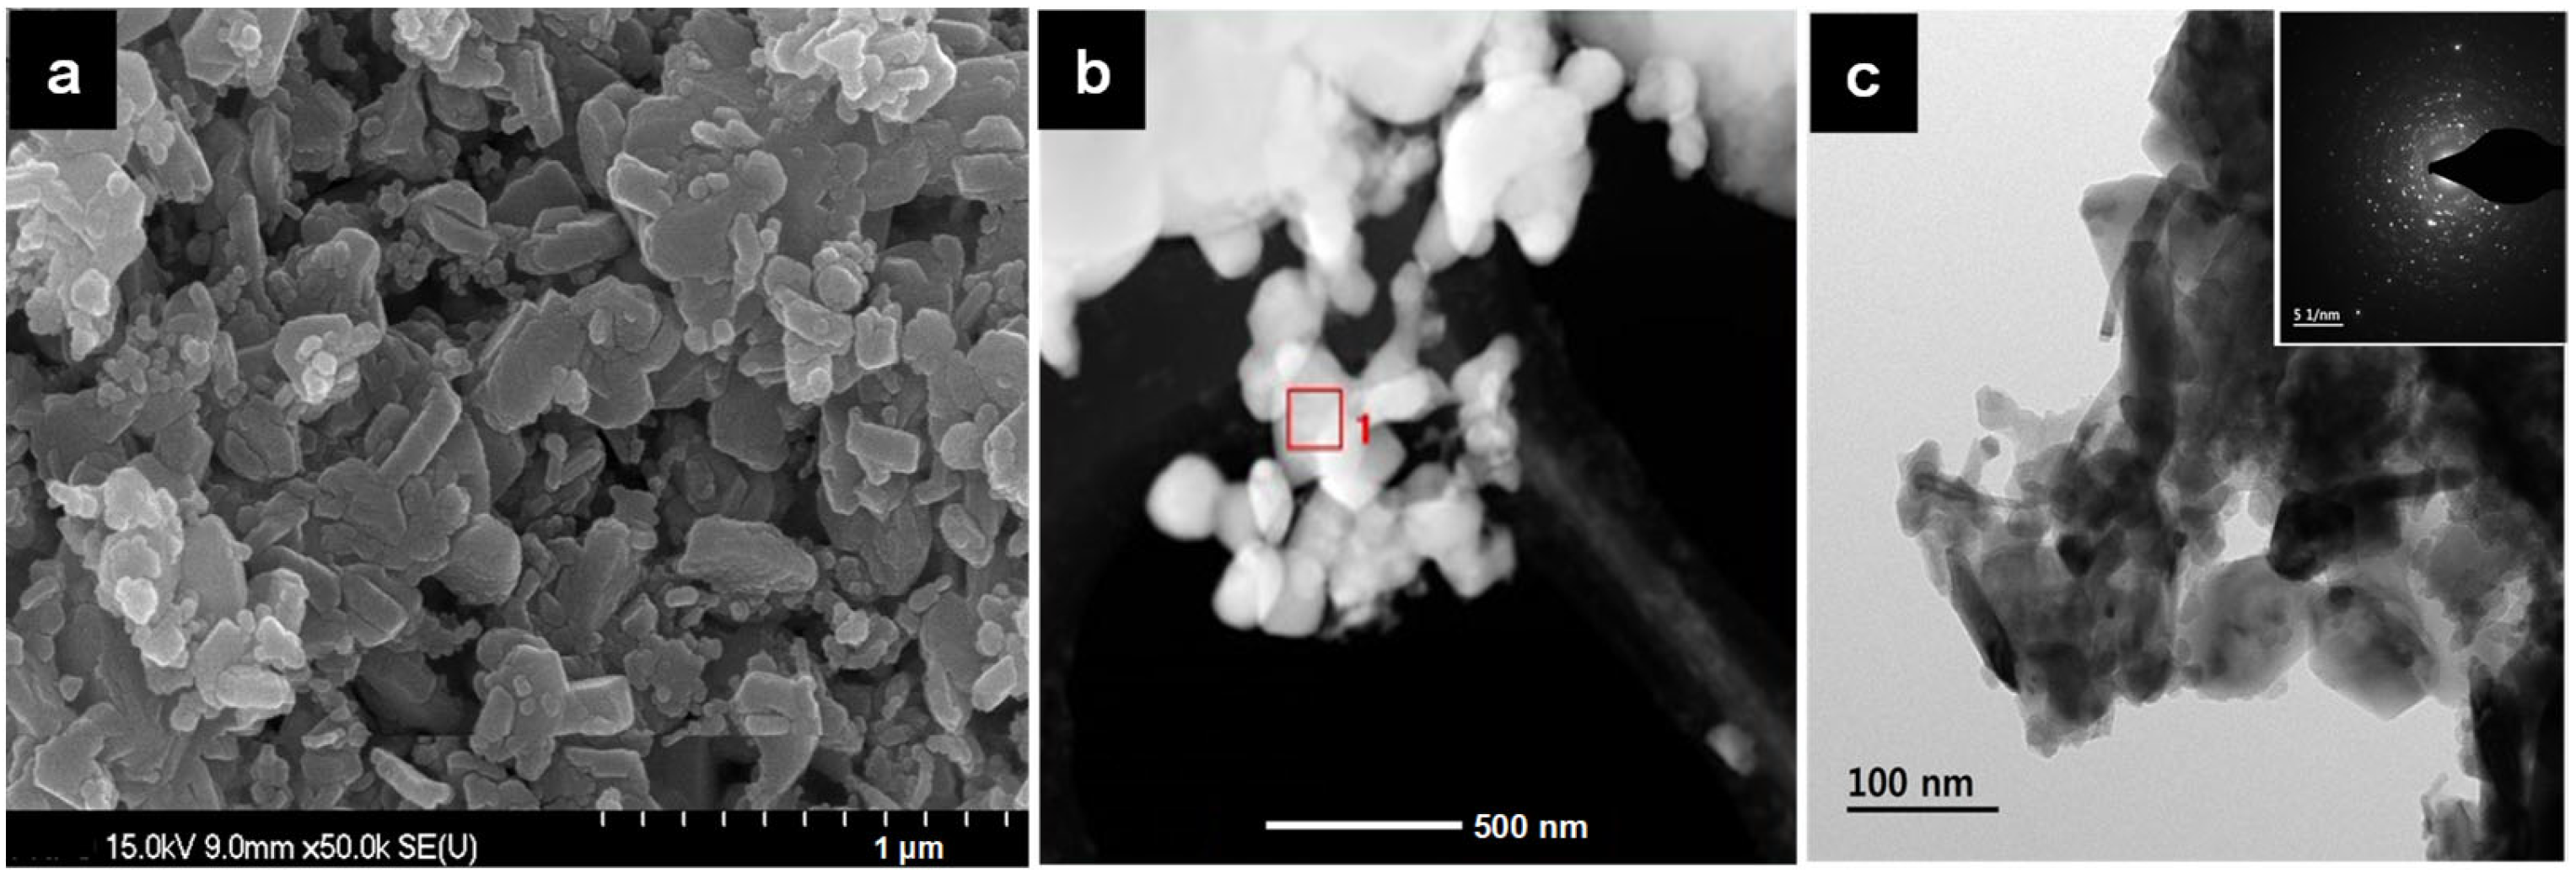
The SEM image of PNF is presented in Figure 2a. The image was measured using the secondary electron (SE) detector of the SEM device (S-4700/Ex-200, Hitachi, Tokyo, Japan). The crystal shape of PNF exhibited an irregular polygonal form. Figure 2b,c shows the TEM images of PNF captured at different magnifications. The square marked “1” in Figure 2b indicates the point where TEM-EDX was measured. The selected area electron diffraction (SAED) result corresponding to Figure 2c is also presented at the top of the figure. The SAED pattern confirmed that the prepared PNF had high crystallinity. The size of the PNF particles ranged from approximately 50 to 80 nm, and the particles appeared to be clumped together.
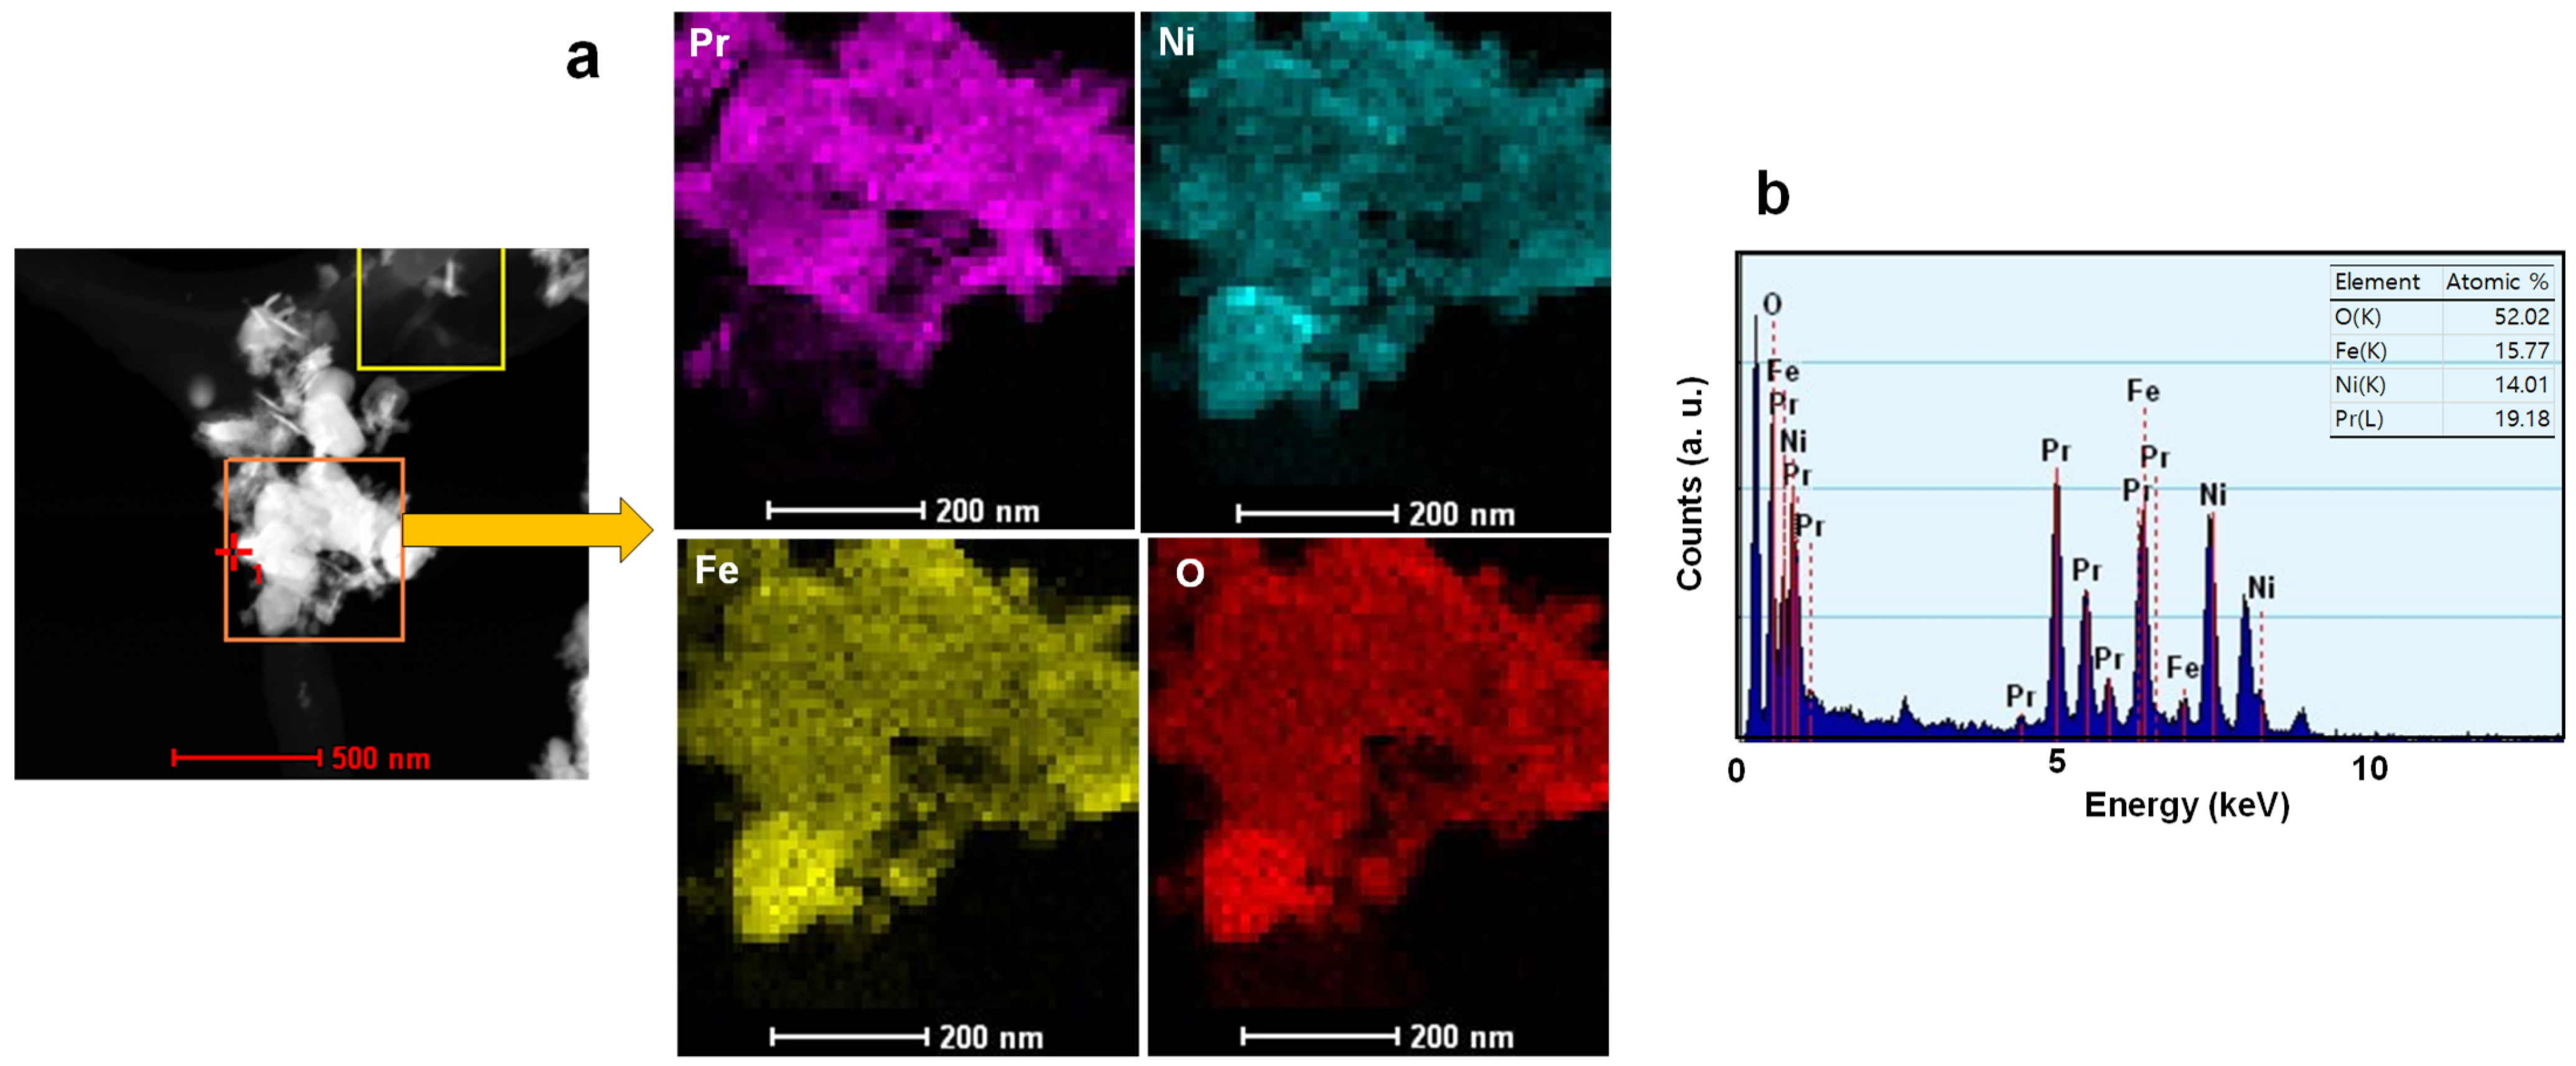
Figure 3a displays the TEM images of the PNF constituent elements obtained through EDX mapping. The square marked “1” indicates the point where mapping was measured. The constituent elements of PNF—Pr, Ni, Fe, and O—were detected. The images of the Pr, Ni, and Fe elements were evenly distributed in the same manner as the particle images. Each element appeared to be uniformly distributed and integrated within the crystal to form a complex compound. Figure 3b shows the TEM-EDX results. The atomic percentages of each element measured in the graphs are shown in a table. The elements Pr, Ni, Fe, and O were detected in the EDX analyses. The compositions obtained from the TEM-EDX analysis were similar in the atomic ratios of Fe, Ni, and Pr. The Pr:Ni:Fe ratio of the synthetic mother solution was adjusted to 1:1:1 under the synthetic conditions before being injected. After synthesis, the composition ratio of Pr:Ni:Fe was not exactly 1:1:1 but was close to it. Therefore, it was determined that the compositional consumption of Pr, Ni, and Fe in the PNF structure resulted in a composition close to the same molar ratio.
To investigate the chemical environment and oxidation states of the elements in PNF, the X-ray photoelectron spectroscopy (XPS) spectra and deconvoluted spectra for Pr 3d, Ni 2p, Fe 2p, and O 1s are presented in Figure 4. The XPS peak of Pr 3d5/2 for Pr metal appears at a binding energy of 932 eV [47]. For Pr 3d5/2 and Pr 3d3/2 of PrFeO3, the binding energy values were observed in the range of 929–955 eV, along with satellite peaks. Therefore, Pr and Fe in PrFeO3 are denoted as Pr2O3 and Fe2O3, respectively. It can be inferred that these elements exist close to the common oxidation state of +3. However, in the deconvolution of the Pr 3d spectrum, peaks appear at binding energies of 930.0 and 950.1 eV, indicating that Pr also exists in the Pr3+ state [48]. In the Ni 2p scan of PNF, the Ni 2p1/2 peaks appeared as double curves around binding energies of 871.1 eV and 880.1 eV. Meanwhile, the Ni 2p3/2 peaks were similarly detected as double curves around binding energies of 855.1 eV and 862.1 eV. In this spectrum, the two peaks appearing at binding energies of 859.0 eV and 880.1 eV are assigned to Ni2+ satellites.
The binding energy values for Fe 2p3/2 and Fe 2p1/2 of PNF were observed at 711.8 eV and 725.0 eV, respectively. The peak observed at 718.4 eV is known as the Fe 2p3/2 satellite peak according to the NIST XPS database [49]. These results for Fe 2p indicate that the oxidation state of iron in the synthesized material is +3 [50]. The binding energy peaks for O 1s were observed at binding energies of 531.7 eV, 530.2 eV, 528.0 eV, and 526.1 eV, corresponding to different chemical states of oxygen [51,52]. The XPS signal for O 1s attributed to lattice oxygen was observed at 528.2 eV, due to the contribution of Pr–O and Fe–O bonds in the PNF crystal lattice. The peak position at 530.2 eV was assigned to surface oxygen, which is due to hydroxyl/carbonate groups. Conversely, the peak at a binding energy of 531.6 eV is attributed to water molecules coordinated to the surface [53,54,55].
Figure 5a shows the optical emission spectroscopy (OES) spectrum of ROS. In this spectrum, carbon production peaks were observed at 469–473 nm, 513–516 nm, and 547–565 nm, while hydrogen production peaks appeared at 602 nm and 656 nm. The OES spectrum of ROS exhibited hydrogen and carbon production peaks in the visible region, occurring as the plasma decomposes the reactants into hydrogen and carbon. During this process, strong visible light is emitted, which excites the catalyst. The DRS spectra of the ferrite-based perovskite catalysts are shown in Figure 5b. TiO2 absorbed only ultraviolet light, with wavelengths shorter than 400 nm. In contrast, the perovskite catalysts absorbed both ultraviolet and visible light, with the visible light having a wavelength of 600 nm. Among the perovskite catalysts, PNF demonstrated the best visible light absorption. The results of the DRS measurements, converted into a Tauc plot [56], are presented in Figure 5c. In this graph, the band gap energy (Eb) of the catalysts can be estimated from the point where the tangent line of the spectrum intersects the x-axis. The Eb of TiO2 was approximately 3.3 eV. The Eb of BFO, obtained using the same method, was approximately 2.25 eV; the Eb of PFO was approximately 2.02 eV; and the Eb of PNF was approximately 1.72 eV.

3.3. Production of Hydrogen and Carbon from the Decomposition of ROS by Liquid Plasma

In the cracking reaction of ROS using liquid plasma, hydrogen and carbon were simultaneously produced. More than 98% of the gaseous products were hydrogen gas, with only a very small amount of CH4 gas being generated. Carbon was produced as a solid byproduct, along with a trace amount of tungsten detected due to the dissolution of the electrode. Figure 6a illustrates the hydrogen production process through plasma decomposition of ROS. The reaction activity of the catalyst decreased by below 10% after 20 h. The results on the degree of catalytic decomposition reaction activity over time are presented in Figure S3. To investigate the regeneration characteristics of the catalyst, the catalyst used in the experiment was collected and regenerated through a washing-drying-calcination process. The results of XRD and FTIR analyses to evaluate the changes in the properties of the pure catalyst and the regenerated catalyst used in the experiment are presented in Figure S4. The diffraction peaks of the XRD pattern did not differ significantly from those of the pure catalyst. However, the crystallinity seemed to have decreased slightly because the intensity of the peaks was low. The characteristic bands were also well displayed in the FTIR spectrum of the regenerated catalyst. From these results, it was confirmed that the catalyst could be regenerated and reused. Figure 6b displays the HER obtained with and without the injection of various catalysts during the plasma decomposition of ROS. ROS was decomposed, and hydrogen was produced solely by discharging the plasma. When the liquid plasma is discharged, strong electrons are generated, which decompose ROS into hydrogen and carbon. The injection of a catalyst improved the cracking activity; HER slightly increased with the TiO2 catalyst. Among the ferrite-based perovskite catalysts, HER was highest in the order of PNF > PFO > BFO. All these catalysts exhibited high sensitivity to visible light and outperformed TiO2. As confirmed in the OES spectrum of ROS in Figure 5a, the plasma discharge strongly emits visible light over 500 nm, which appears to enhance the decomposition activity in ferrite-based perovskite catalysts with high sensitivity to visible light. In particular, PNF exhibited a wide visible light absorption range and excellent absorption capability. The Eb of PNF is also smaller than those of the other catalysts, suggesting it has the best photocatalytic activity.
The yield of the generated carbon is defined as the percentage obtained by dividing the amount of carbon (g) produced after 1 h of reaction by the total amount (g) of the initially injected reactants and then multiplying by 100. Figure 6c shows the carbon yield after 1 h of reaction with and without the injection of various catalysts in the plasma cracking reaction of ROS. The carbon yield followed the same trend as the hydrogen production rate, with the highest yield observed with the PNF catalyst.
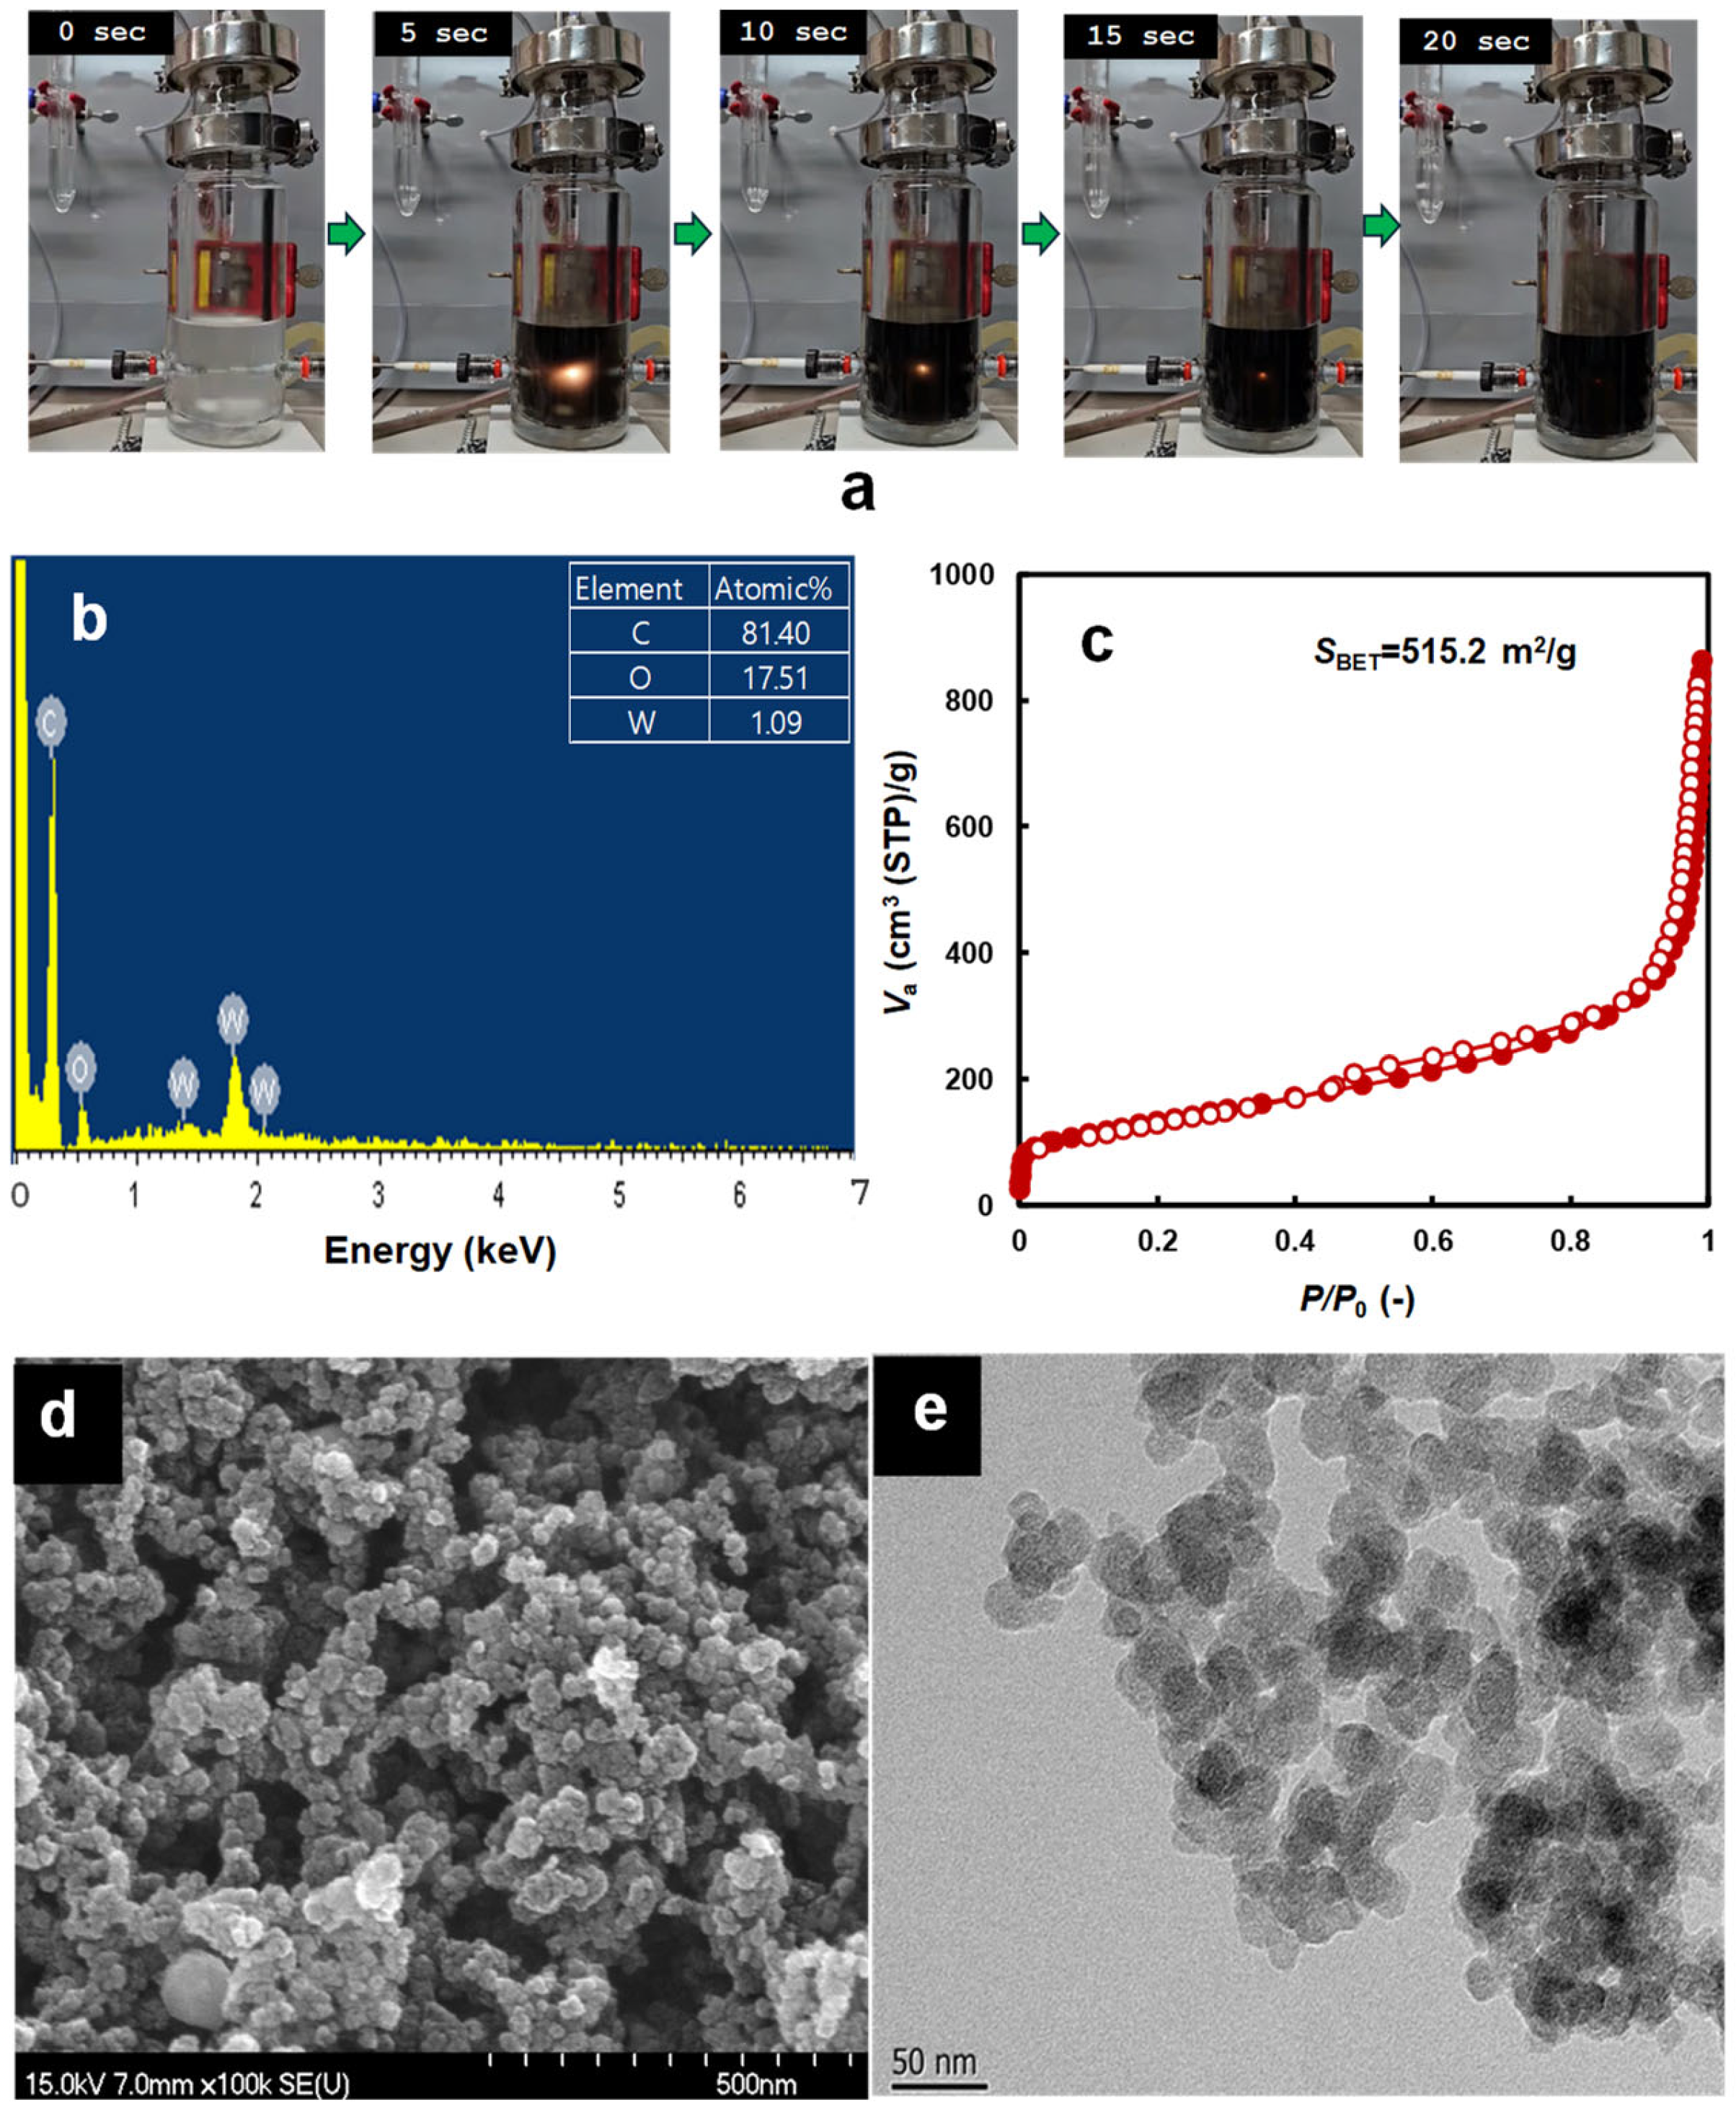
Figure 7a presents a series of photographs illustrating the process of reactant decomposition and carbon generation during the plasma cracking of ROS. Carbon was generated immediately after the plasma was released into the liquid reactants, with the amount gradually increasing over time. Simultaneously, hydrogen, a gaseous product, was also produced. Figure 7b displays the EDX results for the solid products, which were predominantly composed of carbon. Oxygen was detected due to adsorption when the carbon sample was exposed to air. A small amount of tungsten was detected because part of the electrode was eluted. Consequently, the carbon content was approximately 98.9%, excluding oxygen, indicating a carbon purity of over 98%. The N2 isotherm of the carbon particles is shown in Figure 7c. The generated carbon particles exhibited considerable adsorption capacity, and the N2 isotherm resembled the typical adsorption isotherm shape of fine particles with small sizes and no micropores. The BET surface area calculated from the nitrogen adsorption isotherm was approximately 515.2 m2/g. Figure 7d shows a SEM image of the carbon particles, which displayed a spherical shape, with the particles being small and uniform. TEM analysis in Figure 7e confirmed that the particles were small and uniform, with sizes less than approximately 10 nm.

3.4. Hydrogen and Carbon Production Mechanism by Plasma Cracking of WOS

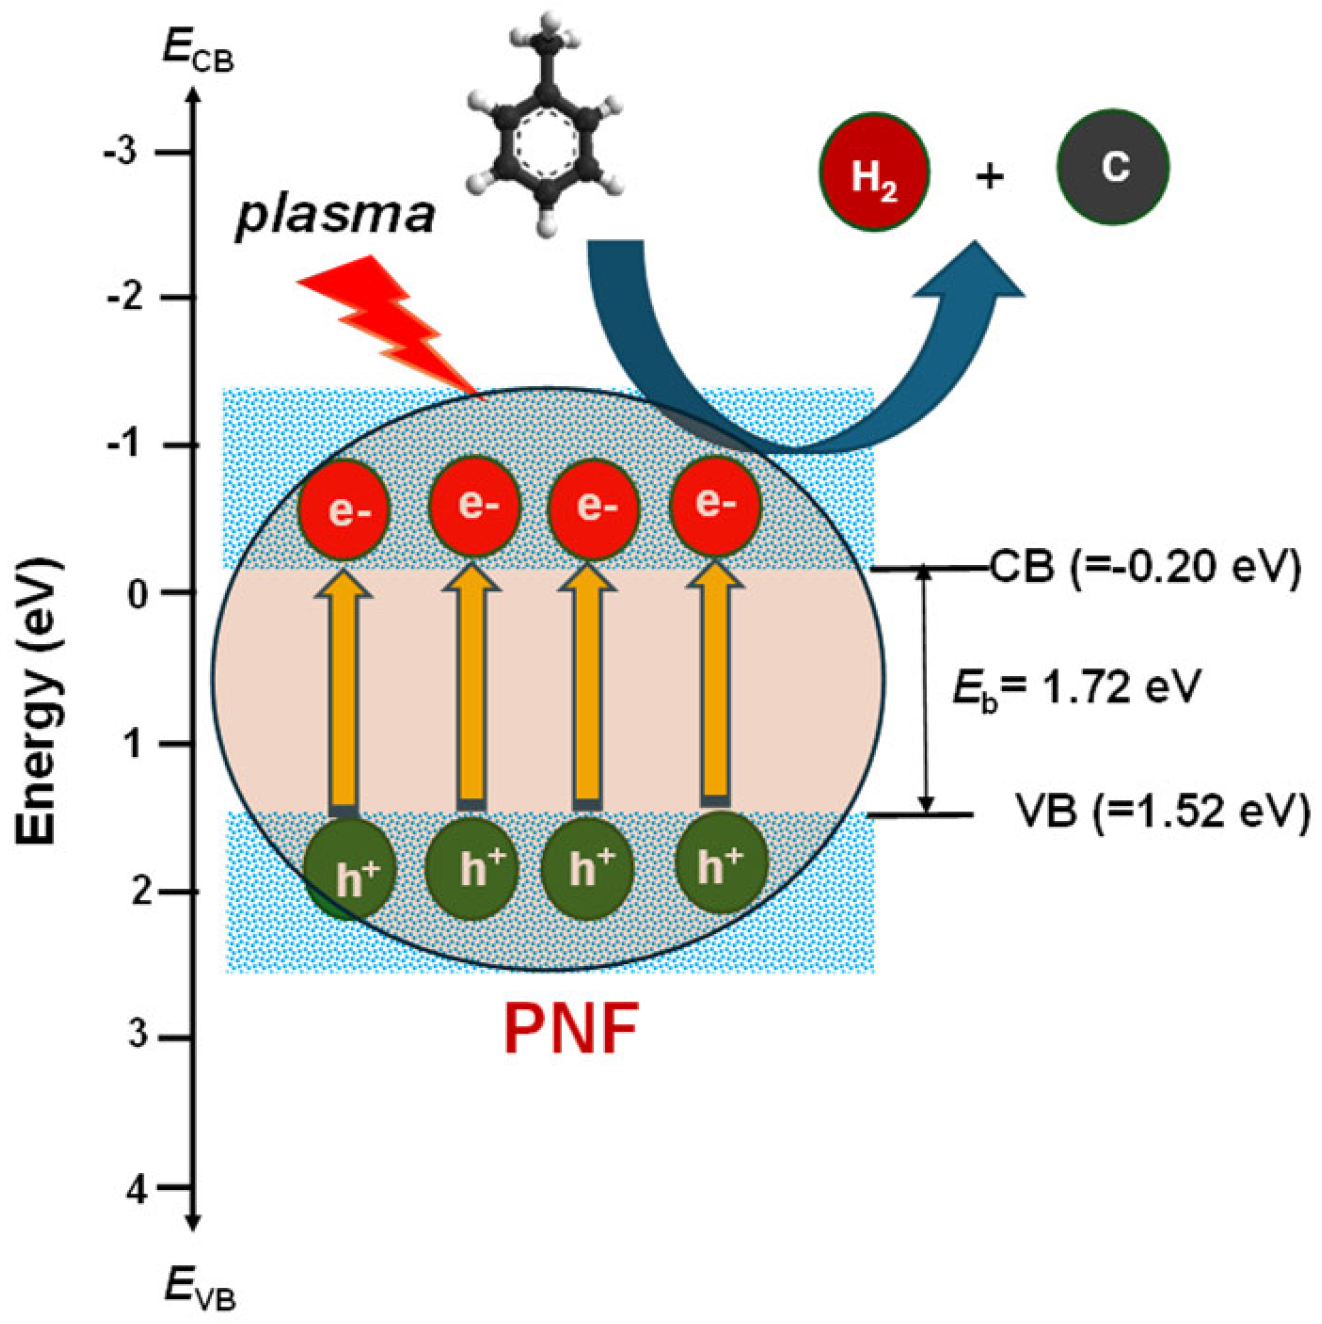
Figure 8 illustrates the mechanism of the plasma cracking reaction on the PNF catalyst for ROS. The ROS primarily consists of toluene and hydrocarbons, including small amounts of xylene. First, the ROS reactant is decomposed by liquid plasma to produce hydrogen and carbon, as shown in Equation (1). In this process, a very small amount of CH4 is produced, but most of it is confirmed to be generated directly from hydrogen and carbon.
When plasma is discharged in liquid hydrocarbons, strong UV and visible light are emitted. Active species, such as active electrons generated by plasma discharge, decompose hydrocarbons and produce hydrogen and carbon. Meanwhile, when plasma is discharged in liquid hydrocarbons, strong UV and visible light are emitted. When a catalyst is injected into this reaction, a photodecomposition reaction occurs by a light source emitted by plasma. If the catalyst is highly sensitive to visible light, it is excited by the strong visible light emitted by the plasma and exhibits catalytic decomposition activity.
The ROS reacts with electrons generated during the photocatalytic reaction by plasma, resulting in the decomposition into hydrogen and carbon. The Eb of PNF is the lowest at approximately 1.72 eV. This is because PNF is easily excited by the strong visible light emitted from the plasma, which interacts with the ROS reactant to generate electrons. These electrons then react with hydrocarbons to facilitate the decomposition into hydrogen and carbon.
C m H n + e m C + n 2 H 2 + e

4. Conclusions

The process for simultaneously producing hydrogen and carbon from WOS using liquid plasma was evaluated. To prevent the generation of carbon dioxide or chloride during the liquid plasma cracking reaction, WOS was converted into liquid hydrocarbons, primarily toluene, through a simple distillation process to remove water. Hydrogen and nano-carbon with a purity exceeding 98% were obtained from the liquid plasma cracking of WOS. Ferrite-based perovskites demonstrated excellent absorption of both UV and visible light, with PNF showing the best visible light absorption. The bandgap energy (Eb) was the smallest at approximately 1.72 eV, indicating high visible light sensitivity. The HER was highest for the PNF catalyst in the liquid plasma cracking of WOS, and this catalyst also achieved the highest carbon yield. PNF exhibited high catalytic activity due to its sensitivity to the strong visible light emitted from plasma, attributed to its narrow bandgap compared to other catalysts. It was determined that PNF catalysts can be recycled through a regeneration process after use.

Supplementary Materials

The following supporting information can be downloaded at: https://www.mdpi.com/article/10.3390/pr12122932/s1, Figure S1: Apparatus of liquid plasma reaction system; Table S1: Information and use of analysis equipment used in this study; Figure S2: XRD patterns of the BFO catalysts; Figure S3: Hydrogen evolution rate with process time of plasma cracking on PNF catalyst; Figure S4: XRD patterns and FTIR spectra of PNF.

Author Contributions

S.-C.J.: conceptualization, methodology, project administration, funding acquisition, writing—original draft. C.-S.Y.: investigation, methodology, formal analysis. K.-H.C.: conceptualization, resources, writing—review and editing, investigation, funding acquisition, supervision. All authors have read and agreed to the published version of the manuscript.

Funding

This research was funded by Basic Science Research Program through the National Research Program Foundation of Korea (NRF) funded by the Ministry of Education (NRF-2022R111A3069740).

Data Availability Statement

Data will be made available on request.

Conflicts of Interest

The authors declare no conflicts of interest.

References

  1. Li, H.; Lai, C.; Wei, Z.; Zhou, X.; Liu, S.; Qin, L.; Yi, H.; Fu, Y.; Li, L.; Zhang, M.; et al. Strategies for improving the stability of perovskite for photocatalysis: A review of recent progress. Chemosphere 2023, 344, 140395. [Google Scholar] [CrossRef] [PubMed]
  2. Zhang, W.; Chu, Y.; Wang, C.; Zhao, Y.; Chu, W.; Zhao, J. Enhancing photocatalytic hydrogen production efficiency in all-inorganic lead-free double perovskites via silver doping-induced efficient separation of photogenerated carriers. Sep. Purif. Technol. 2025, 357, 130111. [Google Scholar] [CrossRef]
  3. Sun, K.; Li, Z.; Cao, Y.; Wang, F.; Qyyum, M.A.; Han, N. Recent advancements in perovskite electrocatalysts for clean energy-related applications: Hydrogen production, oxygen electrocatalysis, and nitrogen reduction. Int. J. Hydrogen Energy 2024, 52, 1104–1126. [Google Scholar] [CrossRef]
  4. Subha, N.; Sankar, A.R.; Navaneethakrishnan, S.; Lavanya, J.; Aakash, M. Perovskite-based Z-scheme photocatalytic system for hydrogen production. Catal. Commun. 2024, 187, 106903. [Google Scholar] [CrossRef]
  5. Tabish, A.; Varghese, A.M.; Wahab, M.A.; Karanikolos, G.N. Perovskites in the energy grid and CO2 conversion: Current context and future directions. Catalysts 2020, 10, 95. [Google Scholar] [CrossRef]
  6. Bienkowski, K.; Solarska, R.; Trinh, L.; Widera-Kalinowska, J.; Al-Anesi, B.; Liu, M.; Grandhi, G.K.; Vivo, P.; Oral, B.; Yılmaz, B.; et al. Halide perovskites for photoelectrochemical water splitting and CO2 reduction: Challenges and opportunities. ACS Catal. 2024, 14, 9. [Google Scholar] [CrossRef]
  7. Al-Gamal, A.G.; Yehia, F.; Elmasry, M.R.; El-Khair, M.A.A.; Kandeel, H.S.; Elseman, A.M.; Kim, D.-H.; Kabel, K.I. Perovskite materials for hydrogen evolution: Processes, challenges and future prospectives. Int. J. Hydrogen Energy 2024, 79, 1113–1138. [Google Scholar] [CrossRef]
  8. Zhou, Y.; Chen, J.; Bakr, O.M.; Sun, H.T. Metal-doped lead halide perovskites: Synthesis, properties, and optoelectronic applications. Chem. Mater. 2018, 30, 6589–6613. [Google Scholar] [CrossRef]
  9. Sundar, D.; Karuppasamy, L.; Gurusamy, L.; Liu, C.-H.; Wu, J.J. Perovskites-like composites for CO2 photoreduction into hydrocarbon fuels. Curr. Opin. Green Sustain. Chem. 2022, 33, 100563. [Google Scholar] [CrossRef]
  10. Chen, Z.; Hu, Y.; Wang, J.; Shen, Q.; Zhang, Y.; Ding, C.; Bai, Y.; Jiang, G.; Li, Z.; Gaponik, N. Boosting photocatalytic CO2 Reduction on CsPbBr3 perovskite nanocrystals by immobilizing metal complexes. Chem. Mater. 2020, 32, 1517–1525. [Google Scholar] [CrossRef]
  11. Bach, A.-U.-R.; Nabi, I.; Chen, Y.; Li, Z.; Iqbal, A.; Liu, W.; Afridi, M.N.; Arifeen, A.; Jin, W.; Yang, L. Environmental application of perovskite material for organic pollutant-enriched wastewater treatment. Coord. Chem. Rev. 2023, 495, 215378. [Google Scholar] [CrossRef]
  12. Lin, Y.; Shao, Y.; Dai, J.; Li, T.; Liu, Y.; Dai, X.; Xiao, X.; Deng, Y.; Gruverman, A.; Zeng, X.C.; et al. Metallic surface doping metal halide perovskites. Nat. Commun. 2021, 12, 7. [Google Scholar] [CrossRef] [PubMed]
  13. Wei, J.; Liu, G.; Fu, H.; Zheng, W.; Ma, L.; Chen, X. Doping engineering of lead halide perovskite nanocrystals for advanced optoelectronic applications. Coord. Chem. Rev. 2024, 519, 216119. [Google Scholar] [CrossRef]
  14. Tasleem, S.; Tahir, M. Current trends in strategies to improve photocatalytic performance of perovskites materials for solar to hydrogen production. Renew. Sustain. Energy Rev. 2020, 132, 110073. [Google Scholar] [CrossRef]
  15. Tasleem, S.; Tahir, M. Recent progress in structural development and band engineering of perovskites materials for photocatalytic solar hydrogen production: A review. Int. J. Hydrogen Energy 2020, 45, 19078–19111. [Google Scholar] [CrossRef]
  16. Attia, A.; Hussain, S.; Khan, M.I.; Sadaf, A.; Seliem, A.F.; Mohammed, A.Y.A.; Ibrahim, M.M. Tuning the band gap edges of perovskite material by Cd doping for achieving high current density in perovskite solar cells. Ceram. Int. 2023, 49, 20465–20469. [Google Scholar] [CrossRef]
  17. Mantry, S.P.; Bharti, N.K.; Modak, B. Enhancement of visible light-driven water splitting and CO2 conversion activities of SrTiO3 by tuning the dopant charge state. J. Phys. Chem. C 2024, 128, 4383–4394. [Google Scholar] [CrossRef]
  18. Wang, X.-D.; Huang, Y.-H.; Liao, J.-F.; Wei, J.-F.; Li, W.-G.; Xu, Y.-F.; Chen, H.-Y.; Kuang, D.-B. Surface passivated halide perovskite single-crystal for efficient photoelectrochemical synthesis of dimethoxydihydrofuran. Nat. Commun. 2021, 12, 1202. [Google Scholar] [CrossRef]
  19. Kumar, V.; Kathiravan, A.; Jhonsi, M.A. Beyond lead halide perovskites: Crystal structure, bandgaps, photovoltaic properties and future stance of lead-free halide double perovskites. Nano Energy 2024, 125, 109523. [Google Scholar] [CrossRef]
  20. Yan, J.; Li, H.; Aldsmasy, M.H.; Frasca, C.; Abate, A.; Zhao, K.; Hu, Y. Advances in the synthesis of halide perovskite single crystals for optoelectronic applications. Chem. Matt. 2023, 35, 2683–2712. [Google Scholar] [CrossRef]
  21. Byranvand, M.M.; Kharat, A.N.; Taghavinia, N. Moisture stability in nanostructured perovskite solar cells. Mater. Lett. 2019, 237, 356–360. [Google Scholar] [CrossRef]
  22. Qin, K.; Dong, B.; Wang, S. Improving the stability of metal halide perovskite solar cells from material to structure. J. Energy Chem. 2019, 33, 90–99. [Google Scholar] [CrossRef]
  23. Liao, D.; Li, P.; Shai, X.; Huang, W.; Liu, S.; Li, H.; Shen, Y.; Wang, M. Recent progress on stability issues of organic–inorganic hybrid lead perovskite-based solar cells. RSC Adv. 2016, 6, 89356–89366. [Google Scholar] [CrossRef]
  24. Miah, M.H.; Khandaker, M.U.; Rahman, M.B.; Nur-E-Alam, M.; Islam, M.A. Band gap tuning of perovskite solar cells for enhancing the efficiency and stability: Issues and prospects. RSC Adv. 2024, 14, 15876–15906. [Google Scholar] [CrossRef]
  25. Raza, M.A.; Li, F.; Que, M.; Zhu, L.; Chen, X. Photocatalytic reduction of CO2 by halide perovskites: Recent advances and future perspectives. Mater. Adv. 2021, 2, 7187–7209. [Google Scholar] [CrossRef]
  26. Chang, Y.K.; Chen, N.-W.; Chen, T.Y.; Shuang, Y.M.; Yen, Y.-S. Enhancing efficiency and stability in perovskite solar cells through blended hole transporting materials incorporating benzo[g]quinoxaline-conjugated small molecules. ACS Appl. Energy Mater. 2024, 7, 1287–1297. [Google Scholar] [CrossRef]
  27. Al-Shujaa, S.; Zhao, P.; He, D.; Al-Anesi, B.; Feng, Y.; Xia, J.; Zhang, B.; Zhang, Y. Improving the efficiency and stability of perovskite solar cells by refining the perovskite-electron transport layer interface and shielding the absorber from UV effects. ACS Appl. Mater. Interfaces 2024, 16, 28493–28504. [Google Scholar] [CrossRef]
  28. Humayun, M.; Ullah, H.; Usman, M.; Habibi-Yangjeh, A.; Tahir, A.A.; Wang, C.; Luo, W. Perovskite-type lanthanum ferrite based photocatalysts: Preparation, properties, and applications. J. Energy Chem. 2022, 66, 314–338. [Google Scholar] [CrossRef]
  29. Palo, D.R.; Dagle, R.A.; Holladay, J.D. Methanol steam reforming for hydrogen production. Chem. Rev. 2007, 107, 3992–4021. [Google Scholar] [CrossRef]
  30. Jimenez, M.; Yubero, C.; Calzada, M.D. Study on the reforming of alcohols in a surface wave discharge (SWD) at atmospheric pressure. J. Phys. D 2008, 41, 175201. [Google Scholar] [CrossRef]
  31. Sarmiento, B.; Brey, J.J.; Viera, I.G.; Gonzalez-Elipe, A.R.; Cotrino, J.; Rico, V.J. Hydrogen production by reforming of hydrocarbons and alcohols in a dielectric barrier discharge. J. Power Sources 2007, 169, 140–143. [Google Scholar] [CrossRef]
  32. Deminsky, M.; Jivotov, V.; Potapkin, B.; Rusanov, V. Plasma assisted production of hydrogen from hydrocarbons. Pure Appl. Chem. 2002, 74, 413–418. [Google Scholar] [CrossRef]
  33. Hrycak, B.; Czylkowski, D.; Miotk, R.; Dors, M.; Jasinski, M.; Mizeraczyk, J. Application of atmospheric pressure microwave plasma source for hydrogen production from ethanol. Int. J. Hydrogen Energy 2014, 39, 14184–14190. [Google Scholar] [CrossRef]
  34. Sun, D.P.; Yang, X.H.; Liu, Y.Y.; Chen, Y.Q. Study on decomposition products of methanol in AC discharge by spectroscopy. Spectrosc. Spectr. Anal. 2008, 28, 1983–1986. [Google Scholar] [CrossRef]
  35. Aubry, O.; Met, C.; Khacef, A.; Cormier, J.M. On the use of a non-thermal plasma reactor for ethanol steam reforming. Chem. Eng. J. 2005, 106, 241–247. [Google Scholar] [CrossRef]
  36. Yan, Z.C.; Li, C.; Lin, W.H. Hydrogen generation by glow discharge plasma electrolysis of methanol solutions. Int. J. Hydrogen Energy 2009, 34, 48–55. [Google Scholar] [CrossRef]
  37. Kabashima, H.; Einaga, H.; Futamura, S. Hydrogen generation from water, methane, and methanol with nonthermal plasma. IEEE Trans. Ind. Appl. 2003, 39, 340–345. [Google Scholar] [CrossRef]
  38. Kabashima, H.; Einaga, H.; Futamura, S. Hydrogen generation from water with nonthermal plasma. Chem. Lett. 2001, 30, 1314–1315. [Google Scholar] [CrossRef]
  39. Li, H.Q.; Zou, J.J.; Zhang, Y.P.; Liu, C.J. Novel plasma methanol decomposition to hydrogen using corona discharges. Chem. Lett. 2004, 33, 744–745. [Google Scholar] [CrossRef]
  40. Chernyak, V.Y.; Olszewski, S.V.; Yukhymenko, V.; Solomenko, E.V.; Prysiazhnevych, I.V.; Naumov, V.V.; Levko, D.S.; Shchedrin, A.I.; Ryabtsev, A.V.; Demchina, V.P.; et al. Plasma-assisted reforming of ethanol in dynamic plasma-liquid system: Experiments and modeling. IEEE Trans. Plasma Sci. 2008, 36, 2933–2939. [Google Scholar] [CrossRef]
  41. Bromberg, L.; Cohn, D.R.; Rabinovich, A. Plasma reformer fuel cell system for decentralized power applications. Int. J. Hydrogen Energy 1997, 22, 83–94. [Google Scholar] [CrossRef]
  42. Chung, K.-H.; Lam, S.S.; Park, Y.-K.; Kim, S.-J.; Jung, S.-C. Application of liquid-phase plasma for the production of hydrogen and carbon from the plasma-induced cracking of liquid hydrocarbons. Fuel 2022, 328, 125297. [Google Scholar] [CrossRef]
  43. Brown, O.F. A comparative study of fuels for on-board hydrogen production for fuel-cell-powered automobiles. Int. J. Hydrogen Energy 2001, 26, 381–397. [Google Scholar] [CrossRef]
  44. Ulejczyk, B.; Nogal, L.; Mlotek, M.; Krawczyk, K. Efficient plasma technology for the production of green hydrogen from ethanol and water. Energies 2022, 15, 2777. [Google Scholar] [CrossRef]
  45. El-Shafie, M.; Kambara, S.; Hayakawa, Y. Hydrogen production technologies overview. J. Power Energy Eng. 2019, 7, 107–154. [Google Scholar] [CrossRef]
  46. Seroglazova, A.S.; Chebanenko, M.I.; Popkov, V.I. Synthesis, structure, and photo-Fenton activity of PrFeO3-TiO2 mesoporous nanocomposites. Condens. Matter. Interphase 2021, 23, 543–547. [Google Scholar] [CrossRef]
  47. Tijare, S.N.; Bakardjieva, S.; Subrt, J.; Joshi, M.V.; Rayalu, S.S.; Hishita, S.; Labhsetwar, N. Synthesis and visible light photocatalytic activity of nanocrystalline PrFeO3 perovskite for hydrogen generation in ethanol-water system. J. Chem. Sci. 2014, 126, 517–525. [Google Scholar] [CrossRef]
  48. Kimura, S.; Arai, F.; Ikezawa, M. Mixed valence of praseodymium oxides. In Proceedings of the 11th International Conference on Vacuum Ultraviolet Radiation Physics, Toshima, Japan, 27 August–1 September 1995; Volume 78, p. 135. [Google Scholar] [CrossRef]
  49. Pradhan, G.; Parida, K. Fabrication of iron-cerium mixed oxide: An efficient photocatalyst for dye degradation. Int. J. Eng. Sci. Tech. 2010, 2, 53. [Google Scholar] [CrossRef]
  50. Huang, Y.; Liu, J.; Deng, Y.; Qian, Y.; Jia, X.; Ma, M.; Yang, C.; Liu, K.; Wang, Z.; Qu, S.; et al. The application of perovskite materials in solar water splitting. J. Semicond. 2020, 41, 011701. [Google Scholar] [CrossRef]
  51. Parida, K.M.; Reddy, K.H.; Martha, S.; Das, D.P.; Biswal, N. Fabrication of nanocrystalline LaFeO3: An efficient sol-gel auto-combustion assisted visible light responsive photocatalyst for water decomposition. Int. J. Hydrogen Energy 2010, 35, 12161. [Google Scholar] [CrossRef]
  52. Pandey, S.K.; Bindu, R.; Bhatt, P.; Chaudhari, S.M.; Piple, A.V. Synthesis and investigation of structural and electronic properties of Pr1−xCaxFeO3 (0≤x≤0.2) compounds. Phys. B 2005, 365, 47–54. [Google Scholar] [CrossRef]
  53. Ito, A.; Masumoto, H.; Goto, T. Microstructure and electrical conductivity of SrRuO3 thin films prepared by laser ablation. Mater. Trans. 2006, 11, 2808. [Google Scholar] [CrossRef]
  54. Dupin, J.; Gonbeau, D.; Vinatire, P.; Levasseur, A. Systematic XPS studies of metal oxides, hydroxides and peroxides. Phys. Chem. Chem. Phys. 2000, 2, 1319. [Google Scholar] [CrossRef]
  55. Ponce, S.; Pena, M.A.; Fierro, J.L.G. Surface properties and catalytic performance in methane combustion of Sr-substituted lanthanum manganites. Appl. Catal. B Environ. 2000, 24, 193. [Google Scholar] [CrossRef]
  56. Makula, P.; Pacia, M.; Macyk, W. How to correctly determine the band gap energy of modified semiconductor photocatalysts based on UV-Vis spectra. J. Phys. Chem. Lett. 2018, 9, 6814–6817. [Google Scholar] [CrossRef]
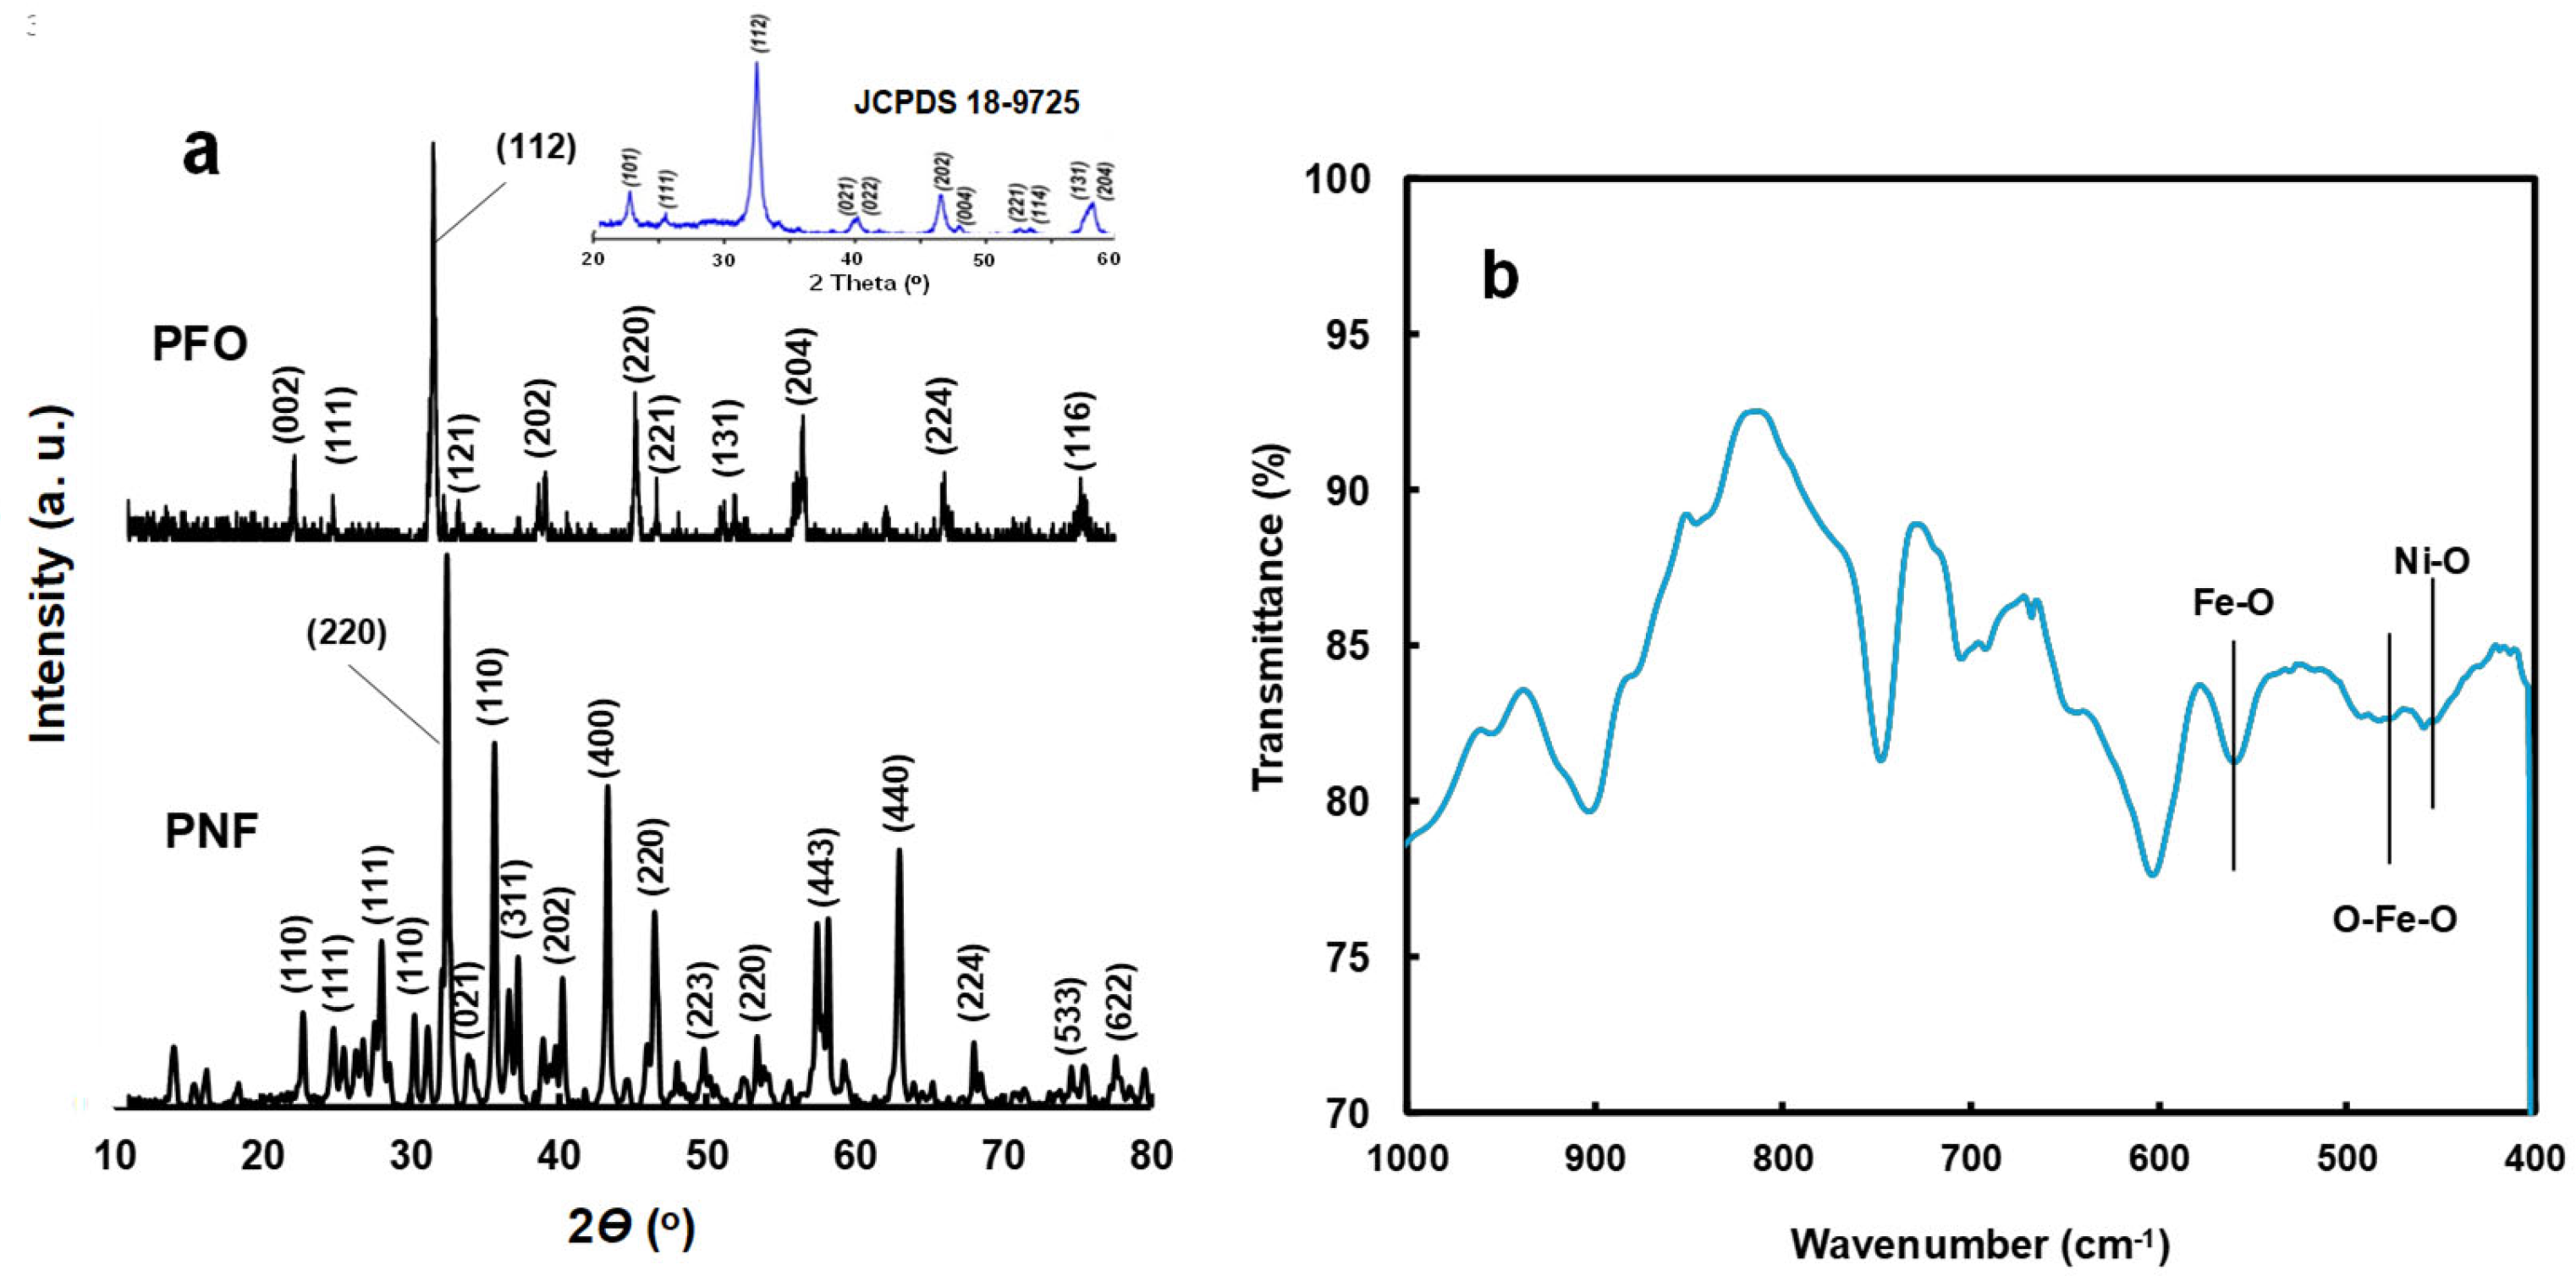
Figure 1. (a) XRD patterns and (b) FTIR spectrum of PNF catalyst.
Processes 12 02932 g001
Figure 2. (a) SEM image, (b) TEM image, and (c) TEM images with SAED of PNF.
Processes 12 02932 g002
Figure 3. (a) TEM mapping images of the component of PNF and (b) TEM-EDX result.
Processes 12 02932 g003
Figure 4. XPS spectra of PNF: (a) Pr 3d scan, (b) Ni 2p scan, (c) Fe 2p scan, and (d) O 1s scan.
Processes 12 02932 g004
Figure 5. (a) OES of plasma into ROS, (b) UV/vis DRS of the catalysts, and (c) Tauc plot of the catalysts.
Processes 12 02932 g005
Figure 6. (a) Flow rate of hydrogen gas with process time in the plasma cracking process, (b) HER over various catalysts, and (c) yield of carbon obtained in the reaction over various catalysts.
Processes 12 02932 g006
Figure 7. (a) A sequence of images showing carbon being produced by plasma cracking of ROS, (b) EDX result of carbon obtained, (c) N2 isotherm with BET surface area, (d) SEM image of the carbon, and (e) TEM image of the carbon.
Processes 12 02932 g007
Figure 8. Schematic diagram of the hydrogen and carbon production reaction mechanism by plasma cracking on PNF catalysts of ROS.
Processes 12 02932 g008
Table 1. Concentration of constituent elements in WOS and ROS distilled from them.
ComponentWOS (Conc., %)ROS (Conc., %)
Benzene1.230.07
1,2-dichloroethane2.710.02
Trichloroethylene0.060
Toluene46.7998.67
Tetrachloroethylene0.030.01
Ethylbenzene0.220.02
p,m-xylene3.540.08
o-xylene2.461.13
Water42.960
total100100
Disclaimer/Publisher’s Note: The statements, opinions and data contained in all publications are solely those of the individual author(s) and contributor(s) and not of MDPI and/or the editor(s). MDPI and/or the editor(s) disclaim responsibility for any injury to people or property resulting from any ideas, methods, instructions or products referred to in the content.