Article

Unraveling the Degradation Kinetics of Genipin-Cross-Linked Chitosan Hydrogels via Symbolic Regression

by
Belmiro P. M. Duarte
1,2,3,* and
Maria J. Moura
1,3
1
Departmento de Engenharia Química e Biológica, Instituto Superior de Engenharia de Coimbra, Instituto Politécnico de Coimbra Rua Pedro Nunes, 3030-199 Coimbra, Portugal
2
Instituto Nacional de Engenharia de Sistemas e Computadores-Coimbra, Universidade de Coimbra, Rua Sílvio Lima, Pólo II, 3030-790 Coimbra, Portugal
3
Chemical Engineering and Renewable Resources for Sustainability Research Center—CERES, Universidade de Coimbra, Rua Sílvio Lima, Pólo II, 3030-790 Coimbra, Portugal
*
Author to whom correspondence should be addressed.
Processes 2025, 13(7), 1981; https://doi.org/10.3390/pr13071981
Submission received: 22 May 2025 / Revised: 17 June 2025 / Accepted: 20 June 2025 / Published: 23 June 2025

Abstract

Chitosan hydrogels have gained attention in biomedical and pharmaceutical research due to their biocompatibility, biodegradability, and tunable properties. To enhance mechanical strength and to control swelling and degradation, chitosan is often cross-linked with either bio-based (e.g., genipin) or synthetic (e.g., glutaraldehyde) agents. A comprehensive understanding of the degradation mechanisms of cross-linked chitosan hydrogels is essential, as it directly impacts performance optimization, regulatory compliance, and their integration into personalized medicine. Despite extensive studies, the fundamental mechanisms governing hydrogel degradation remain partially understood. In this work, we introduce a general data-driven framework based on symbolic regression to elucidate the degradation kinetics of hydrogels. Using genipin-cross-linked chitosan hydrogels as a model system, we analyze experimental degradation data to identify governing kinetic laws. Our results suggest that degradation proceeds primarily via a surface-mediated mechanism. The proposed approach provides a robust and interpretable method for uncovering mechanistic insights and is broadly applicable to other hydrogel systems.

1. Introduction

Chitosan, a biopolymer derived from chitin, has attracted significant attention in biomedical applications due to its biocompatibility, biodegradability, antimicrobial activity, and structural similarity to glycosaminoglycans in the extracellular matrix [1]. In hydrogel form, chitosan exhibits high water content and tissue-like mechanical properties [2], making it suitable for wound healing [3], drug delivery [4], and tissue engineering [5]. However, native chitosan hydrogels often lack sufficient mechanical strength and show uncontrolled swelling, limiting their practical utility [6].
To overcome these limitations, chemical cross-linking—commonly using agents like genipin, glutaraldehyde, or other biocompatible linkers—is employed [7]. Among these, genipin stands out due to its low cytotoxicity and ability to form stable amine-based networks [8]. Cross-linking not only enhances mechanical stability but also enables controlled degradation and drug release, supporting applications such as injectable scaffolds and personalized therapeutics [9]. Functionalization of chitosan with materials such as covalent organic frameworks (COFs) has further expanded its applicability in areas like environmental remediation [10]. In such hybrid systems, degradation not only impacts mechanical integrity but also governs selective adsorption or catalytic behavior, highlighting the need for application-specific kinetic understanding.
Understanding degradation kinetics is essential for several reasons [11,12]: (i) It allows the design of hydrogels with predictable lifespans for temporary biomedical use; (ii) It shapes the release profile of embedded therapeutic agents; and (iii) In regenerative scaffolds, it must align with tissue growth to ensure mechanical support. Studying degradation mechanisms informs cross-linking strategies and enables tailoring hydrogel stability for specific in vivo environments, while ensuring biocompatibility and environmental safety [13,14]. Recent advances in dynamic covalent chemistry have enabled the design of hydrogels that reversibly respond to external stimuli such as pH or CO2 levels [15]. These systems, often assembled through imine-based dynamic surfactants, exhibit self-healing and tunable disassembly behavior. While promising for smart drug delivery or biosensing, such responsive hydrogels further complicate degradation prediction due to their dynamic internal architectures.
Chitosan hydrogel degradation is driven by the following: (i) enzymatic [16], (ii) hydrolytic [17], (iii) oxidative [18], or (iv) combined mechanisms, which manifest as surface, bulk, or gradient degradation patterns [19,20,21]. These degradation modes are governed by the interplay between bond cleavage rates and the diffusion of water or enzymes into the polymer network. Surface degradation occurs when the rate of degradation exceeds the diffusion of degrading agents (e.g., enzymes or water) into the interior, causing material erosion that progresses from the surface inward while preserving the internal structure. This is typically observed in highly cross-linked or hydrophobic networks that restrict internal diffusion.
In contrast, bulk degradation arises when degrading agents penetrate the hydrogel matrix uniformly, reacting throughout the volume. This leads to a simultaneous loss of integrity across the material and can cause swelling, internal collapse, or fragmentation. Gradient degradation represents an intermediate case, where the outer layers degrade faster than the core due to partial diffusion limitations. This creates a spatial degradation gradient and mechanical weakening from the exterior inward, commonly seen in hydrogels with heterogeneous cross-linking densities or balanced diffusion and reaction rates. Recent developments in self-powered hydrogel-based ionic skins exploit ion gradients across polyelectrolyte networks to transduce mechanical and thermal stimuli into electrical signals [22]. These gradient-structured systems highlight how internal compositional heterogeneity can be harnessed for enhanced functionality while underscoring the importance of understanding how such gradients influence degradation kinetics across spatial domains.
Despite extensive study, predicting degradation remains challenging due to the interplay of mechanisms, structural heterogeneity, and environmental variability [23,24]. The absence of definitive kinetic models underscores the need for data-driven, systematic methods [16,19,25].
Symbolic regression (SR) offers a promising route to identify governing equations from data without assuming a fixed functional form [26,27]. By leveraging evolutionary algorithms—especially genetic programming—SR searches for interpretable expressions through biologically inspired operations such as selection, crossover, and mutation. It has demonstrated success in revealing mechanistic models from noisy datasets [28]. SR has been increasingly applied in kinetic modeling under conditions of partial knowledge or high uncertainty [29,30,31,32], offering a model-agnostic and interpretable framework for mechanistic inference [33,34].
Given the complex, factorial nature of chitosan hydrogel degradation and the lack of systematic tools to extract governing laws from experimental data, this work applies SR to derive degradation rate expressions. To the best of our knowledge, this is the first study to use SR for modeling chitosan hydrogel degradation kinetics. The resulting expressions are benchmarked against canonical kinetic models to infer plausible mechanisms, offering a data-driven pathway toward rational hydrogel design.

1.1. Nomenclature

In our notation, boldface lowercase letters represent vectors, boldface capital letters denote continuous domains, blackboard bold capital letters indicate discrete domains, and capital letters stand for matrices. Finite sets with ι elements are compactly written as follows: ι { 1 , , ι } . Data structures with ι records are denoted by { D } ι . The transpose of a matrix or vector is represented by the superscript “”, and hcat(A, B) represents the horizontal concatenation of two matrices with an equal number of rows into one, while one, while vcat(A, B) represents the vertical concatenation of matrices with an equal number of columns.

1.2. Novelty Statement and Organization

This study presents four key innovations: (i) a systematic data-driven approach to infer mechanistic kinetic laws for hydrogel degradation based on experimental observations; (ii) an algebraic post-processing framework to simplify and convert symbolic kinetic equations into interpretable forms; (iii) the use of resemblance analysis to identify the most plausible underlying degradation mechanisms; and (iv) the application of these tools to genipin-cross-linked chitosan hydrogels across varying cross-linker concentrations.
The remainder of this paper is organized as follows. Section 2 describes the production and characterization of the genipin-cross-linked chitosan hydrogels. Section 3 introduces the fundamentals of symbolic regression and details the methodology employed. In Section 4, we present the proposed algorithm. Section 5 demonstrates the application of the framework to uncover mechanistic degradation laws for hydrogels with varying cross-linking densities. Finally, Section 6 summarizes the main findings and highlights the contributions of this work.

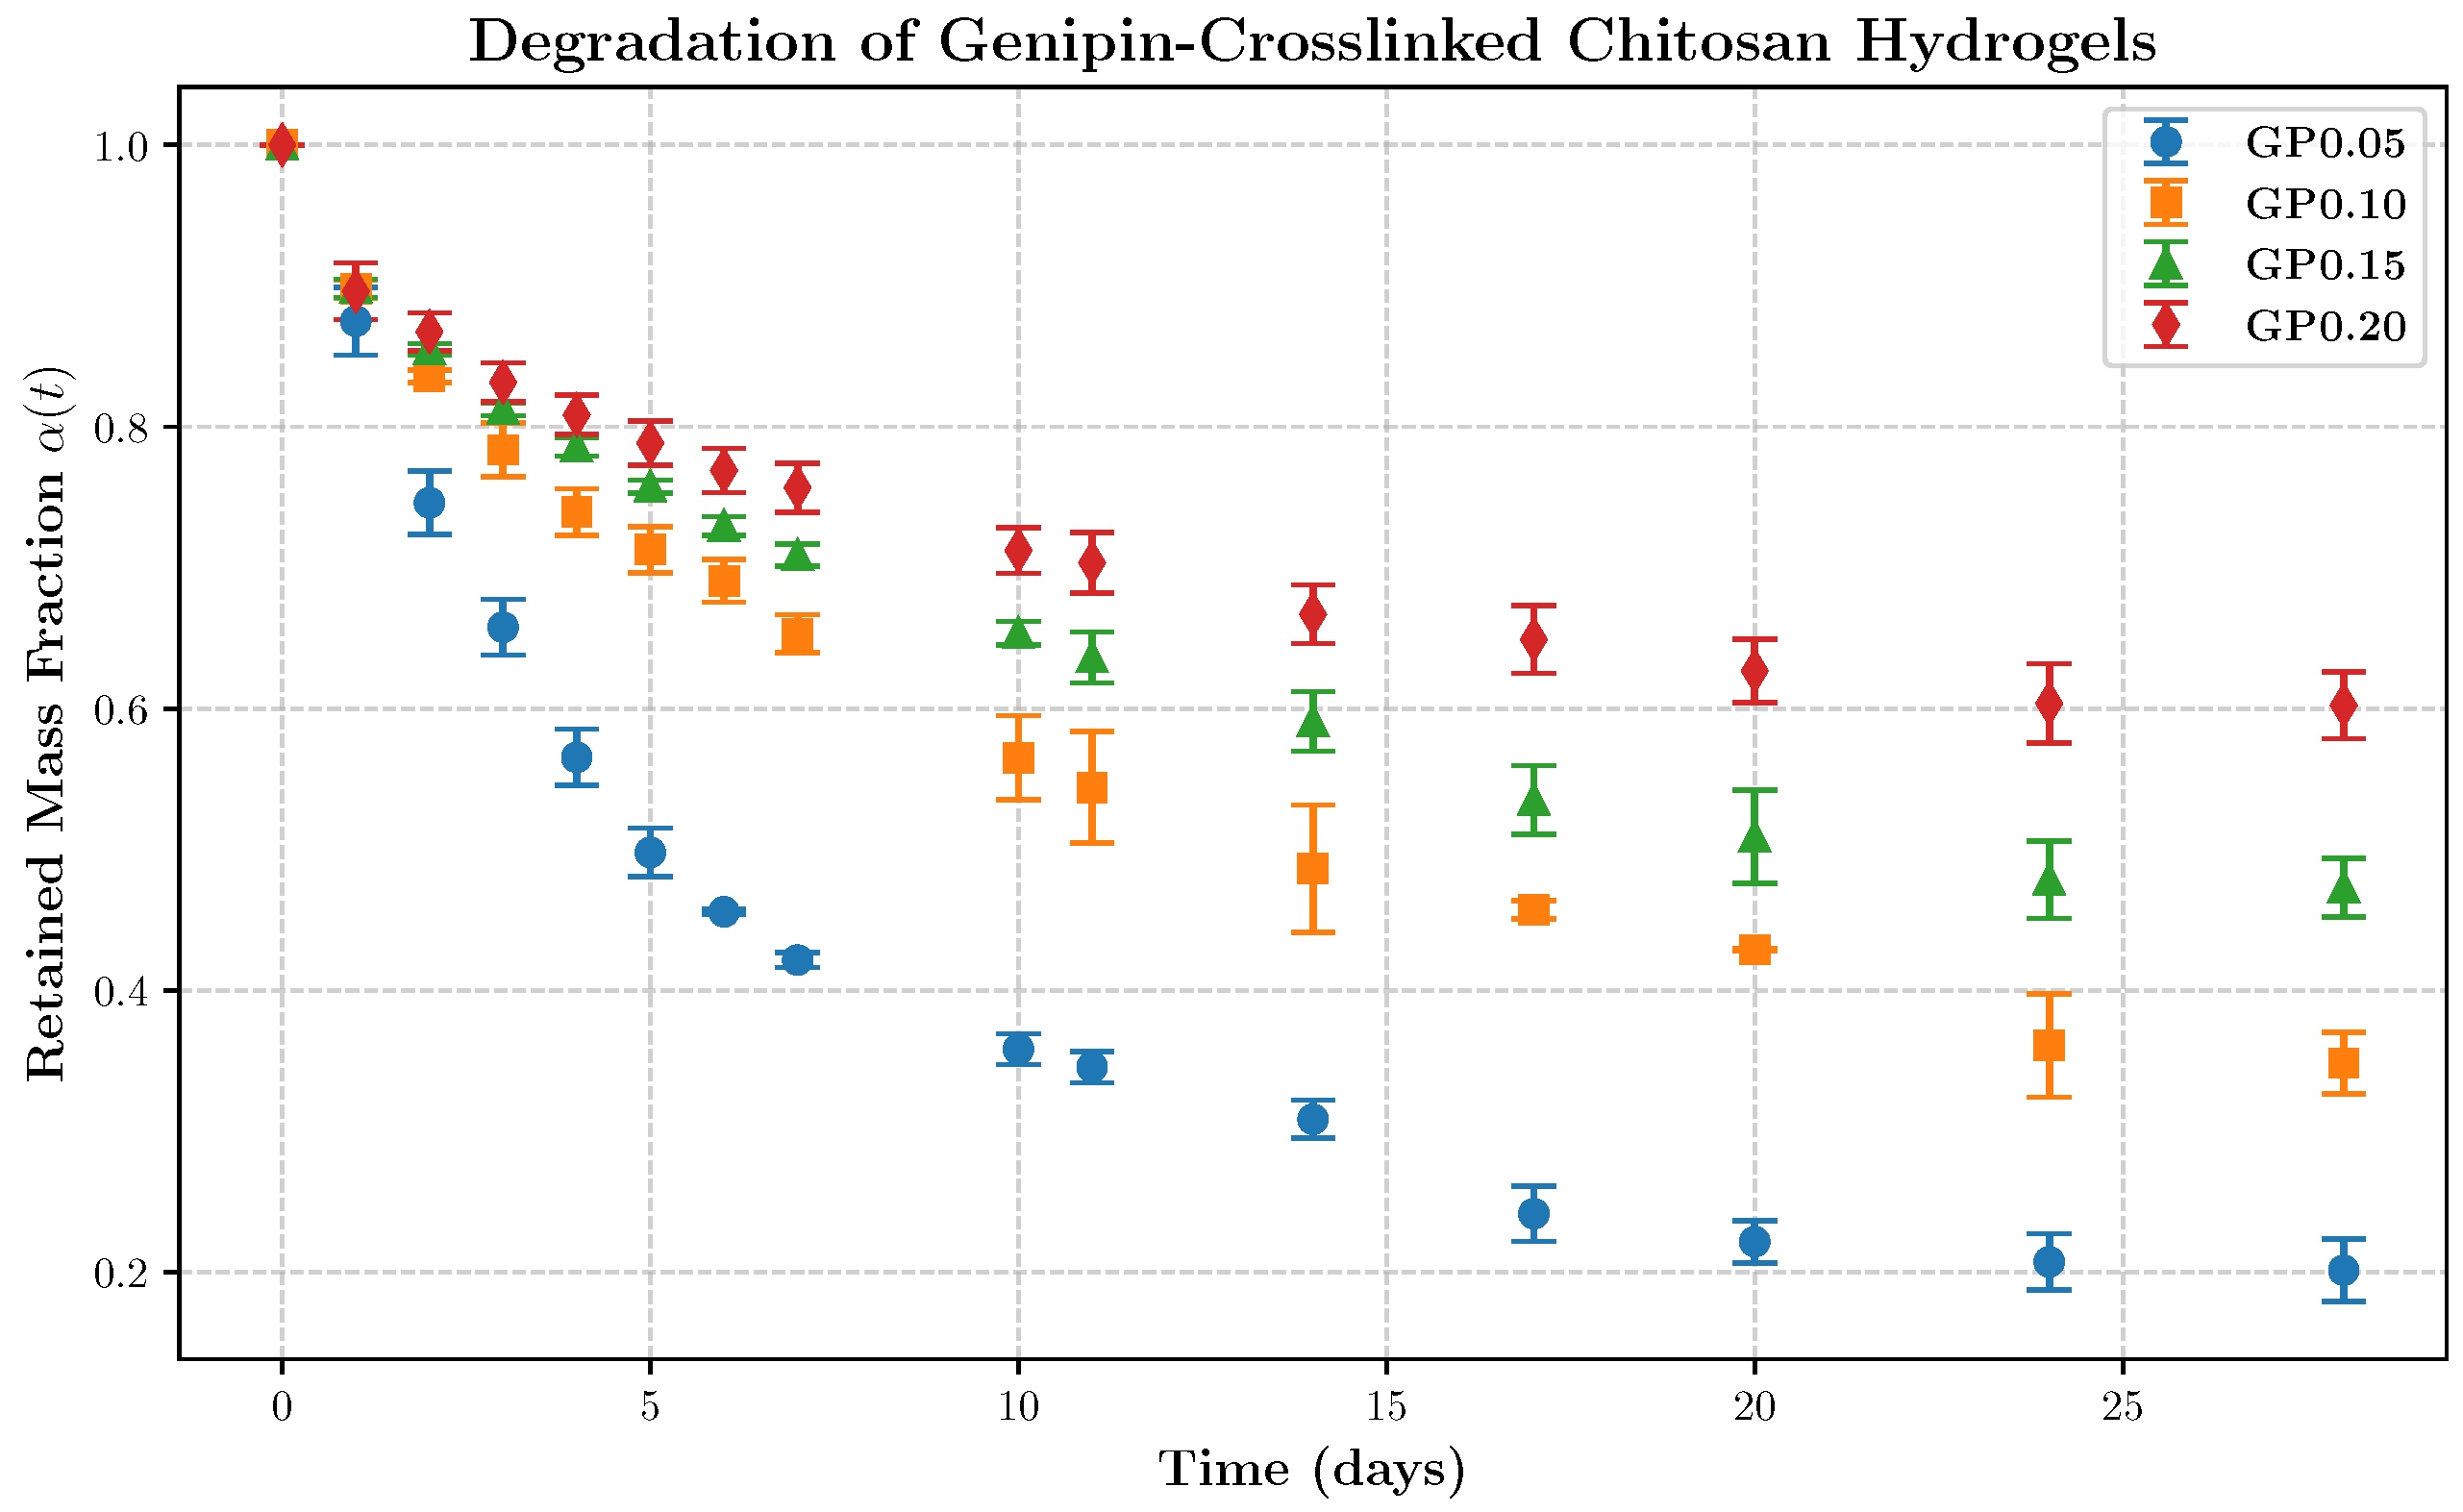
2. Genipin-Cross-Linked Chitosan Gels

Chitosan is a primary aliphatic amine derived from the alkaline deacetylation of chitin, a biopolymer found in the exoskeletons of crustaceans and insects, as well as in fungi and mushrooms [35]. The structural properties of chitosan, such as its average molecular weight and degree of deacetylation, are critical factors that influence the polymer’s chain length and the proportion of deacetylated units, respectively. These properties, in turn, determine key characteristics like solubility, reactivity, and mechanical behavior [36].
The presence of reactive amino groups makes chitosan an excellent candidate for functionalization and chemical cross-linking, which are processes that enable the formation of elastic, stable hydrogels. These hydrogels have found broad applications in tissue engineering and controlled drug delivery [37]. However, the biomedical potential of chitosan has been somewhat limited by its relatively low mechanical strength and unpredictable in vivo degradation behavior. To overcome these challenges, chemical modifications—particularly cross-linking—have been extensively explored to enhance the stability and functionality of chitosan-based gels.
Among the various cross-linking agents, genipin has garnered considerable attention due to its ability to form stable interchain linkages between chitosan molecules, significantly improving the mechanical properties of the resulting gels [38]. Genipin is a naturally derived agent with low cytotoxicity and favorable biodegradability, making it an attractive option for biomedical applications. Additionally, its compatibility with other biopolymers, such as gelatin, further extends its utility, especially for drug encapsulation in controlled-release systems [39].
Building on the success of genipin-cross-linked chitosan gels in forming stable networks, a deeper understanding of the mechanisms driving their mass degradation kinetics is essential for optimizing their performance in biomedical settings. The degradation behavior of these hydrogels is influenced by several factors, including cross-link density, the surrounding environment, and the specific interactions between the gel and biological systems. A comprehensive understanding of these factors is crucial for the design of hydrogels with tailored degradation rates and mechanical properties suited to their intended applications.
Experimental studies have played a pivotal role in identifying both the rate and extent of degradation, providing valuable data for the development of predictive models. These models are key to elucidating the complex processes involved in hydrogel breakdown, such as diffusion-controlled release, and the interaction between gel structure and biological factors. Furthermore, theoretical analysis—particularly through kinetic modeling and computational simulations—complements experimental efforts by offering insights into the underlying mechanisms, enabling more precise control over hydrogel design. By integrating experimental data with theoretical frameworks, it is possible to develop robust and tunable gel systems with optimized degradation profiles, thereby enhancing their applicability.

Material, Sample Preparation, and Degradation Monitoring

The experimental procedure used to form and monitor the degradation rate of genipin-cross-linked chitosan hydrogels is described below. The chitosan, purchased from Sigma-Aldrich (St. Louis, MO, USA), was in powder form with a molecular weight of approximately 2 × 10 5 Dalton and a degree of deacetylation greater than 85%. Hydrated β -glycerol-phosphate disodium salt (C3H7Na2O6P · xH2O; FW = 218.05 g/mol) was also obtained from Sigma-Aldrich and was used to adjust the pH of the chitosan solution. Genipin, in the form of crystal-like powder (reagent grade), was supplied by Challenge Bioproducts Co. (Taichung, Taiwan).
The chitosan hydrogels in this study are intended for use in tissue engineering and drug release matrices. The β -glycerol-phosphate disodium salt is commonly used to modulate the pH of chitosan-based systems to the human body range (7.35–7.45), as demonstrated in References Chenite et al. [40], Moura et al. [41], and Han et al. [42]. In this study, it was used for the same purpose. All other reagents and solvents were of analytical grade.
The production procedure began with the preparation of an aqueous chitosan solution by dissolving 2 g of chitosan in 100 cm3 of distilled water containing 0.5% (v/v) acetic acid at room temperature. The solution was then filtered and sonicated to ensure homogeneity. Filtration was performed using a paper filter with an approximate pore size of 11 μm (Whatman Grade 1), and sonication was applied for 5 min to ensure uniformity.
A measured amount of disodium glycerol phosphate was subsequently dissolved in distilled water and added dropwise to the chitosan solution under continuous magnetic stirring. This resulted in a clear, homogeneous mixture with a chitosan concentration of 1.5 g/100 cm3 and a pH of 7.0. We should note that the concentration of 1.5 g/100 cm3 was defined gravimetrically, i.e., chitosan was weighed using a high-precision balance and dissolved in a fixed volume of solvent, assuming complete dissolution. Finally, genipin powder was added to the mixture to achieve final concentrations ranging from 0.05% to 0.20% (w/w), depending on the sample formulation. The samples were cylindrical, with a diameter of approximately 15 mm and a height of 10 mm.
Hydrogel degradation was assessed by monitoring the mass loss of samples immersed in an aqueous solution over time [43]. Approximately 0.4 g of each hydrogel was placed in separate 50 mL containers, each containing 10 mL of phosphate-buffered saline (PBS, pH 7.4). To simulate enzymatic degradation under physiological conditions, lysozyme was added at a concentration of 1.5 μg/mL, reflecting typical human serum levels [44]. The samples were incubated at 37 °C with orbital shaking at 80 rpm for 28 days, and the medium was refreshed every two days. Temperature was strictly controlled using an incubator maintained at 37 °C ± 0.5 °C. Relative humidity in the incubator was controlled at 30%.
At predetermined time points, samples were collected, gently blotted to remove excess surface moisture, and weighed. The retained mass fraction was calculated using the following:
α ( t ) = m ( t ) m 0 ,
where α ( t ) denotes the fraction of mass retained at time t, with m 0 and m ( t ) representing the initial and time-dependent sample masses, respectively. All procedures were conducted in triplicate under sterile conditions.

3. Fundamentals of Symbolic Regression

At its core, SR explores a vast space of candidate mathematical expressions generated from a user-defined set of primitives, such as variables, constants, basic arithmetic operations (e.g., +, −, ×, ÷), and functions (e.g., sin, log, exp). Unlike traditional regression methods that assume a predefined functional form, SR seeks to uncover both the structure and parameters of the governing equations. The search is typically guided by an optimization algorithm that evaluates candidate models according to a fitness function, balancing predictive accuracy with model complexity to foster interpretability through a combined parsimony metric [45,46].
A common approach to implementing SR is through genetic programming (GP), an evolutionary algorithm inspired by the principles of natural selection. In this framework, candidate models are represented as tree-like structures, where internal nodes represent mathematical operators and leaf nodes correspond to variables or constants. The population of models evolves over successive generations through genetic operations [47,48]:
  • Selection: Models that exhibit better performance are more likely to be selected for reproduction.
  • Crossover (recombination): Pairs of models exchange subtrees to generate offspring, encouraging the combination of beneficial traits.
  • Mutation: Random modifications are introduced to the expression trees, maintaining diversity and facilitating the exploration of new regions in the solution space.
The primary objective is to evolve models that not only accurately capture the underlying data-generating process but also remain compact and interpretable, thereby enabling deeper scientific understanding [49]. Symbolic Regression has found applications in diverse fields, including system identification, physics-based modeling, control systems, and the discovery of kinetic rate laws in chemical and biological systems [50,51].

Methodological Analysis of SR

Let the dataset { D } ι = { Y , X } ι represent dynamic experimental data collected at discrete time points T = { 1 , , T } , where T = | T | is the total number of observations. The output and input trajectories are defined as Y = { y i } i T with y i R n o , and X = { x i } i T with x i R n i , respectively. Each vector y i = ( y i , 1 , , y i , n o ) and x i = ( x i , 1 , , x i , n i ) contains the measured outputs and inputs at time i. The subscript ι denotes potential replication indices when multiple experimental runs are available.
We consider the problem of uncovering an unknown parametric relationship between covariates x R n i and responses y R n o based on observed data. Specifically, we assume that the data are generated by an unknown function f ( x , θ ) , where both the functional form f and the associated parameter vector θ are unknown. Our objective is to infer both the structure of the mapping and its parameters. That is,
y = f ( x , θ ) + ε ,
where ε accounts for measurement noise or process variability. Since the true dynamics f are not directly accessible, we approximate them using symbolic models M ( x , θ M ) , selected from a model class M composed of expressions built from atomic functions, constants, and operators.
Each candidate model M M defines a distinct parametric approximation to f , with its own associated parameter vector θ M Θ R d M , where Θ is a compact parameter space. The compactness of Θ guarantees the well-posedness of the optimization problems that follow. The complexity of model M is quantified by its dimension d M , which reflects the number of free parameters or structural components it contains.
Given a dataset { ( x i , y i ) } i = 1 T , we interpret each y i as a noisy realization of the unknown function evaluated at x i . For a given model M , the predicted response is
y ^ M , i = M ( x i , θ ^ M ) ,
where θ ^ M denotes a preliminary estimate of the model parameters. To balance interpretability and predictive accuracy, we select model structures that offer a good approximation to the observed data while remaining parsimonious.
The model selection problem is formulated as
min M M i = 1 T L M ( x i , θ ^ M ) , y i ,
where L ( · , · ) is a suitable loss function (e.g., root mean squared error or relative deviation). The parameters θ ^ M may be obtained through an inner optimization loop or heuristic approximation for each candidate model.
Let M denote the optimal model structure selected by (3). Once M is fixed, the corresponding parameter estimation problem is defined as
min θ M i = 1 T L M ( x i , θ M ) , y i .
This two-stage procedure—searching over symbolic model structures and subsequently fitting their parameters—provides a principled framework for recovering interpretable, data-consistent approximations to the unknown process f ( x , θ ) .
Genetic algorithms (GAs) are widely used to solve SR problems, aiming to discover model M that balances predictive accuracy with structural simplicity. The typical GA-based symbolic regression workflow consists of the following steps [28]:
1.
Model representation: Each candidate model M is represented as an expression tree, where internal nodes represent mathematical operations (e.g., + , , × , ÷ ) and leaves represent variables or constants.
2.
Initial population: A diverse initial population of symbolic expressions is generated using a predefined function and terminal set. Constants are randomly initialized and later optimized.
3.
Fitness evaluation: The fitness of each model is computed using a regularized objective function:
Fitness ( M ) = i = 1 T L y ^ M , i , y i + λ · Complexity ( M ) ,
where L ( · , · ) is a loss function (e.g., RMSE or AARD), Complexity ( M ) penalizes the model size d M , and λ is a penalty constant commonly referred to as the parsimony coefficient.
4.
Selection: Models are selected for reproduction based on their fitness scores, using methods such as tournament selection or roulette wheel sampling.
5.
Crossover and Mutation: (i) Crossover: Two parent trees exchange randomly selected subtrees to produce offspring. (ii) Mutation: A node or subtree is randomly altered, which may include replacing operators, variables, or constants.
6.
Parameter optimization (optional): Once a symbolic structure is identified, its numerical parameters θ M can be refined using local optimization techniques. This corresponds to solving the parameter estimation problem (4).
7.
Termination: The algorithm iterates over generations until a termination criterion is met, such as a fixed number of generations or convergence in fitness.
8.
Model selection: The best-performing model M is selected as the solution to the SR problem.
Various packages support symbolic regression using GA, with comparative performance analyses provided by La Cava et al. [52], Radwan et al. [53]. Notable Python-compatible libraries include the following:
  • PySR [54], which combines mutation-heavy evolutionary search, Pareto front-based model selection, and deterministic expression simplification.
  • gplearn [55], a tree-based genetic programming library implementing fitness-based SR and classification.
  • DEAP [56], a general-purpose evolutionary computation framework that supports GP.
  • TPOT [57], which applies GA to automate machine learning pipelines, including SR components.
These tools vary in flexibility, optimization strategies, and symbolic simplification capabilities. In this study, we adopt gplearn due to its simplicity and extensibility, particularly the ease of incorporating custom atomic functions. Although gplearn lacks advanced symbolic simplification features, we address this limitation by post-processing its output using symbolic algebraic manipulation via SymPy [58].

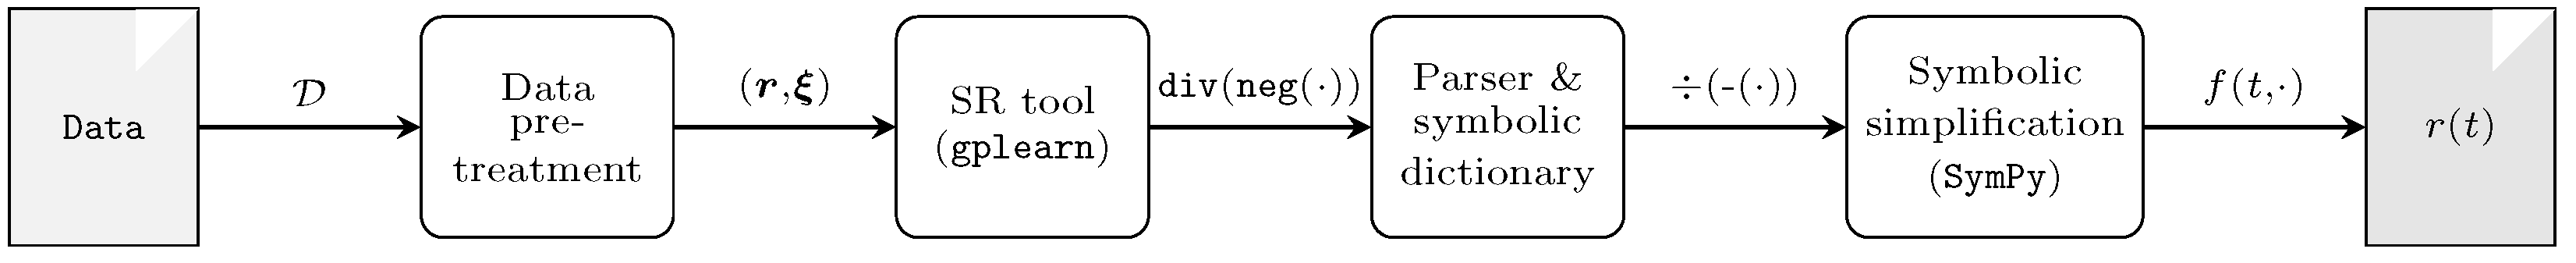
4. Algorithm for Constructing Kinetic Degradation Models

In this section, we introduce the algorithm developed to construct structural models that describe the kinetic degradation behavior of gels. The procedure involves four main steps, summarized as follows and discussed in detail thereafter:
1.
Preprocessing of experimental data, including scaling and noise reduction;
2.
Construction of symbolic regression models from the processed data;
3.
Symbolic manipulation and simplification of the resulting expressions;
4.
Comparison of the derived symbolic forms with standard kinetic models associated with known degradation mechanisms, leading to the identification of the most probable mechanism underlying the observed behavior.
Figure 1 illustrates the sequence of steps and the flow of information between them. The first three steps are fully automated, while the final step requires expert analysis.

4.1. Pre-Processing of Experimental Data

This step involves the following operations: (i) scaling the covariates to mitigate numerical instabilities; (ii) filtering the response variable and constructing local approximations of the degradation rate; and (iii) extending the set of candidate terms for the kinetic rate model by introducing new atomic functions, while bounding others to ensure numerical stability.
The purpose of covariate scaling is twofold: (i) to mitigate the risk of numerical instability during model construction; and (ii) to normalize the range of all covariates, thus avoiding distortions caused by disparate variable scales.
In this framework, each covariate vector x is rescaled to lie within the interval [ a , 1 ] , where a > 0 is a predefined lower bound. The scaled covariate vector, denoted by ξ , is computed as follows:
ξ = x min ( x ) max ( x ) min ( x ) · ( 1 a ) + a
Here, min ( x ) and max ( x ) refer to the element-wise minimum and maximum values of x , respectively. Specifically, ξ 1 represents the scaled experimental duration, ξ 2 the scaled cross-linker concentration, and ξ 3 the scaled mass degradation.
We now turn to the filtering of the data and the estimation of local degradation rates. Data filtering is a critical pre-processing step that enhances the quality of raw measurements by attenuating noise, addressing outliers, and highlighting relevant trends. This process helps ensure that the constructed model captures the underlying degradation behavior, rather than being misled by spurious fluctuations or measurement errors.
In this study, a local Savitzky–Golay filter [59] is employed as a smoothing technique with two primary objectives:
  • To smooth the raw degradation data while preserving key local features of the degradation profile;
  • To estimate local degradation rates, denoted as r ( t ) , through numerical differentiation of the smoothed retention curve:
    r ( t ) = d α d τ t T ,
    where α is the retained mass fraction, τ is the continuous time variable over which smoothing is performed, and t refers to discrete time points of interest.
The resulting estimates r ( t ) serve as the response variable in subsequent model development.
Finally, we define the set of candidate terms to be used in the SR. Table 1 presents the operators and functions included in the basis, along with their respective arities (i.e., number of arguments). In addition to the standard built-in operations, we incorporated domain-specific functions such as the exponential and power functions, which are frequently found in kinetic rate expressions [60].

4.2. Symbolic Regression for Kinetic Rate Modeling

This section describes the application of a genetic programming-based symbolic regression (SR) algorithm to infer analytical expressions describing the kinetic degradation rate laws of the hydrogel system. We employed the gplearn package (version 0.4.2) with Python 3.11.8, which evolves symbolic expressions through a tree-based genetic programming framework.
The dataset { D } consists of time-indexed observations of degradation rates { r } t T as response variables, along with corresponding covariates { ξ } t T that include physicochemical features such as pH, cross-linker concentration, and temperature. Formally, we write the following:
{ D } = ( r t , ξ t ) t T .
To account for differences in scale across observations, we adopt the average absolute relative deviation (AARD) as the loss function [61]:
L ( r ^ , r ) = 1 T i = 1 T r ^ i r i r i ,
where r ^ i = M ( ξ i ; θ ^ M ) is the model prediction, and r i is the observed degradation rate.
To discourage overly complex expressions and encourage interpretability, we introduce a complexity penalty in the fitness function (Equation (5)) and set the parsimony coefficient to λ = 1 × 10 3 . This balances the trade-off between model accuracy and symbolic simplicity.
To assess the robustness and consistency of the inferred models, we conducted multiple independent SR runs with varying random seeds and data shuffling. The convergence of these runs to similar symbolic structures indicates solution stability and alleviates concerns of overfitting to specific data realizations. This multi-run strategy functions as an internal validation mechanism, enhancing the reproducibility and credibility of the discovered kinetic rate laws.
Additionally, each run employs a cross-validation strategy based on the out-of-bag (OOB) technique [62]. Here, each model (or population individual) is trained on a randomly selected subset of the training data, while the remaining unseen portion—the OOB set—is used to evaluate the model’s predictive performance. Thus, the OOB fitness provides an unbiased estimate of generalization capability without the need for a separate validation dataset.

4.3. Parsing and Simplifying the SR Output

We convert the output of the SR procedure into a symbolic expression suitable for algebraic manipulation using the SymPy library. This is accomplished by applying a custom parser that translates the operators and functions from the SR result into a format recognized by SymPy’s symbolic engine. To automate this process, we developed a mapping dictionary that connects SR-specific syntax to their corresponding SymPy representations. If any components are not initially covered, they can be easily incorporated by extending the dictionary.

4.4. Kinetic Law Identification

In this section, we perform a symbolic comparison between the degradation expression derived via SR and classical kinetic rate laws to evaluate whether the observed degradation behavior aligns with established mechanistic models. This comparison, summarized in Table 2, provides insights into the dominant degradation mechanisms likely governing the process.
To accommodate temporal variations in degradation behavior—potentially arising from structural or mechanical changes in the hydrogel—we introduce the following time-dependent rate constants: k surf ( t ) , k bulk ( t ) , and k grad ( t ) . These time dependencies enable the incorporation of physical transformations into the kinetic modeling framework, which are typically not captured by classical chemical kinetics alone.

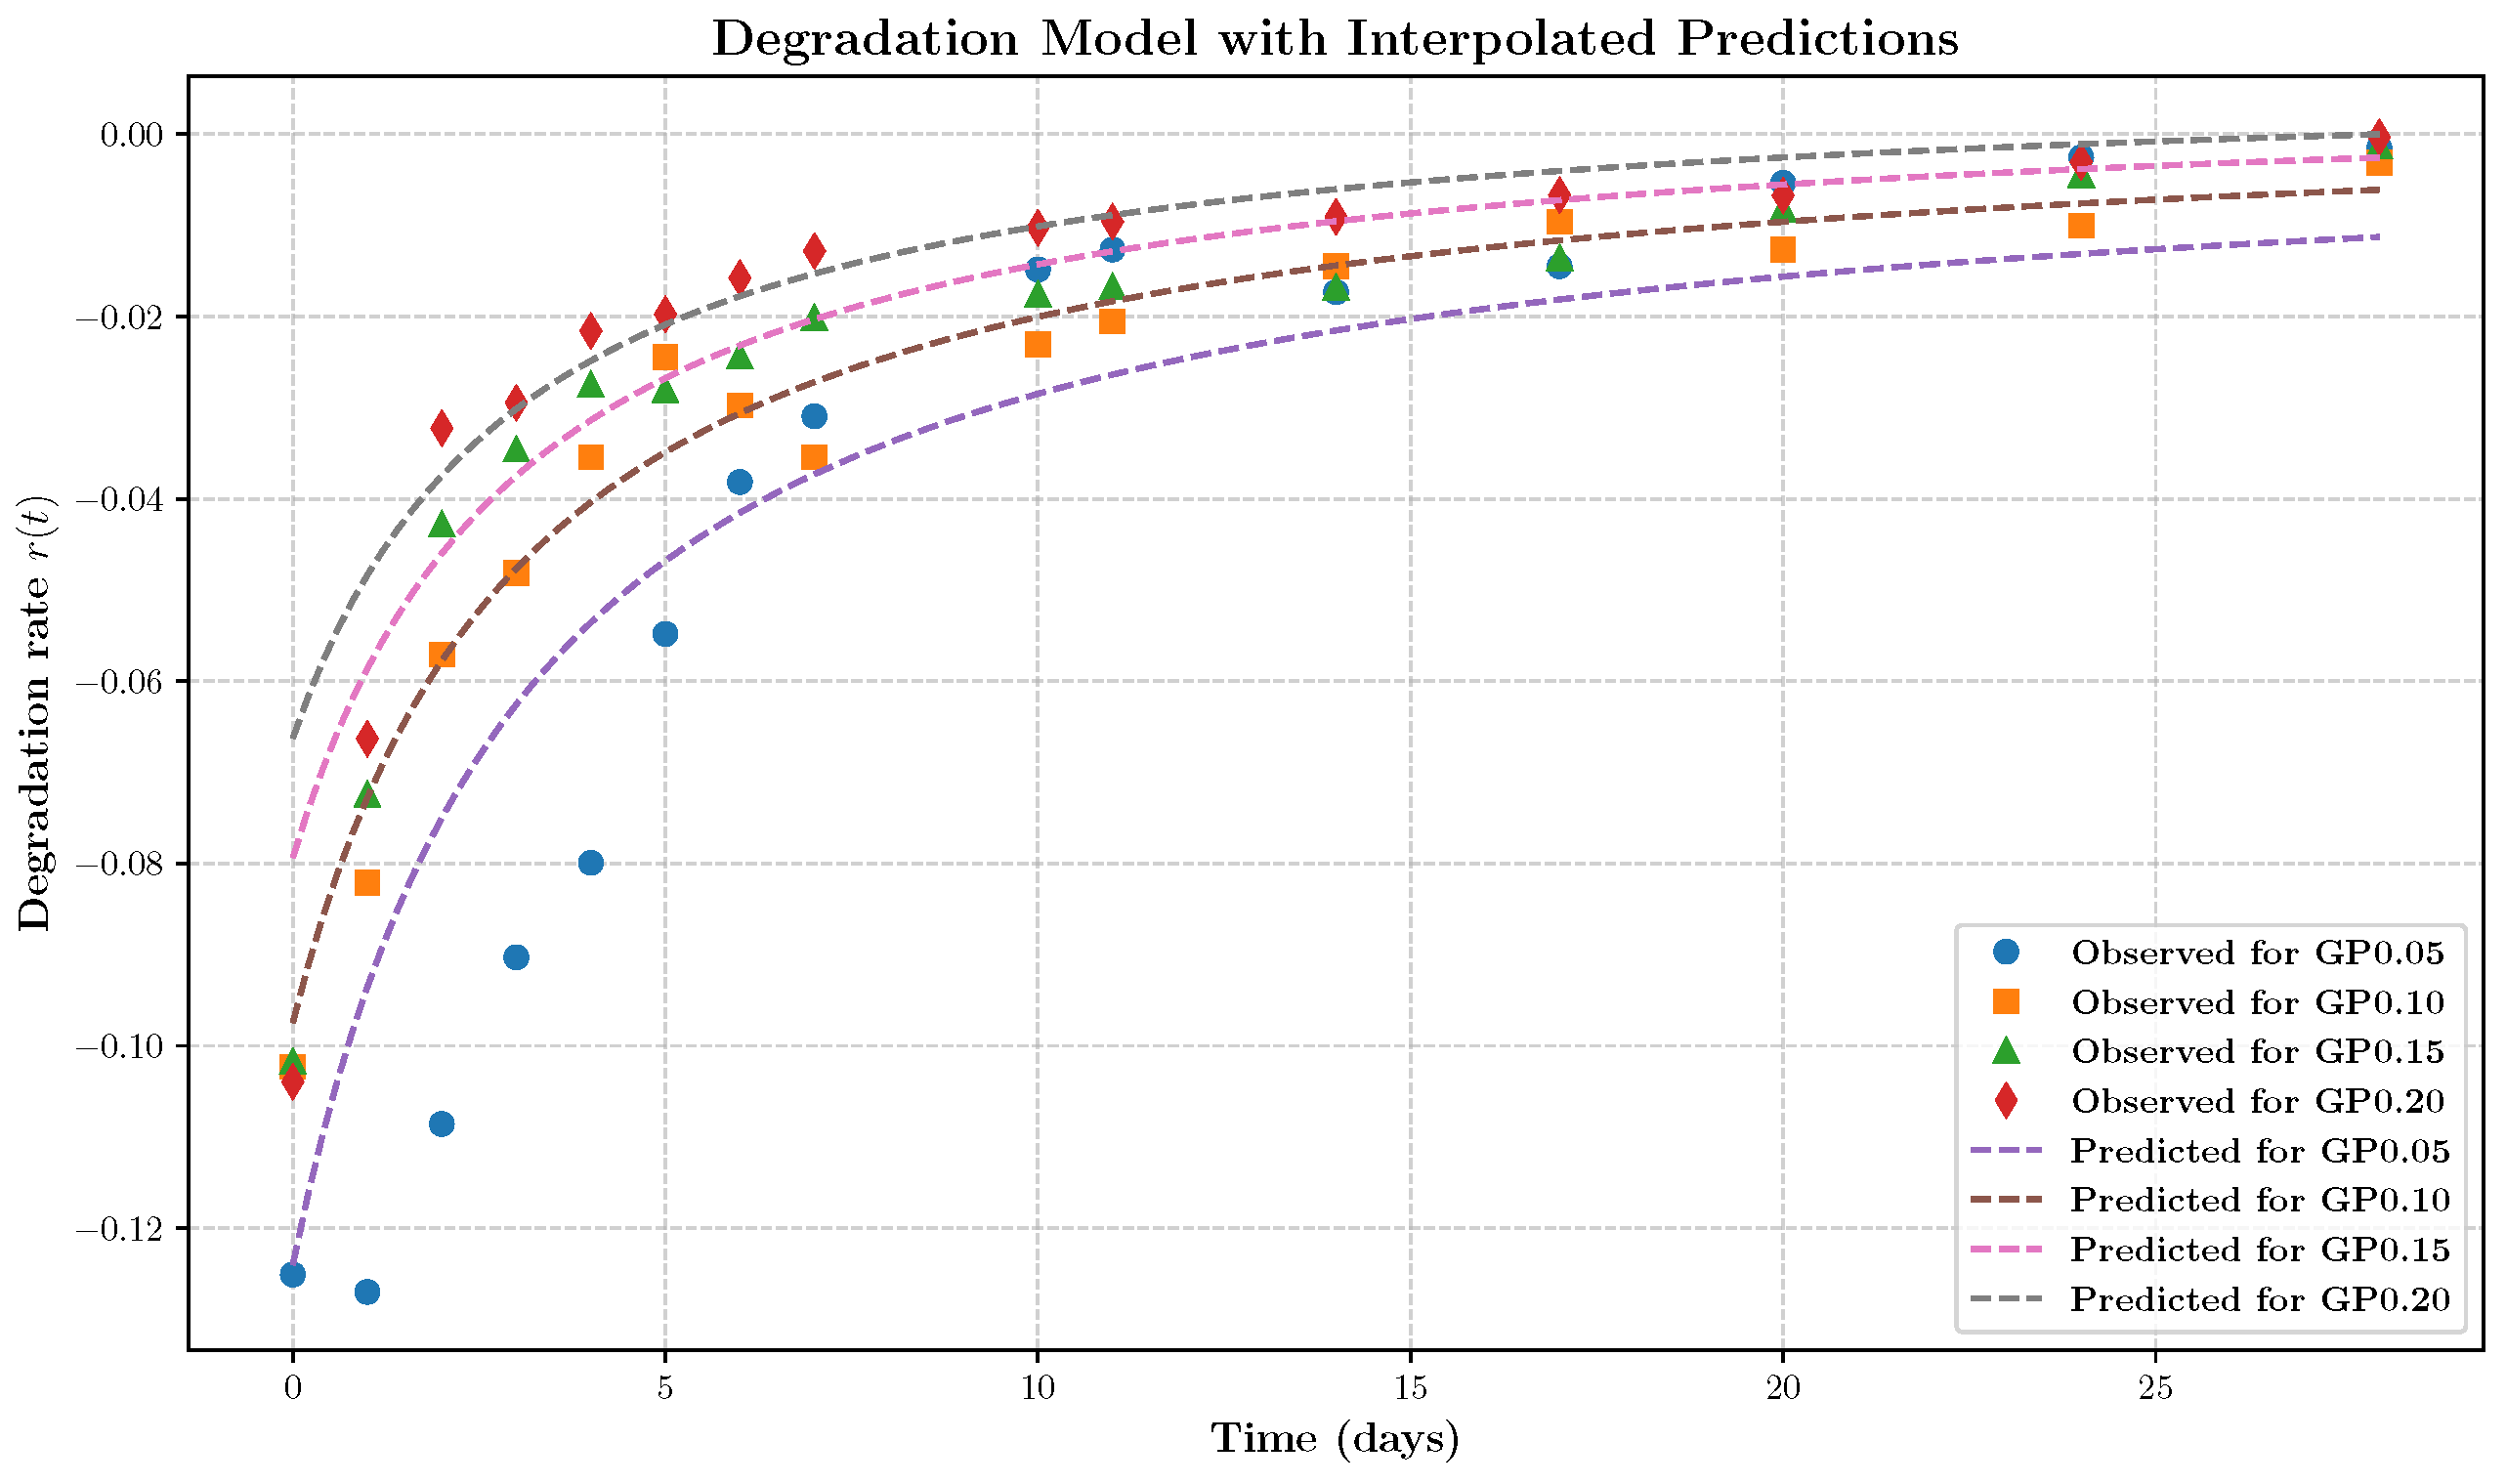
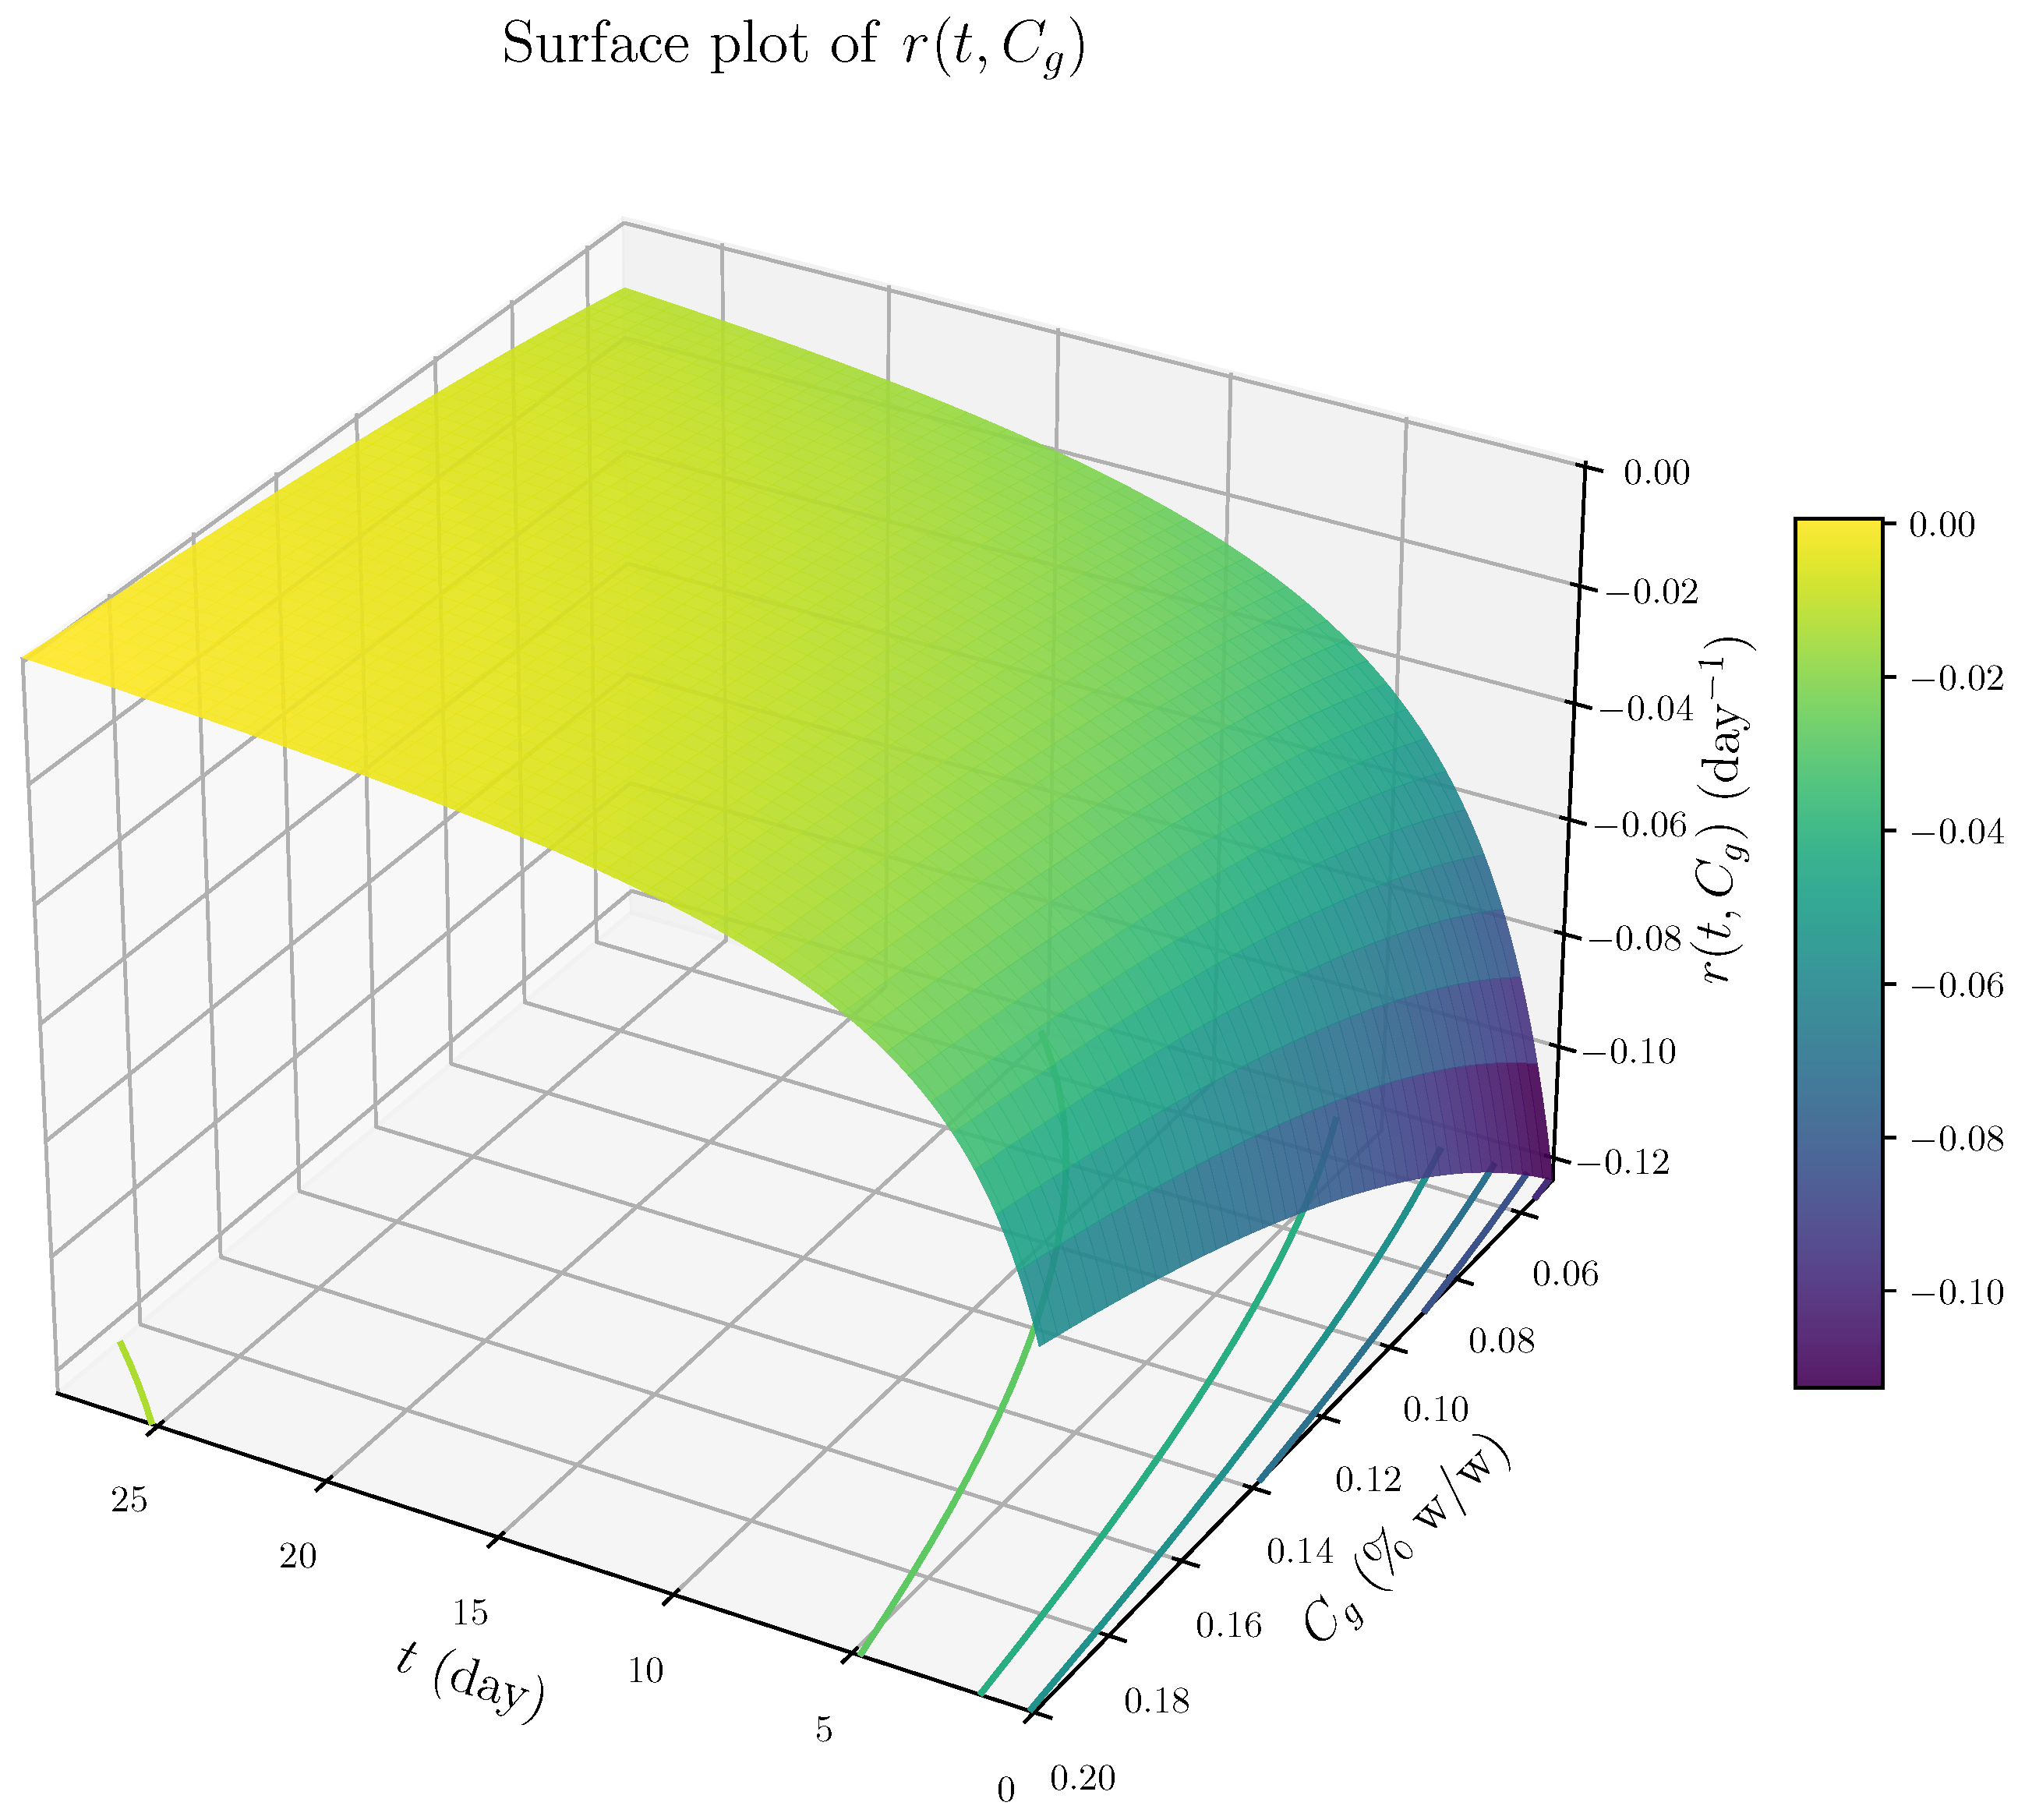
5. Application to the Degradation Kinetics of Genipin-Cross-Linked Chitosan Hydrogels

In this Section, we apply the algorithm described in Section 4 to analyze the degradation kinetics of genipin-cross-linked chitosan hydrogels. The focus of this study is to investigate how varying the concentration of the cross-linker (genipin) influences the degradation behavior. All experiments were conducted under conditions that mimic the enzymatic environment of human serum, where lysozyme—an enzyme known to catalyze the hydrolytic degradation of chitosan—is naturally present. To isolate the effect of genipin, the lysozyme concentration was held constant across all tests, ensuring that variations in degradation kinetics can be attributed solely to changes in cross-link density.
The samples were prepared following the protocol outlined in Section 2. Four different formulations were studied, each corresponding to a distinct concentration of genipin-cross-linker: (i) 0.05% w/w, referred to as GP0.05; (ii) 0.10% w/w, referred to as GP0.10; (iii) 0.15% w/w, referred to as GP0.15; and (iv) 0.20% w/w, referred to as GP0.20. This experimental design aimed to evaluate the influence of cross-link density on the degradation process, as the degree of cross-linking is known to significantly affect the structural integrity and porosity of the hydrogel network. Degradation was monitored following the protocol described in Section 2. The study spanned 28 days, with nearly daily measurements of the retained mass fraction, α ( t ) , through weighing of the samples. Each condition was replicated three times. The retained mass fraction data were averaged across replicates to minimize measurement variability.
Figure 2 presents the experimentally obtained degradation profiles, which align well with the expected trends. Specifically, matrices with a higher concentration of cross-linker exhibit greater structural and mechanical strength, which is reflected in lower degradation rates.
Next, we follow the sequence of steps outlined in Section 4. In this analysis, the response variable is the degradation rate, r ( t ) , while the input variables are the monitoring time (t), the cross-linker concentration ( C g ) expressed in %, and the retained mass fraction, α ( t ) . These inputs are collectively represented by the vector x = ( t , C g , α ) . To place all covariates on a comparable scale, we applied a normalization procedure that maps their values to a common domain. Specifically, we set the lower bound to a = 0.1 , so that each variable is rescaled to lie within the interval [ 0.1 , 1 ] . The resulting scaled inputs define the vector ξ . To reduce noise and obtain smooth estimates, we applied a Savitzky–Golay filter of order 2 and window length 5 to the scaled data. Finally, the response values r ( t ) were estimated locally from the smoothed data and used in the subsequent modeling steps.
To capture the effect of C g , we fitted a single model to the combined data from all four experiments. Because C g remains constant within each experiment, modeling all data jointly is necessary to properly identify its influence on the degradation rate.
The aggregated dataset was then analyzed using the symbolic regression (SR) tool. We configured the symbolic regressor with the following parameters: population_size = 5000, generations = 20, stopping_criteria = 1 ×  10 5 , p_crossover = 0.7, p_subtree_mutation = 0.1, p_hoist_mutation = 0.05, p_point_mutation = 0.1, parsimony_coefficient = 0.001, and const_range = ( 4 , 4 ) .
The SR tool produced the following symbolic expression: neg(div(add(neg(inv(X0)), X1), add(2.366, add(X1, X1)))). This expression was then simplified using a symbolic simplification routine (see Section 4.3), yielding the following:
r ( t ) = d α d t = 1 ξ 1 ξ 2 ξ 1 ( 2 ξ 2 + 2.366 ) ,
where ξ 1 , ξ 2 , α [ 0.1 , 1 ] . The optimal model across the population achieved an average fitness of 1.7153 with an average tree depth (i.e., a model size, d M ) of 10.75, corresponding to an average AARD per point of 2.86%. In contrast, the best individual attained a fitness of 0.5363 with a tree depth of 12.
To express the model in the original physical units, we applied the inverse of the rescaling transformations used during fitting, resulting in the following:
r ( t ) = d α d t = 1 20 3 C g 7 30 9 280 t + 0.1 40 3 C g + 1424 750 9 280 t + 0.1 ,
where t [ 0 , 28 ] is time in days, C g [ 0.05 , 0.20 ] is the genipin concentration expressed as a percentage, and α [ 0 , 1 ] represents the retained mass fraction. Equation (10), thus, defines the kinetic law governing hydrogel degradation in terms consistent with the experimental measurements.
Figure 3 presents the model prediction r ( t ) for different genipin concentrations, overlaid with the corresponding experimental observations. The model demonstrates good agreement with the data while retaining a relatively simple analytical structure, making it suitable for interpretation and further theoretical analysis.
We analyzed the fitted kinetic law in Equation (10) in the context of the representative degradation mechanisms summarized in Table 2. Several important features emerge, as follows:
1.
The rate expression is independent of the retained mass fraction α ( t ) , indicating that degradation proceeds at a rate largely unaffected by the remaining material. This behavior is characteristic of surface-limited, zero-order kinetics rather than mass-dependent bulk degradation.
2.
The term proportional to 1 / t dominates at early times, resulting in a high initial degradation rate and rapid loss of loosely bound material. As time progresses, the influence of this term diminishes, leading to a decelerating degradation rate. This behavior likely reflects the depletion of accessible reactive surface sites or time-dependent structural changes that hinder further erosion.
3.
At later times, the degradation rate stabilizes to a constant value dependent on the cross-linker concentration C g . This indicates a buffering or inhibitory effect of cross-linking, consistent with increased network stability or steric hindrance at higher genipin concentrations.
Taken together, these observations support a surface-controlled degradation mechanism characterized by an initial burst of rapid erosion followed by a slowing, cross-linking-modulated degradation rate. The observed deceleration and C g -dependent inhibition are consistent with the established role of genipin in enhancing hydrogel network integrity and resisting further degradation.
Figure 4 illustrates the predicted degradation rate across the domain of genipin concentration C g and time t, based on Equation (10).

6. Conclusions

We addressed the problem of identifying the dominant degradation mechanism in genipin-cross-linked chitosan hydrogels, a material class widely used in biomedical applications. Using experimental degradation data collected from various hydrogel formulations with differing genipin concentrations, we developed a systematic methodology based on SR to extract mechanistic insight directly from the data. Symbolic regression is a machine learning technique that searches the space of mathematical expressions to find models that best describe a dataset, without assuming a predefined functional form. Drawing from genetic programming and program synthesis, SR allows the discovery of interpretable, data-driven equations that capture the underlying system dynamics.
The proposed algorithm consists of four main steps: (i) Problem formulation, including data pre-processing, covariate scaling, and definition of atomic function bounds; (ii) Execution of SR using an appropriate implementation; (iii) Transformation of the resulting expression into symbolic form, followed by algebraic simplification and inverse rescaling; and (iv) Mechanistic interpretation through resemblance analysis, informed by known kinetic models and domain-specific knowledge.
We applied this algorithm to model the degradation kinetics of genipin-cross-linked chitosan hydrogels. The SR-based approach yielded interpretable mathematical expressions that closely fit the observed degradation profiles. By comparing the form and dynamics of these inferred laws with established kinetic models for surface-, bulk-, and gradient-controlled degradation, we concluded that degradation in these hydrogels is predominantly surface-controlled. Moreover, the analysis revealed that genipin concentration modulates the degradation rate, consistent with its role in enhancing structural integrity through increased cross-link density.
More broadly, the strength of SR lies in its ability to uncover governing equations from experimental data without relying on predefined model structures. This makes it a powerful and flexible tool for identifying degradation mechanisms in systems with unknown or complex kinetics, where traditional modeling approaches may be inadequate.
Finally, the methodology we propose is general and applicable to a broad class of systems, including both chemically and biologically mediated degradation processes. By bridging empirical data analysis with mechanistic insight, it enables the extraction of interpretable dynamic laws across diverse environments and degradation behaviors, supporting predictive modeling and rational design in biomedical and materials science applications.

Author Contributions

B.P.M.D.—conceptualization, formal analysis, methodology, and writing. M.J.M.—conceptualization and data curation. All authors have read and agreed to the published version of the manuscript.

Funding

This research received no external funding.

Data Availability Statement

The original contributions presented in this study are included in the article. Further inquiries can be directed to the corresponding author.

Conflicts of Interest

The authors declare no conflicts of interest.

References

  1. Islam, S.; Bhuiyan, M.R.; Islam, M. Chitin and chitosan: Structure, properties and applications in biomedical engineering. J. Polym. Environ. 2017, 25, 854–866. [Google Scholar] [CrossRef]
  2. Singh, G.; Chanda, A. Mechanical properties of whole-body soft human tissues: A review. Biomed. Mater. 2021, 16, 062004. [Google Scholar] [CrossRef] [PubMed]
  3. Singh, R.; Shitiz, K.; Singh, A. Chitin and chitosan: Biopolymers for wound management. Int. Wound J. 2017, 14, 1276–1289. [Google Scholar] [CrossRef] [PubMed]
  4. Prabaharan, M.; Mano, J. Chitosan-based particles as controlled drug delivery systems. Drug Deliv. 2004, 12, 41–57. [Google Scholar] [CrossRef]
  5. Kim, I.Y.; Seo, S.J.; Moon, H.S.; Yoo, M.K.; Park, I.Y.; Kim, B.C.; Cho, C.S. Chitosan and its derivatives for tissue engineering applications. Biotechnol. Adv. 2008, 26, 1–21. [Google Scholar] [CrossRef]
  6. Lin, X.; Zhao, X.; Xu, C.; Wang, L.; Xia, Y. Progress in the mechanical enhancement of hydrogels: Fabrication strategies and underlying mechanisms. J. Polym. Sci. 2022, 60, 2525–2542. [Google Scholar] [CrossRef]
  7. Yammine, P.; El Safadi, A.; Kassab, R.; El-Nakat, H.; Obeid, P.J.; Nasr, Z.; Tannous, T.; Sari-Chmayssem, N.; Mansour, A.; Chmayssem, A. Types of crosslinkers and their applications in biomaterials and biomembranes. Chemistry 2025, 7, 61. [Google Scholar] [CrossRef]
  8. Esparza-Flores, E.E.; Siquiera, L.B.; Cardoso, F.D.; Costa, T.H.; Benvenutti, E.V.; Medina-Ramírez, I.E.; Perullini, M.; Santagapita, P.R.; Rodrigues, R.C.; Hertz, P.F. Chitosan with modified porosity and crosslinked with genipin: A dynamic system structurally characterized. Food Hydrocoll. 2023, 144, 109034. [Google Scholar] [CrossRef]
  9. Zielińska, A.; Karczewski, J.; Eder, P.; Kolanowski, T.; Szalata, M.; Wielgus, K.; Szalata, M.; Kim, D.; Shin, S.R.; Słomski, R.; et al. Scaffolds for drug delivery and tissue engineering: The role of genetics. J. Control. Release 2023, 359, 207–223. [Google Scholar] [CrossRef]
  10. Ding, R.; Zhu, Y.; Jing, L.; Chen, S.; Lu, J.; Zhang, X. Sulfhydryl functionalized chitosan-covalent organic framework composites for highly efficient and selective recovery of gold from complex liquids. Int. J. Biol. Macromol. 2024, 282, 137037. [Google Scholar] [CrossRef]
  11. Dang, Q.F.; Yan, J.Q.; Li, J.J.; Cheng, X.J.; Liu, C.S.; Chen, X.G. Controlled gelation temperature, pore diameter and degradation of a highly porous chitosan-based hydrogel. Carbohydr. Polym. 2011, 83, 171–178. [Google Scholar] [CrossRef]
  12. Jennings, J. 7—Controlling chitosan degradation properties in vitro and in vivo. In Chitosan Based Biomaterials Volume 1; Jennings, J.A., Bumgardner, J.D., Eds.; Woodhead Publishing: Cambridge, UK, 2017; pp. 159–182. [Google Scholar] [CrossRef]
  13. Ganji, F.; Abdekhodaie, M.; Ramazani, S.A.A. Gelation time and degradation rate of chitosan-based injectable hydrogel. J. Sol-Gel Sci. Technol. 2007, 42, 47–53. [Google Scholar] [CrossRef]
  14. Eivazzadeh-Keihan, R.; Noruzi, E.B.; Mehrban, S.F.; Aliabadi, H.A.M.; Karimi, M.; Mohammadi, A.; Maleki, A.; Mahdavi, M.; Larijani, B.; Shalan, A.E. The latest advances in biomedical applications of chitosan hydrogel as a powerful natural structure with eye-catching biological properties. J. Mater. Sci. 2022, 57, 3855–3891. [Google Scholar] [CrossRef]
  15. Xu, C.; Sun, N.; Li, H.; Han, X.; Zhang, A.; Sun, P. Stimuli-responsive vesicles and hydrogels formed by a single-tailed dynamic covalent surfactant in aqueous solutions. Molecules 2024, 29, 4984. [Google Scholar] [CrossRef]
  16. Berger, J.; Reist, M.; Mayer, J.M.; Felt, O.; Gurny, R. Structure and interactions in chitosan hydrogels formed by complexation or aggregation for biomedical applications. Eur. J. Pharm. Biopharm. 2004, 57, 35–52. [Google Scholar] [CrossRef]
  17. Dash, M.; Chiellini, F.; Ottenbrite, R.; Chiellini, E. Chitosan—A versatile semi-synthetic polymer in biomedical applications. Prog. Polym. Sci. 2011, 36, 981–1014. [Google Scholar] [CrossRef]
  18. Tanioka, S.; Matsui, Y.; Irie, T.; Tanigawa, T.; Tanaka, Y.; Shibata, H.; Sawa, Y.; Kono, Y. Oxidative depolymerization of chitosan by hydroxyl radical. Biosci. Biotechnol. Biochem. 1996, 60, 2001–2004. [Google Scholar] [CrossRef]
  19. Samani, S.; Bonakdar, S.; Farzin, A.; Hadjati, J.; Azami, M. A facile way to synthesize a photocrosslinkable methacrylated chitosan hydrogel for biomedical applications. Int. J. Polym. Mater. Polym. Biomater. 2021, 70, 730–741. [Google Scholar] [CrossRef]
  20. Kocak, F.Z.; Yar, M.; Rehman, I.U. In vitro degradation, swelling, and bioactivity performances of in situ forming injectable chitosan-matrixed hydrogels for bone regeneration and drug delivery. Biotechnol. Bioeng. 2024, 121, 2767–2779. [Google Scholar] [CrossRef]
  21. Li, J.; Liu, P. One-pot fabrication of pH/reduction dual-stimuli responsive chitosan-based supramolecular nanogels for leakage-free tumor-specific DOX delivery with enhanced anti-cancer efficacy. Carbohydr. Polym. 2018, 201, 583–590. [Google Scholar] [CrossRef]
  22. Xia, M.; Pan, N.; Zhang, C.; Zhang, C.; Fan, W.; Xia, Y.; Wang, Z.; Sui, K. Self-powered multifunction ionic skins based on gradient polyelectrolyte hydrogels. ACS Nano 2022, 16, 4714–4725. [Google Scholar] [CrossRef] [PubMed]
  23. Lu, P.; Ruan, D.; Huang, M.; Tian, M.; Zhu, K.; Gan, Z.; Xiao, Z. Harnessing the potential of hydrogels for advanced therapeutic applications: Current achievements and future directions. Signal Transduct. Target. Ther. 2024, 9, 166. [Google Scholar] [CrossRef] [PubMed]
  24. Duarte, A.R.C.; Correlo, V.M.; Oliveira, J.M.; Reis, R.L. Recent Developments on Chitosan Applications in Regenerative Medicine. In Biomaterials from Nature for Advanced Devices and Therapies; John Wiley & Sons, Ltd.: Hoboken, NJ, USA, 2016; Chapter 14; pp. 221–243. [Google Scholar] [CrossRef]
  25. Kean, T.; Thanou, M. Biodegradation, biodistribution and toxicity of chitosan. Adv. Drug Deliv. Rev. 2010, 62, 3–11. [Google Scholar] [CrossRef] [PubMed]
  26. Koza, J.R. Genetic programming as a means for programming computers by natural selection. Stat. Comput. 1994, 4, 87–112. [Google Scholar] [CrossRef]
  27. Banzhaf, W.; Nordin, P.; Keller, R.E.; Francone, F.D. Genetic programming: An Introduction: On the Automatic Evolution of Computer Programs and Its Applications; Morgan Kaufmann Publishers Inc.: San Francisco, CA, USA, 1998. [Google Scholar]
  28. Schmidt, M.; Lipson, H. Distilling free-form natural laws from experimental data. Science 2009, 324, 81–85. [Google Scholar] [CrossRef]
  29. Narayanan, H.; Cruz Bournazou, M.N.; Guillén-Gosálbez, G.; Butté, A. Functional-Hybrid modeling through automated adaptive symbolic regression for interpretable mathematical expressions. Chem. Eng. J. 2022, 430, 133032. [Google Scholar] [CrossRef]
  30. Forster, T.; Vázquez, D.; Müller, C.; Guillén-Gosálbez, G. Machine learning uncovers analytical kinetic models of bioprocesses. Chem. Eng. Sci. 2024, 300, 120606. [Google Scholar] [CrossRef]
  31. Rogers, A.W.; Lane, A.; Mendoza, C.; Watson, S.; Kowalski, A.; Martin, P.; Zhang, D. Integrating knowledge-guided symbolic regression and model-based design of experiments to automate process flow diagram development. Chem. Eng. Sci. 2024, 300, 120580. [Google Scholar] [CrossRef]
  32. Papastamatiou, K.; Sofos, F.; Karakasidis, T.E. Machine learning symbolic equations for diffusion with physics-based descriptions. Aip Adv. 2022, 12, 025004. [Google Scholar] [CrossRef]
  33. Servia, M.A.D.; del Rio Chanona, E.A. Interpretable Machine Learning for Kinetic Rate Model Discovery. In Machine Learning and Hybrid Modelling for Reaction Engineering: Theory and Applications; Royal Society of Chemistry: London, UK, 2023; pp. 133–158. [Google Scholar] [CrossRef]
  34. Bragone, F.; Morozovska, K.; Laneryd, T.; Shukla, K.; Markidis, S. Discovering partially known ordinary differential equations: A case study on the chemical kinetics of cellulose degradation. arXiv 2025, arXiv:2504.03484. [Google Scholar] [CrossRef]
  35. Ravi Kumar, M.; Muzzarelli, R.; Muzzarelli, C.; Sashiwa, H.; Domb, A. Chitosan chemistry and pharmaceutical perspectives. Chem. Rev. 2004, 104, 6017–6084. [Google Scholar] [CrossRef] [PubMed]
  36. Alexeev, V.; Evmenenko, G. Salt-free chitosan solutions: Thermodynamics, structure and intramolecular force balance. Polym. Sci. Ser. A 1999, 41, 966–974. [Google Scholar]
  37. Singha, I.; Basu, A. Chitosan based injectable hydrogels for smart drug delivery applications. Sens. Int. 2022, 3, 100168. [Google Scholar] [CrossRef]
  38. Kildeeva, N.; Chalykh, A.; Belokon, M.; Petrova, T.; Matveev, V.; Svidchenko, E.; Surin, N.; Sazhnev, N. Influence of genipin crosslinking on the properties of chitosan-based films. Polymers 2020, 12, 1086. [Google Scholar] [CrossRef]
  39. Yu, Y.; Xu, S.; Li, S.; Pan, H. Genipin-cross-linked hydrogels based on biomaterials for drug delivery: A review. Biomater. Sci. 2021, 9, 1583–1597. [Google Scholar] [CrossRef]
  40. Chenite, A.; Buschmann, M.; Wang, D.; Chaput, C.; Kandani, N. Rheological characterisation of thermogelling chitosan/glycerol-phosphate solutions. Carbohydr. Polym. 2001, 46, 39–47. [Google Scholar] [CrossRef]
  41. Moura, M.J.; Figueiredo, M.M.; Gil, M.H. Rheological study of genipin cross-linked chitosan hydrogels. Biomacromolecules 2007, 8, 3823–3829. [Google Scholar] [CrossRef]
  42. Han, H.; Nam, D.; Seo, D.; Kim, T.; Shin, B.; Choi, H. Preparation and biodegradation of thermosensitive chitosan hydrogel as a function of pH and temperature. Macromol. Res. 2004, 12, 507–511. [Google Scholar] [CrossRef]
  43. Balakrishnan, B.; Jayakrishnan, A. Self-cross-linking biopolymers as injectable in situ forming biodegradable scaffolds. Biomaterials 2005, 26, 3941–3951. [Google Scholar] [CrossRef]
  44. Brouwer, J.; van Leeuwen-Herberts, T.; Otting-van de Ruit, M. Determination of lysozyme in serum, urine, cerebrospinal fluid and feces by enzyme immunoassay. Clin. Chim. Acta 1984, 142, 21–30. [Google Scholar] [CrossRef]
  45. Kronberger, G.; Burlacu, B.; Kommenda, M.; Winkler, S.M.; Affenzeller, M. Symbolic Regression; CRC Press: Boca Raton, FL, USA, 2024. [Google Scholar]
  46. Shmuel, A.; Glickman, O.; Lazebnik, T. Symbolic regression as a feature engineering method for machine and deep learning regression tasks. Mach. Learn. Sci. Technol. 2024, 5, 025065. [Google Scholar] [CrossRef]
  47. Zhong, J.; Feng, L.; Cai, W.; Ong, Y.S. Multifactorial genetic programming for symbolic regression problems. IEEE Trans. Syst. Man Cybern. Syst. 2018, 50, 4492–4505. [Google Scholar] [CrossRef]
  48. Virgolin, M.; Alderliesten, T.; Witteveen, C.; Bosman, P.A. Improving model-based genetic programming for symbolic regression of small expressions. Evol. Comput. 2021, 29, 211–237. [Google Scholar] [CrossRef] [PubMed]
  49. Murdoch, W.J.; Singh, C.; Kumbier, K.; Abbasi-Asl, R.; Yu, B. Definitions, methods, and applications in interpretable machine learning. Proc. Natl. Acad. Sci. USA 2019, 116, 22071–22080. [Google Scholar] [CrossRef]
  50. Makke, N.; Chawla, S. Interpretable scientific discovery with symbolic regression: A review. Artif. Intell. Rev. 2024, 57, 2. [Google Scholar] [CrossRef]
  51. Keren, L.S.; Liberzon, A.; Lazebnik, T. A computational framework for physics-informed symbolic regression with straightforward integration of domain knowledge. Sci. Rep. 2023, 13, 1249. [Google Scholar] [CrossRef]
  52. La Cava, W.; Orzechowski, P.; Burlacu, B.; de França, F.O.; Virgolin, M.; Jin, Y.; Kommenda, M.; Moore, J.H. Contemporary symbolic regression methods and their relative performance. arXiv 2021, arXiv:2107.14351. [Google Scholar] [CrossRef]
  53. Radwan, Y.A.; Kronberger, G.; Winkler, S. A comparison of recent algorithms for symbolic regression to genetic programming. arXiv 2024, arXiv:2406.03585. [Google Scholar] [CrossRef]
  54. Cranmer, M. Interpretable machine learning for science with PySR and SymbolicRegression.jl. arXiv 2023, arXiv:2305.01582. [Google Scholar] [CrossRef]
  55. Stephens, T. gplearn: Genetic Programming in Python, with a Scikit-Learn Inspired API. 2022. Available online: https://github.com/trevorstephens/gplearn (accessed on 26 March 2025).
  56. Fortin, F.A.; De Rainville, F.M.; Gardner, M.A.; Parizeau, M.; Gagné, C. DEAP: Evolutionary algorithms made easy. J. Mach. Learn. Res. 2012, 13, 2171–2175. [Google Scholar]
  57. Olson, R.S.; Bartley, N.; Urbanowicz, R.J.; Moore, J.H. Evaluation of a Tree-based Pipeline Optimization Tool for Automating Data Science. In Proceedings of the Genetic and Evolutionary Computation Conference 2016, GECCO’16, New York, NY, USA, 20–24 July 2016; pp. 485–492. [Google Scholar] [CrossRef]
  58. Meurer, A.; Smith, C.P.; Paprocki, M.; Čertík, O.; Kirpichev, S.B.; Rocklin, M.; Kumar, A.; Ivanov, S.; Moore, J.K.; Singh, S.; et al. SymPy: Symbolic computing in Python. PeerJ Comput. Sci. 2017, 3, e103. [Google Scholar] [CrossRef]
  59. Savitzky, A.; Golay, M.J.E. Smoothing and differentiation of data by simplified least squares procedures. Anal. Chem. 1964, 36, 1627–1639. [Google Scholar] [CrossRef]
  60. Neumann, P.; Cao, L.; Russo, D.; Vassiliadis, V.S.; Lapkin, A.A. A new formulation for symbolic regression to identify physico-chemical laws from experimental data. Chem. Eng. J. 2020, 387, 123412. [Google Scholar] [CrossRef]
  61. Abooali, D.; Khamehchi, E. New predictive method for estimation of natural gas hydrate formation temperature using genetic programming. Neural Comput. Appl. 2019, 31, 2485–2494. [Google Scholar] [CrossRef]
  62. Chen, Q.; Zhang, M.; Xue, B. Feature selection to improve generalization of genetic programming for high-dimensional symbolic regression. IEEE Trans. Evol. Comput. 2017, 21, 792–806. [Google Scholar] [CrossRef]
  63. Sikorski, D.; Gzyra-Jagieła, K.; Draczyński, Z. The kinetics of chitosan degradation in organic acid solutions. Mar. Drugs 2021, 19, 236. [Google Scholar] [CrossRef]
  64. Chang, K.L.B.; Tai, M.C.; Cheng, F.H. Kinetics and products of the degradation of chitosan by hydrogen peroxide. J. Agric. Food Chem. 2001, 49, 4845–4851. [Google Scholar] [CrossRef]
Figure 1. Flowchart of the proposed algorithm.
Processes 13 01981 g001
Figure 2. Degradation profiles of genipin-cross-linked chitosan hydrogels at varying genipin concentrations. Error bars indicate the 95% confidence interval, calculated as ± 1.96 · s d / n , where s d is the sample standard deviation and n = 3 .
Processes 13 01981 g002
Figure 3. Degradation rate of genipin-cross-linked chitosan hydrogels at different genipin concentrations. Experimental data points and model predictions from Equation (10) are shown.
Processes 13 01981 g003
Figure 4. Prediction of the degradation rate of genipin-cross-linked chitosan hydrogels using Equation (10). Contour lines reflect variations in the degradation rate across the surface.
Processes 13 01981 g004
Table 1. Set of atomic functions and operators used to construct candidate terms for the kinetic rate expression.
Function/OperatorNotationArity
Addition x + y 2
Subtraction x y 2
Multiplication x × y 2
Division x ÷ y 2
Exponential exp ( x ) 1
Logarithm log ( x ) 1
Power x y or power ( x , y ) 2
Square root x 1
Negation x 1
Reciprocal (inverse) 1 / x or inv ( x ) 1
Table 2. Representative kinetic laws for chitosan hydrogel degradation.
Degradation TypeRate LawDescription
Surface degradation (zero-order) d α d t = k surf ( t ) Degradation occurs primarily at the surface at a constant rate, independent of the remaining mass.
Surface degradation (first-order) d α d t = k surf ( t ) α Surface-mediated degradation where the rate is proportional to the remaining mass fraction [63].
Bulk degradation (first-order) d α d t = k bulk ( t ) α Homogeneous degradation throughout the hydrogel, described by first-order kinetics [63].
Bulk degradation (power-law) d α d t = k bulk ( t ) α n Non-linear degradation characterized by a power-law relationship with respect to the remaining mass [64].
Gradient-dependent degradation d α d t = k grad ( t ) α ( 1 α ) Diffusion-limited degradation where the rate decreases as the remaining mass approaches a saturation threshold.
Note:  α denotes the fraction of mass remaining.
Disclaimer/Publisher’s Note: The statements, opinions and data contained in all publications are solely those of the individual author(s) and contributor(s) and not of MDPI and/or the editor(s). MDPI and/or the editor(s) disclaim responsibility for any injury to people or property resulting from any ideas, methods, instructions or products referred to in the content.

