1. Introduction
Bearings are indispensable components in rotating machinery, and their operational condition directly impacts the entire industrial production process. Consequently, numerous scholars have conducted extensive and in-depth research on monitoring bearing operational status, early fault detection, and timely intervention. A significant portion of this research has focused on addressing challenges related to bearings operating in harsh environments with substantial background noise, yielding considerable achievements. However, research specifically targeting bearings in aerospace engines remains relatively limited. This scarcity is primarily attributed to the difficulties in data acquisition within the aerospace sector: the abundance of normal condition samples compared to the limited availability of typical fault samples. These constraints impose higher requirements on fault diagnosis models and frameworks. Therefore, developing high-accuracy fault diagnosis approaches for limited fault samples has become increasingly urgent [
1,
2,
3,
4,
5,
6].
Current research in mechanical vibration-based fault diagnosis can be broadly categorized into three approaches: signal processing, model-based methods, and data-driven techniques [
7,
8,
9,
10]. Among these, signal processing primarily focuses on eliminating complex environmental background noise and extracting effective feature information from raw signals. Representative methods include Fast Fourier Transform (FFT), Wavelet Transform (WT), Hilbert–Huang Transform (HHT), Empirical Mode Decomposition (EMD), Variational Mode Decomposition (VMD), and their various derivative algorithms [
11,
12,
13,
14,
15,
16]. These techniques have demonstrated remarkable effectiveness in identifying specific frequency fault characteristics, processing non-linear and non-stationary signals, and extracting instantaneous frequency and amplitude information. However, these methods share significant limitations in practical applications. They struggle to correlate fault features with fault sources and mechanisms independently, requiring extensive domain expertise for proper interpretation of results. Additionally, their effectiveness heavily depends on predefined feature extraction parameters that may not be optimal for diverse fault conditions, and they often fail to capture subtle fault signatures during early degradation stages. Furthermore, their performance degrades significantly in the presence of varying operational conditions and background noise, limiting their reliability in real-world industrial environments. This necessitates the integration of domain-specific knowledge for comprehensive assessment. In practical terms, human intervention becomes essential for the final diagnostic decision-making, resulting in time-consuming diagnostic processes with reduced efficiency. Model-based methods leverage physical or mathematical approaches to construct fault models, comparing and analyzing the resulting normal and fault signals to identify differentiating characteristics that serve as the theoretical foundation for fault diagnosis. Representative techniques in this category include Finite Element Simulation Analysis, Parameter Estimation methods, and related approaches. These methods offer distinct advantages as they do not rely on actual operational data, instead deriving precise mathematical models through theoretical reasoning while maintaining excellent interpretability. The results can be directly correlated with specific physical components, providing diagnostics with clear physical significance. However, model-based approaches face significant challenges in accurate modeling, particularly when simulating complex mechanical systems under diverse environmental noise conditions. The efficacy of these methods is heavily dependent on extremely detailed prior system knowledge, making them computationally intensive and often impractical for real-time diagnostic applications in sophisticated industrial environments. Data-driven approaches leverage machine learning and artificial intelligence techniques to learn fault patterns from large volumes of historical data, enabling automated diagnosis processes. Representative methodologies include Support Vector Machines (SVMs), Convolutional Neural Networks (CNNs), Long Short-Term Memory (LSTM) networks, and other advanced algorithms [
17,
18,
19,
20,
21]. Recent hybrid frameworks combining signal processing with machine learning have demonstrated promising results across different mechanical systems. For instance, Yuan et al. [
22] developed a WSET-CNN-BKA-LSSVM approach for gear fault diagnosis, showing the effectiveness of integrating wavelet synchroextracting transform with deep learning and optimized support vector machines. Such hybrid methodologies highlight the potential of combining time–frequency analysis with advanced classification techniques. Although their major limitation is the dependency on large quantities of high-quality fault samples, the primary advantage of these methods lies in their powerful learning capabilities, which facilitate automatic fault analysis and classification. In the context of rapidly advancing artificial intelligence technologies, data-driven approaches are experiencing increasingly widespread application across industrial sectors. However, data-driven approaches face several critical challenges in practical industrial applications. Beyond their well-known dependency on large quantities of high-quality fault samples, which are often unavailable in real scenarios, these methods are susceptible to overfitting when trained with limited data, leading to poor generalization to unseen fault conditions. Moreover, they lack interpretability in decision-making processes, making it difficult to understand the physical mechanisms underlying fault detection. Their sensitivity to variations in operating conditions and environmental factors that differ from training scenarios further compounds these challenges, while computational complexity may limit real-time implementation in resource-constrained systems. Nevertheless, strategically combining them with other diagnostic methods in collaborative frameworks can significantly reduce sample requirements while achieving superior diagnostic accuracy.
To enhance the adaptability of data-driven methods to limited samples, researchers have conducted extensive studies on dataset expansion. These efforts primarily focus on transfer learning, meta-learning, data augmentation, ensemble learning, and pseudo-labeling approaches [
23,
24,
25,
26,
27,
28,
29]. Transfer learning leverages large datasets from related domains, reducing the demand for aero-engine bearing samples. However, the fundamental differences between aero-engine bearings and conventional bearings make feature mapping challenging. Meta-learning can quickly adapt to new fault types with few samples and identify previously unseen faults, but its high computational cost makes it impractical for real-time fault diagnosis. Data augmentation, a commonly used technique for small sample processing, effectively expands training datasets and improves model robustness. Nevertheless, it struggles to generate high-quality samples, often leading to significant randomness in fault classification. Ensemble learning also works well for small samples but requires substantial computational and storage resources, while ensuring diversity remains difficult. Pseudo-labeling predicts labels for unlabeled data using an initial model and incorporates high-confidence predictions into the training set, expanding the effective training data. Compared to traditional few-shot learning methods, pseudo-labeling offers advantages in implementation simplicity, computational efficiency, and independence from domain similarity assumptions. However, traditional pseudo-labeling approaches face challenges in bearing fault diagnosis, with the most critical limitation being insufficient feature extraction capabilities.
To overcome the limitations of existing methods for aero-engine bearing fault diagnosis under data scarcity conditions, particularly the challenge of insufficient feature extraction in traditional pseudo-labeling approaches, this paper proposes a novel hybrid framework. This framework integrates Wavelet Synchroextracting Transform (WSET) [
30], CNNs, pseudo-labeling, and Least Squares Support Vector Machine (LSSVM) [
31,
32,
33] optimized by the osprey optimization algorithm (OOA) [
34]. The framework comprises four synergistic components. First, WSET transforms raw vibration signals into time–frequency images, effectively capturing the non-linear and non-stationary characteristics essential for fault identification. Second, a CNN model trained on limited labeled samples learns hierarchical feature representations from these time–frequency images. Third, the trained CNN generates high-confidence pseudo-labels for unlabeled samples, expanding the training dataset. Finally, OOA optimizes the two key parameters of LSSVM to classify and diagnose faults with enhanced accuracy and reliability. This integrated approach strategically addresses the small sample challenge in aero-engine bearing fault diagnosis while maintaining high diagnostic accuracy.
The main contributions of this paper are as follows:
- (1)
An innovative framework that integrates WSET with a CNN is proposed. By leveraging WSET’s superior time–frequency resolution, this approach effectively captures the nonlinear and non-stationary characteristics of bearing vibration signals, providing the CNN with enhanced feature representations.
- (2)
The application of the OOA to automatically optimize LSSVM kernel parameters addresses the overfitting issues common in traditional parameter selection methods under small sample conditions, significantly improving classification accuracy and model stability.
- (3)
A multi-stage fusion framework combining signal processing (WSET), deep learning (CNN), semi-supervised learning (pseudo-labeling), and optimization algorithms (OOA-LSSVM) is developed. This integrated approach maximizes the advantages of each method while overcoming the limitations of single-method approaches.
- (4)
Extensive validation on both laboratory bearing test benches and real aero-engine bearing datasets demonstrates the exceptional diagnostic performance of the proposed framework. The method achieves high accuracy even with extremely limited samples, substantially outperforming six existing fault diagnosis methods.
The remainder of this paper is organized as follows:
Section 2 provides a detailed description of the feature extraction method combining WSET with a CNN, including the mathematical principles of WSET, CNN network design for bearing fault detection, confidence-based pseudo-labeling mechanism, and their synergistic integration framework.
Section 3 elaborates on the LSSVM classification framework optimized by the OOA, focusing on the theoretical foundations of LSSVM, the optimization mechanism of the OOA, and their application in fault classification.
Section 4 presents the complete WSET-CNN-OOA-LSSVM fusion framework and explains the collaborative working mechanism of each component through detailed algorithmic procedures.
Section 5 validates the proposed method using bearing test bench data, including repeated test verification, ablation studies, and comparative analysis.
Section 6 further verifies the effectiveness of the proposed method using real aero-engine bearing test data and provides a detailed comparison with eight different fault diagnosis methods.
Section 7 discusses the research implications and practical considerations of the proposed framework. Finally,
Section 8 summarizes the main contributions and presents the conclusions drawn from this research.
2. WSET-CNN for Feature Extraction on Limited Samples
This section mainly introduces an integrated feature extraction method that uses WSET and CNNs to extract and distinguish features from limited aero-engine bearing samples.
2.1. WSET
The WSET represents a significant advancement in time–frequency analysis for non-stationary signals. Unlike traditional time–frequency methods constrained by the Heisenberg uncertainty principle [
35], WSET enhances signal resolution by selectively extracting energy distributions along instantaneous frequency trajectories.
The mathematical foundation of WSET begins with the continuous wavelet transform (CWT) [
36], defined for a signal
as:
where
t is the translation parameter,
a is the scale parameter, and
denotes the complex conjugate of the mother wavelet
. Alternatively, this can be expressed in the Fourier domain as:
where
denotes the Fourier transform of
and
is the Fourier transform of
.
For non-stationary bearing fault signals, the instantaneous frequency (IF)
can be computed as follows:
The core innovation of WSET lies in its extraction mechanism. For multi-component signals, WSET extracts the wavelet transform coefficients only at scales corresponding to the instantaneous frequency. Specifically, if
is a multi-component signal expressed as:
where
represents the instantaneous amplitude and
the instantaneous phase, the WSET can be formulated as:
where
, with
being the center frequency of the wavelet and
the instantaneous frequency. The term
serves as a normalization factor that improves the energy concentration.
For well-separated multi-component signals that satisfy the condition
(where
is the frequency support of the wavelet), the WSET can be approximated as:
where
and
represents the instantaneous frequency of each component.
This extraction approach significantly enhances time–frequency resolution by eliminating the smearing effect present in traditional methods, resulting in sharper representation of transient fault features. The Dirac delta function
in the WSET formulation can be practically implemented as follows:
This implementation effectively extracts only the wavelet coefficients at scales corresponding to the instantaneous frequency, reducing spectral redundancy and enhancing feature concentration.
A key advantage of WSET is that it allows for the reconstruction of individual signal components through the following:
The WSET implementation incorporates inherent low-pass filtering characteristics through its frequency domain constraints. During the synchroextracting process, frequency components exceeding the Nyquist frequency (N/2) are constrained to prevent aliasing effects, effectively implementing a low-pass filtering mechanism that ensures signal integrity within the valid frequency range.
2.2. CNN for Bearing Fault Feature Learning
After obtaining the time–frequency images through WSET, we develop a specialized CNN architecture designed for small-sample aero-engine bearing fault diagnosis. Our CNN model focuses on efficient feature extraction while maintaining robust performance with limited training data.
The CNN architecture consists of a compact yet powerful structure with two key convolutional blocks. The first block employs convolutional filters with 16 channels to capture local fault patterns, followed by batch normalization and ReLU activation to enhance training stability. A max pooling reduces dimensionality while preserving essential information. The second block implements larger filters with 32 channels to capture broader fault characteristics, with an innovative asymmetric pooling layer that specifically preserves horizontal time–frequency patterns critical for bearing fault identification. For classification, we employ a multi-layer structure with progressively decreasing neuron counts (64-32-C) to form a discriminative decision boundary. The classification stage incorporates a strategic dropout scheme with decreasing rates (0.2, 0.1, 0.1) to prevent overfitting while preserving critical fault features, which is particularly important for small-sample learning.
Unlike conventional CNN architectures that require extensive datasets, our model incorporates several innovations specifically for small-sample aero-engine bearing diagnosis:
- (1)
Asymmetric Pooling Strategy: The novel pooling in the second block deliberately preserves horizontal time–frequency patterns that represent bearing fault impulse sequences. Unlike standard square pooling that reduces dimensions equally in both directions, our asymmetric approach maintains more temporal information, resulting in significantly improved fault detection sensitivity.
- (2)
Decreasing Dropout Strategy: We implement a strategic dropout pattern where dropout rates decrease from early to later layers (0.2 in the first block, 0.1 in subsequent layers). This approach provides stronger regularization for low-level features while allowing high-level, class-specific features to develop more fully, effectively balancing between preventing overfitting and preserving critical fault information.
- (3)
Compact Network Design: Our CNN architecture contains only 124,000 trainable parameters, which is dramatically smaller than conventional deep networks with millions of parameters. This lightweight design is specifically suited for limited bearing fault samples, as it achieves high accuracy while significantly reducing the risk of overfitting that typically occurs when complex models are trained with insufficient data.
For model optimization, we employ the Adam optimizer with an initial learning rate of 0.001 that decreases by a factor of 10 every 25 epochs. This adaptive learning rate schedule helps the model converge more effectively. The training objective minimizes the cross-entropy loss function [
37]:
where
N is the number of training samples,
represents the CNN’s prediction for input image
with parameters
,
is the true fault class label, and
is the cross-entropy loss that measures prediction error.
After completing the training process, we use the trained CNN to extract 32-dimensional feature vectors from the penultimate fully connected layer. These compact feature representations capture the essential characteristics of different bearing fault patterns and serve as input for the final classification stage.
2.3. Confidence-Based Pseudo-Labeling for Sample Augmentation
To address the limited sample challenge in aero-engine bearing fault diagnosis, we propose a confidence-based pseudo-labeling mechanism that effectively expands the training dataset while maintaining diagnostic reliability. This approach operates as a multi-stage process specifically optimized for bearing fault diagnosis scenarios [
38,
39].
The core of our pseudo-labeling approach involves four key stages:
(1) Initial Model Training: A baseline CNN model is first trained using only the limited labeled samples available for each fault class. This model learns preliminary fault patterns from the WSET time–frequency images using the Adam optimizer with an initial learning rate of 0.001 for 100 epochs.
(2)
Confidence-Based Prediction and Selection: The trained model generates predictions for unlabeled samples with confidence scores calculated as follows:
We then select high-confidence samples using an optimized threshold:
Through extensive experimental validation on bearing fault datasets, we determined that provides the optimal balance between sample quantity and quality for aero-engine bearing applications.
(3)
Pattern and Feature-Space Verification: Unlike conventional pseudo-labeling approaches, we incorporate domain knowledge through pattern consistency verification. Selected samples undergo feature-space validation using the Mahalanobis distance:
where
is the feature representation of sample
j,
is the class prototype, and
is the class covariance matrix. This step ensures that pseudo-labeled samples exhibit consistent time–frequency patterns with their assigned classes, significantly reducing error propagation.
To prevent class imbalance issues, we implement a class-specific adaptive threshold:
where
is adjusted based on class representation, with
being the majority class count,
the count for class
c, and
a smoothing factor. Based on convergence analysis and class distribution experiments, we found that
provides effective balancing without over-compensating for minority classes.
(4)
Enhanced Model Training: The model is retrained using the combined dataset of original labeled samples and verified pseudo-labeled samples with a modified loss function:
For this enhanced training phase, we employ a progressive strategy with a reduced learning rate (0.0005) and increased training epochs (150) to ensure stable convergence with the augmented dataset.
2.4. WSET-CNN Integration: A Synergistic Framework
The integration of WSET and our specialized CNN forms a powerful synergistic framework that leverages the complementary strengths of both approaches. This integrated framework, enhanced by the pseudo-labeling mechanism, addresses the unique challenges of aero-engine bearings under data-scarce conditions through several key mechanisms. Algorithm 1 concisely outlines our approach’s four main processing stages.
| Algorithm 1 WSET-CNN Framework for Aero-Bearing Fault Diagnosis |
- 1:
Input: Raw vibration signals, labeled and unlabeled samples - 2:
Output: Fault diagnosis model and results - 3:
/* Stage 1: Signal Processing */ - 4:
Apply WSET to raw vibration signals: - 5:
Calculate instantaneous frequency trajectories - 6:
Extract energy-concentrated time–frequency representations - 7:
Convert to standardized time–frequency images - 8:
/* Stage 2: Feature Learning */ - 9:
Construct specialized CNN architecture: - 10:
Convolutional layers with batch normalization - 11:
asymmetric pooling for temporal pattern preservation - 12:
Decreasing dropout rates (0.2 → 0.1) across layers - 13:
Compact parameter design (124K parameters) - 14:
Train initial CNN using limited labeled samples - 15:
/* Stage 3: Sample Augmentation */ - 16:
Generate pseudo-labels for unlabeled samples: - 17:
Predict classes with confidence scores - 18:
Apply class-balanced thresholds: - 19:
Verify consistency in feature space using Mahalanobis distance - 20:
Select high-confidence, consistent samples - 21:
/* Stage 4: Enhanced Training */ - 22:
Train enhanced CNN on combined dataset: - 23:
Use weighted loss for original and pseudo-labeled samples - 24:
Apply reduced learning rate (0.0005) and extended epochs (150) - 25:
Extract final feature representations from penultimate layer - 26:
return Trained model and fault diagnosis results
|
The WSET-CNN framework operates through three key functional synergies:
- (1)
Signal-to-Feature Transformation Synergy: WSET provides physically meaningful time–frequency representations where fault characteristics are enhanced through energy concentration along instantaneous frequency trajectories. Our CNN then transforms these representations into hierarchical feature abstractions through its specialized architecture. This signal-to-feature pathway creates an end-to-end processing chain that maximizes information extraction from limited samples.
- (2)
Noise Suppression Synergy: Aero-engine bearing signals often contain substantial noise that can mask fault signatures. WSET’s synchroextracting mechanism effectively suppresses noise by extracting only the frequency components corresponding to instantaneous frequencies, while our CNN’s convolution and pooling operations further filter out irrelevant variations. This dual-stage noise suppression significantly improves feature quality compared to single-method approaches.
- (3)
Small-Sample Learning Synergy: WSET reduces the learning burden on the CNN by providing preprocessed representations where fault characteristics are already concentrated. This is further enhanced by our pseudo-labeling mechanism that expands the effective training dataset. The combination allows our compact CNN architecture to achieve high accuracy with significantly fewer samples than would be required for learning directly from raw signals.
The framework can be mathematically expressed as a composition function:
where
s represents the raw vibration signal,
is the WSET transformation, and
is the CNN feature extraction process.
3. OOA-LSSVM Framework for Fault Classification
3.1. LSSVM
The LSSVM is a reformulation of the standard SVM that reduces computational complexity while maintaining classification performance. For a training dataset
, the LSSVM optimization problem is formulated as:
subject to:
where
w is the weight vector,
b is the bias,
are error variables, and
is the regularization parameter. After applying Lagrangian multipliers and the kernel trick, the decision function becomes as follows:
The performance of LSSVM depends on two critical hyperparameters: the regularization parameter () and the kernel parameter (e.g., for RBF kernel). Traditional hyperparameter tuning methods are computationally expensive, making metaheuristic optimization algorithms more efficient.
3.2. OOA
The Osprey Optimization Algorithm (OOA) is a bio-inspired metaheuristic optimization technique that mimics the hunting behavior of ospreys. As an efficient optimization method, the OOA effectively balances exploration and exploitation capabilities, making it particularly suitable for parameter optimization tasks. In the framework, we employ the OOA to optimize the hyperparameters of LSSVM, enhancing classification performance for aero-bearing fault diagnosis.
The OOA operates in two primary phases that reflect the natural hunting behavior of ospreys:
(1)
Exploration Phase (Position Identification): In this phase, the algorithm explores the solution space to identify promising regions containing potential prey (optimal solution). Mathematically, this is represented as:
where
is the current position,
is a position with better fitness,
is a random number, and
I is a randomly generated integer (1 or 2) that controls the step size.
(2)
Exploitation Phase (Fish Carrying): In this phase, the algorithm focuses on refining promising solutions, similar to how an osprey adjusts its position when carrying a fish. This is formulated as follows:
where
t is the current iteration, and lowerbound and upperbound define the search space boundaries. This formulation gradually reduces the step size as iterations progress, enabling precise convergence toward the optimal solution.
For each candidate solution, the fitness is evaluated based on the classification performance of the LSSVM model with the corresponding parameters. Solutions are updated iteratively, with better solutions replacing current ones, driving the population toward optimal parameter combinations.
3.3. OOA-LSSVM Integration for Fault Classification
Building upon the LSSVM foundation described earlier, the framework integrates the OOA to automatically determine the optimal hyperparameters for LSSVM classification. This integration creates a powerful classification mechanism that maximizes diagnostic accuracy while eliminating the need for manual parameter tuning.
The objective function for optimization is defined as:
where
represents the LSSVM parameters being optimized,
is the number of test samples,
is the predicted class,
is the true class, and
is the indicator function.
Our implementation employs a population size of 15 ospreys and runs for 20 iterations, which provides an optimal balance between parameter exploration and computational efficiency. The search space is bounded within the range for both parameters, ensuring coverage of potential optimal values while avoiding numerical instabilities.
5. Case 1: Experimental Testbed Dataset Analysis and Discussion of Results
To comprehensively evaluate the proposed framework for small-sample bearing fault diagnosis, this section provides the results of systematic testing using two representative datasets: a multi-fault experimental testbed bearing dataset and real-world aero-engine bearing operational data. The experimental design encompasses ablation studies, comparative analysis of different optimization algorithms, investigation of training sample size effects, and performance benchmarking against state-of-the-art fault diagnosis methods, thereby validating the superiority and effectiveness of the proposed approach from multiple dimensions. All experiments were performed in a computing environment equipped with an Intel(R) Core(TM) i5-12600KF processor (Intel Corporation, Santa Clara, CA, USA), 64GB of RAM, and an NVIDIA GeForce RTX 4060 graphics processing unit (NVIDIA Corporation, Santa Clara, CA, USA).
The experimental testbed data was collected from a bearing test bench established at Huazhong University of Science and Technology [
40]. The test bench consists of a motor, speed controller, and rotating shaft, with vibration signals measured using a tri-axial accelerometer (detailed experimental setup and configuration can be found in [
40]). This dataset includes vibration data from bearings in nine different conditions, presenting more challenging fault scenarios. For convenience of documentation, these conditions are labeled as: 1-(Normal), 2-(I-1), 3-(I-2), 4-(O-1), 5-(O-2), 6-(B-1), 7-(B-2), 8-(C-1), and 9-(C-2) (detailed bearing fault configurations are illustrated in [
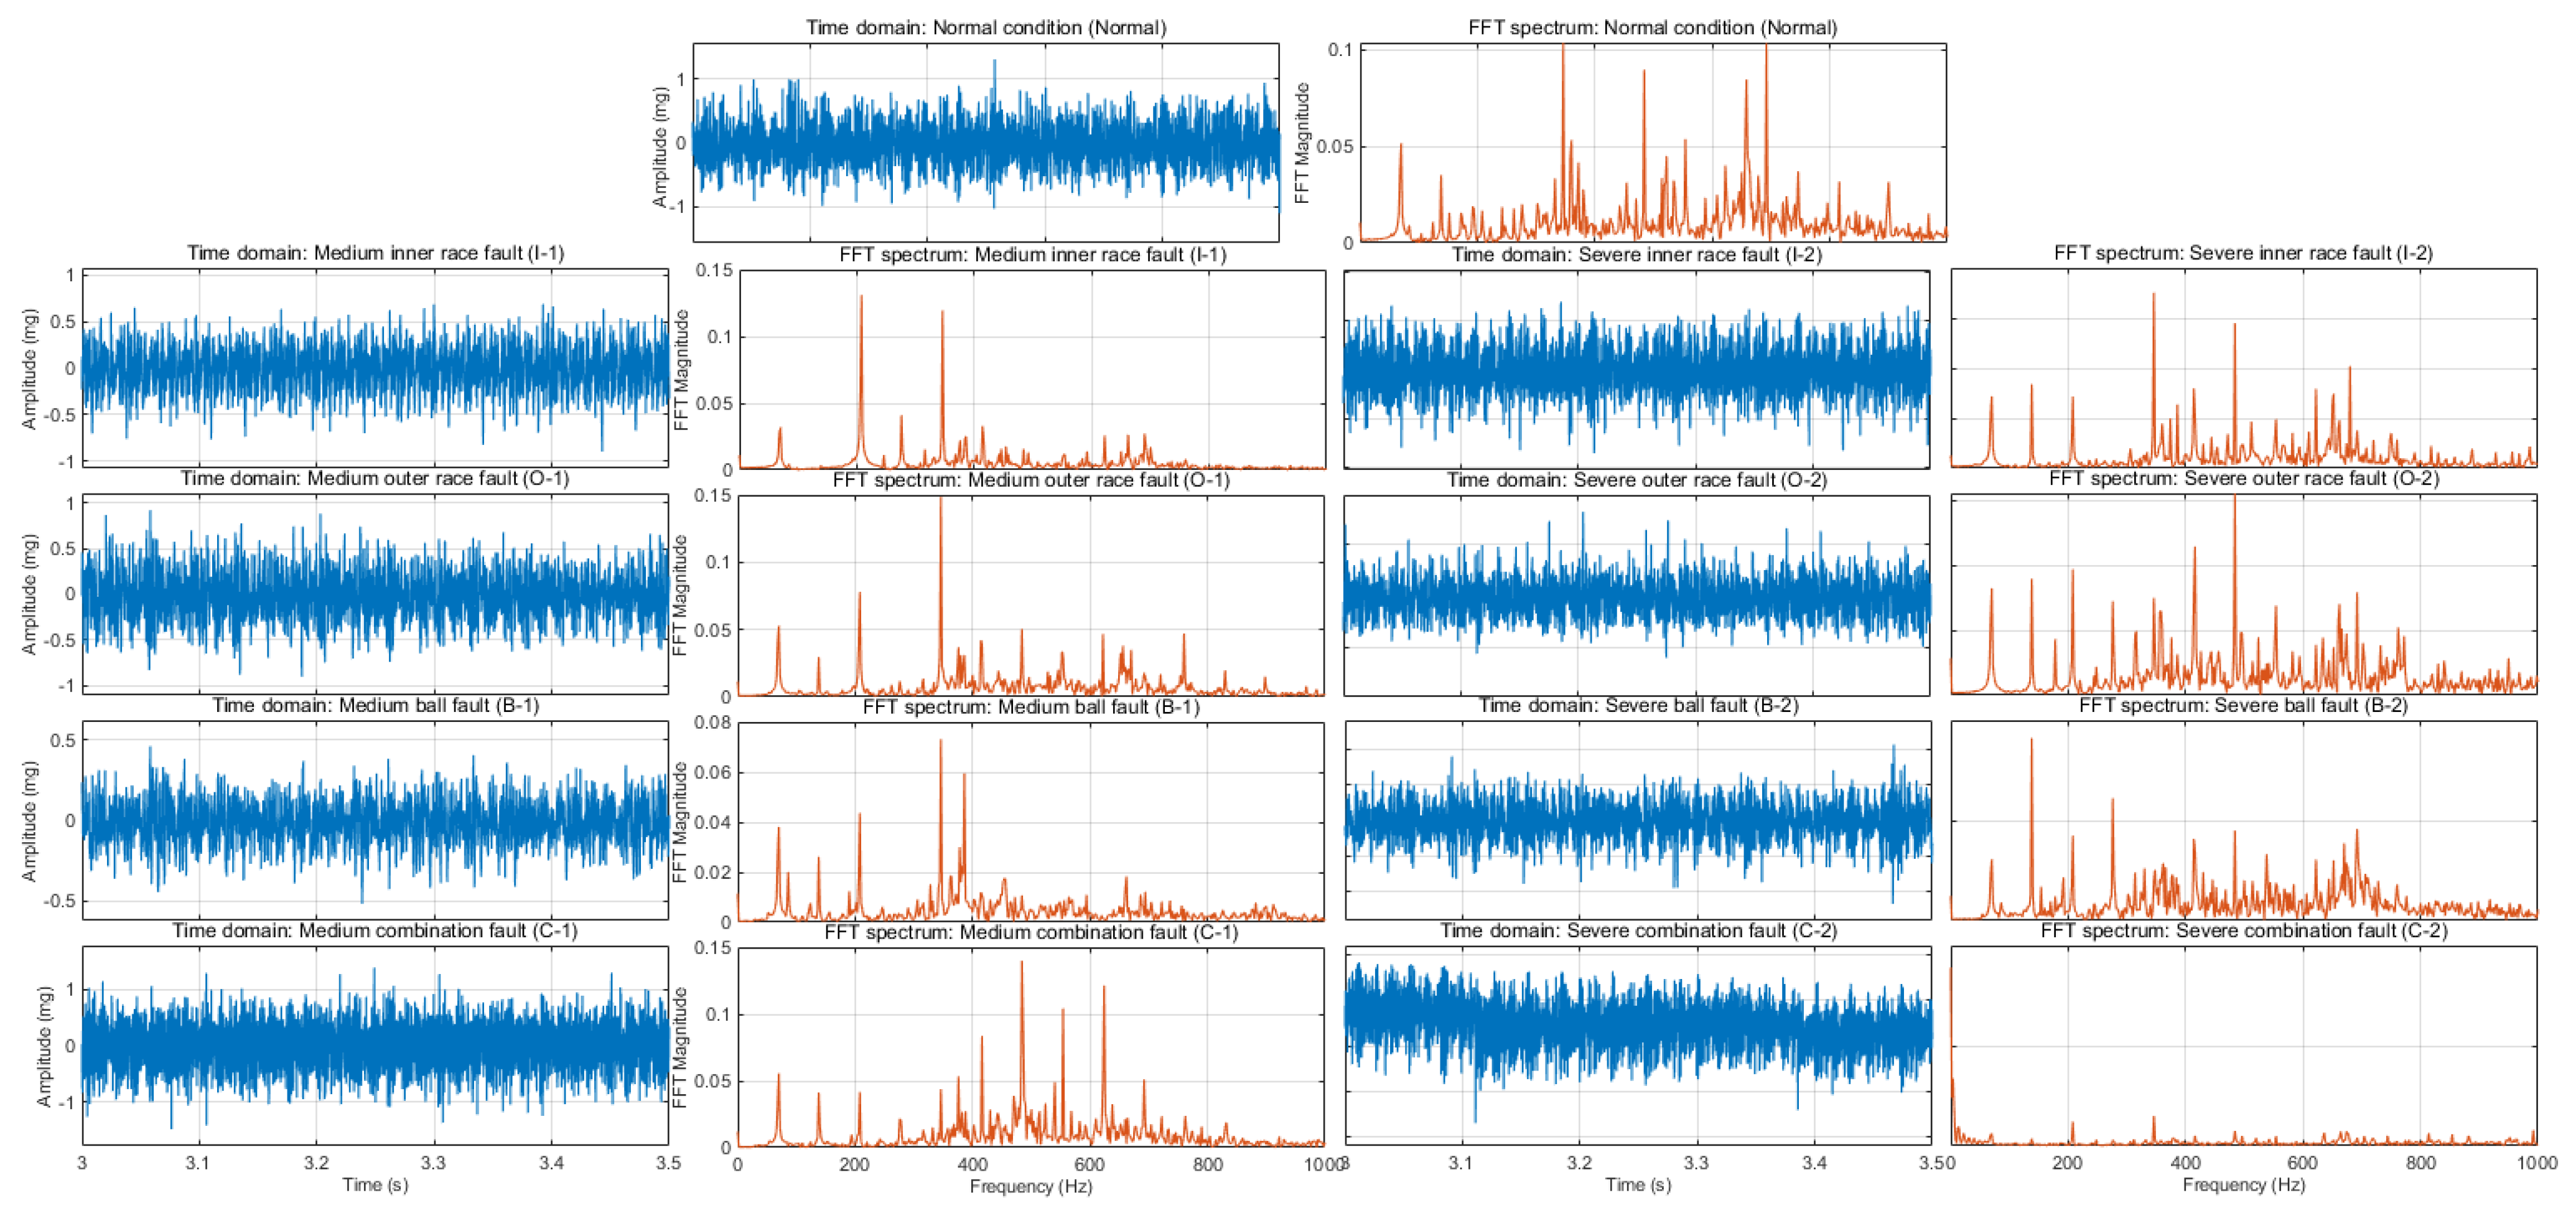
40]).The bearing model used is ER-16, with specific parameters detailed in
Table 1. In this study, bearings operating at 4200 rpm (corresponding to a shaft rotation frequency of 70 Hz) were investigated.
Figure 1 illustrates the temporal and FFT spectral characteristics of nine bearing conditions, with signals extracted during the 3.0–3.5 s interval. The frequency domain representations show FFT magnitude spectra, which effectively reveal characteristic fault frequencies for different bearing defect types. From each condition, 200 samples were extracted from the original signals, with each sample comprising 2048 data points and a sliding window parameter of 1000.
5.1. Repeated Test Verification of Fault Diagnosis Framework
To validate the effectiveness of the proposed fault diagnosis framework with limited samples, and to eliminate randomness, 30 repeated experiments were conducted using 10% of the samples from each state (i.e., 20 samples) as the training set, with the remaining 90% of samples (not selected as a fake label samples) allocated to the test set. Because the pseudo-labeling process actually feeds back the model’s predictions on unlabeled data to the training process, if these data are used for testing, it means that the model has “seen” these data, which will lead to overly optimistic evaluation results. Different random seeds were set for each experiment. The optimization algorithm population was set to 15 with 20 iterations. First, time-domain signals were transformed into time–frequency representations using WSET. The results of the WSET processing are shown in
Figure 2. Significant distinctions can be clearly observed among the nine bearing conditions after transformation. The normal state exhibits markedly different characteristics compared to the eight fault states. Furthermore, clear differentiation can be observed between various fault states. Notably, faults of the same type but different severity levels display similar profiles while demonstrating distinct energy distributions, indicating that this signal processing method achieves high-quality segmentation effects in
Figure 2. Then, the pseudo-labeling method was integrated with improved CNNs for feature extraction. As shown in
Figure 3a, the extracted features demonstrate excellent clustering properties with clear boundaries between classes. Finally, the feature sets were fed into the LSSVM optimized by the OOA for classification.The performance metrics used in the 30 experiments are defined in
Table 2, and the average confusion matrix (a random sample from 30 experiments) is presented in
Figure 3b. The results reveal that, under limited sample conditions, the main challenges arise from confusion between the I-2 and O-1 states, as well as between the B-1 and B-2 states. This indicates that slight faults can easily lead to misclassification; nevertheless, the overall framework still performs well. The distribution of OOA-optimized parameters shows certain clustering tendencies, although some scattered points appear, which can be attributed to the relatively small population size and limited number of iterations, as illustrated in
Figure 3c. Remarkably, even with only 20 samples per state, the method maintains an impressive accuracy of 98.68% under complex fault conditions. As demonstrated in
Figure 3d, our novel framework achieves excellent performance even with small sample sizes on this dataset.
5.2. Signal-to-Noise Ratio Analysis
To quantitatively validate the signal enhancement capability of the WSET-based framework, comprehensive signal-to-noise ratio (SNR) analysis was conducted across all bearing conditions. This analysis serves two primary purposes: (1) quantifying the relative signal characteristics of different fault conditions compared to the normal baseline, and (2) demonstrating the substantial signal enhancement effectiveness of the WSET processing method.
The SNR analysis employs two complementary approaches. First, traditional SNR analysis computes the signal power ratio of each fault condition relative to the normal bearing state:
where
and
represent the signal variances of fault and normal conditions, respectively. This metric reveals the inherent signal strength variations across different fault types. Second, WSET enhancement analysis quantifies the signal quality improvement achieved through the synchroextracting method by comparing energy concentration characteristics before and after WSET processing:
where
and
represent the maximum and average energy concentrations in the WSET domain.
The comprehensive SNR analysis results are presented in
Figure 4. The traditional SNR analysis shown in
Figure 4a reveals distinct signal characteristics across fault types relative to the normal baseline. Notably, severe combination faults (C-2) exhibit the highest SNR value of 11.0 dB, indicating the strongest vibration signatures, while severe inner race faults (I-2) show 3.2 dB enhancement. Interestingly, some fault conditions exhibit negative SNR values (ranging from −1.6 to −6.7 dB), suggesting that these fault signatures may be subtler than normal operational variations, highlighting the challenging nature of fault detection in these conditions.
The WSET-enhanced SNR results illustrated in
Figure 4b demonstrate remarkable and consistent signal quality improvement, achieving 43.7–47.6 dB SNR levels across all fault conditions. This uniformly high SNR range indicates that the WSET method successfully enhances fault features, regardless of their original signal strength. Most significantly, the SNR improvement analysis presented in
Figure 4c shows that the WSET method provides substantial enhancement ranging from 41.6 to 47.6 dB across all fault types. The consistency of this improvement (standard deviation < 2 dB) demonstrates the robustness of the approach across diverse bearing conditions and fault severities.
These quantitative results provide compelling evidence of the framework’s signal enhancement capabilities. The ability to achieve 40+ dB SNR improvements consistently across all fault types—including those with initially negative SNR values—directly addresses the fundamental challenge of detecting subtle fault signatures in limited-sample scenarios. This substantial signal enhancement translates to improved fault feature discriminability, which is crucial for the success of the few-shot learning approach and validates the effectiveness of the WSET-CNN-OOA-LSSVM framework.
5.3. Ablation Study of the Proposed Fault Diagnosis Framework
To evaluate the impact of various components and optimizations in our proposed framework, comparative experiments were conducted across four distinct fault diagnosis frameworks. The evaluation utilized various training set configurations, including normal samples, small samples, and extremely small samples. Due to the pseudo-label mechanism in the framework, the validation set size varied proportionally with the training set. We tested with training sample sizes of 5, 10, 15, 20, 25, and 30 samples. All experiments were conducted using a fixed random seed. To ensure fair comparison, all four methods were implemented within the same programming environment.
Figure 5 illustrates the diagnostic results, which demonstrate that even with extremely limited samples, our improved CNN framework exhibits excellent classification performance. This effectiveness can be attributed to the critical role of WSET in the initial data processing stage.As the sample size increased, all four methods showed varying degrees of accuracy improvement and significant reduction in error samples. Notably, when comparing methods without pseudo-labels, the standalone CNN method produced fewer error samples than the CNN+LSSVM approach, indicating that LSSVM integration actually produced negative optimization in this scenario. However, comparing CNNs with Pseudo+CNN reveals a substantial accuracy improvement of at least 5%. Furthermore, incorporating the LSSVM method into the pseudo-label framework further enhanced accuracy.Most impressively, the framework achieved 93.4% accuracy even with an extremely small training set of just five samples. This suggests that each component in the complete framework contributes to synergistic optimization.
6. Case 2: Analysis of Real Aero-Engine Bearing Test Data
This section validates the effectiveness of our proposed limited-sample fault diagnosis framework using real aero-engine bearing test data. The dataset was collected from the Harbin Institute of Technology’s aero-engine bearing test platform [
41], as illustrated in
Figure 6. To facilitate testing, the experimental setup was modified by removing the actual aero-engine rotor blades, combustion chamber, and auxiliary housing, focusing primarily on the core component—the dual-rotor structure.The bearing faults were specifically designed to include medium outer race fault (O-1), medium inner race fault (I-1), and severe inner race fault (I-2). All fault depths were set at 0.5 mm, with medium faults extending 0.5 mm in length and severe faults extending 1 mm. The test platform employed a dual-motor drive system, enabling the simulation of various operational conditions and failure modes experienced by intermediate bearings in aero-engines through the adjustment of different motor speeds. Vibration data was captured using six accelerometer sensors with a sampling frequency of 25,000 Hz. For this analysis, data from the fourth vibration sensor was selected, recorded when the low-pressure (LP) rotor operated at 3000 rpm and the high-pressure (HP) rotor operated at 3900 rpm. Four distinct bearing conditions were analyzed, with each condition comprising 180 sample groups. Each sample group contained 1024 data points. For the experimental setup, 5 groups from each condition were allocated to the training set, and 80 uncontaminated groups were designated for the test set. The computational environment used for testing was identical to that described in
Section 5.
Various fault diagnosis methods have been selected to compare with our proposed approach for limited-sample aero-engine bearing fault diagnosis. Nine methods in total were evaluated, including the proposed method (Method 1) and eight other approaches (Methods 2–9) that have been frequently used or recently developed by researchers in this field. Methods 2–5 utilize the same WSET signal processing technique as the proposed method but employ different classifiers. Method 2 implements direct classification using a CNN with 3 × 1 convolution kernels (16 filters), optimized using the Adam optimizer with the following parameters: MaxEpochs = 30, GradientThreshold = 1, InitialLearnRate = 0.001, LearnRateDropFactor = 0.01, and L2Regularization = 0.0001. Method 3 builds upon Method 2 by combining a CNN with SVM (CNN-SVM), utilizing the fullconnect3 layer for feature extraction and SVM parameters of bestc = 0.01 and bestg = 5000. Method 4 employs CNN-LSTM, with LSTM parameters configured as described by Khorram et al. [
42], while Method 5 implements CNN-BiGRU, where BiGRU refers to bidirectional gated recurrent units configured according to Xu et al. [
43]. The remaining methods utilize different signal processing techniques and classification approaches. Method 6 employs VMD-SABO-KELM, where SABO represents the subtraction average-based optimizer, and KELM refers to Kernel Extreme Learning Machine, with parameters configured as presented by Guo et al. [
44] and Kar et al. [
45]. Method 7 implements GOA-VMD-Transformer-VMD, where GOA stands for the grasshopper optimization algorithm, with parameters specified by Zhang et al. [
46]. Method 8 utilizes FEEMD-PSO-ELM, where FEEMD represents fast ensemble empirical mode decomposition as detailed by Jiang et al. [
47], with PSO and ELM parameters configured according to Chen et al. [
48]. Finally, Method 9 employs VMD-CMSDE-SVM, where CMSDE denotes composite multi-scale symbol dynamic entropy as described by Qin et al. [
49].
As evident from
Figure 7 and
Table 3, the WSET method demonstrates remarkable transformation effectiveness for real aero-engine bearings with limited samples, which significantly contributes to the subsequent processing accuracy improvement. Based on
Figure 8, it can be observed that the proposed method (Method 1) achieves the highest accuracy at 100% with consistent stability across 30 repeated experiments. In comparison, Methods 2–9 achieved accuracies of 88.25%, 93.11%, 95.59%, 68.8%, 93.16%, 97.25%, 60.23%, and 91.11%, respectively. Methods 2–5 employ structures similar to our approach but suffer from significant limitations. Conventional CNN algorithms require adequate training samples, and without incorporating pseudo-labeling and improved CNN architectures, they cannot achieve high and stable accuracy with limited samples (even with fewer fault categories). Specifically, Method 2 directly employs CNN classification, which fails to identify optimal decision boundaries in the feature space. Method 3 lacks effective parameter optimization algorithms and uses standard SVM instead of LSSVM, resulting in higher computational complexity and inferior generalization performance. Method 4 implements LSTM with a complex structure and large parameter quantities, making it prone to overfitting under limited sample conditions and lacking adaptive parameter adjustment mechanisms. Method 5 uses BiGRU models with high complexity, causing severe overfitting with extremely small samples and exhibiting poor stability, as evidenced by its high standard deviation of 17.59%. As for the other methods, Method 6 employs VMD, which is less precise than WSET in processing aero-engine bearing signals and cannot fully extract transient fault features. While KELM offers high computational efficiency, its classification capability for complex fault patterns is inferior to LSSVM. Additionally, the SABO optimization algorithm’s exploration capability is not as robust as OOA, resulting in suboptimal parameter optimization. Method 7 utilizes Transformer models with complex structures that require substantial samples to fully demonstrate their capabilities. Method 8 implements FEEMD, which performs poorly when processing high-noise aero-engine bearing signals, while ELM exhibits weak generalization ability with small samples and tends to produce unstable results. Furthermore, the PSO optimization algorithm has limited exploration capabilities in high-dimensional parameter spaces. Method 9 employs CMSDE feature extraction, which is unstable under small sample conditions, and standard SVM lacks the mathematical advantages of LSSVM. In contrast, the proposed method demonstrates significant potential for practical applications and research in aero-engine bearing fault diagnosis, particularly when confronted with limited sample scenarios.
7. Discussion
The experimental validation across both laboratory test bench and real aero-engine datasets demonstrates the effectiveness of the proposed WSET-CNN-OOA-LSSVM framework for addressing the challenging problem of few-shot bearing fault diagnosis. The framework achieves remarkable performance with 93.4% accuracy using only five samples per class and 100% accuracy in real aero-engine applications, consistently outperforming eight established methods by substantial margins. The integration of WSET’s superior time–frequency analysis, specialized CNN architecture with confidence-based pseudo-labeling, and OOA-optimized LSSVM classification creates powerful synergistic effects that maximize information extraction from limited fault samples. The quantitative SNR analysis reveals consistent 40+ dB signal enhancement across all fault conditions, providing compelling evidence of the framework’s ability to extract subtle fault signatures that would otherwise be masked by operational variations.
This research addresses a critical practical need in aerospace applications where fault samples are inherently scarce and expensive to obtain. Unlike conventional approaches that require extensive datasets, the proposed framework enables effective fault diagnosis under realistic industrial constraints. The successful validation on real aero-engine bearing data confirms the framework’s practical viability and readiness for industrial deployment. The methodology’s generalizability is evidenced by consistent performance across diverse experimental conditions, bearing configurations, and fault types, suggesting broad applicability to similar mechanical systems facing limited-sample challenges.
While the framework demonstrates exceptional performance, certain practical considerations merit acknowledgment. The method’s effectiveness depends on the quality and representativeness of initial training samples, requiring careful sample selection in practical applications. The computational requirements, though moderate with 124,000 CNN parameters and efficient OOA optimization, may need consideration for real-time implementation in resource-constrained embedded systems. Additionally, while the framework shows excellent generalization across tested conditions, validation for extreme operating environments such as very high temperatures or severe electromagnetic interference would strengthen confidence for deployment in the most demanding aerospace applications.


