Article

Mechanical Vapour Compression Modelling and Assessment in a Zero-Liquid-Discharge Desalination System

by
Pablo Calleja-Cayón
1,
Paula Hernández-Baño
1,
Angel Molina-García
2 and
Francisco Vera-García
1,*
1
Department of Thermal Engineering and Fluids, Universidad Politécnica de Cartagena, 30202 Cartagena, Spain
2
Department of Automatics, Electrical Engineering and Electronic Technology, Universidad Politécnica de Cartagena, 30202 Cartagena, Spain
*
Author to whom correspondence should be addressed.
Processes 2025, 13(7), 1963; https://doi.org/10.3390/pr13071963 (registering DOI)
Submission received: 7 May 2025 / Revised: 13 June 2025 / Accepted: 19 June 2025 / Published: 21 June 2025
(This article belongs to the Special Issue Recent Advances in Wastewater Treatment and Water Reuse)

Abstract

:
Nowadays, treating residual brine from desalination systems is an important issue for sustainable water management, where Mechanical Vapour Compression (MVC) systems are a great energy-efficient option for small-scale desalination plants. In this paper, an MVC model with TRNSYS 18 software is proposed, validated using real data from an MVC experimental system. A relevant contribution of this paper is that each component of the MVC system is individually modelled considering the challenges faced in the real experimental facility and only using input variables that are managed by real MVC plant operators, achieving accurate output results with the proposed model. Assessment of the model uses real datasets from a real MVC experimental facility in Spain, with more than 30,000 individual real values during validation. As a result, the model generated more than 350,000 values each day used for validation purposes. Comparing output variables, such as distillate production and final salinity, the accuracy of the model achieves a mean absolute error of 6.87% and relative errors lower than 2.90 % . This contribution highlights the importance of using accurate simulation tools, providing valuable information to optimize MVC systems.

1. Introduction

Residual brine has been considered for decades a problematic waste product with limited value, generating great environmental concern [1]. Desalination technologies are one of the main industrial sectors affected by this problem; membrane methods, thermal methods, and even humidification and dehumidification desalination technologies have issues dealing with residual brines [2]. Low-energy solutions related to this technology were studied by Saha et al. [3], but since they used waste energy as power they were mainly suitable for small-scale installations. Modern technologies enable recovery from brine sources of valuable materials such as lithium, magnesium, potassium and rare-earth elements [4]. In parallel, the brine integration in different industrial sectors is part of the Zero-Liquid-Discharge (ZLD) approach. It is part of the circular economy practices, where any kind of liquid by-product from a industrial sector can be repurposed for beneficial applications [5]. Regarding the liquid waste management from desalination, thermal processes are considered the most advantageous, as they allow working with highly concentrated brine [6]. Mechanical Vapour Compression (MVC) represents one of the most suitable and usual thermal distillation desalination technology, with advantages such as the exclusive use of electrical energy and the possibility of creating both large and small-scale plants [7].
MVC systems contain a multitude of elements despite only a few of them having the greatest impact on the operability of the system [8]. The two most important components of MVC are the vacuum compressor and the evaporator. For optimizing MVC plants, it is necessary to understand the individual performance of each component in order to promote the correct operation of each one of them. This work focuses on modelling the behaviour of these two main components of an MVC system: the vacuum compressor and the evaporator. It also considers their interaction and changes in behaviour when the system operates under real conditions, subject to the opening and closing of the various valves required in such real operation. The results obtained with this MVC model are then compared with those of a real MVC experimental facility.

1.1. Literature Review

The first review focusing exclusively on MVC desalination technology comes from Shamet and Antar in 2023 [8]. Most of the reviews treat desalination technologies as part of general topic; like the one targeting solar energy technologies for desalination by Wu and Yang [9], the review proposed by Al-Saidi et al. focuses on the systematization of regulatory and socio-technical issues while managing brines [10], Alawad et al. focuses on renewable energy systems for water desalination applications [11], while Rahimi-Ahar conducted an exergy analysis of thermal desalination processes [12]. Studies on the optimization of components in MVC plants have been carried out in other publications treating topics such as component innovations [13], comparison of different compression methods [14], or the modelling of a regeneration system of potassium formate solution [15]. Among all the topics and desalination technologies present in these reviews, MVC was considered one of the most representative thermal desalination technologies, and even Nassrullah et al. concluded in their energy for desalination review [16] that the RO system was the best choice if a grid connection is available to supply energy for lower water production costs, while MVC was suitable as a standalone system for remote locations.
Regarding the equations used to model MVC desalination plants, the majority of authors continue the steps of Aybar [17] and Aly and El-Fiqi [18] in terms of energy balance and heat transfer formulas. Variables such as heat transfer surface areas, compressor work, and overall heat transfer coefficients are key for calculations. A recent example can be seen in Sheta et al. [19], which follow the same structure for their multi-effect distillation system. Each effect starts with the equations corresponding to mass balances and salinities, continuing with energy balances and temperatures. However, one of the main drawbacks when comparing MVC plant publications is that its equations are tailored to specific components and their setups; they are not general formulations. For example, Liu’s paper [14] compares the outcome of using two different types of compressors for MVC desalination plants, while Sheta’s publication [20] compares the multi-effect MVC desalination system powered by a photovoltaic/thermal solar collector of evacuated tubes and photovoltaic solar panels. These studies ensure higher accuracy of results for these specific applications, but make it difficult to compare different MVC studies since their components rely on different technologies. What both studies share is that their equations are defined by the information they can obtain from their respective experimental plants. However, for MVC plants already built, it is difficult to find models that allow end-customers to simulate the working conditions of their systems when some design variables are unknown to them. In these cases, part of the valuable information for modelling the plant is lost, and the existing literature does not provide solutions to this problem. These challenges are new for the academic sector in this area of research, offering opportunities to improve the technology is crucial for upgrading existing plants.
MVC is usually found in the literature relating to the refrigeration, dehumidification, and oil–gas industries. Recent articles where MVC is used for desalination purposes appear in topics such as Multiple-Effect Distillation (MED) [21], humidification–dehumidification (HDH) [22], net-zero desalination [23], and ZLD [24]. In ZLD desalination, MVC technology is now more frequently used. This is the case of the LIFE-Desirows project [25], where four different technologies for both desalination and brine disposal are combined to achieve a ZLD system, and one of these technologies is the cited MVC.nother possible reason for the limited use of MVC desalination technology over the past few decades could be the lack of specialized software for this technology, which would demonstrate its potential for use in ZLD systems within the desalination industry.
TRNSYS, an extremely flexible graphically based software environment used to simulate the behaviour of transient systems, is indeed a widely recognized software application in the engineering sector, known for its specialization in analysing the dynamic behaviour of energy systems [26]. It offers significant potential for creating new libraries, specifically for the desalination sector as a specialized program to analyse the dynamic behaviour of energy systems with the possibility of incorporating new custom libraries. Some examples of the use of TRNSYS software in the open literature are Vera-García et al. [27], who developed a new TRNSYS model for completed logistic centre taking into account the influences of the envelope, infiltrations and stored goods. Massaguer et al. [28] also developed a new TRNSYS type for the simulation of thermoelectric generators and validated the new type of component under transient and steady-state conditions. Another recent use of this software comes from authors such as Quesada et al. [29], who proposed a dynamic model with TRNSYS of a 7.2 kWp photovoltaic installation to accurately predict the long-term performance of the installation, while Delgado et al. [30] proposed an adaptive control model using TRNSYS to adjust and optimize the heat input from solar collectors or backup boilers to maximize solar input in an indoor public swimming pool. It is observed that different fields of knowledge use TRNSYS as a tool for continuous improvement and development of scientific advances, which serves as a basis for developing this model with this software. All of these previous examples demonstrate the great versatility of TRNSYS software for developing complex thermal models with significant transient behaviour. Therefore, TRNSYS is considered a great option for this case study: modelling of an MVC system and its components. This article presents an MVC model developed in TRNSYS suitable for the design of new desalination plants and the performance analysis of the current existing installations.

1.2. Objectives

The main objective is to obtain a feasible model of a single-effect MVC plant, guaranteed by validating the model. The model is created by using a specific software called TRNSYS [26]. It is validated with real measured values from a tested MVC experimental desalination installation [31]. Moreover, model results provide information that ensures the system adapts to different operating conditions along the simulation timeline.
The TRNSYS model, developed with custom types in this work, is reliable without requiring parameters such as heat transfer surface area, which is unknown for final users. The model must be developed by achieving pseudo-stationary states and the interconnection of the elements that make up the MVC system. The model must respond to the manufacturing parameters of the components and to the overall operating values of the real MVC system used for validation.
An additional objective of this work is the model validation process, which contains parameters that can be measured both in the model and in the actual experimental setup used to validate the model. The model includes as input and start variables those available in the experimental setup, initial salinity, start temperature, etc. Finally, the outputs used to determine the model’s accuracy are total distillate production, total concentrated brine production, and the final salinity of the concentrated brine.

2. Mechanical Vapour Compression for Desalination Purposes

Mechanical Vapour Compression (MVC) represents one of the most advantageous thermal desalination technologies due to (i) the exclusive use of electrical energy, (ii) the possibility of creating brine treatment plants on both large and small scales, and (iii) its suitability even for the treatment of highly concentrated brines [7]. These characteristics make it suitable even at remote locations and can be found at both single-effect and multiple-effect combinations.
In any MVC system, two of its components can be considered critical to understanding how the desalination process works: the compressor and the evaporator. The compressor is the device responsible for generating the operating conditions, while the evaporator is responsible for generating the distillate according to the conditions delivered by the compressor. Other components necessary for warranting energy efficiency of this thermal process are heat exchangers operating as pre-heaters and recirculating pumps for avoiding fouling inside the system. MVC desalination systems also contain an external source of heat, responsible for generating the initial steam needed by the compressor to start its operation and in times of lower steam production. The external source of heat can be found as an electric boiler, like in the case of the LIFE-Desirows project [25] and shown in Figure 1 or like thermal solar collectors as presented by Kalogirou [32]. More information about MVC technology and its configurations can be found in a recent review from Shamet [8].

3. Experimental Facility for Model Validation

The validation of the model was achieved using information from a real MVC experimental facility in Campo de Cartagena (Spain), part of the LIFE-Desirows demonstration project [25] focused on ZLD from desalination plants [5]. This MVC prototype is a small-scale plant, as seen in Figure 1, and it is analysed under steady-state conditions. Figure 2 shows a simplified flow diagram of the real experimental plant that highlights its key components: (i) an additional heat source (T-0103 + R-0101), (ii) evaporator with flash tank (HE-0102 + T-0102), (iii) compressor (C-0101), and (iv) preheater (HE-0101) and (v) automatic valves (AV-0104, AV-0105, FCV-0101, etc.). The functions of each specific element of the MVC system are listed in Table 1.
The evaporation process relies on energy from compressed superheated vapour from C-0101 and steam from R-0101, as the evaporator alone is insufficient to obtain steam conditions. Incoming brine is pumped by P-0101 and pre-conditioned in HE-0101. Continuous brine recirculation by pump P-0102 and through HE-0102 increases fluid enthalpy and produces steam that is sent to T-0102 achieving boiling conditions through compressor action. Concentrated brine is periodically discharged from T-0102 through valve AV-0105, and distillate exiting the pre-heater is sent to the auxiliary heat source when needed using AV-0112. When C-0101 creates an excessive vacuum within T-0102, a flow control valve (FCV-0101) allows some of the superheated vapour from the hot source of HE-0102 to be introduced directly into the flash-tank T-0102, producing an increase in absolute pressure and providing heat to maintain the saturation of the mixture.
All the variables required by the model can be monitored, and every minute the parameters are registered thanks to the MVC control system [31]. To calculate brine consumption, concentrated brine production or distilled production, it is necessary to compare the variation in the levels of each storage tank between the beginning and ending of the operation each day. Finally, to estimate each flow rate, the total production is divided by the total time elapsed.

4. Proposed Methodology

This contribution proposes a feasible model of an MVC system with TRNSYS software [26], considering constraints observed from a real life experimental plant and validating the model with real measured values from that same tested MVC experimental facility [
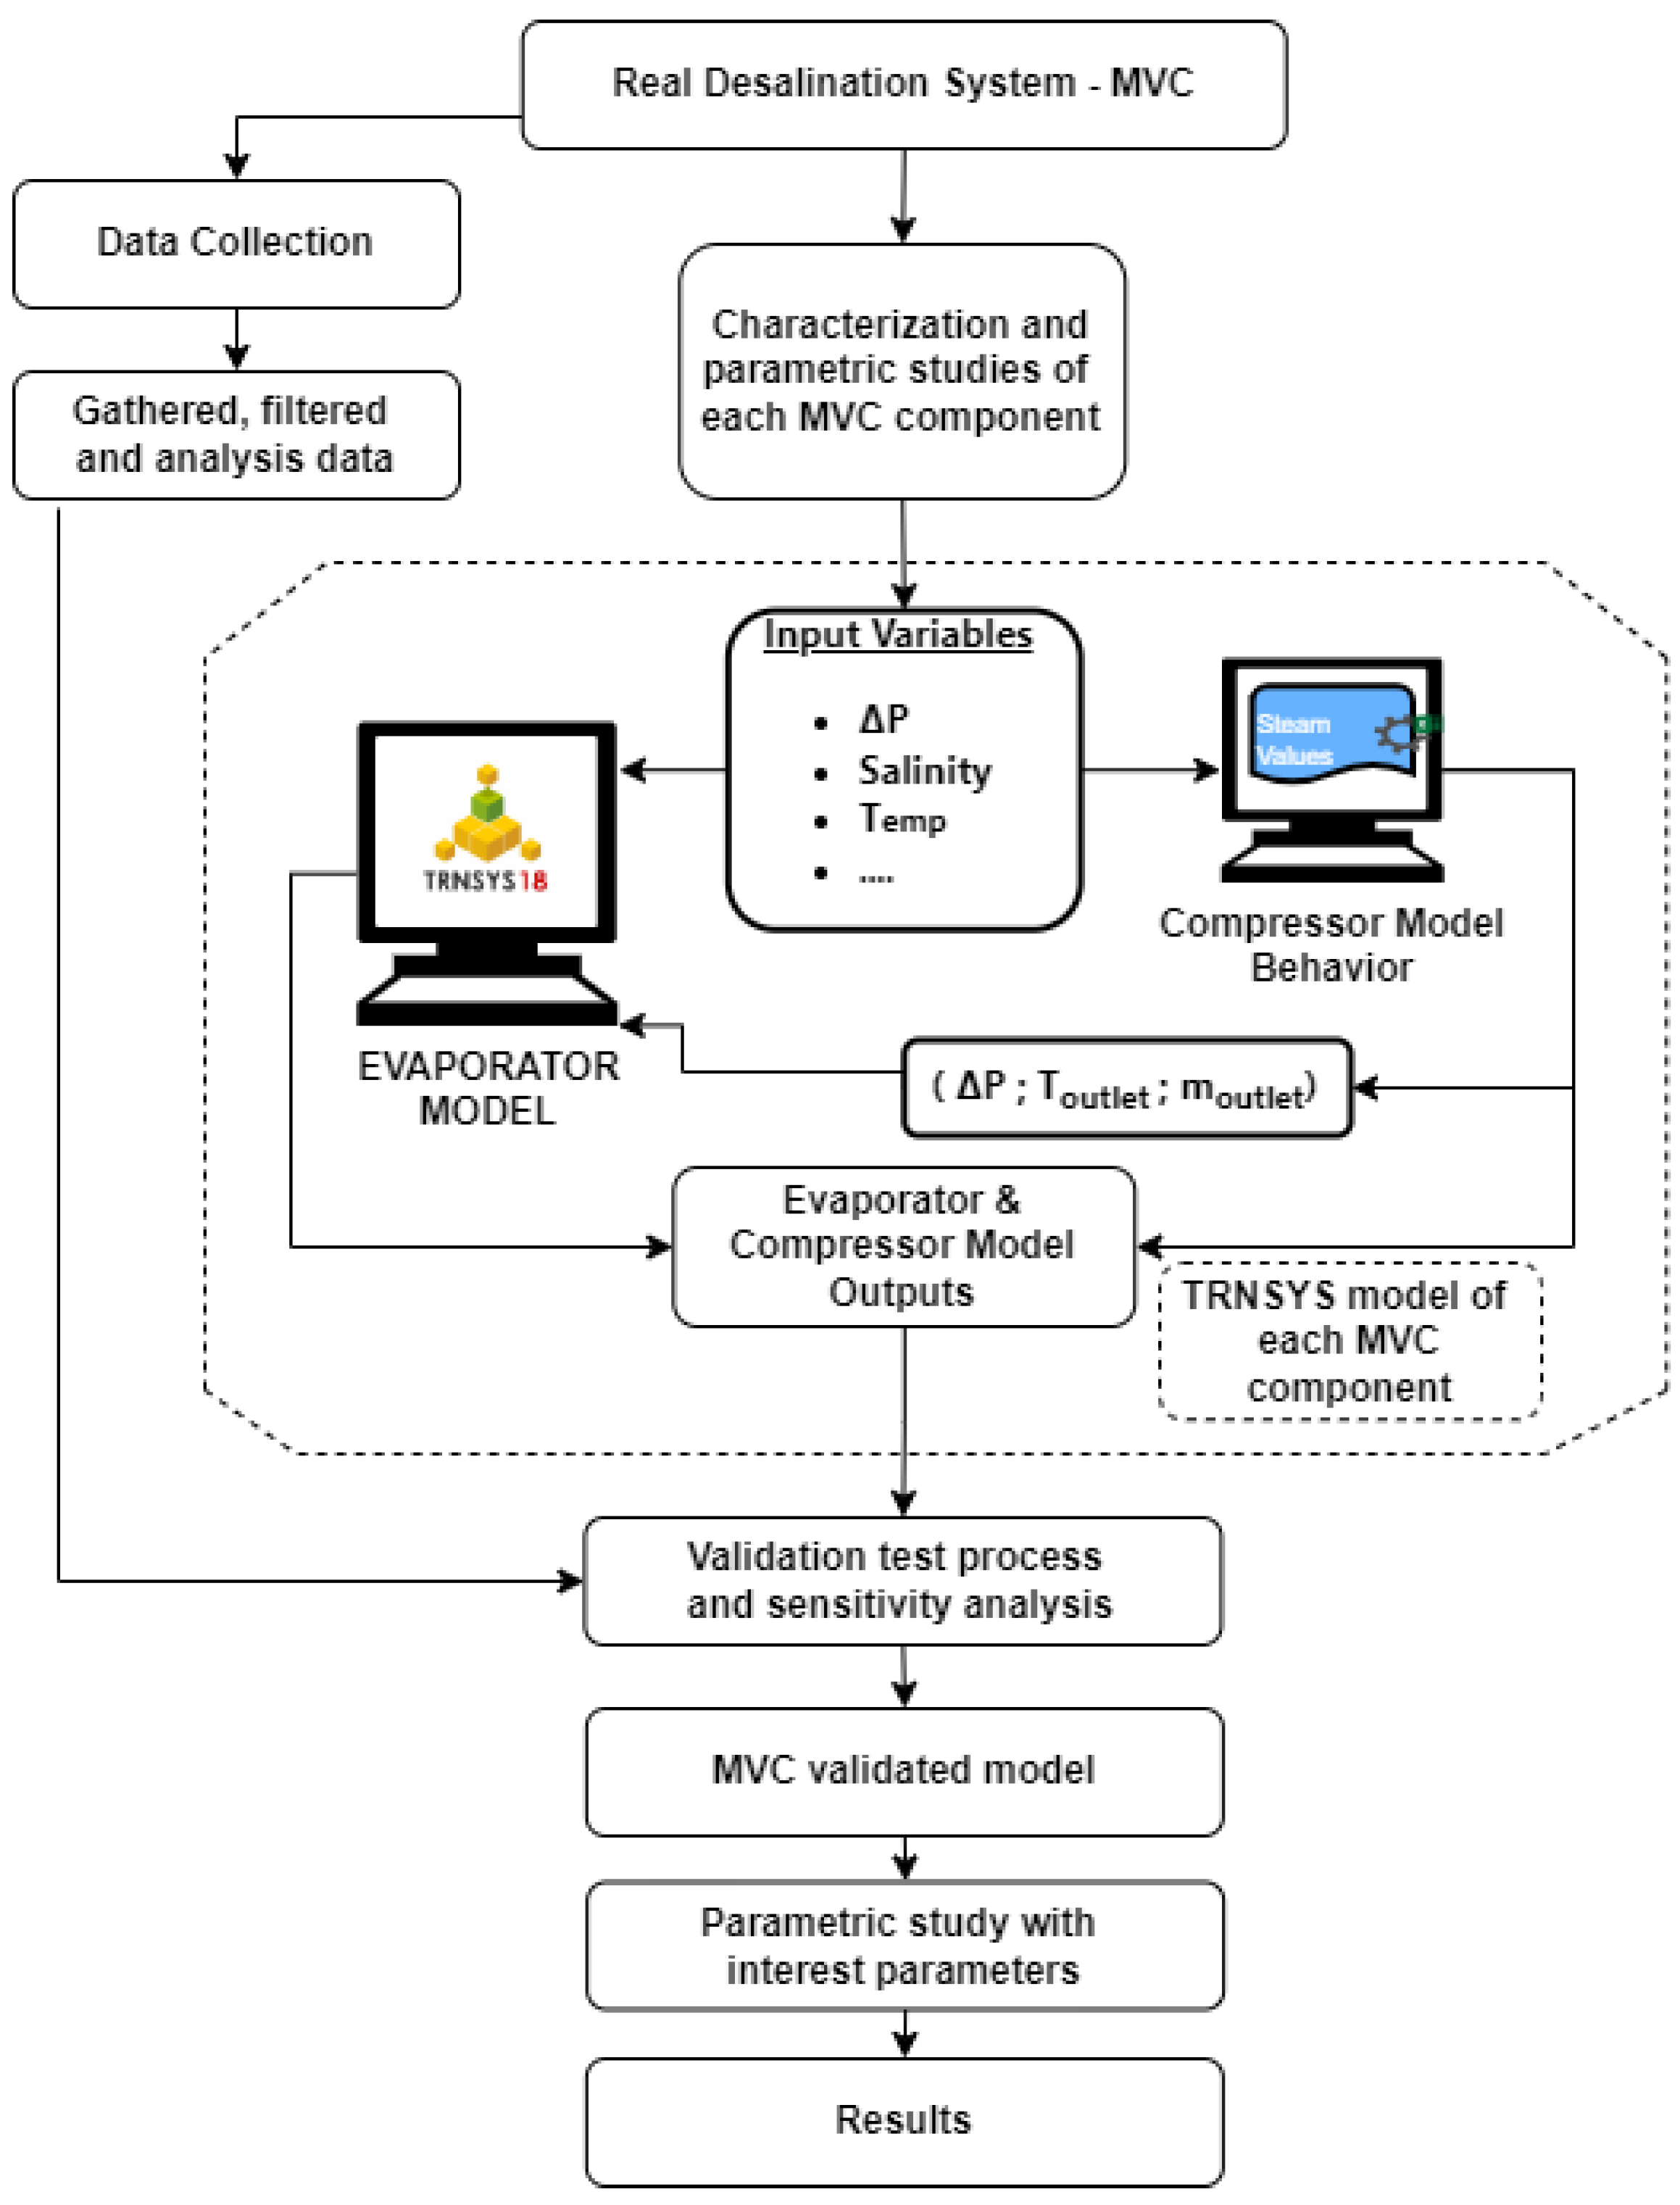
31]. Parametric studies can be generated in this model with different operating conditions, estimating which variable affects the most to the final outcome of the system, but this contribution focuses on its validation only. The methodology followed is shown schematically in Figure 3. The process starts by understanding the relationships between the components of the real MVC plant, including their mass and energy balances, and determining the availability of the necessary variables for these balances. After that, data from the MVC experimental plant in operation are gathered, selected and filtered. This data will be used to validate and verify the reliability of the model created. In parallel, each element in the MVC desalination system is independently characterized, calculated and connected to create a model in Section 4.1. The proposed model is based on the combined calculation of the two main components of the MVC: the compressor and the evaporator. These components’ models are explained in the following Section 4.2 and Section 4.3.
Validating the model is crucial for trusting the results provided by parametric studies, so full knowledge of the real parameters and variables available in the experimental facility is a must for this goal. Operation stages of an MVC desalination plant during steady-state conditions can be separated into three stages: filling, heating and concentration. These three stages are mandatory also in the modelling process, better described in Section 4.1, that also must consider the real operation values that are described below.
The compressor is designed to generate vacuum pressures up to −0.5 barG (51.325 kPa absolute pressure), where the saturation temperature inside the evaporator reaches 81.96 °C. The outlet temperature of the compressor has a manufacturer’s limit set at 135 °C and should be greater than 100 °C to take advantage of the latent heat from the superheated vapour. For the evaporator, the concentration stage lasts 4 min (240 s), while the time for the rejection of the brine is between 3 and 4 s long and refilling of the evaporator lasts 10 s.

4.1. General Description of Modelled MVC System

Starting with the software used to model the MVC system, the selected tool is TRNSYS: a modular simulation platform that analyses the dynamic behaviour of energy systems [26]. Thanks to its libraries of components, where each component represents a specific physical model, it is very useful for simulating and studying complex energy systems, such as energy-efficient buildings, HVAC (Heating, Ventilation and Air Conditioning) systems, and solar systems, among others. Moreover, users can generate their own components and libraries by coding in Fortran 90, allowing them to use this powerful tool for purposes wider than the original ones.
For this contribution, a model that contains each element of the MVC system is created using TRNSYS, and the outcomes generated are compared with the real experimental results from the facility to validate the model. The model’s accuracy is validated using three real operating condition datasets corresponding to various days of experimental plant operation. Figure 4 shows the schematic of the model developed in TRNSYS for the complete MVC system. The authors have created the evaporator, valve FCV, and compressor without considering TRNSYS libraries. As validation is the ultimate goal of this model, and the real plant has no record of variables between the outlet of the main heat exchanger and the inlet of the flash tank, the evaporator is analysed as a block of these two elements where the mass and energy balance are equivalent under ideal conditions. In this model, secondary elements available in the libraries such as pipes or vent valves have been omitted.
This configuration of the model visualizes and simplifies the close relationship between the system’s two most important elements, the evaporator and the compressor, where the steam conditions at the evaporator outlet are the same as at the compressor inlet (Point 3 in Figure 4). In an MVC model, the good performance of those two most important elements, the compressor and the evaporator, is crucial. The compressor is responsible for generating the working conditions of the MVC system, while the evaporator generates both the distillate and the concentrated brine of the system depending on the given working conditions. Due to the relevance of these two elements, they are explained more thoroughly in Section 4.2 and Section 4.3.

4.2. Description of the Modelled Compressor in MVC

The modelled compressor represents a digital version of a compressor, considering as input variables the ones that can be modified by plant operators of MVC systems. These variables are selected using the expertise achieved in the experimental plant from LIFE Desirows [25]. The developed model converts the information provided by compressor manufacturers into valid values for TRNSYS to reproduce the behaviour of the compressor under working conditions in the MVC system. The steps followed in the modelling process of the compressor are described in Figure 5, where a manufacturer provides the design diagrams of the compressor tested with air as the working fluid.
As presented in Figure 5, the initial information comes from the manufacturer of the compressor, which uses air for testing different ranges of operation without considering any type of refrigeration of the compressor, and the manufacturer creates design diagrams from those results. These diagrams are converted to an Excel worksheet for air; these worksheets can be easily transformed into steam values by calculating the densities and heat capacities of both fluids at the different pressure and temperature conditions. Finally, the thermodynamic properties of the inlet distillate used as refrigerant in the MVC plant is the last input information required by the compressor type, which by setting an output temperature automatically adjusts the amount of refrigerant needed at the input to meet the demand. In-depth information about the compressor modelling, its equations and the stages presented in Figure 5 can be found in the recent paper by Calleja-Cayón et al. [24].
It is important to take into account the maximum outlet temperature allowed by the compressor manufacturer: for higher temperatures, a lower refrigerant flow rate will be needed, and a higher amount of distillate will be obtained in the MVC. The results of the compressor model, steam mass flow rate, outlet temperature, enthalpy, and pressure, are used as input variables for the evaporator model. Note that compressor manufacturers always limit the outlet temperatures; therefore, the refrigerant flow rate needed to achieve that outlet goal temperature is one of TRNSYS’s compressor model outputs.

4.3. Description of the Modelled Evaporator in MVC

Concerning the evaporator, note that both heat exchanger and the flash tank from the real experimental plant are considered as a unique element in the modelled evaporator. It simplifies energy and mass balances, and it does not affect either input or output flow rates in the evaporator. The mission of the flash tank is separating the steam created in the evaporator from the rest of the liquid brine still remaining in the heat exchanger. The modelled evaporator will operate during heating and concentration stages only; the filling stage is discarded from the model since there are no means for validating its results with real values from the experimental facility. As a result, the evaporator experiment tests two different situations along the MVC’s operation: a first phase, where the internal energy of the evaporator increases until saturation conditions are reached, and a second phase, where the brine is both distilled and concentrated under previously calculated compressor operating conditions, Calleja-Cayón [24].
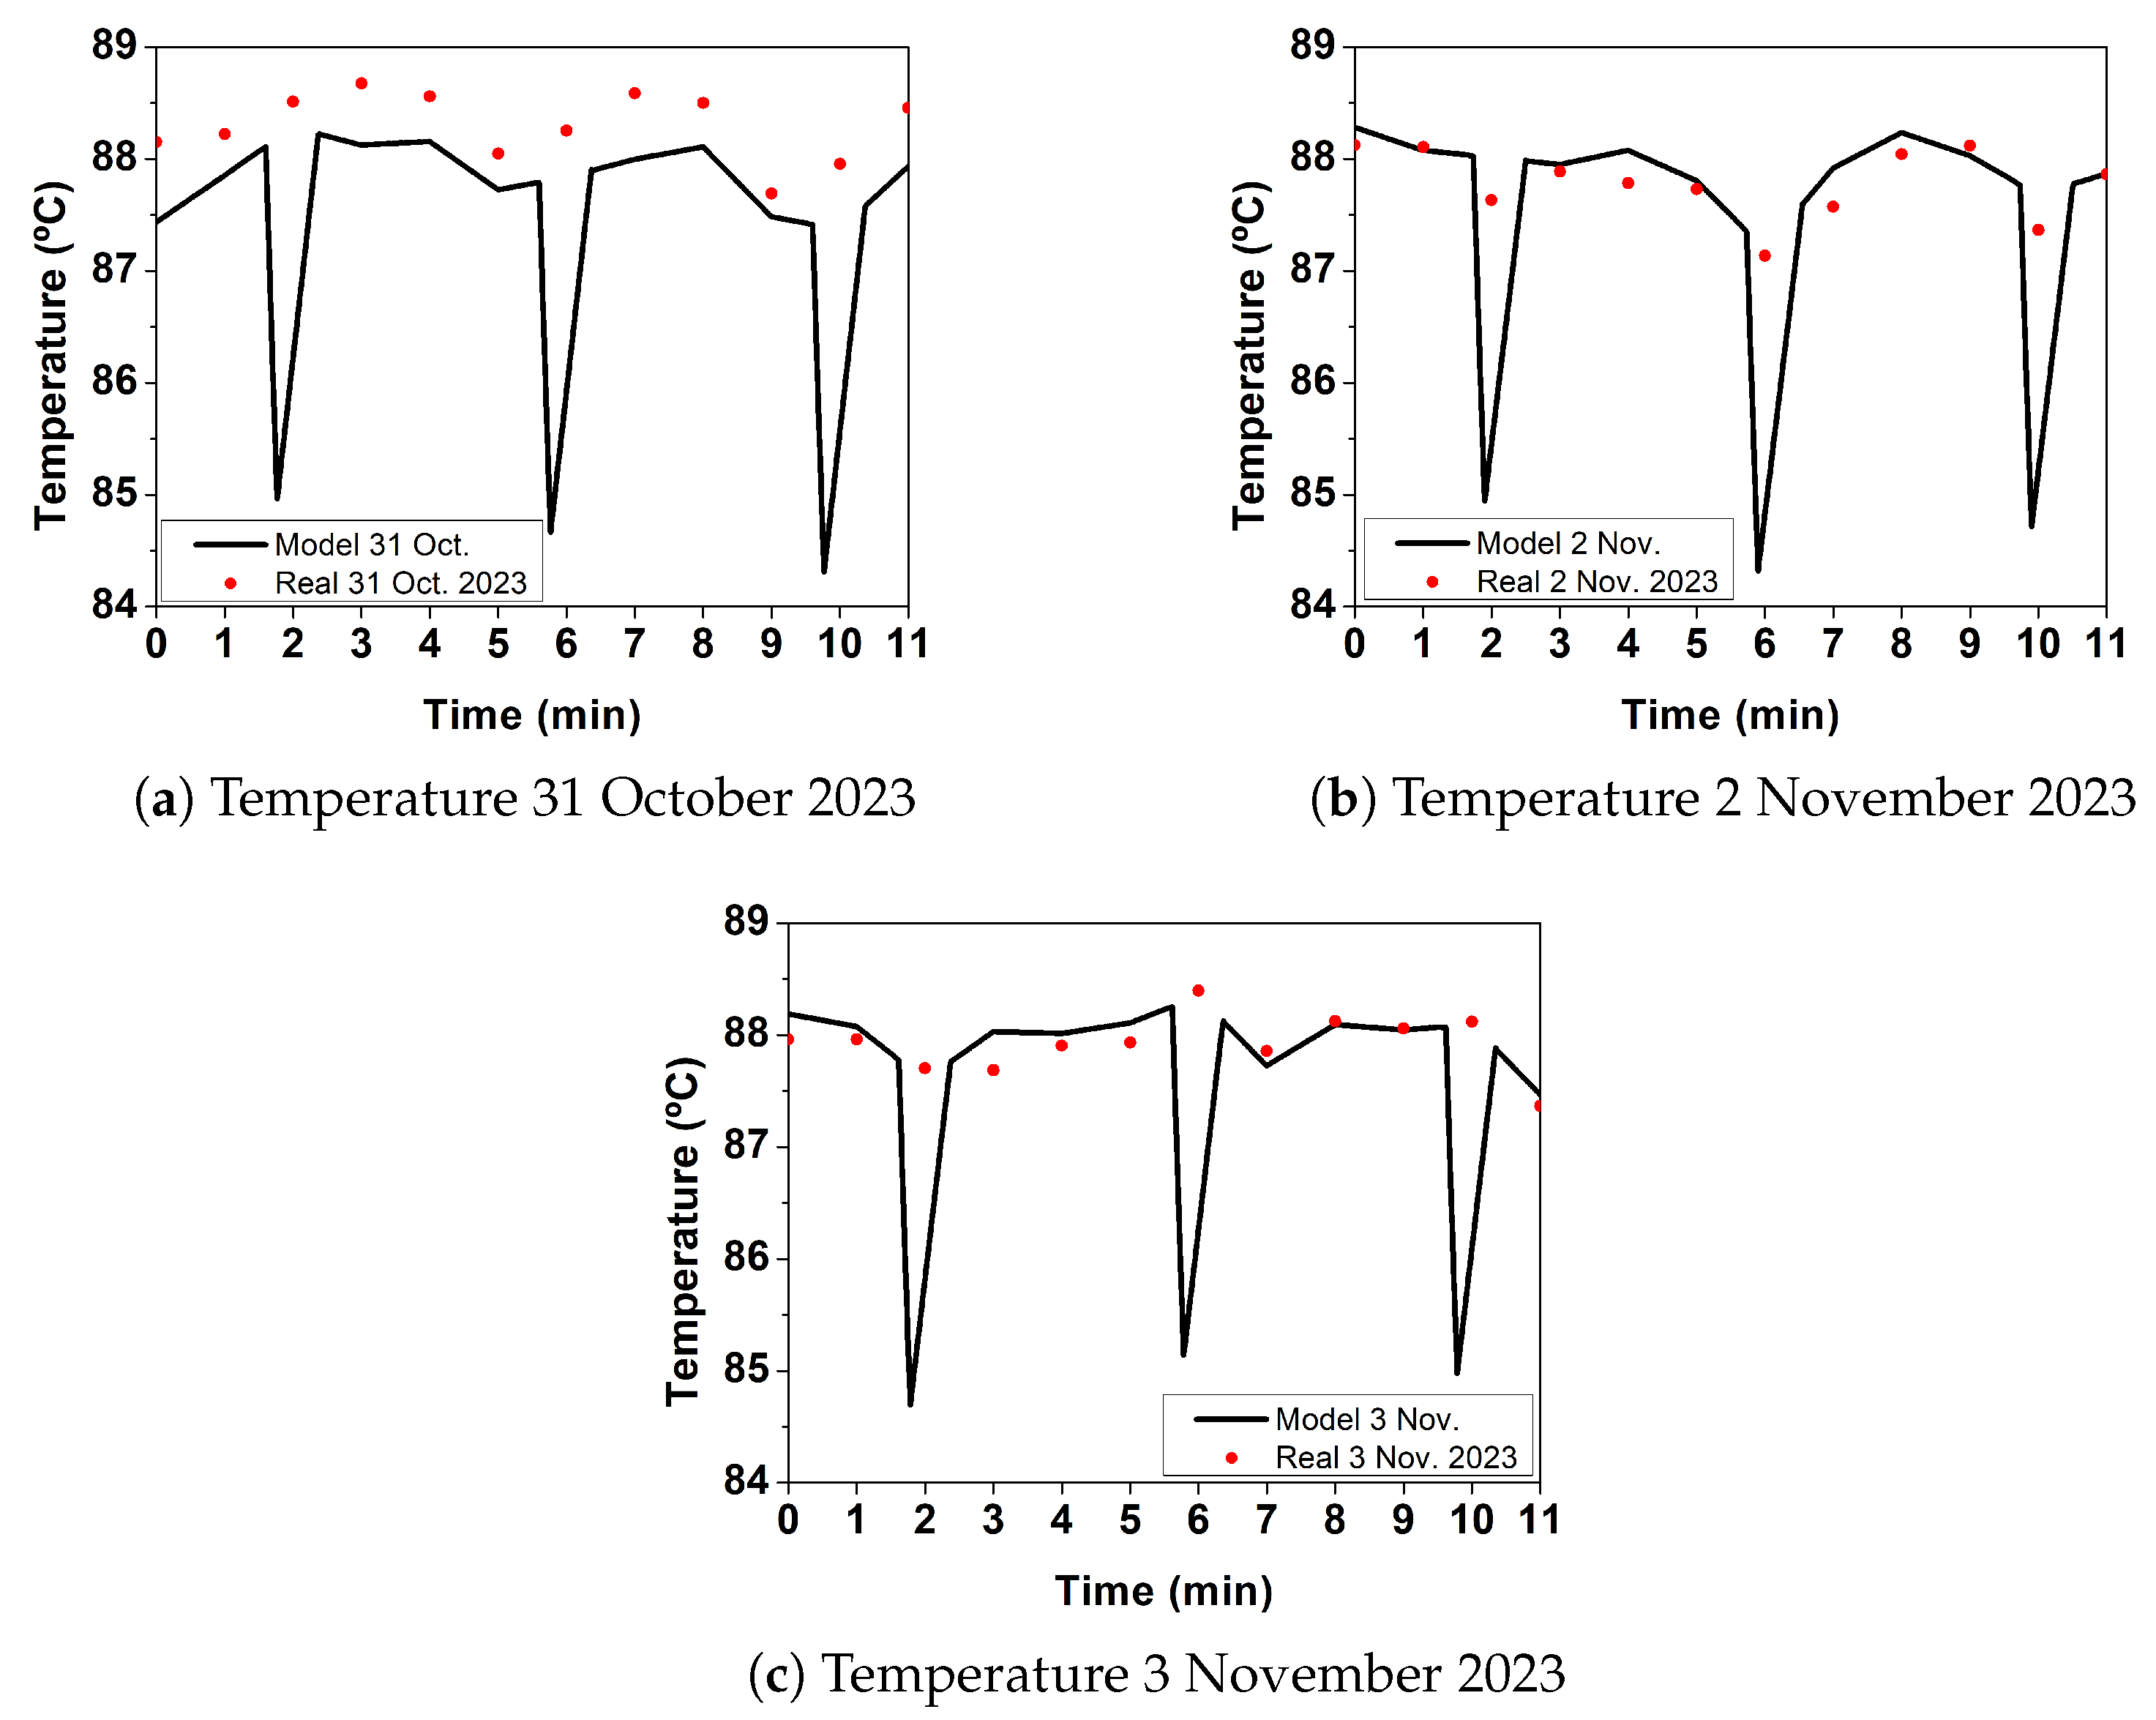
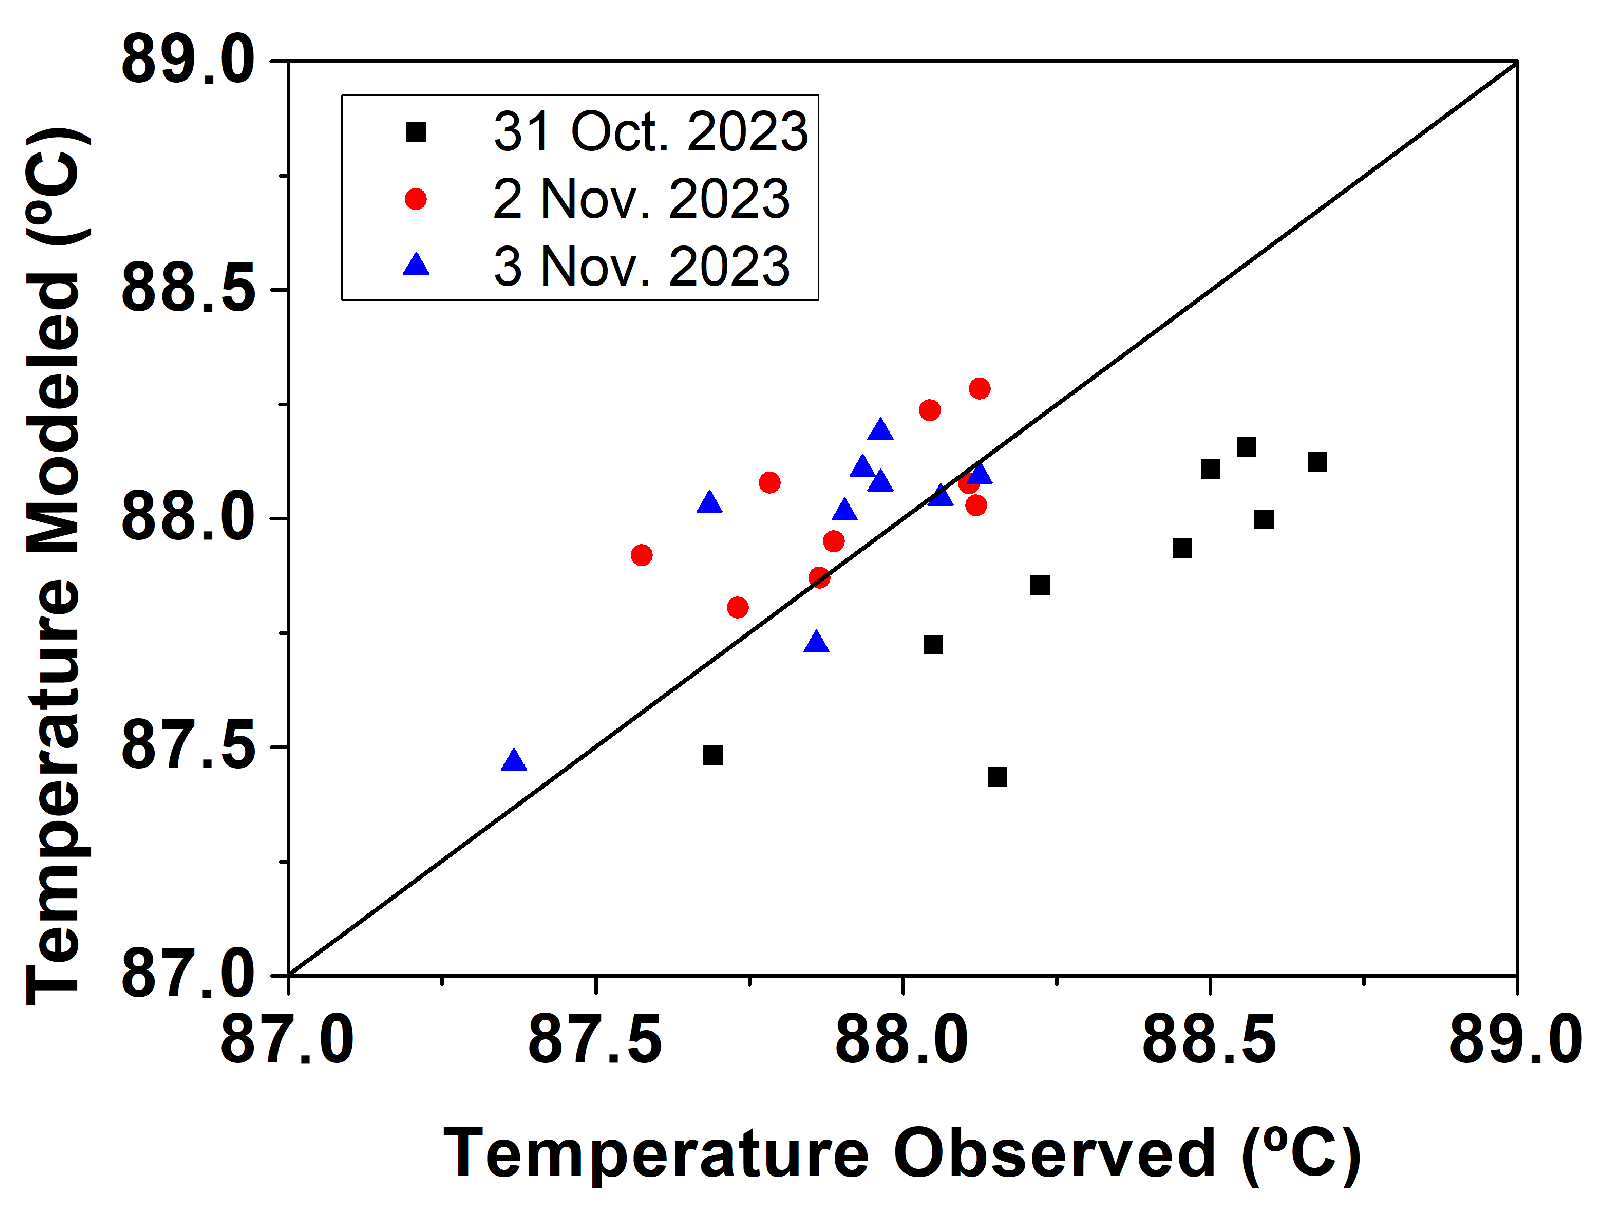
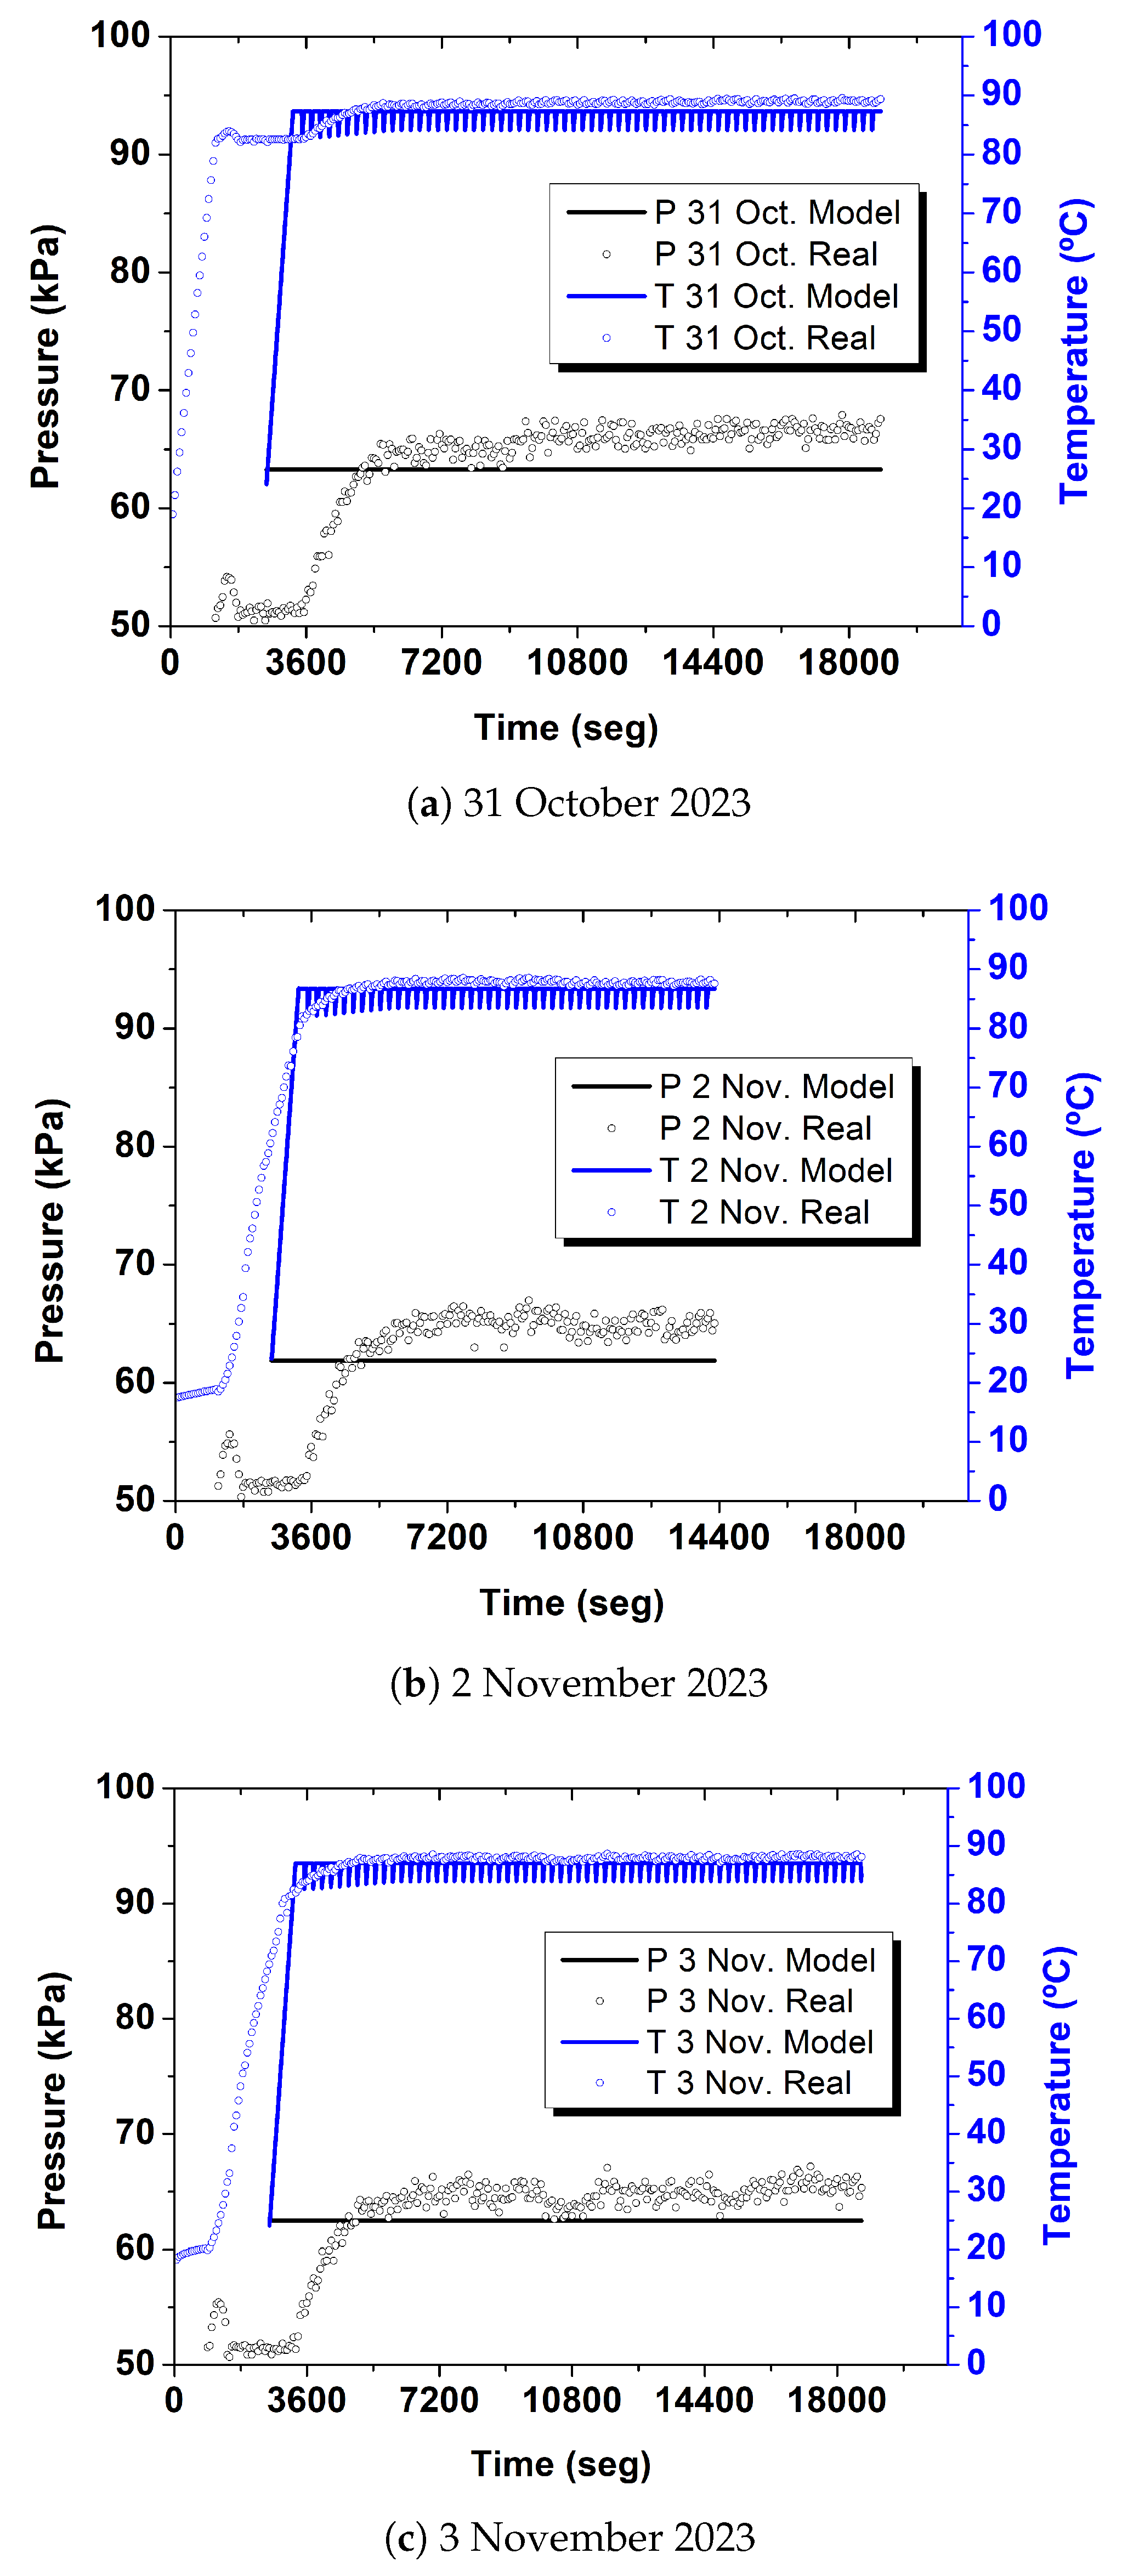
The MVC model and its evaporator are validated with the data registered at the LIFE Desirows’ MVC facility [31]. In these two stages, heating and concentration, different situations can occur depending on both the evaporation process’s time interval and the sensors signals reaching the evaporator. Each situation is called a ‘case’, and each case uses the continuity equations with different input values depending on their incoming and outgoing streams. Each ‘case’ depends on the opening and closing of each of the valves connected to the evaporator, but especially of the relative time within each cycle. This opening and closing of valves generates different situations in the mass and energy balance, reinforcing the importance of a correct definition of each ‘case’. Figure 6 shows a graphical diagram of the steps followed for selecting each ‘case’.
When the MVC begins, the compressor and electric heater are activated, but steam production will be zero until saturation conditions are reached inside the evaporator. This period is called the “Heating Stage” or ‘Case 0’.
Once saturation conditions are reached, the “Concentration Stage” begins, producing distillate (steam) and concentrating the brine inside the evaporator, depending on different situations (‘Cases 1–8’).
In the concentration stage, the model of the evaporator requires two different values for selecting the proper ‘case’: the first one is to know in which moment of the concentration period the time-step is located, Table 2, and second, in case of reaching the maximum or minimum levels, the model decides to open or close valves. For the model, the ‘level’ is calculated with the amount of brine inside the vacuum tank, Table 2, while the real MVC facility disposes of two separate sensors measuring each level.
  • Case 0: Heating stage. AV-0104, AV-0105 and FCV-0101 OFF. The brine inside the evaporator is heated until saturation conditions ( H e v a p = H s a t ), and then the distillation begins.
The equations used to update the evaporator conditions in ‘Case 0’, heated by the auxiliary heating element, are the following:
h e v a p = C p c o l d × T e v a p , p r e v h 0
H e v a p = m e v a p × h e v a p + H h o t , u s e d
T e v a p = H e v a p m e v a p h 0 C p c o l d
where C p c o l d is the specific heat of the cold source (brine), T e v a p , p r e v is the temperature inside the evaporator on the previous time-step, h 0 the tuning factor, m e v a p is the mass of brine inside the evaporator (initial mass of 79 kg), H h o t , u s e d is the heat absorbed from the hot source after losses and T e v a p is the temperature of the evaporator after absorbing that amount of energy. The value of h 0 is constant for each pressure and compares the values of h under saturated liquid conditions.
For the initial time-step, trnsys reads the list of ‘parameters’ and ‘inputs’ introduced in the evaporator’s type (atmospheric conditions), which are meant to be the initial values for the modelling stage, while for the next time-steps, the model will read the value calculated on the previous time-step as the new input value. ‘Case 0’ lasts as long as H e v a p is lower than the product of the initial mass ( m e v a p ) and the specific enthalpy of the saturated liquid ( h s a t . f , c o l d ) at these pressure conditions, when saturation conditions are achieved and evaporation can start. Once the heating stage is finished, it is time for the concentration stage, where (i) brine inside the evaporator is distilled and concentrated, (ii) the concentrated brine is periodically removed, and (iii) once the removal is finished, new inlet brine is introduced to the evaporator, restarting (i). In the model, these situations correspond to Cases 1 to 8:
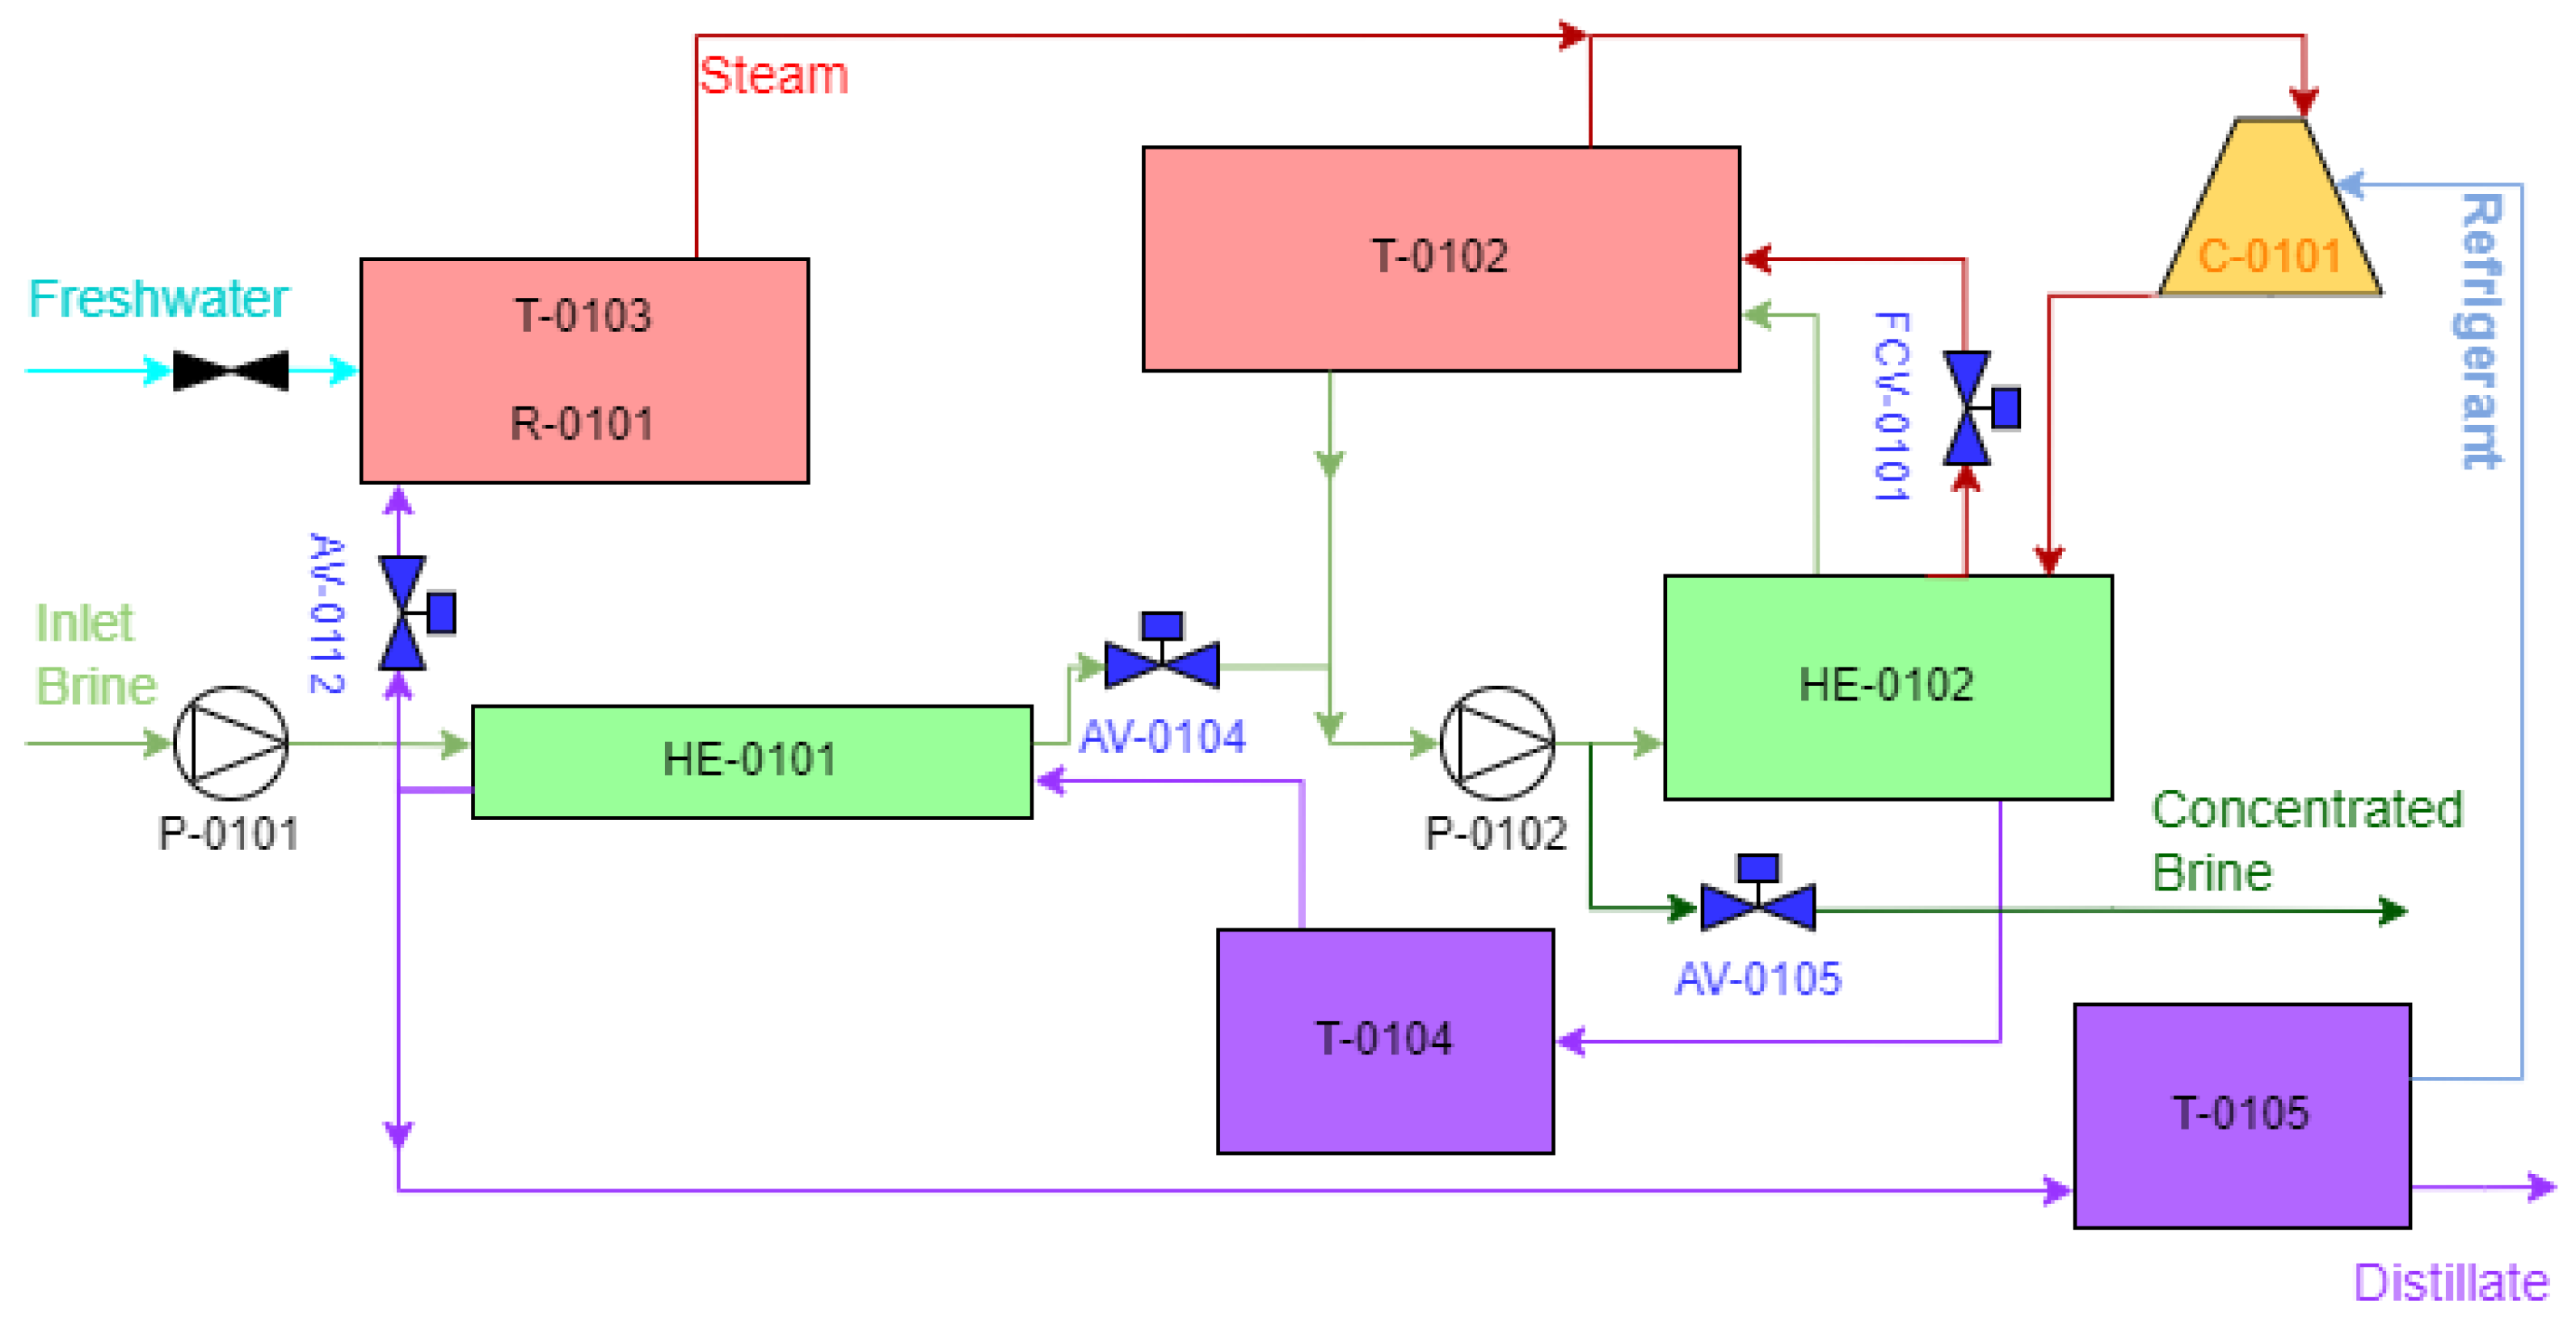
  • Case 1: Brine concentration. AV-0104, AV-0105 and FCV-0101 OFF.
  • Case 2: Brine concentration with evacuation of concentrated brine. AV-0105 ON, AV-0104 and FCV-0101 OFF.
  • Case 3: Brine concentration with refill of brine. AV-0104 ON, AV-0105 and FCV-0101 OFF.
  • Case 4: Brine concentration with evacuation and refill simultaneously. AV-0104 and AV-0105 ON, FCV-0101 OFF.
  • Case 5: Brine concentration with superheated steam input. AV-0104 and AV-0105 OFF, FCV-0101 ON.
  • Case 6: Brine concentration with evacuation and superheated steam input. AV-0104 OFF, AV-0105 and FCV-0101 ON.
  • Case 7: Brine concentration with refill and superheated steam input. AV-0105 OFF, AV-0104 and FCV-0101 ON.
  • Case 8: Brine concentration with evacuation, refill, and superheated steam input simultaneously. AV-0104, AV-0105 and FCV-0101 ON.
For each time-step, with a duration of 1 s , the model starts by reading the variables responsible for the selection of these cases. The parameters used to select each case, listed in Table 2, are LSH-0102, LSL-0102, FCV valve, concentration time, rejection time and filling time.
During concentration stage, Cases 1–8, the equations used for updating the evaporator’s conditions are divided into two groups: those related to the hot source and those related to the treated brine.
H h o t = m h o t × C p h o t × ( T h o t T s a t , h o t ) + m h o t × h f g , h o t
The hot source equation, Equation (4), refers to the heat flux from the compressor. The inlet brine, outlet concentrated brine, and superheated steam flow rates from valve FCV-0101 depend on the opening or closing of the valves AV-0104, AV-0105 and FCV-0101. During the concentration stage and their Cases 1–8, energy and mass balances are applied to the evaporator, Equation (5), and the new evaporator condition is calculated with Equation (6). Subsequently, the generated steam, Equation (7); the new mass in the evaporator, Equation (8); and the new properties, Equation (3), are calculated.
h e v a p , i n t e r m = H e v a p , p r e v + H i n p u t s H o u t p u t s m e v a p , p r e v + m i n p u t s m o u t p u t s m e v a p , f l o w r a t e s = m e v a p , p r e v + m i n p u t s m o u t p u t s i n p u t s = brine & FCV inlet fluxes o u t p u t s = cbrine & steam outlet fluxes
where subscripts brine, cbrine and steam correspond to the inlet and outlet fluxes of brine, concentrated brine and steam, and the mass and enthalpy depend on the opening or closing of valves AV-0104, AV-0105 and FCV-0101. The equations shown in Equation (5) unify the heat exchanger and flash tank in a single set of equations due the interconnection of both flash tank and heat exchanger. Attempting to model both appliances independently, flash tank and heat exchanger, would require introducing artificial internal variables whose uncertainty would exceed that of this simplified approach without any improvement.
The inlet and outlet mass flow through each of the valves mentioned above for Equation (5), if open, and are calculated using the nozzle equation for each time-step.
h e v a p , n e w = m e v a p , f l o w r a t e s × h e v a p , i n t e r m + H h o t m e v a p , f l o w r a t e s
x = h e v a p , n e w h s a t . f , c o l d h f g , c o l d m s t e a m = x × m e v a p , f l o w r a t e s
m e v a p = m e v a p , f l o w r a t e s m s t e a m
h e v a p = m e v a p × h e v a p , n e w m s t e a m × h s a t . g , c o l d m e v a p , f l o w r a t e s m s t e a m H e v a p = m e v a p × h e v a p T e v a p = h e v a p h 0 C p c o l d
To calculate the steam properties, the T y p e 58 found in the TRNSYS library has been used. However, to calculate the brine enthalpy, a new T y p e has been generated that uses the correlation of the isobaric specific heat ( C p ) of seawater, Equations (10) and (11), created by Jamieson in 1969 [33], valid for the temperature range of 0– 180 °C and salinities of 0–180 g/kg and matching the experimental facility’s requirements.
C p b r i n e = A + B · T + C · T 2 + D · T 3 ,
being
A = 5.328 ( 9.76 × 10 2 ) · S + ( 4.04 × 10 4 ) · S 2 B = 6.913 × 10 3 + ( 7.351 × 10 4 ) · S ( 3.15 × 10 6 ) · S 2 C = 9.6 × 10 6 ( 1.927 × 10 6 ) · S + ( 8.23 × 10 9 ) · S 2 D = 2.5 × 10 9 + ( 1.666 × 10 9 ) · S ( 7.125 × 10 12 ) · S 2
Regarding C p of the steam, another formula based on the specific enthalpy (h) and temperatures of the steam and saturation conditions is used. Using TRNSYS Type58, the enthalpy and temperature values of both the saturated steam and the compressor’s outlet can be achieved. These two sets of outputs allow the specific heat capacity value to be calculated using the following correlation:
C p s t e a m = h h s a t . g T T s a t .
The value of C p s t e a m will be considered the same for both the inlet and outlet of the compressor, simplifying the number of equations and with an accumulative error lower than ± 3 % ( C p 56 k P a = 2.02 kJ/kg·K and C p 104 k P a = 2.08 kJ/kg·K), prioritizing the use of Type58 for obtaining h s t e a m over C p s t e a m .
The final relevant output expected from a desalination plant is the final salinity of the waste product, Equation (13). Since the experimental plant measures the conductivity of both the inlet brine and the final concentrated brine each day of operation, a linear conversion from conductivity to salinity is used to validate the model output values, Equation (14).
S a l i n i t y c b r i n e = m b r i n e , t o t a l m c b r i n e , t o t a l × S a l i n i t y b r i n e
S a l i n i t y = ( 0.7317 × C o n d u c t i v i t y ( m S c m ) ) 3.7635
Regarding evaporator operation, it starts with the heating stage. Considering the initial amount of brine inside the evaporator is between L e v e l m a x and L e v e l m i n , it lasts until the total mass of brine inside it reaches saturation conditions. It then continues with the cycle of cases for the concentration stage, which will be on repeat until the desalination plant stops its operation.

4.4. Description of the Other MVC Elements

The rest of the elements present in the MVC plant have a minor impact on the system performance, although they are crucial to maintaining the optimal operating conditions of the system. Some of these elements are electric resistances (R-0101), preheater (HE-0101) and FCV valve (FCV-0101).
  • The electric resistances, located inside the auxiliary heating element (T-0103), are used to provide the additional amount of steam required by the compressor, since the evaporator is not capable of fully covering its demand.
  • The preheater is used to increase the temperature of the inlet brine in the evaporator. It employs the residual energy present in the condensed steam from the evaporator’s hot source outlet, which also requires cooling for its storage and increases the energy efficency of the MVC system.
  • Finally, the FCV valve allows part of the superheated steam from the hot source to be sent to the cold side of the evaporator in cases of low pressures (and consequently low evaporation temperatures) inside the evaporator. This superheated steam bypass allows the evaporator to recover higher evaporation temperatures.
These three important elements in the system behaviour have been modelled using the types available in TRNSYS for modelling the heat input by resistance, once-through heat exchanger and controlled valve. In this model, losses through the connection pipes and the dynamic behaviour that the feed and recirculation pumps may have in the MVC system have not been considered. The types considered for this model are listed in Table 3.

5. Results of Model Validation

Model validation is divided into two parts: the first one, where real instant values from the compressor are introduced in the model and analysed through the evaporator’s temperature registered in the model, and the second one, in which the overall results obtained from the model are compared with the actual overall results measured in the experimental facility at the end of each operating day. The validation data come from three whole days of operation in the experimental facility and, as mentioned in Section 3, the values from the MVC plant are registered every minute to validate the instant model values, while the real production values are used to validate the global performance. Validation datasets are not used for training purposes; their main purpose is understanding which variables are usually measured in real facilities and which variables are not available to validate the model’s outputs. Real outputs are compared to the modelled ones, and their similarity will be the best indicator of the accuracy of the model.
The model considers the steady-state conditions of the compressor corresponding to the set speed of the compressor and its average pressure along the selected validation day for each time-step of the simulation. Pressure losses in the system or pipping and ambient conditions affecting the performance of the system are not considered for the model. The valves included in the model are the one that allows the introduction of new brine (AV-0104), the one that eliminates concentrated brine from the system (AV-0105) and the one that incorporates steam into the evaporator (FCV-0101). Finally, the system considers atmospheric conditions as their initial form, since the MVC plant is started after a long pause of at least 12 h. The parameters measured in the MVC system and their ranges are shown in Table 4.
Several compressor variables are fixed to maintain consistent operating conditions throughout each simulated scenario, as listed in Table 5. Fixing these variables enables a clear identification of their individual impact on the system and the extent of their influence. Moreover, plant operators from the experimental facility confirm this set of variables is the one they are able to modify, which makes this model an intermediate step in the process of automating the system with artificial intelligence.
To validate the model, three datasets will be used, each one representing a typical day of actual plant operation. Each day of operation has associated operating parameters that are implemented and imposed to the model. These operating parameters are concentration cycle time; fresh brine fill time; maximum vapour temperature at the compressor outlet; compressor operating regime; vacuum pressure delivered by the compressor; and compressor outlet pressure. So, the model calculates the mass flow rate at the compressor’s outlet, which is dependent on the shaft speed, the outlet temperature of the compressor and the pressure difference between PT-0101 and PT-0102. Also, the same initial salinity of each validated day is used for the model. Table 6 shows the initial values imposed on the model for the three typical days used for validation.

5.1. Validation of Internal Behaviour of MVC

Despite the accuracy of the model being mostly evaluated by the total amount of distillate created and brine treated, checking that the behaviour of each component conforms to reality along the operation is crucial in order to ensure with certainty that the model is valid. The variable used for the internal behaviour validation is the instantaneous temperature inside the evaporator, TT-0103. In this instantaneous validation process, the compressor’s real behaviour is monitored using its inlet and outlet pressure variables, PT-0101 and PT-0102, and the temperature behaviour inside the evaporator (TT-0103) is the variable used for validating the behaviour. By imposing the registered pressure values on the model, the evaporator’s temperature achieved should be equal to the one registered in the real facility. It also allows observing the influence of the opening and closing of the various valves connected to the evaporator, where new inlet brine at 31 °C is forced to enter the system periodically every 240 s (valve AV-0104, Table 2) to prove the correct operation of the model.
A total of 12 temperatures are compared on each typical day during the concentration phase. The results of three of these simulations for different days can be seen in Figure 7. The figure shows how the modelled temperatures closely match the actual temperatures recorded every minute, over 12 min, at the experimental plant with the TT-0103 sensor, using the registered PT-0101 pressure as input value. The model is able to reproduce the temperature drops due to the opening of AV-0104, allowing new brine to enter the evaporator every 4 min. These temperature changes are not observed in the values recorded at the actual facility since the temperature achieved by the preheater is almost the same as the one inside the evaporator. Moreover, real measurements are spaced 1 min apart, which also limits the observation of instantaneous valve opening and closing effects accurately. Analysing the effect of the cold brine and comparing it with the actual measurements demonstrates the validity of the internal equations considered in all evaporator cases. The reliability of the model is also observed by analysing the dispersion of the evaporator temperature values. For the three days studied, in the scatter of these values in Figure 8, it can be observed that the deviation from the model results is very slight, which reinforces the model reliability considering only sensors that contribute to the energy balance of the system are available in the experimental facility. Since the experimental facility lacks flow meters, instant mass balances are approached from a global amount of distillate produced and brine consumed, the main factor contributing to an R 2 of 0.89 to be considered as reliable for a physical model.

5.2. Validation of Global Performance of MVC

In Section 5.1, the MVC model is validated by replicating the compressor’s real instantaneous working conditions for several minutes. In this subsection, validation is confirmed by ensuring that the model’s total treated and concentrated brine, along with total distillate produced, matches the real plant measurements from the selected study days. Three simulations were performed using the same three datasets from Section 5.1, matching the real facility’s recorded concentration time (time since the first concentrated brine removal). Model validation will be based on the total mass of brine treated and its initial salinity, with distillate production, concentrated brine removed, and final salinity as key validation variables.
Table 7 shows the comparison of the results obtained in the real installation with the results provided by the model. The Relative Error (RE) of the distillate produced, which is dependent on the outlet values of the compressor, remains lower than 7% in every simulation. The deviation between the distillate produced by the model and that recorded in the real evaporator generates the R 2 of 0.89 mentioned in Section 5.1, mainly because the experimental facility does not record the vapour lost to the atmosphere through venting and does not have flow meters along the installation, which forces us to estimate flow rates for the model from the total volume produced for the validation. The R 2 can be improved by incorporating flow meters, as well as by increasing the frequency of data recording by the actual plant. The steady-state conditions of the compressor also contribute to this R 2 result; the use of transient compressor conditions is another method to improve R 2 .
Moreover, a recurrent difference of 30 kg in concentrated brine is observed every simulated day, indicating that during the filling stage 30 kg is introduced into the system. The comparison of the values recorded by TT-0103 (evaporator temperature) and PT-0101 (evaporator pressure) with its modelled results are shown in Figure 9. It is observed that the behaviour of the model is close to reality but without the variability in pressure because the model is not subject to the environmental effects that can cause variations in the compressor’s rotation speed.
The comparison also shows that the model reaches the concentration conditions much sooner than in reality because the losses due to warming the environment have not been taken into account, nor the thermal inertia of the elements of the system. Therefore, the same times and cycles of the concentration stage have been used to calculate the concentrated and distilled mass produced, shown in Table 7.
The final salinity of the concentrated brine is the last measurable output of interest for validating the model, and it is shown in Table 8.
The amount of inlet brine treated matches reality values for all modeled cases, and the model’s distillate production is similar to the ones measured at the experimental plant, so salinity should be expected to be close to the ones registered in the real facility.

6. Conclusions

An MVC model that looks into the interaction between its compressor and evaporator has been successfully generated and validated. It is relevant as these two elements are the most important in the whole MVC system: the vacuum compressor is responsible for generating the operating conditions for the entire system, while the evaporator generates both the desired distillate and the concentrated brine. The presented model allows understanding the extent to which different compressor variables affect the evaporator of an MVC desalination system and their impact on the entire system and compare its results with the information available on the topic of MVC plants. It must be considered that the steady-state conditions of the compressor at each time-step limit applicability under transient behaviour, but the model’s time-step is just 1 s e c and it will be capable of responding to transient conditions too.
The datasets used for validation corresponds to 3 full days of operations, each one of them always surpassing the 3 h of distillate production, with values registered every minute for a total of 33 variables in each dataset (more than 10,000 individual values per dataset as seen in Figure 9). In total, 15 individual variables have been employed for validating the model, while the model has generated more than 350,000 values in each dataset. Three parameters were studied, vacuum pressure, evaporator temperature, and brine salinity, to validate the model and perform a sensitivity analysis of the model’s response to real values, obtaining an R 2 of 0.88722 and a mean absolute error (MAE) of only 6.42% in distillate production, conforming to reality. The model response to colder inlet brine along the simulation also confirms the cases are properly declared, allowing us to recreate a vast variety of parametric studies.
Future contributions include coupling the evaporator model with dynamic conditions in the compressor model, as well as exploring additional ZLD applications and other configurations that can improve MVC plants and their designs and studying to what degree the environment affects the performance of the system. By achieving energy-efficient operation ranges, ZLD plants can benefit from MVC improvements, and at the same time it could increase the integration of RES-powered desalination plants by fomenting this full-electric desalination method. Furthermore, an increase in digital instrumentation within this type of desalination facility would allow not only the introduction of components from the IoT environment but also the recording of data in real time that could serve as learning databases for future artificial intelligence (AI) and digital twins in the water sector, whose mission would be optimizing the cost of water production from seawater, guaranteeing its quality and safety at all times.

Author Contributions

P.C.-C. and F.V.-G.; methodology, P.C.-C.; software, P.C.-C. and A.M.-G.; formal analysis, resources, A.M.-G.; data curation, P.H.-B.; writing—original draft preparation, P.C.-C. and P.H.-B.; writing—review and editing, A.M.-G. and F.V.-G.; supervision, F.V.-G.; funding acquisition, F.V.-G. and A.M.-G. All authors have read and agreed to the published version of the manuscript.

Funding

The authors acknowledge the support of the European LIFE program (Ref. LIFE19 ENV/ES/00447).

Data Availability Statement

Data available by request from authors.

Acknowledgments

Paula Hernández-Baño has grant 22733/FPI/24 from the Seneca Foundation, co-funded by the REGENERA LEVANTE S.L. Región of Murcia (Spain).

Conflicts of Interest

The authors declare no conflicts of interest.

Abbreviations

The following abbreviations are used in this manuscript:
Acronyms
HVACHeating, Ventilation and Air ConditioningMAEMean Absolute Error
MDMembrane DistillationMEDMultiple-Effect Distillation
MSEMean Squared ErrorMVCMechanical Vapour Compression
RERelative ErrorRMSERoot Mean Squared Error
ROReverse OsmosisWAIVWind-Aided Intensified eVaporation
ZLDZero Liquid Discharge
Variables
C p Specific Heat (kJ/kg·C)HEnthalpy (kJ)
hSpecific Enthalpy (kJ/kg)mMass (kg)
m ˙ Mass Flow Rate (kg/s)PPressure (kPa)
QEnergy (kJ) R 2 Regression Coefficient
TTemperature (C)xQuality (%)
Subindex
brineInlet BrinecbrineConcentrated Brine
coldCold Source of the EvaporatorcompCompressor
concenConcentration StageevapEvaporator
fillFilling StageFCVPneumatic Valve
fgPhase-Change, Liquid to GashotHot Source of the Evaporator
intermIntermediate StepmaxMaximum
minMinimumprevPrevious Time-Step
recircRecirculation PumprejectRejection Stage
satSaturation Conditionssat.fSaturated Liquid Conditions (x = 0)
sat.gSaturated Gas Conditions (x = 1)steamSteam, Water Vapour
Components
AV-Automatic ValveC-Compressor
FCV-Pressure Activated ValveHE-Heat Exchanger
LSH-Level Signal HighLSL-Level Signal Low
P-PumpPT-Automatic Manometer
R-Electric ResistancesT-Tank
TT-Automatic Thermometer
Greeks
η Evaporation Efficiency Δ P Pressure Difference (mbar)

References

  1. Hasan, N.; Pushpalatha, R.; Manivasagam, V.S.; Arlikatti, S.; Cibin, R. Global Sustainable Water Management: A Systematic Qualitative Review. Water Resour. Manag. 2023, 37, 5255–5272. [Google Scholar] [CrossRef]
  2. Alnaimat, F.; Ziauddin, M.; Mathew, B. A review of recent advances in humidification and dehumidification desalination technologies using solar energy. Desalination 2021, 499, 114860. [Google Scholar] [CrossRef]
  3. Saha, P.; Tan, X.; Klausner, J.; Abbasi, B.; Benard, A. Comparative investigation on direct contact crossflow and direct contact counterflow packed beds condensers: Experimental and modeling analyses. Appl. Therm. Eng. 2024, 236, 121777. [Google Scholar] [CrossRef]
  4. Sun, Y.; Wang, Q.; Wang, Y.; Yun, R.; Xiang, X. Recent advances in magnesium/lithium separation and lithium extraction technologies from salt lake brine. Sep. Purif. Technol. 2021, 256, 117807. [Google Scholar] [CrossRef]
  5. Prado de Nicolás, A.; Molina-García, A.; García-Bermejo, J.T.; Vera-García, F. Reject brine management: Denitrification and zero liquid discharge (ZLD)—Current status, challenges and future prospects. J. Clean. Prod. 2022, 381, 135124. [Google Scholar] [CrossRef]
  6. Ghazi, Z.M.; Rizvi, S.W.F.; Shahid, W.M.; Abdulhameed, A.M.; Saleem, H.; Zaidi, S.J. An overview of water desalination systems integrated with renewable energy sources. Desalination 2022, 542, 116063. [Google Scholar] [CrossRef]
  7. Kucera, J. Desalination, 2nd ed.; John Wiley & Sons, Ltd.: Hoboken, NJ, USA, 2014. [Google Scholar]
  8. Shamet, O.; Antar, M. Mechanical vapor compression desalination technology—A review. Renew. Sustain. Energy Rev. 2023, 187, 113757. [Google Scholar] [CrossRef]
  9. Wu, Z.W.; Yang, H.C. Solar energy technologies for desalination and utilization of hypersaline brines. Sustain. Energy Fuels 2025, 9, 673–692. [Google Scholar] [CrossRef]
  10. Al-Saidi, M.; Saadaoui, I.; Ben-Hamadou, R. Governing desalination, managing the brine: A review and systematization of regulatory and socio-technical issues. Water Resour. Ind. 2023, 30, 100225. [Google Scholar] [CrossRef]
  11. Alawad, S.M.; Mansour, R.B.; Al-Sulaiman, F.A.; Rehman, S. Renewable energy systems for water desalination applications: A comprehensive review. Energy Convers. Manag. 2023, 286, 117035. [Google Scholar] [CrossRef]
  12. Rahimi-Ahar, Z.; Hatamipour, M.S. Exergy analysis of thermal desalination processes: A review. Clean Technol. Environ. Policy 2023, 26, 1335–1362. [Google Scholar] [CrossRef]
  13. Tucker, C.I.; Bartholomew, T.V.; Dudchenko, A.V.; Mauter, M.S. Component innovations for lower cost mechanical vapor compression. Water Res. 2024, 260, 121950. [Google Scholar] [CrossRef]
  14. Liu, C.; Xu, L.; Wang, Y. Comparative performance evaluation of two compression ways of a singleeffect mechanical vapor compression desalination system. Desalin. Water Treat. 2023, 316, 136–150. [Google Scholar] [CrossRef]
  15. Zhang, H.; Zhang, Z.; Tong, L.; Yang, J.; Wang, L.; Song, Y.; Yu, Z.; Zhang, Y.; Zhang, J. A mechanical vapor compression regeneration system of potassium formate solution: Model development, experimental verification and performance prediction. Desalination 2022, 539, 115940. [Google Scholar] [CrossRef]
  16. Nassrullah, H.; Anis, S.F.; Hashaikeh, R.; Hilal, N. Energy for desalination: A state-of-the-art review. Desalination 2020, 491, 114569. [Google Scholar] [CrossRef]
  17. Aybar, H.S. Analysis of a mechanical vapor compression desalination system. Desalination 2002, 142, 181–186. [Google Scholar] [CrossRef]
  18. Aly, N.H.; El-Fiqi, A.K. Mechanical vapor compression desalination systems—A case study. Desalination 2003, 158, 143–150. [Google Scholar] [CrossRef]
  19. Sheta, M.; Elwardany, A.; Ookawara, S.; Hassan, H. Energy analysis of a small-scale multi-effect distillation system powered by photovoltaic and thermal collectors. J. Energy Syst. 2023, 7, 89–105. [Google Scholar] [CrossRef]
  20. Sheta, M.; Hassan, H. Investigation of multi-effect mechanical vapor compression desalination system powered by photovoltaic/thermal, photovoltaic-evacuated tubes, and photovoltaic solar collectors: Techno-economic study. Appl. Therm. Eng. 2024, 236, 121584. [Google Scholar] [CrossRef]
  21. Elsayed, M.L.; Mesalhy, O.; Mohammed, R.H.; Chow, L.C. Transient and thermo-economic analysis of MED-MVC desalination system. Energy 2019, 167, 283–296. [Google Scholar] [CrossRef]
  22. Rostami, S.; Ghiasirad, H.; Rostamzadeh, H.; Kalan, A.S.; Maleki, A. A wind turbine driven hybrid HDH-MED-MVC desalination system towards minimal liquid discharge. S. Afr. J. Chem. Eng. 2023, 44, 356–369. [Google Scholar] [CrossRef]
  23. Calleja-Cayon, P.; Molina-Garcia, A.; Vera-Garcia, F. Mechanical vapor compression and renewable energy source integration into desalination process LIFE-Desirows case example. Therm. Sci. 2024, 28, 4395–4405. [Google Scholar] [CrossRef]
  24. Calleja Cayón, P.; Pakere, I.; Vera García, F. Mechanical Vapor Compression Desalination Process: Approaches to Optimize Compressor’s Consumption for Brine Valorization. Environ. Clim. Technol. 2024, 28, 477–489. [Google Scholar] [CrossRef]
  25. Desirows, L. Life Desirows (LIFE19ENV/ES/00447). Available online: https://lifedesirows.eu/ (accessed on 12 September 2022).
  26. TRNSYS. TRNSYS: Transient System Simulation Tool. Available online: http://www.trnsys.com/index.html (accessed on 9 September 2022).
  27. Vera-García, F.; Rubio-Rubio, J.; López-Belchí, A.; Hontoria, E. Modelling and real-data validation of a logistic centre using TRNSYS: Influences of the envelope, infiltrations and stored goods. Energy Build. 2022, 275, 112474. [Google Scholar] [CrossRef]
  28. Massaguer, E.; Massaguer, A.; Montoro, L.; Gonzalez, J.R. Development and validation of a new TRNSYS type for the simulation of thermoelectric generators. Appl. Energy 2014, 134, 65–74. [Google Scholar] [CrossRef]
  29. Quesada, B.; Sánchez, C.; Cañada, J.; Royo, R.; Payá, J. Experimental results and simulation with TRNSYS of a 7.2 kWp grid-connected photovoltaic system. Appl. Energy 2011, 88, 1772–1783. [Google Scholar] [CrossRef]
  30. Delgado Marín, J.P.; Garcia-Cascales, J.R. Dynamic simulation model and empirical validation for estimating thermal energy demand in indoor swimming pools. Energy Effic. 2020, 13, 955–970. [Google Scholar] [CrossRef]
  31. Hernández-Baño, P.; Molina-García, A.; Vera-García, F. Data-Monitoring Solution for Desalination Processes: Cooling Tower and Mechanical Vapor Compression Hybrid System. Sensors 2024, 24, 2909. [Google Scholar] [CrossRef]
  32. Kalogirou, S.A. Seawater desalination using renewable energy sources. Prog. Energy Combust. Sci. 2005, 31, 242–281. [Google Scholar] [CrossRef]
  33. Jamieson, D.; Tudhope, J.; Morris, R.; Cartwright, G. Physical properties of sea water solutions: Heat capacity. Desalination 1969, 7, 23–30. [Google Scholar] [CrossRef]
Figure 1. Single-effect Mechanical Vapour Compression system used in LIFE-Desirows project [25].
Processes 13 01963 g001
Figure 2. Single-effect Mechanical Vapour Compression system scheme.
Processes 13 01963 g002
Figure 3. Proposed methodology. Model and validation of the evaporator with TRNSYS.
Processes 13 01963 g003
Figure 4. MVC model in TRNSYS.
Processes 13 01963 g004
Figure 5. Graphical description of the steps followed to obtain the compressor model results with TRNSYS from the information available from the compressor manufacturer.
Processes 13 01963 g005
Figure 6. Graphical summary of the steps the model follows to differentiate and autonomously select each ‘Case’ of the Evaporator.
Processes 13 01963 g006
Figure 7. Simulation of 12 points with real pressure values along 11 min of operation. New inlet brine enters the evaporator every 4 min at 31 °C.
Processes 13 01963 g007
Figure 8. Scatter plot comparing observed temperature values against their modelled representation.
Processes 13 01963 g008
Figure 9. Comparison between real values of absolute pressure, in kPa, and temperature, in C, and their model version.
Processes 13 01963 g009
Table 1. Elements of the MVC plant.
ElementFunctionElementFunction
R-0101Electric resistances.C-0101Compressor.
P-0101Inlet brine pump.P-0102Recirculation pump.
HE-0101Pre-heater.HE-0102Evaporator, heat exchanger.
T-0103Auxiliary heating element.T-0102Evaporator, flash tank.
T-0104Distillate exiting HE-0102.T-0105Distillate exiting HE-0101.
AV-0104Feed brine valve.AV-0105Concentrated brine valve.
FCV-0101Flow control valveAV-0112Distillate for auxiliary heat
HE-0102 to T-0102. source.
LSH-0102High brine level in T-0102.PT-0101Pressure inside T-0102.
LSL-0102Low brine level in T-0102.PT-0102Pressure C-0101 outlet.
TT-0103Temperature inside T-0102.TT-0107Temperature HE-0102 inlet.
TT-0105Temperature C-0101 inlet.TT-0106Temperature C-0101 outlet.
Table 2. List of variables considered for selecting each ‘case’ of the evaporator at every time-step.
VariableDefinitionValueUnit
L e v e l m a x Maximum amount of brine allowed inside88kg
the evaporator, LSH-0102
L e v e l m i n Minimum amount of brine allowed inside60kg
the evaporator, LSL-0102
T i m e c o n c e n Amount of time impose for concentrating240s
brine, including filling and removal of
concentrate, cycle time span
T i m e r e j e c t Amount of time the valve in charge of4s
removing concentrated brine is open
each concentration cycle
T i m e f i l l Amount of time the valve in charge of10s
inserting new brine is open each cycle
FCVPneumatic valve in charge of introducing0–100%
steam from the outlet of the compressor
when the pressure inside the evaporator
is too low, FCV-0101
Table 3. List of ‘types’ used in the MVC model.
FunctionTypeLibrary
CalculatorInsert new equationAssembly
Compressor2037Custom
Cpbrine2024Custom
Cpsteam2023Custom
Evaporator2047Custom
FCV valve2043Custom
ForcingFunctions14hUtility
Interpolation42bUtility
Printer25cOutput
Propertiessteam58Physical Phenomena
Quality (x)2044Custom
Salinityfinal2027Custom
Table 4. Elements of the MVC system considered for the model, with their ranges.
ElementDescriptionFunctionValue
P-0101Inlet brine pumpIntroducing new brine to the system0–0.8 kg/s
P-0102Recirculation pumpRemoving concentrated brine0–0.8 kg/s
T-0102Evaporator, flash tankInternal mass of the fluid60–88 kg
AV-0104Feed brine valveIntroducing new brine to the systemOn–Off
AV-0105Concentrated brine valveRemoving concentrated brineOn–Off
AV-0112Distillate for auxiliary-heatRefilling of this tank withOn–Off
sourcethe produced distillate
FCV-0101Vapour recirculation toIn case of extreme low pressure inside0–100%
flash tank (T-0102).T-0102, steam from C-0101 is bypassed
LSH-0102High brine level in T-0102Activates AV-0105(True–False), 88 kg
LSL-0102Low brine level in T-0102Activates AV-0104(True–False), 60 kg
PT-0101Pressure inside T-0102Manometer inside the evaporator45–101 kPa
PT-0102Pressure C-0101 outletManometer in C-0101 outlet101–109 kPa
TT-0103Temperature inside T-0102Temperature of produced steam0–100 C
TT-0105Temperature C-0101 inletTemperature of inlet steam0–100 C
TT-0106Temperature C-0101 outletTemperature of outlet superheated steam105–130 C
TT-0107Temperature HE-0102 inletTemperature of inlet superheated steam105–130 C
Table 5. List of user-friendly variables considered for the compressor model validation.
VariableDefinitionValueUnit
Δ P Pressure difference between compressor’s380–500mbar
inlet and outlet
P e v a p Pressure inside the evaporator, cold51–63kPa
side of the evaporator
T s e t Temperature set for the outlet of the110–120C
compressor
RPMsSpeed of the compressor3000rpm
Table 6. Input conditions from the selected days for the model and fixed daily average values.
Day t concen t fill t reject RPM T outlet m ˙ Compressor P Evaporator P Comp Salinity initial
(dd mm yyyy) (s) (s) (s) (rpm) (C) (g/s) (kPa) (kPa) (g/kg)
30 October 2023240104300011013.00363.289104.80517.75
2 November 2023240104300011012.58361.887104.80526.48
3 November 2023240104300011012.75562.464104.80526.94
Table 7. Comparison between simulated and measured data showcasing accuracy through quantitative metrics.
DayInlet BrineConcentrated BrineDistillateR.E.
(dd mm yyyy) (kg) (kg) (kg) (%)
31 October 2023380210.00148.50
31 October Model380240.69139.316.19
2 November 2023270140.00104.00
2 November Model270170.8998.115.66
3 November 2023370200.00144.50
3 November Model370229.69140.312.90
MAE (%) 6.42333
R 2 0.88722
MSE 45.5681
RMSE 6.75
Table 8. Conversion from conductivity to salinity; real values compared to modelled ones.
DayTimeCond. InletSal. InletCond. OutletSal. OutletMAE
(dd mm yyyy) (h) ( μ S/cm) (g/kg) ( μ S/cm) (g/kg) (%)
31 October 20234.3329,40017.7541,70026.75
31 October Model4.3329,40017.7543,43928.021.27
2 November 20233.0641,34026.4860,76040.69
2 November Model3.0641,34026.4861,98941.590.90
3 November 20234.2741,96026.9465,38044.08
3 November Model4.2741,96026.9464,45343.400.68
Disclaimer/Publisher’s Note: The statements, opinions and data contained in all publications are solely those of the individual author(s) and contributor(s) and not of MDPI and/or the editor(s). MDPI and/or the editor(s) disclaim responsibility for any injury to people or property resulting from any ideas, methods, instructions or products referred to in the content.

