Article

Evaluation of Mechanical Properties and Environmental Impact of Red Mud-Based Silty Soil Modified by Inorganic Binding Materials

1
School of Intelligent Construction and Civil Engineering, Zhongyuan University of Technology, 41 Zhongyuan Road, Zhengzhou 450007, China
2
State Key Laboratory of Geomechanics and Geotechnical Engineering, Institute of Rock and Soil Mechanics, Chinese Academy of Sciences, Wuhan 430071, China
*
Author to whom correspondence should be addressed.
Processes 2025, 13(7), 1955; https://doi.org/10.3390/pr13071955
Submission received: 13 May 2025 / Revised: 12 June 2025 / Accepted: 18 June 2025 / Published: 20 June 2025
(This article belongs to the Section Materials Processes)

Abstract

Red mud (RM) is a byproduct of aluminum production, and silty soil (S) has poor engineering characteristics. The enhancement and utilization of RM and S in highway engineering are suggested to address these problems. Therefore, the mechanical properties of red mud-based silty soil (RMS) under different modified materials and their impact on the environment should be investigated. Unconfined compressive strength test, splitting tensile strength test, microscopic test, and environmental index tests were conducted on the modified red mud-based silty soil with varying cement (C), lime, and fly ash (LF) contents. The results show that when the red mud content is 20%, cement-modified red mud-based silty soil (C-RMS) exhibits the highest strength, as well as superior toughness and deformation resistance. At a red mud content of 23% and lime-fly ash content of 20%, lime-fly ash modified red mud-based silty soil (LF-RMS) demonstrates the highest strength and improved deformation characteristics. According to the Technical Guidance on the Construction of road surface infrastructure, C-RMS may be used for the base of secondary and intermediate roads (3.5 MPa~4.5 MPa) or the base of main roads (2.5 MPa~3.5 MPa). The LF-RMS may be used on the surface of motorways and main roads (≥1.1 MPa) or on the lower slopes (≥0.8 MPa). The environmental indices of LF-RMS are slightly inferior to those of C-RMS. This research provides valuable insights for future studies on the road use of red mud.

1. Introduction

Red mud (RM) is a solid waste generated in the industrial production process of Al2O3 [1]. For every ton of alumina produced, 1–2 tons of red mud are also generated [2,3]. With the rapid development of the global aluminum mining industry, the global stockpile of red mud has reached 4 billion tons, with annual emissions as high as 120–150 million tons [4]. A significant amount of red mud cannot be effectively utilized and is only disposed of in large landfills, which not only causes it to occupy a large amount of land but also results in serious environmental damage due to the alkali present in the red mud [5]. In addition, properties such as small particle size, heavy metal elements, and radioactive substances make large-scale comprehensive utilization difficult [6,7]. Therefore, finding efficient ways to utilize and treat red mud is an urgent issue that needs to be addressed.
Currently, scientists are primarily focused on researching the recycling of red mud, with particular emphasis on the extraction and recovery of valuable metals [8], materials for environmental remediation [9], and their use as backfill materials for buildings and roads [10], Roy et al. [11], Habibi et al. [12] and Agrawal et al. [13,14] have proposed various methods such as magnetizing sintering, carbothermal reduction, microwave-assisted reduction, acid leaching reduction, and combinations thereof to extract residual minerals containing bauxite and valuable metals. In addition, Loebsack et al. [15], Zhang et al. [16], and Oprčkal et al. [17] have modified red mud by incorporating special improvers that serve as adsorbents or catalysts to remove pollutants in the atmosphere, waste in wastewater, or heavy metals in soil to achieve the goal of waste treatment with waste. The methods mentioned above are technically and theoretically feasible. However, the process is complex, the equipment requires precision, and the cost is high, making it difficult to achieve large-scale promotion and application. Moreover, the consumption of red mud is relatively small, which does not effectively address the social and environmental problems caused by its large accumulation. Nevertheless, the use of red mud in road construction represents a comprehensive approach that can facilitate the large-scale consumption of red mud [18,19]. Numerous scientists have conducted extensive research into the use of red mud as a building material. For instance, Wang et al. [20] investigated the technical characteristics and environmental impacts of using red mud to enhance volcanic ash as a sustainable roadbed material. Their results showed that both pH and heavy metal levels remained within safe limits when red mud levels did not exceed 15%. Similarly, Singh et al. [21] explored the feasibility of incorporating red mud as a partial replacement for cement in rigid road surface structures. Their study found that concrete mixed with red mud met safety and toxicity standards while exhibiting significant increases in compressive strength (14.01%), bending strength (6.74%), and splitting tensile strength (7.58%) after 28 days of curing. Salim et al. [22] examined the role of red mud as a binding agent in cement-based composites, and their study demonstrated that incorporating 10% to 20% red mud could improve the mechanical strength and durability of cement-based composites. Singh et al. [23] discovered that red mud, iron tailings, and zinc tailings could be utilized as geopolymer binders to stabilize soil for roadbed applications. The experimental findings showed that the unconfined compressive strength of untreated soil increased from 0.39 MPa to 5.24 MPa after the application of red mud-based geopolymer. Saranya et al. [24] designed a new binder made of red clay and iron powder and investigated whether it could serve as a sustainable alternative to traditional building materials based on cement. The results show that red iron-mixture carbonate binder containing oxalic acid can increase the strength of concrete building materials. In addition, Du et al. [25] explored the possible application of a CaO/CaSO4 composite activator in red mud-based polymers. The results suggest that the composite activator can improve the properties of red mud-based polymers, with the optimal composition containing 5% CaO and 10% CaSO4. Chandra et al. [26] and Koshy et al. [27] discussed the use of red mud–fly ash geopolymer composite materials in roadbed materials, and the test results confirmed that geopolymer composite materials meet the required strength and can be used as roadbed materials for road construction. Furthermore, Liu et al. [28] studied the feasibility of using Bayer red mud in road construction and evaluated its strength performance when stabilized by two ashes (lime and fly ash) using an orthogonal test method. The results show that factors affecting both 7-day and 28-day compressive strength include the lime-to-fly ash ratio, the chemical composition of the red mud, and the amount of lime and fly ash used.
It is evident that when red mud and red mud-based modified materials are utilized as roadbed fillers in engineering applications, they exhibit relatively good road performance and achieve a relatively high load-bearing capacity. From the perspectives of road performance and environmental protection, red mud and red mud-based modified soil can serve as viable roadbed fillers. Previous studies have predominantly focused on red mud as a substitute or additive for cement; however, limited research has systematically investigated the application of the composite system of red mud and cement in enhancing the properties of silty soil. Lime-fly ash binder has been extensively employed in soil stabilization, yet its durability and environmental adaptability remain areas requiring improvement. A novel composite binder system incorporating red mud has been developed. Through a comparative analysis of these two types of red mud-based modified soils, the effectiveness of the composite system comprising red mud, cement, and lime-fly ash binder in improving the performance of silty soil was assessed. The optimal dosage of red mud and the optimal formulation of the composite system were determined, leading to the proposal of a sustainable soil stabilization scheme based on red mud. Moreover, the fine particle size of red mud can fill the pores in silty soil, reducing water infiltration and thereby enhancing the soil’s resistance to erosion and its load-bearing capacity. This addresses the issues of poor particle grading, strong capillary action, poor water stability, and the difficulty in meeting engineering construction requirements in silty soil.
In this study, Bayer red mud (RM) was chosen as the research focus, with typical silt (S) from Zhengzhou, China, used as the base material. Unconfined compressive strength and splitting tensile strength tests were carried out on the modified red mud-based silty soil with varying contents of cement (C), lime, and fly ash (LF). The unconfined compressive strength and splitting tensile strength of cement-modified red mud-based silty soil (C-RMS) and lime-fly ash-modified red mud-based silty soil (LF-RMS) were compared and analyzed to determine the optimal ratio. Finally, representative specimens were selected to test the environmental indicators of C-RMS and LF-RMS against the recommended ratios and to comparatively analyze and evaluate their impact on the environment.

2. Experimental Materials and Methods

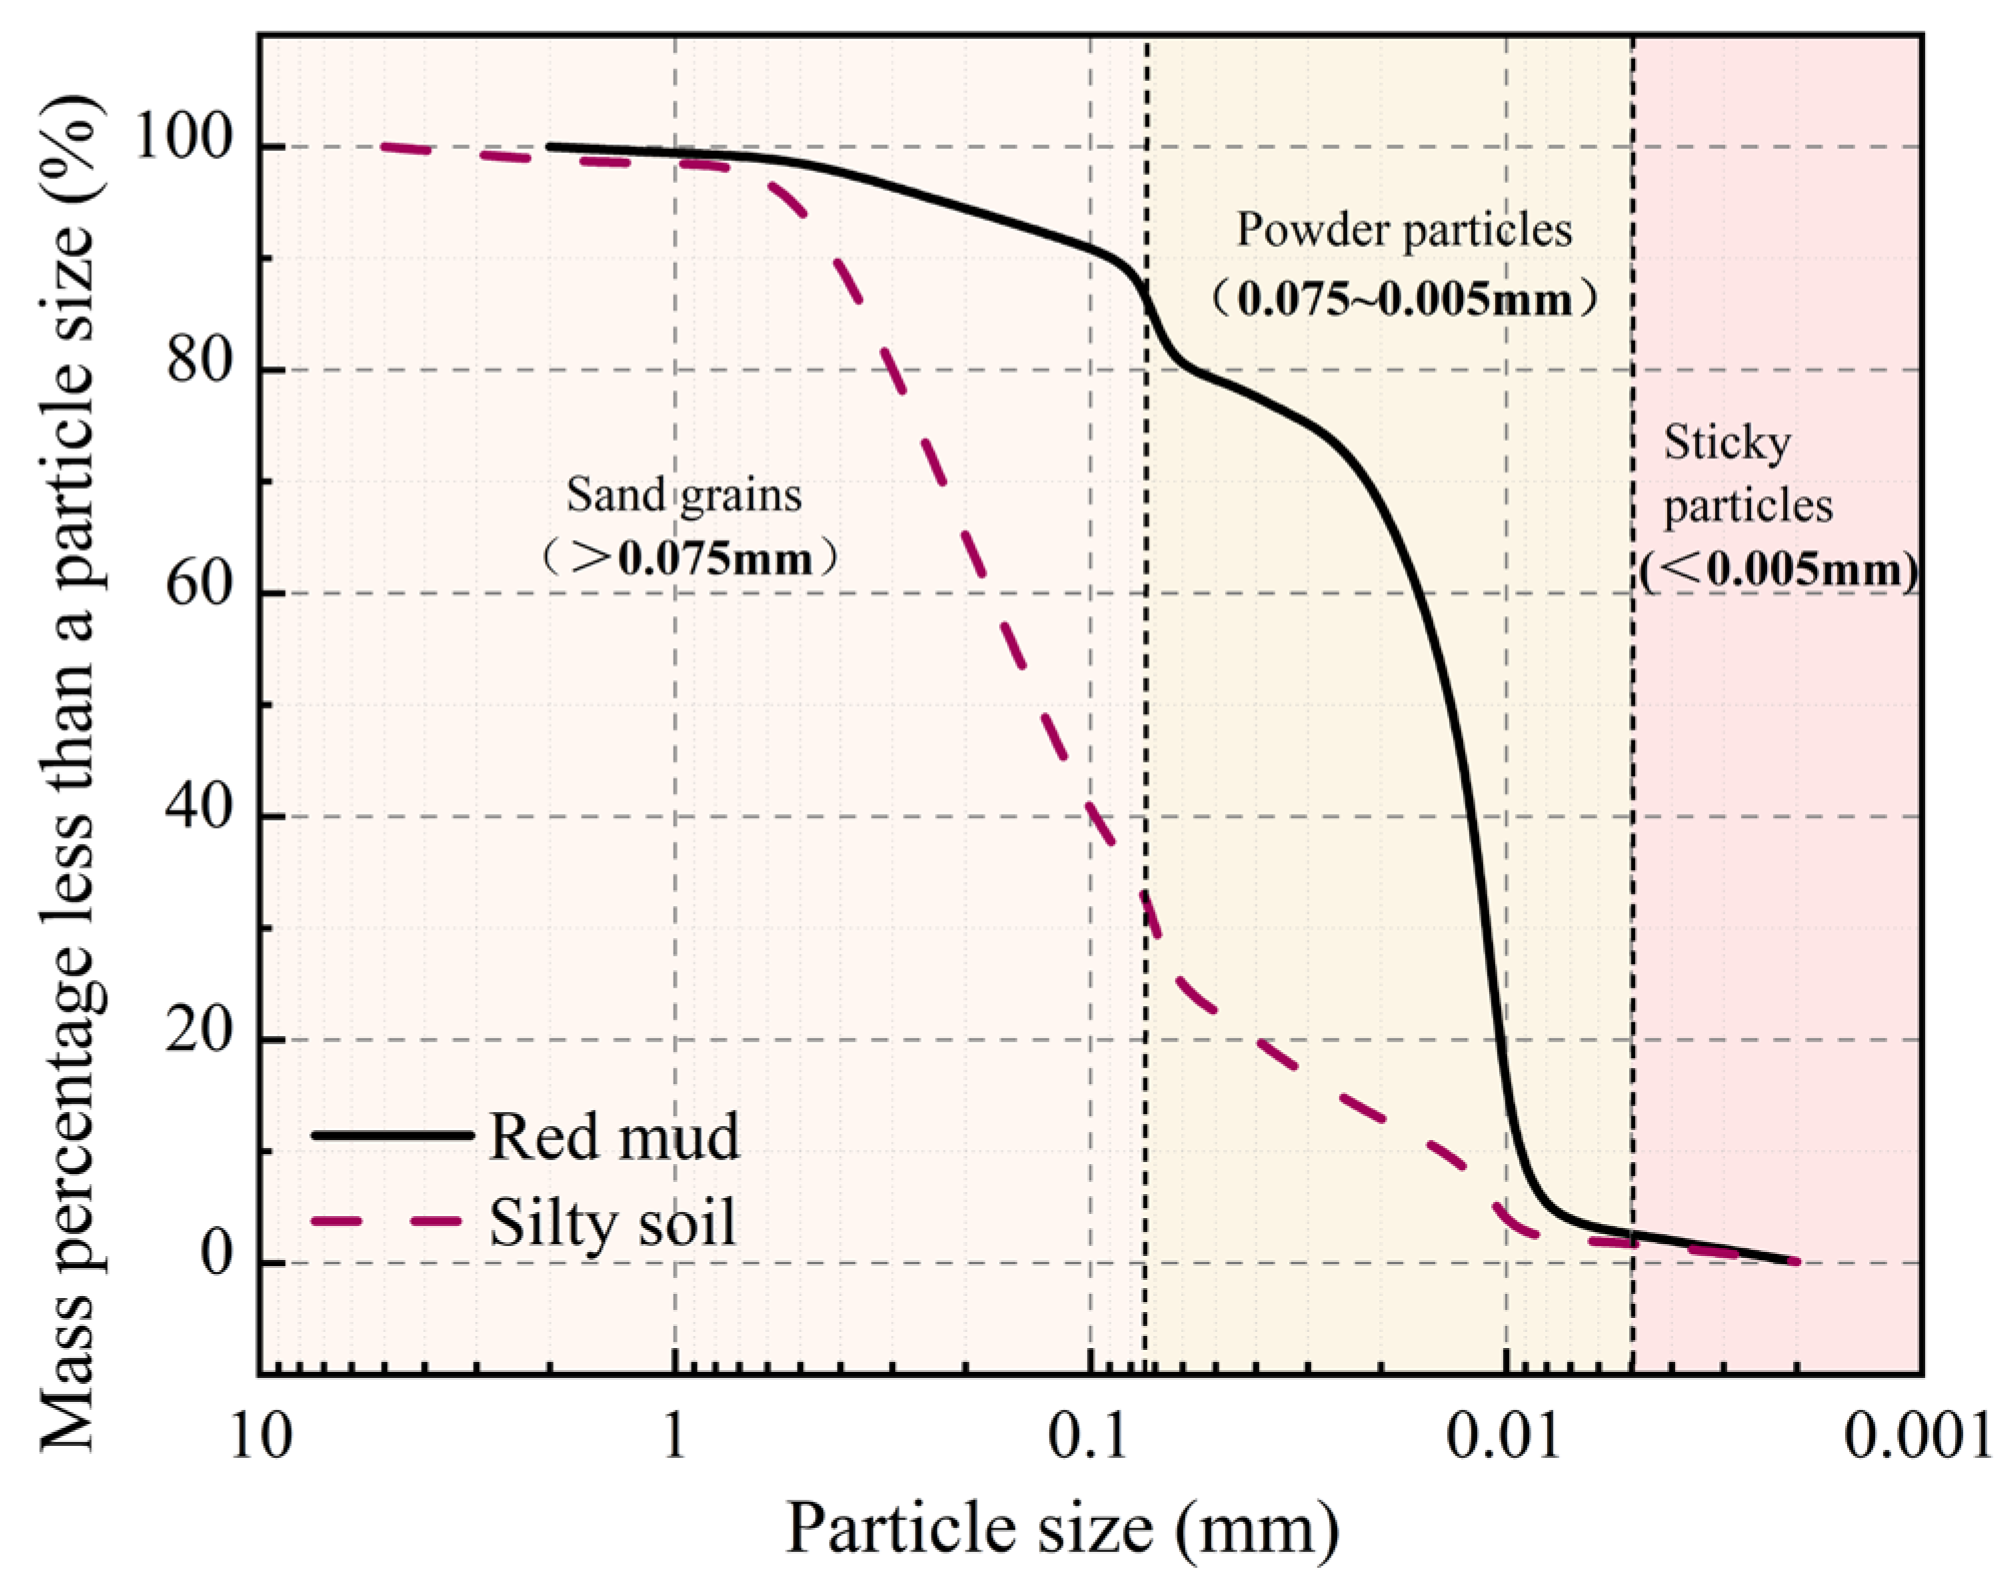
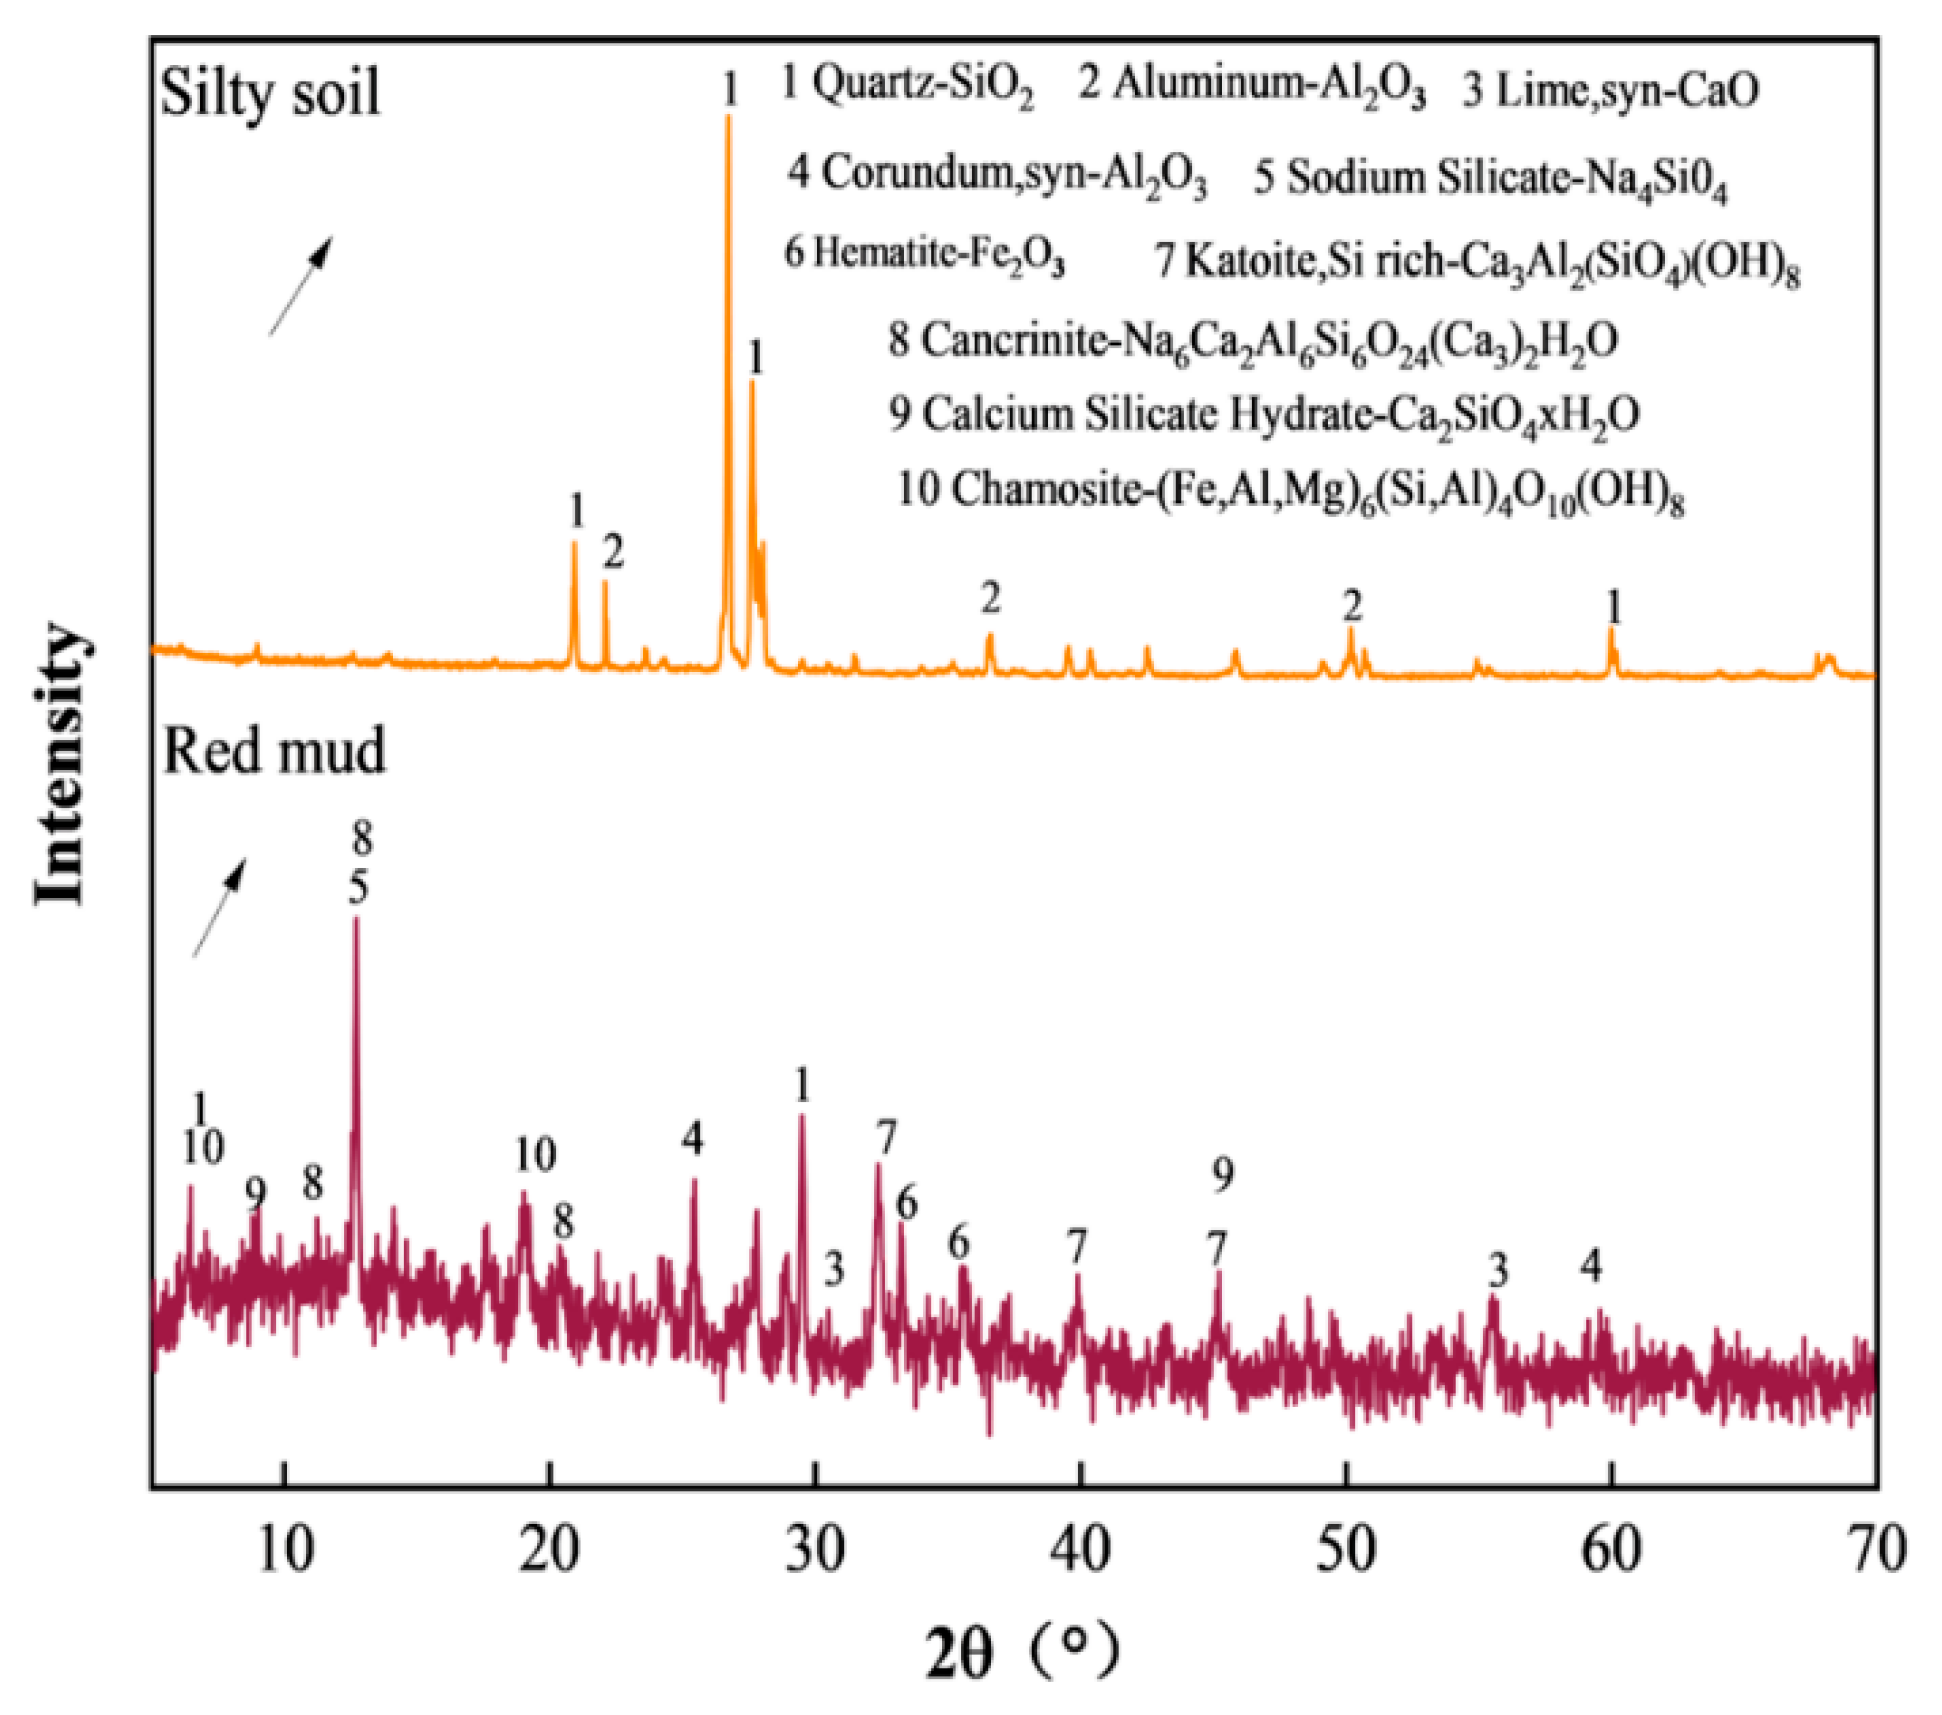
2.1. Experimental Materials

Red mud (RM) was obtained from bauxite factories in Henan Province, China. As shown in Table 1, the main chemical components of red mud are Al2O3, Fe2O3, SiO2, and CaO. The lime used in the experiment was selected from Huihui Industrial Co., Ltd. in Xinyu, Jiangxi Province, China. The main component of lime is CaO, with a content of 95.60%, which classifies it as second-class lime. The fly ash used in the test was selected from Henan Dingnuo Purification Materials Co., Ltd. Fly ash is mainly composed of glassy SiO2 powder, which is rich in active ingredients such as SiO2 and Al2O3. The silty soil was collected from a construction site in Zhengzhou, Henan Province, with its main chemical composition being SiO2. The cement used in the test is 42.5-grade ordinary Portland cement, which is known for its high strength and rapid curing properties. The fly ash utilized in the experiment was sourced from Henan Dingnuo Purification Materials Co., Ltd., Xinzheng, China. It has a fineness of 225 mesh and an ignition loss rate of 15.2%. (Table 2). Figure 1 indicates that red mud particles are poorly graded, with fine particles comprising up to 89% of the content, while the silty soil is well graded, with a continuous and steep grading curve. Figure 2 shows the XRD patterns of RM and silty soil, showing that the main physical phases of red mud include quartz, corundum, hematite, chalcocite, hydrotalcite, and aluminum garnet, while the main phase of silty soil is quartz and alumina (Al2O3). The results of the red mud-leaching toxicity tests are displayed in Table 3. They show that the toxic leaching concentrations for each component are below standard limits and are therefore not classified as hazardous waste. Table 4 contains data on specific activity values for the radionuclides radium-226 (226Ra), thorium-232 (232U), and potassium-40 (40K) in red mud, which supports the calculation of the internal exposure index (IRa) at 2.54 and the external exposure index (Ir) at 2.63.

2.2. Experimental Method

In order to investigate the impact of mixing ratio and curing age on the mechanical properties of C-RMS and LF-RMS, different mixing ratios and ages were selected. Figure 3 and Figure 4 present the compaction test results of C-RMS and LF-RMS under various mixing ratios and curing age conditions. The steeper the compaction curve, the greater the effect of water content changes on the dry density of the soil, indicating that the soil is more difficult to compact. Conversely, the flatter the compaction curve, the easier the soil is to compact. Therefore, it is necessary to determine the optimal water content for each mix ratio through compaction tests for the preparation of specimens for macroscopic mechanical tests. Comparing Figure 3 and Figure 4, it can be observed that for the C-RMS specimens, when the cement content and curing time remain constant, the compaction curve becomes steeper as the red mud content increases, and this phenomenon is more pronounced with higher cement content. Compared to C-RMS specimens, the compaction curves of LF-RMS specimens are relatively gentle, indicating that lime and fly ash have a better effect on the water sensitivity of modified red mud-based silty soil. However, when the lime and fly ash content exceeds 20%, the compaction curve begins to steepen, indicating that it is not the case that the more lime and fly ash are added, the better. The red mud content (WRM) was set at 14%, 17%, 20%, 23%, and 26% based on the dry matter of the silty soil [22,29]. The cement content (WC) was 6%, 9%, and 12%, respectively. The lime-fly ash content (WLF) was varied at 10%, 20%, and 30%, with a lime and fly ash ratio of 1:2. The curing ages included were 7 d, 28 d, and 90 d, respectively [27]. The specific test plan is listed in Table 5. To clarify the description, specimens with different mixing ratios are identified by appropriate English abbreviations; for example, “6%C + 14%RM” represents specimens with a mix containing 6% cement and 14% red mud content, and “10% LF + 17% RM” represents specimens with a mixture containing 10% lime-flyashand 17% red mud content. Finally, representative specimens from the C-RMS and LF-RMS strength test results were used for environmental index testing.

2.2.1. Unconfined Compressive Strength Test

The unconfined compressive strength test was conducted using the YYW-2, as shown in Figure 5a. During the testing process, the axial strain rate was maintained at 1 mm/min. The specimen preparation process was as follows: (1) According to the relevant requirements of Highway Geotechnical Test Regulations (JTG E40-2007), cylindrical specimens with a height and diameter of 50 mm were prepared by the static pressing method. (2) The mixture was poured into the mold in three layers for compaction (as shown in Figure 5b), and after each compaction, the contact surface of each layer was shaved to prevent delamination. (3) The specimens were wrapped in plastic film and placed in a constant temperature and humidity chamber set at 20 °C and 95% humidity for maintenance, as shown in Figure 5c. Following curing until the final day, the specimen was immersed in water for 24 h [30]. To minimize the error, six identical specimens were prepared for each mixing ratio and age to facilitate parallel testing.

2.2.2. Splitting Tensile Strength Test

The preparation and curing method of the specimens used for the splitting tensile strength test was identical to that of the unconfined compressive strength test.

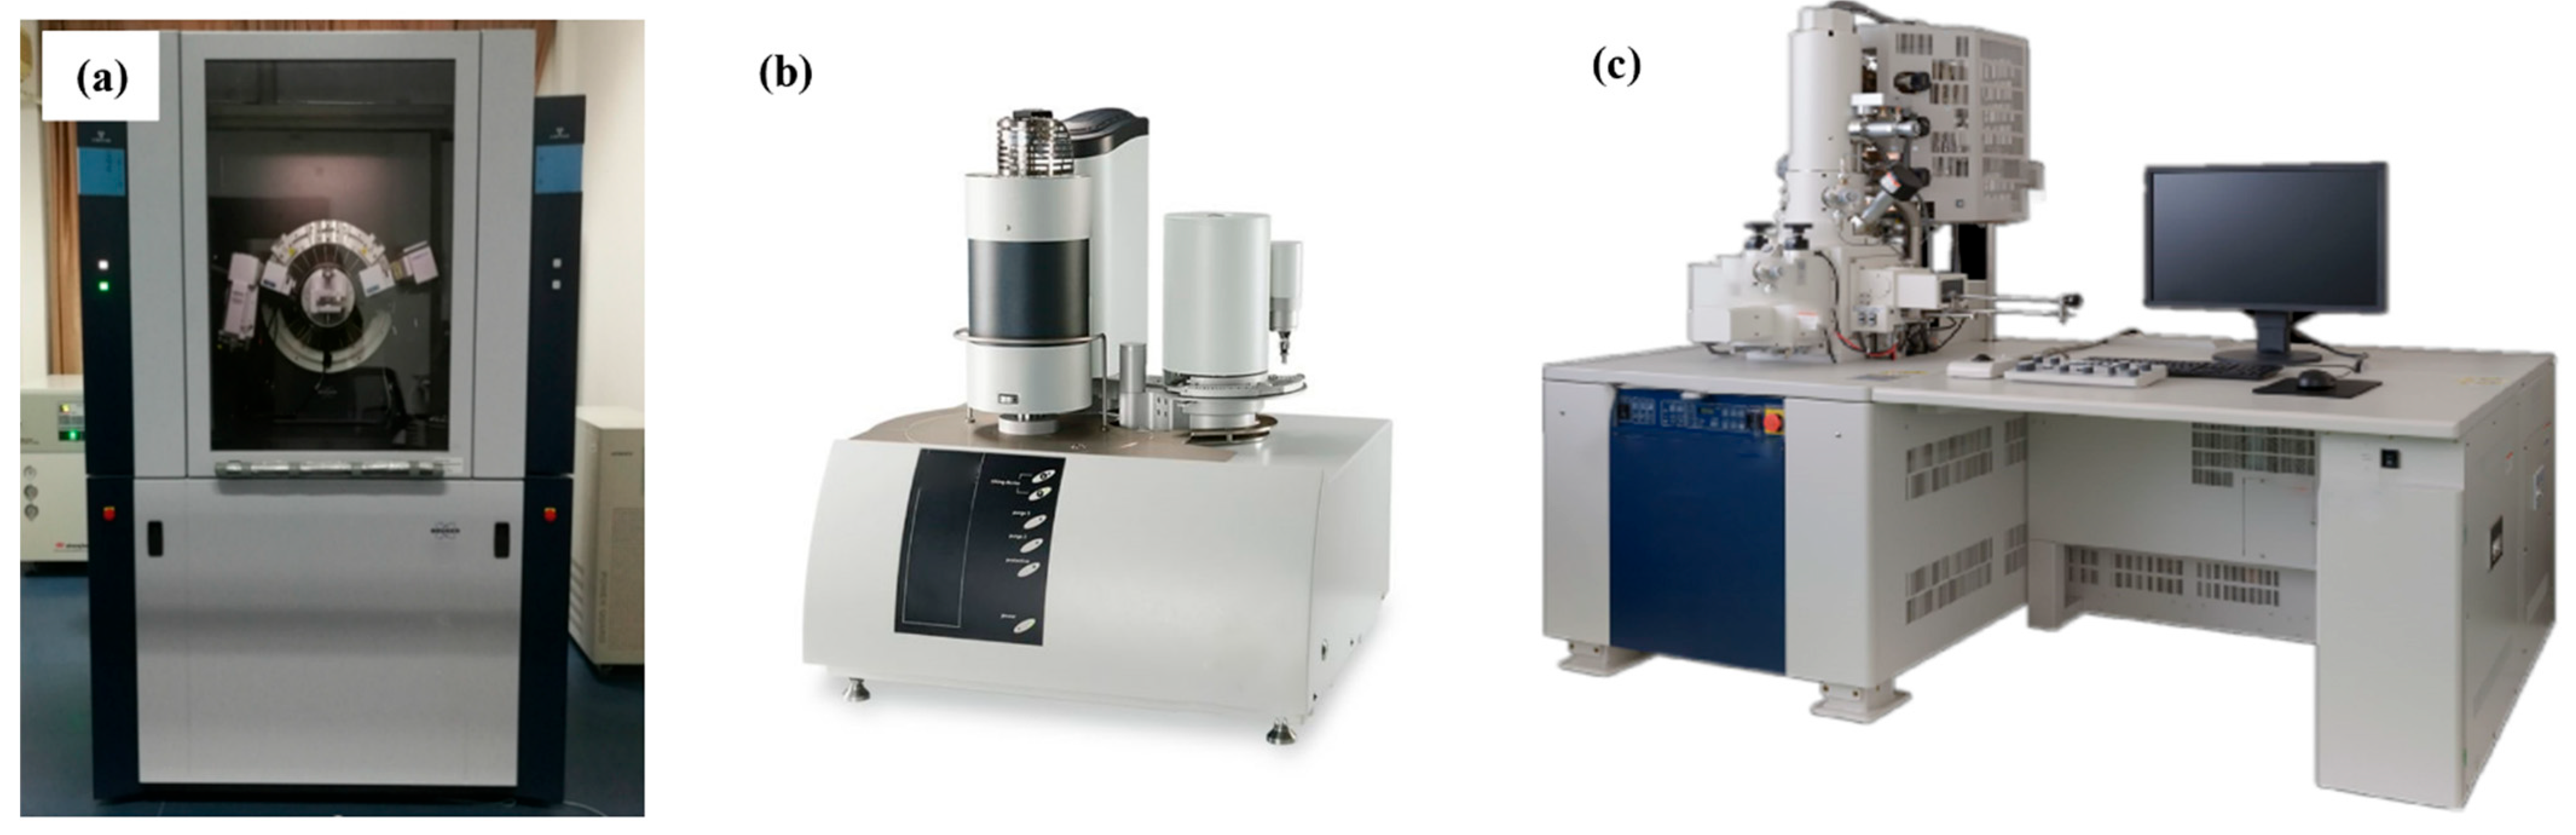
2.2.3. Microscopic Test

Based on the results of unconfined compressive strength and splitting tensile strength tests, representative specimens were selected for microscopic tests such as X-ray diffraction, thermogravimetric analysis, and scanning electron microscopy. The specific scheme is shown in Table 6 below.
X-ray diffraction analysis (XRD) was carried out to study hydration products and their variations in the red mud-based modified silty soil. A Bruker D8 Advance X-ray diffractometer was used for the test, as shown in Figure 6a. This method allows for a detailed examination of the hydration products in the C-RMS samples and provides insights into their composition and structure, which are crucial for understanding the strength and behavior of the soil. In the thermogravimetric analysis test (TG-DTG), the treated sample is placed in an alumina crucible for testing, and the change in material mass with temperature is measured and combined with an XRD test for quantitative analysis. The synchronous thermal analyzer was used for the test, as shown in Figure 6b. Using scanning electron microscopy (SEM), the sample is scanned with a high-energy electron beam, and an image of the surface morphology is created. This experiment analyzed the distribution and morphology of hydration products in red mud–based silty soil. A Hitachi SU8100 series advanced scanning electron microscope was used for the test, as shown in Figure 6c.

2.2.4. Environmental Index Detection Test

To detect the leaching toxicity of heavy metal ions, C-RMS and LF-RMS, the leaching solution was prepared using the horizontal oscillation method. And then analyzed for various heavy metal ion concentrations using spectrophotometry, titration, and electrode methods [31]. The radioactivity of C-RMS and LF-RMS was measured using gamma spectrometry. Before testing, the specimens were broken and sealed before allowing them to reach radioactive decay equilibrium over 7 days. The test used a low background multi-channel gamma spectrometer FP-90041 with an activity range for measured nuclides from 10 Bq to 2 kBq [32].
The main information about the instruments we used is shown in Table 7. The primary data processing method employed in this article is Origin 2024. The key information is presented in Table 8 below.

3. Results and Analysis

3.1. Comparative Analysis of Compressive Performance

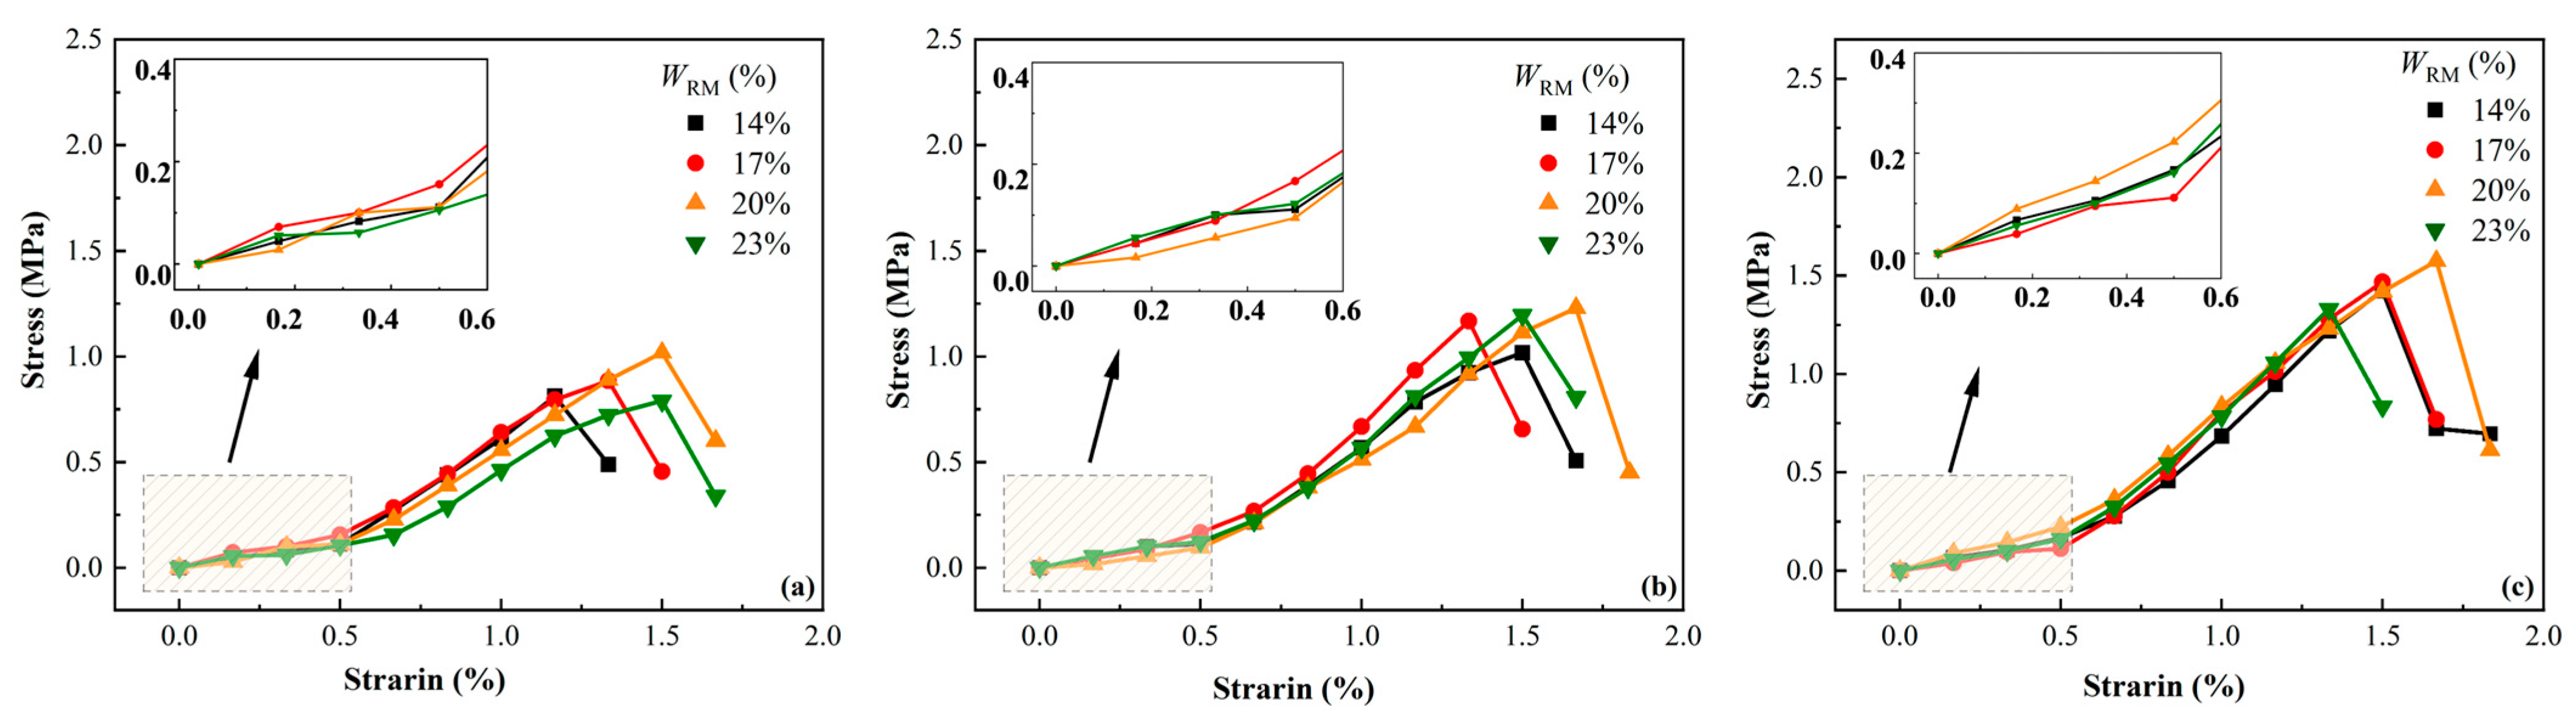
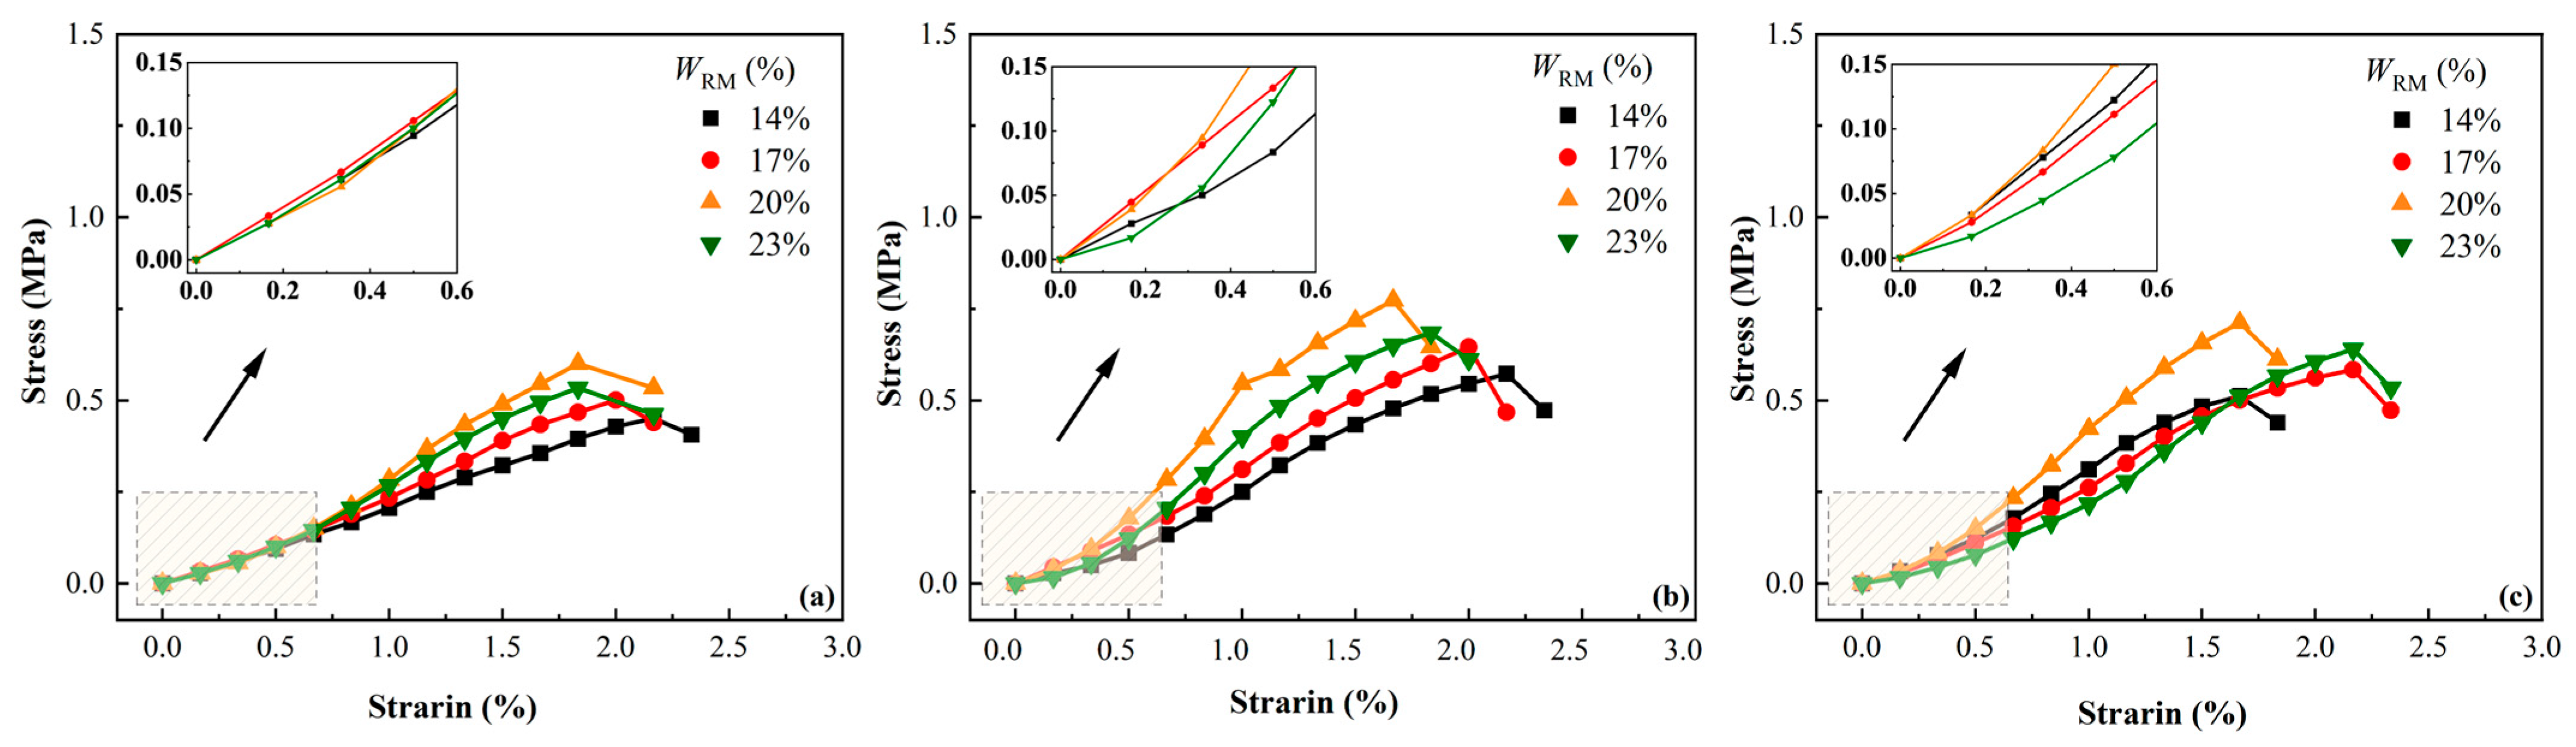
3.1.1. Axial Stress-Strain Relationship

From Figure 7, the axial stress-strain curve of C-RMS specimens exhibits a distinct peak point and significant strain-softening properties. In other words, after reaching the peak strength, the specimen quickly drops to a lower level, and the overall performance is characterized by brittle failure. From Figure 8, it can be observed that LF-RMS specimens have no obvious peak point, and the stress drop occurs relatively slowly after reaching the peak point. The overall performance is characterized by plastic failure. Figure 7 depicts the development pattern of the stress-strain relationship. According to this figure, the σ-ε curve of C-RMS specimens shows two different development trends labeled “a” and “b”. However, for LF-RMS specimens, the σ-ε curve shows an evolution trend labeled “b” and “c”.
In combination with Figure 7 and Figure 9, the C-RMS specimens were analyzed. When the curing age is 7 days, the σ-ε curve mainly presents the “b” development pattern, which has three stages. During the initial loading stage, rapid compression of the pores within the specimen occurs, resulting in a greater increase in strain than in stress. This stage is short-lived. As the load increases, the specimens enter the elastic deformation stage, which is the primary phase of compressive resistance. This stage lasts for a longer period of time, with the stress-strain increasing linearly. Finally, the specimens enter the failure stage where plastic deformation occurs before peak stress is reached, ultimately leading to complete destruction of the specimen. At a curing age of 28 d (WC > 6%) and 90 d, the σ-ε curve mainly shows an “a” development pattern. During this time, residual stress significantly influences the failure stage. After reaching peak levels, stress rapidly declines to lower levels, followed by a slowdown in stress reduction or even an increase in stress levels. This phenomenon is attributed to more sufficient hydration reactions and increased structural cementation strength due to aging effects on concrete material properties over time.
Combining Figure 8 and Figure 9 for the analysis of LF-RMS specimens, it is found that the LF-RMS specimens mainly exhibit two development patterns labeled “b” and “c”. At the curing ages of 7 d and 28 d, the σ-ε curve of the LF-RMS specimens demonstrates the “c” development pattern, with obvious plastic failure characteristics. This pattern consists of two main stages: plastic deformation and plastic yield, as shown in Figure 9. The stress in LF-RMS specimens increases slowly with strain, followed by a gradual decrease after reaching the peak point. This phenomenon is attributed to the gradual build-up of volcanic ash strength and the reduction in the amount of cementation products in the LF-RMS samples, which weakens the soil’s resistance to consolidation. In addition, lime undergoes volumetric expansion during the initial stages of hydration. This phenomenon results in weaker connections between structural units and the formation of larger pores within the soil, ultimately contributing to a reduction in soil strength. When the curing age is 90 days, the σ-ε curve for LF-RMS samples displays a “b” development trend characterized by an obvious peak point and strain softening behavior. The stress in these specimens increases rapidly with strain before decreasing significantly post-peak point. This can be attributed to sufficient carbonation and crystallization of the lime with increasing curing age, resulting in a more adequate response to the volcanic ash. As a result, soil particles and structural units are better bonded together while pores are filled up, ultimately enhancing structural strength.

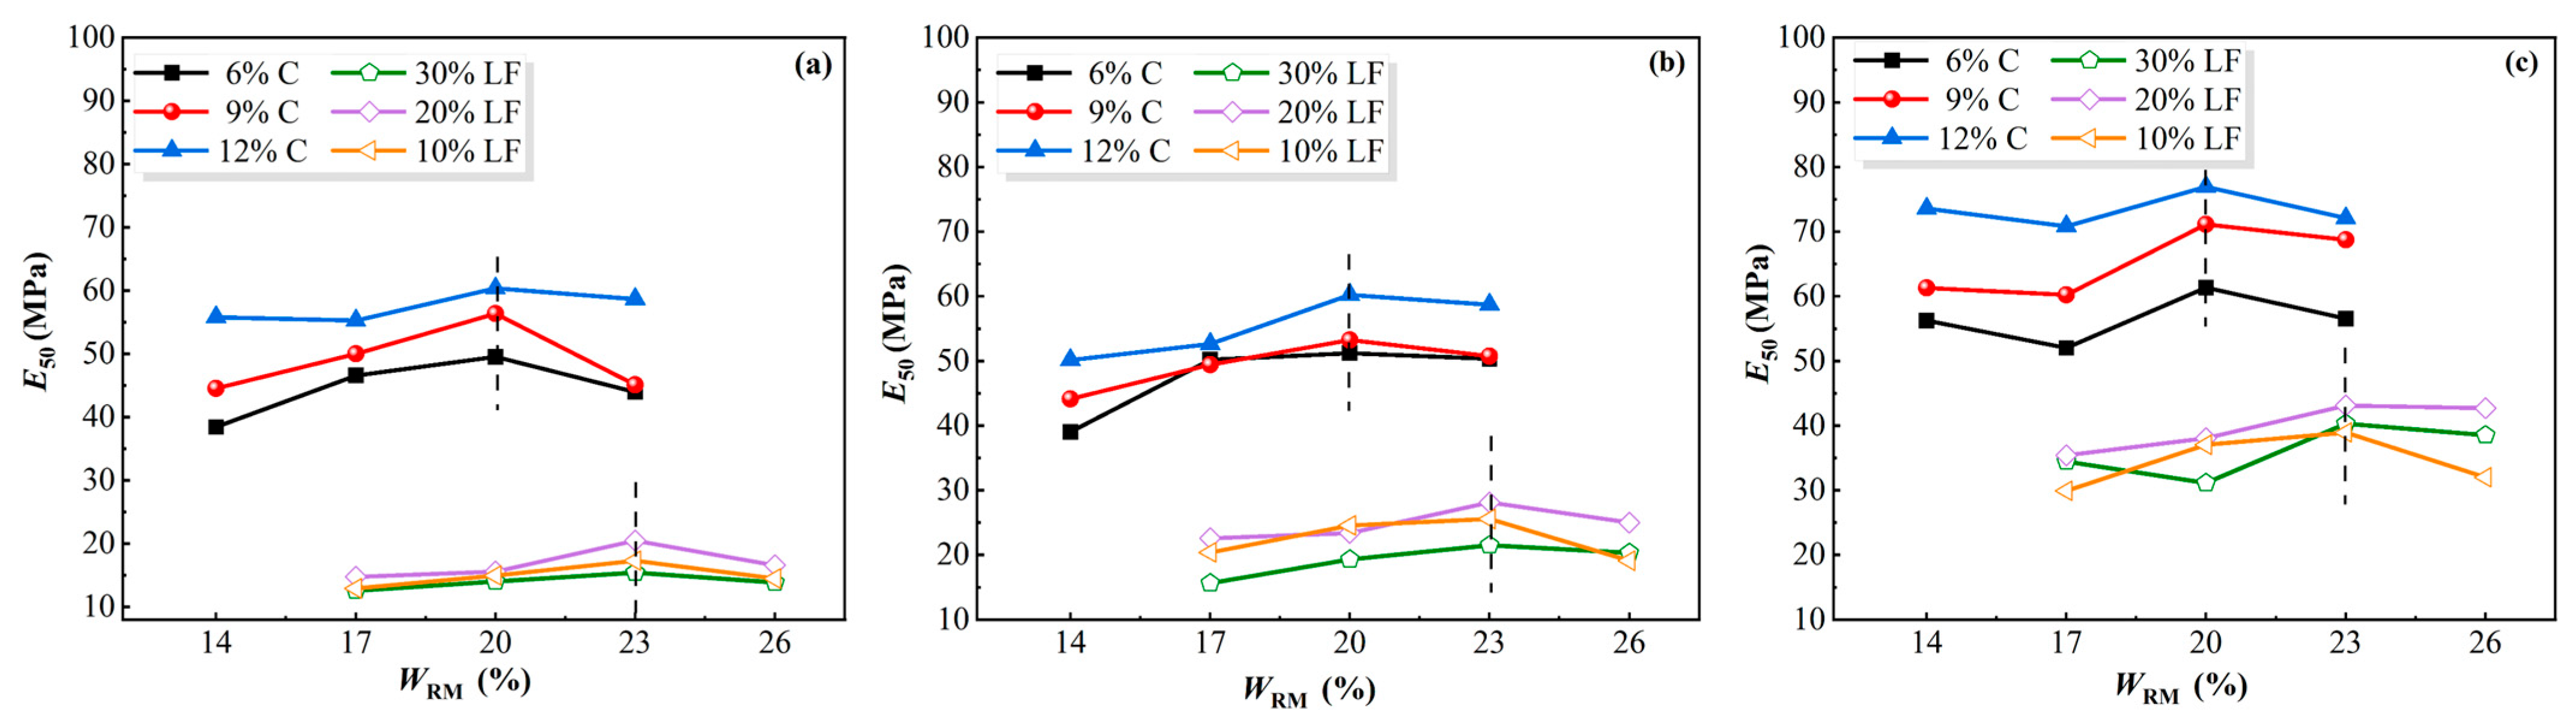
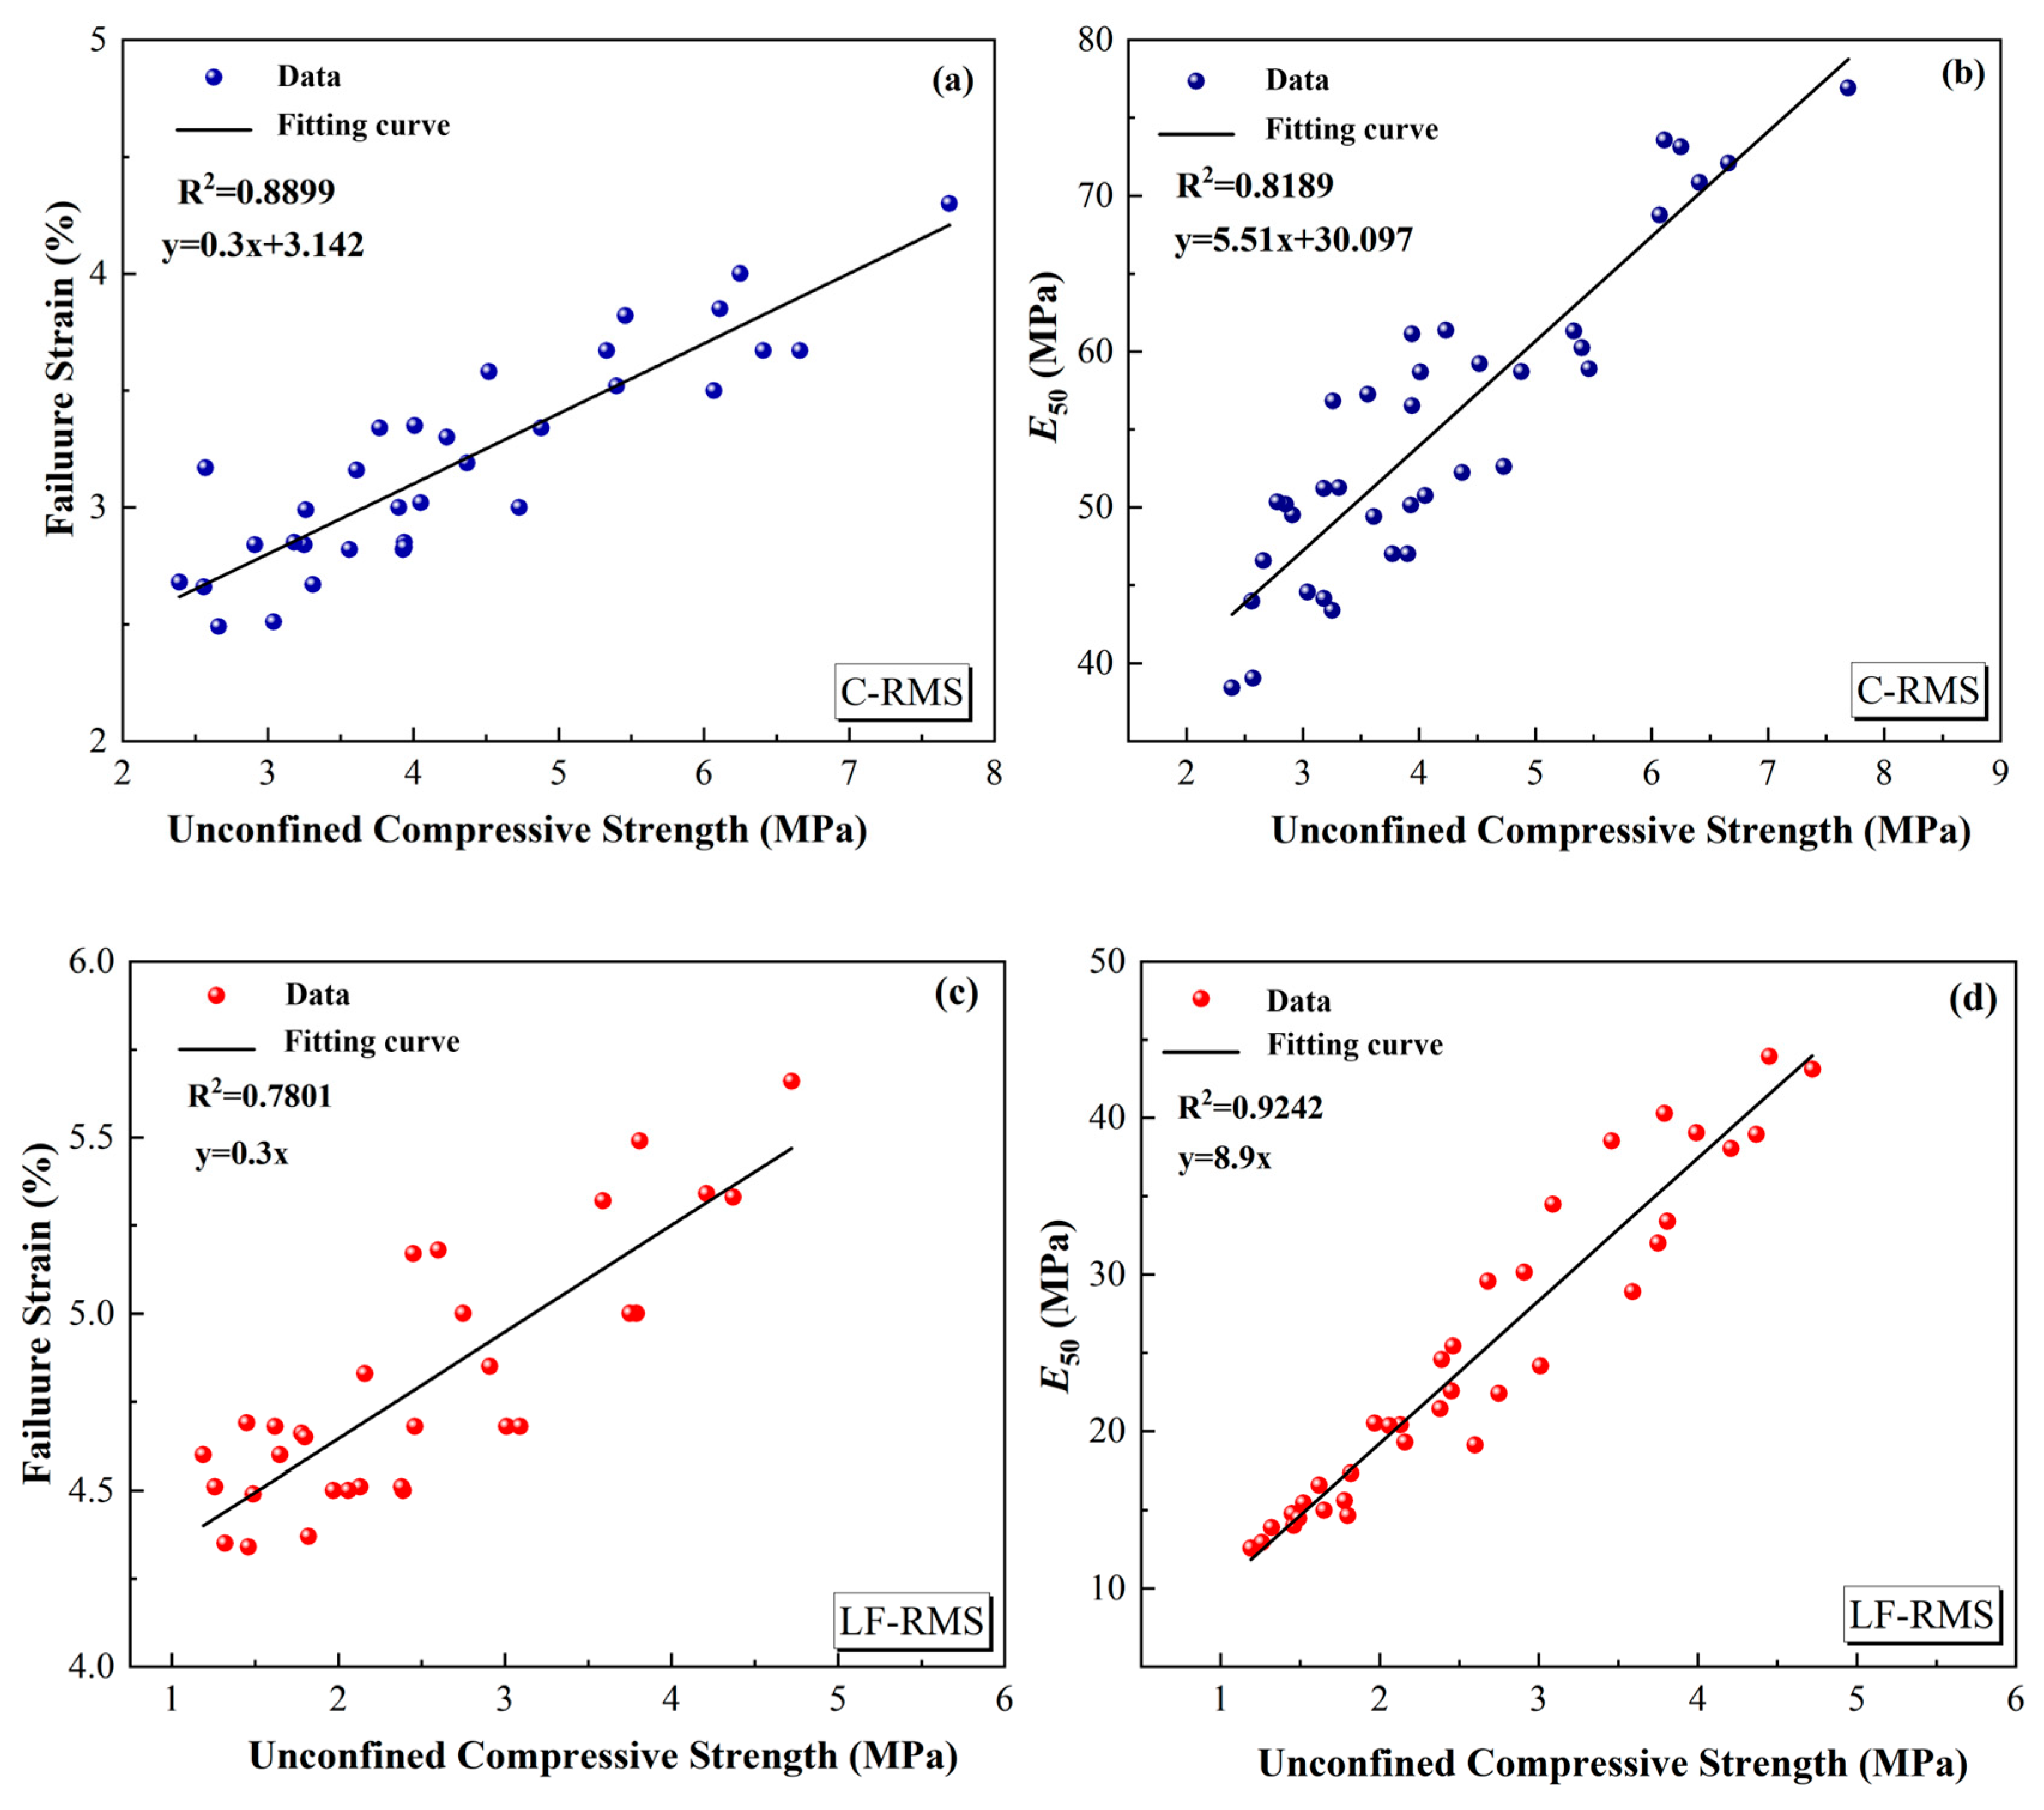
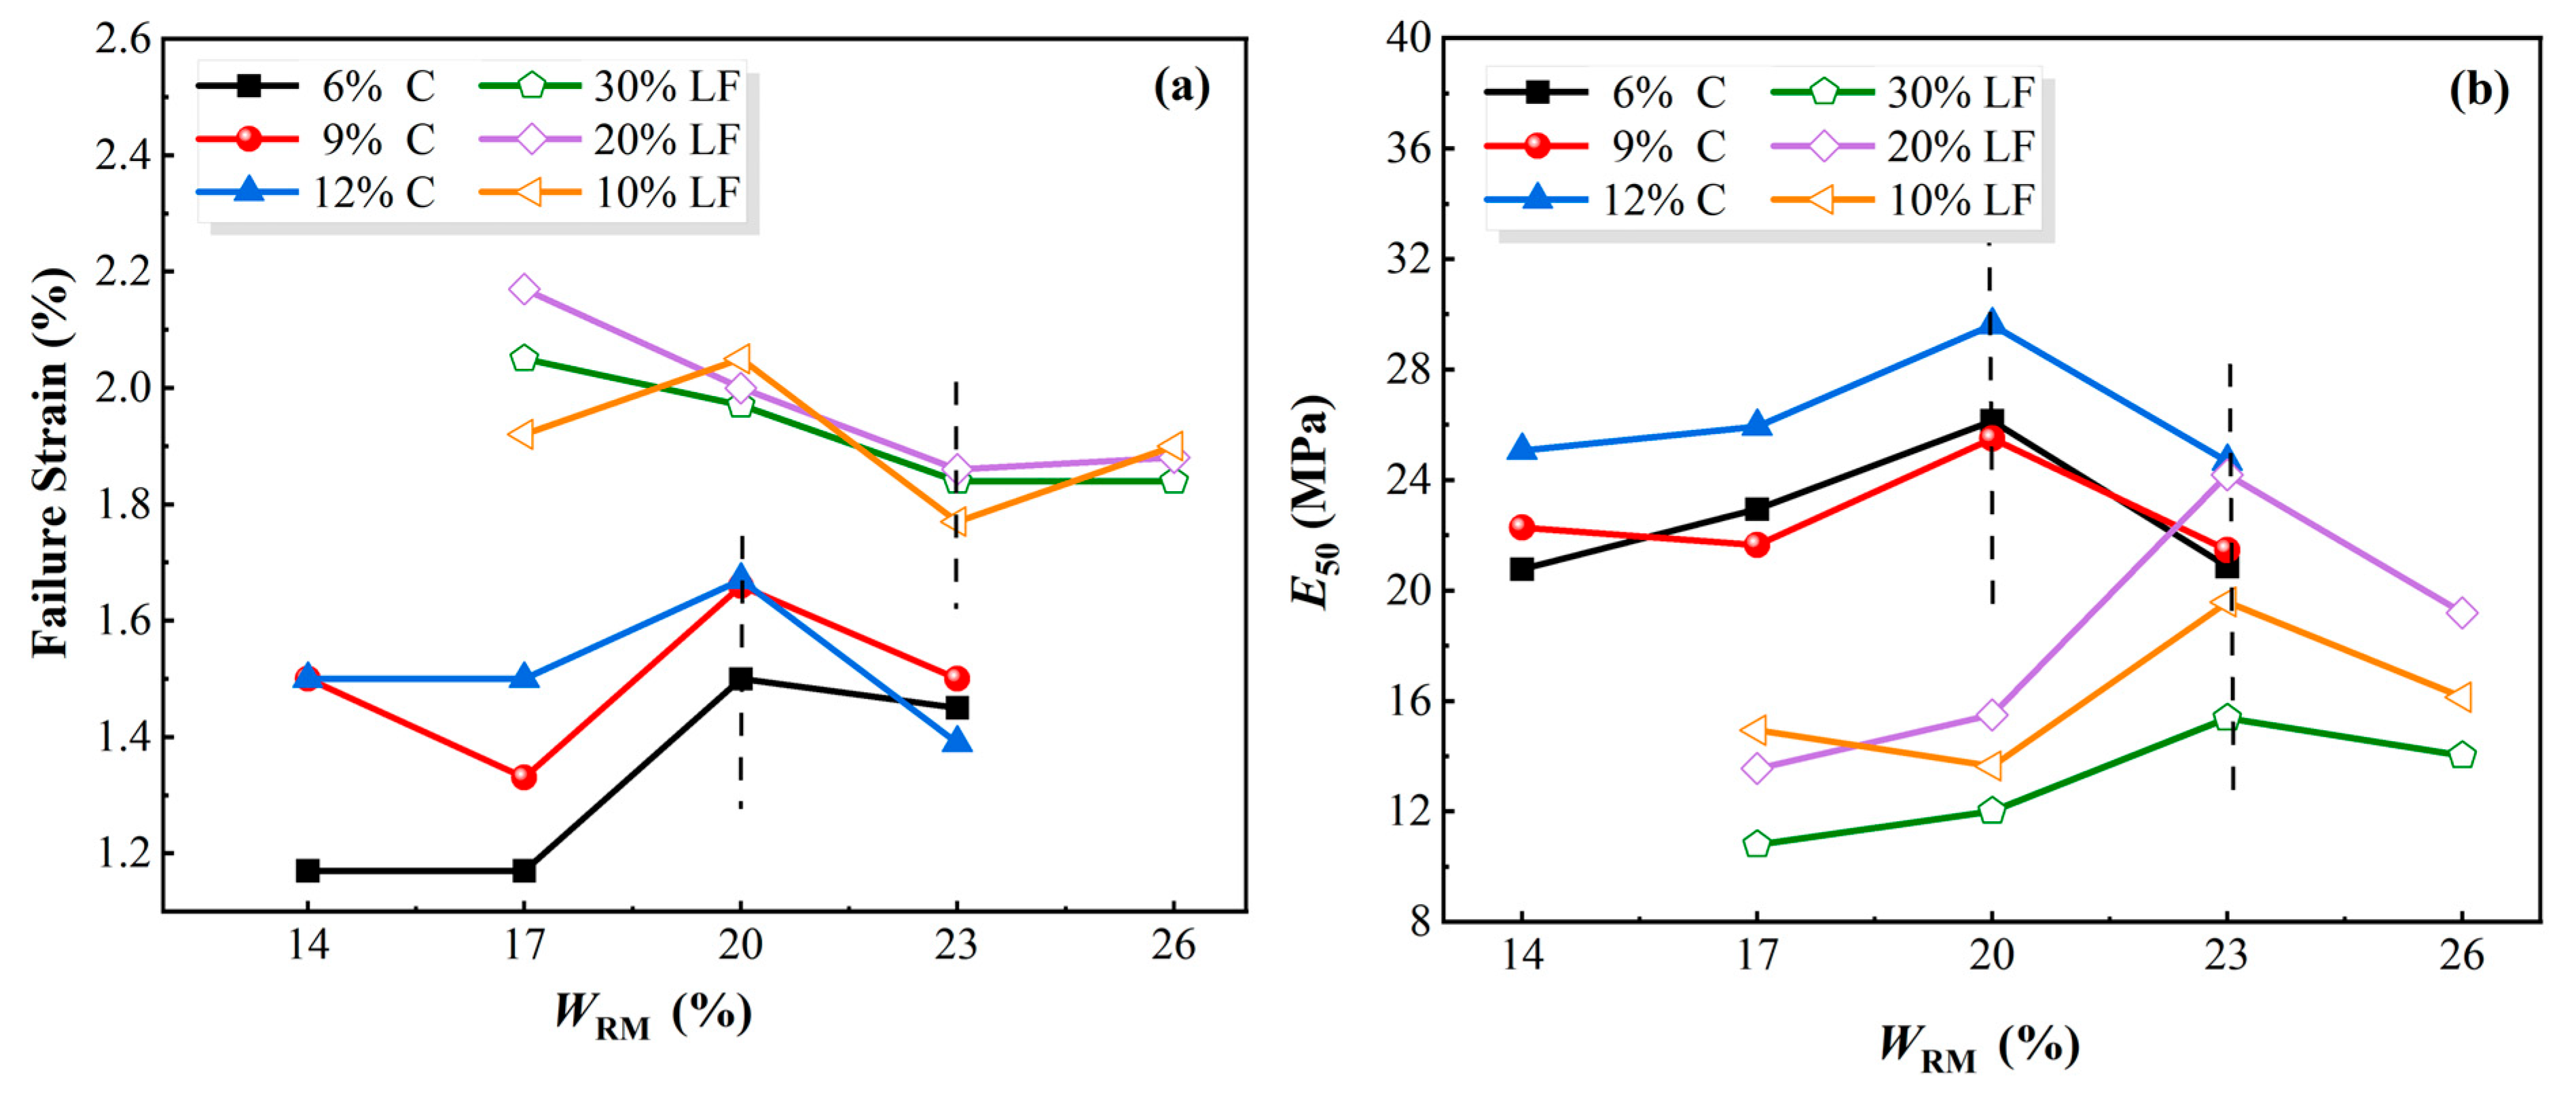
3.1.2. Deformation Characteristic Analysis

The failure strain (εf) reflects the deformation properties of the soil, with a greater failure strain indicating stronger toughness of the soil specimens. The deformation coefficient (E50) reflects the specimen’s resistance to deformation, with a larger coefficient indicating a stronger resistance to deformation. Figure 10 illustrates the relationship between failure strain and red mud content of C-RMS and LF-RMS. From Figure 10, it can be seen that with the same cement content, an increase in red mud content leads to a trend of initially increasing and then decreasing failure strain for C-RMS specimens, which is limited by WRM = 20% and peaks at WRM = 20%. Furthermore, the failure strain (εf) of C-RMS is maximized when WRM = 20% and WC = 12%. However, for LF-RMS specimens, the failure strain decreases and then increases with increasing red mud content. At curing ages of 7 and 28 days, when WRM = 23%, the failure strain of LF-RMS specimens is minimized due to insufficient hydration products generated by reactions at WRM = 23%, resulting in certain strain softening characteristics during early strength formation stages. However, at a curing age of 90 days with WRM = 23%, the failure strain of LF-RMS specimens increases to its maximum as more hydration products are generated over time, leading to increased specimen toughness. It is observed that the sample fully reacts with increasing age of curing, resulting in increased formation of hydration products and gradual improvement in sample toughness.
The aforementioned analysis indicates that the toughness of C-RMS specimens can be enhanced by incorporating an appropriate amount of red mud. However, if the red mud content exceeds 20%, the toughness of C-RMS samples will diminish. Therefore, the optimal toughness of C-RMS specimens is achieved when the red mud content is 20%. For LF-RMS specimens, although the early failure strain gradually decreases with increasing curing time, it reaches its maximum at WRM = 23%, resulting in the highest toughness. Compared to C-RMS samples, LF-RMS samples consistently exhibit higher failure strain and possess higher toughness, allowing for higher red mud consumption.
Figure 11 illustrates the relationship between the deformation coefficient (E50) and the red mud content of C-RMS and LF-RMS. The curves for both C-RMS and LF-RMS specimens show a trend that first increases and then decreases. However, the deformation coefficient of C-RMS specimens is generally higher than that of LF-RMS specimens, indicating higher deformation resistance of C-RMS samples. In particular, when the red mud content is 20%, the deformation coefficient of C-RMS specimens reaches its peak and exhibits the strongest deformation resistance. On the other hand, for LF-RMS specimens, the peak point is reached at a red mud content of 23%, with the largest deformation coefficient. In conclusion, adding an appropriate amount of red mud can enhance the deformation resistance of both C-RMS and LF-RMS specimens. Based on a comprehensive analysis of Figure 10 and Figure 11, it can be concluded that when WRM = 20%, C-RMS specimens exhibit optimal toughness and anti-deformation ability. For LF-RMS specimens, WLF = 20% and WRM = 23% yield the best toughness and deformation resistance despite having a small early failure strain; this strain increases to the maximum with the passage of curing time. Overall, C-RMS specimens demonstrate the best toughness and anti-deformation ability when WRM = 20%. On the other hand, LF-RMS specimens exhibit optimal toughness and deformation resistance when WLF = 20% and WRM = 23%.

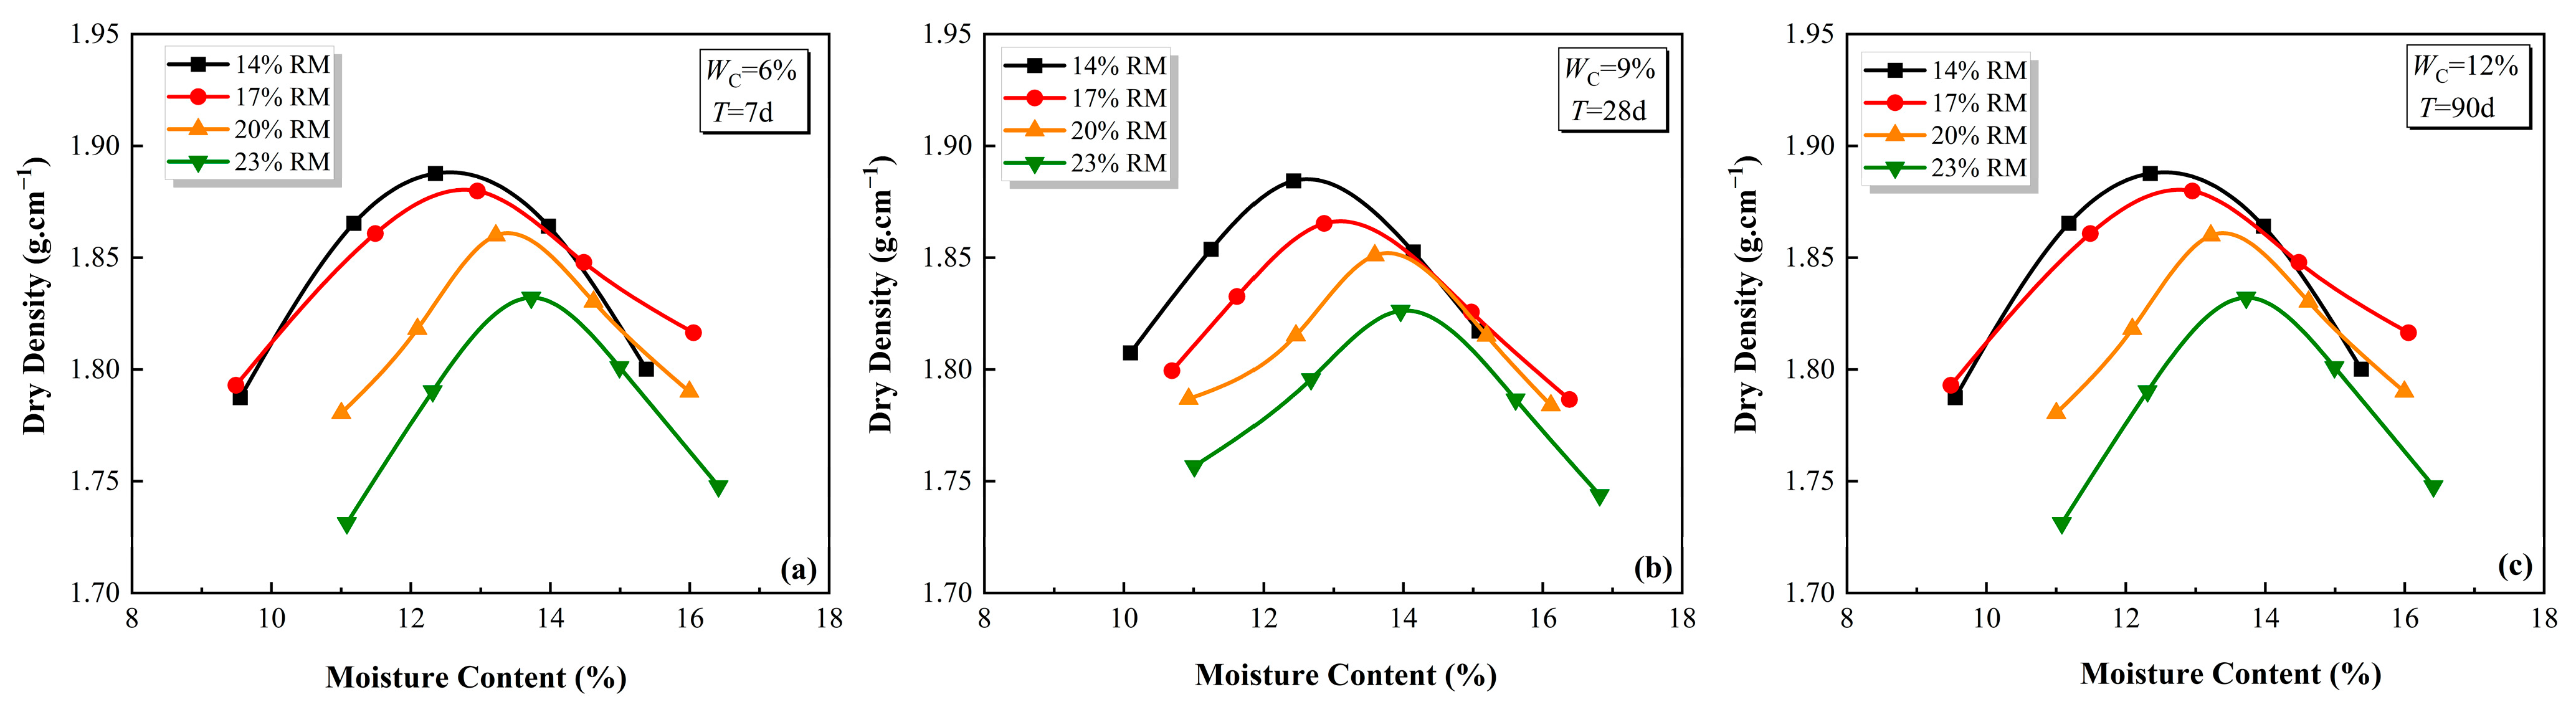
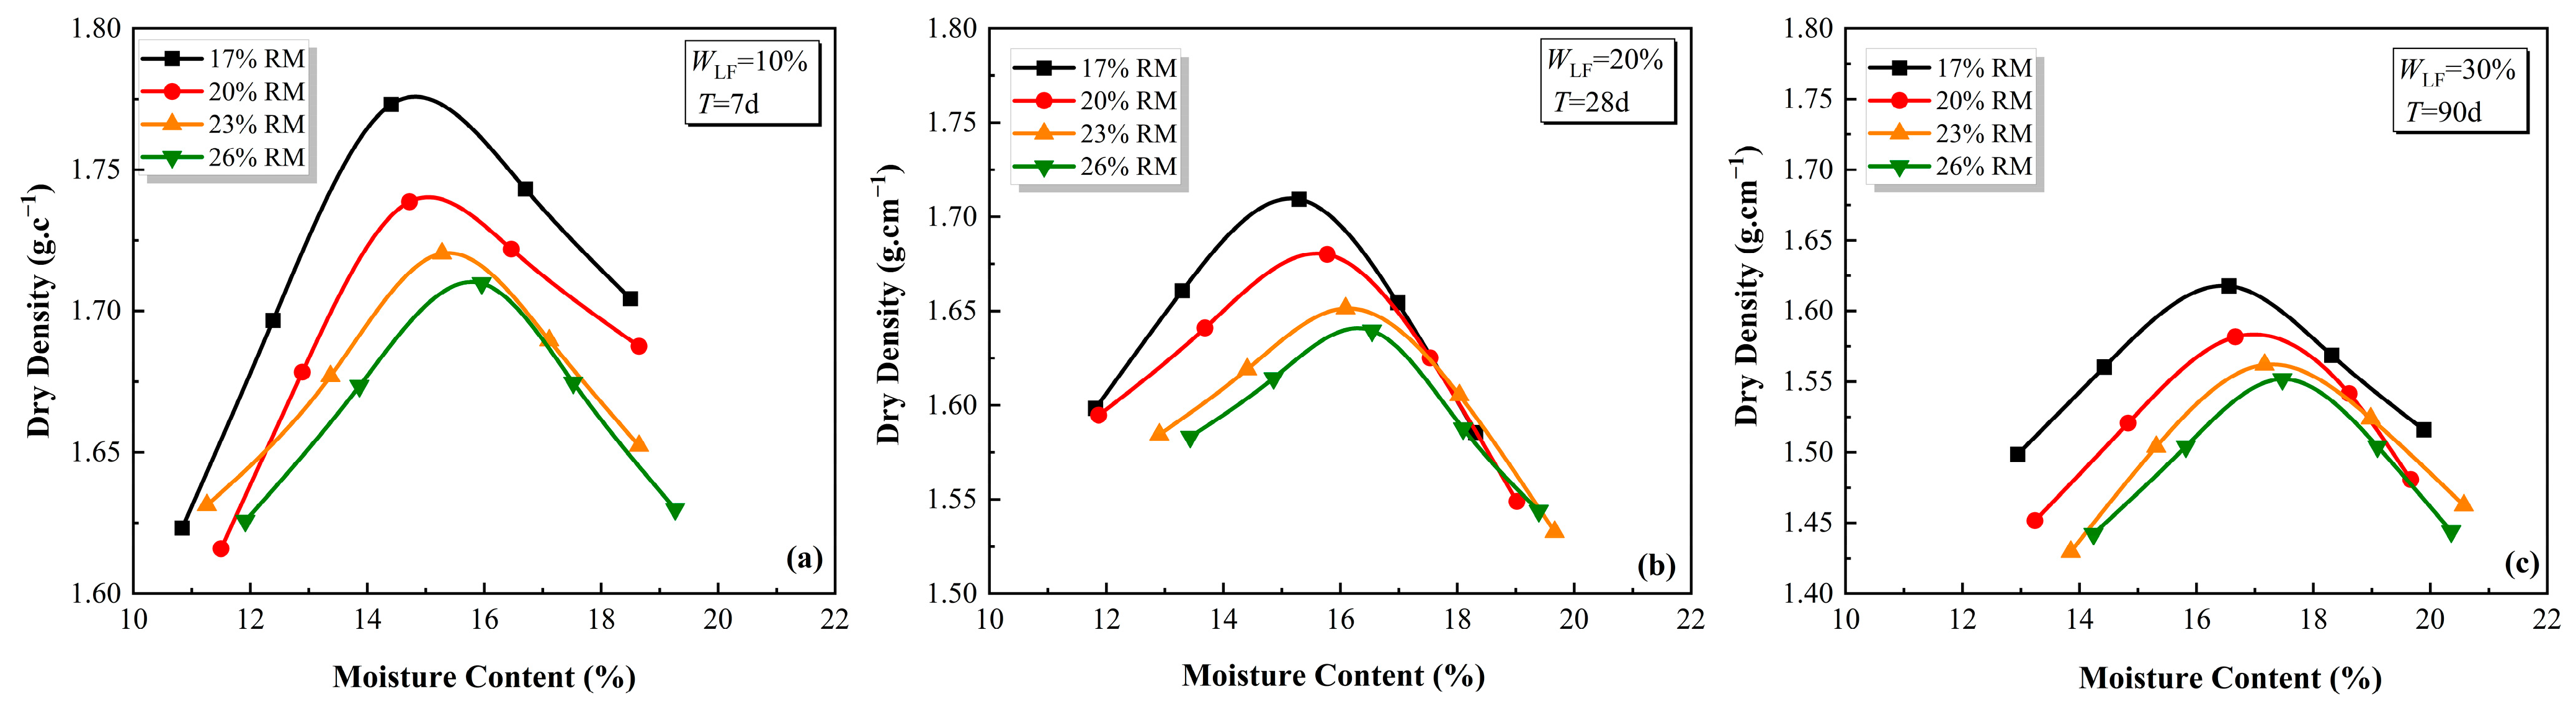
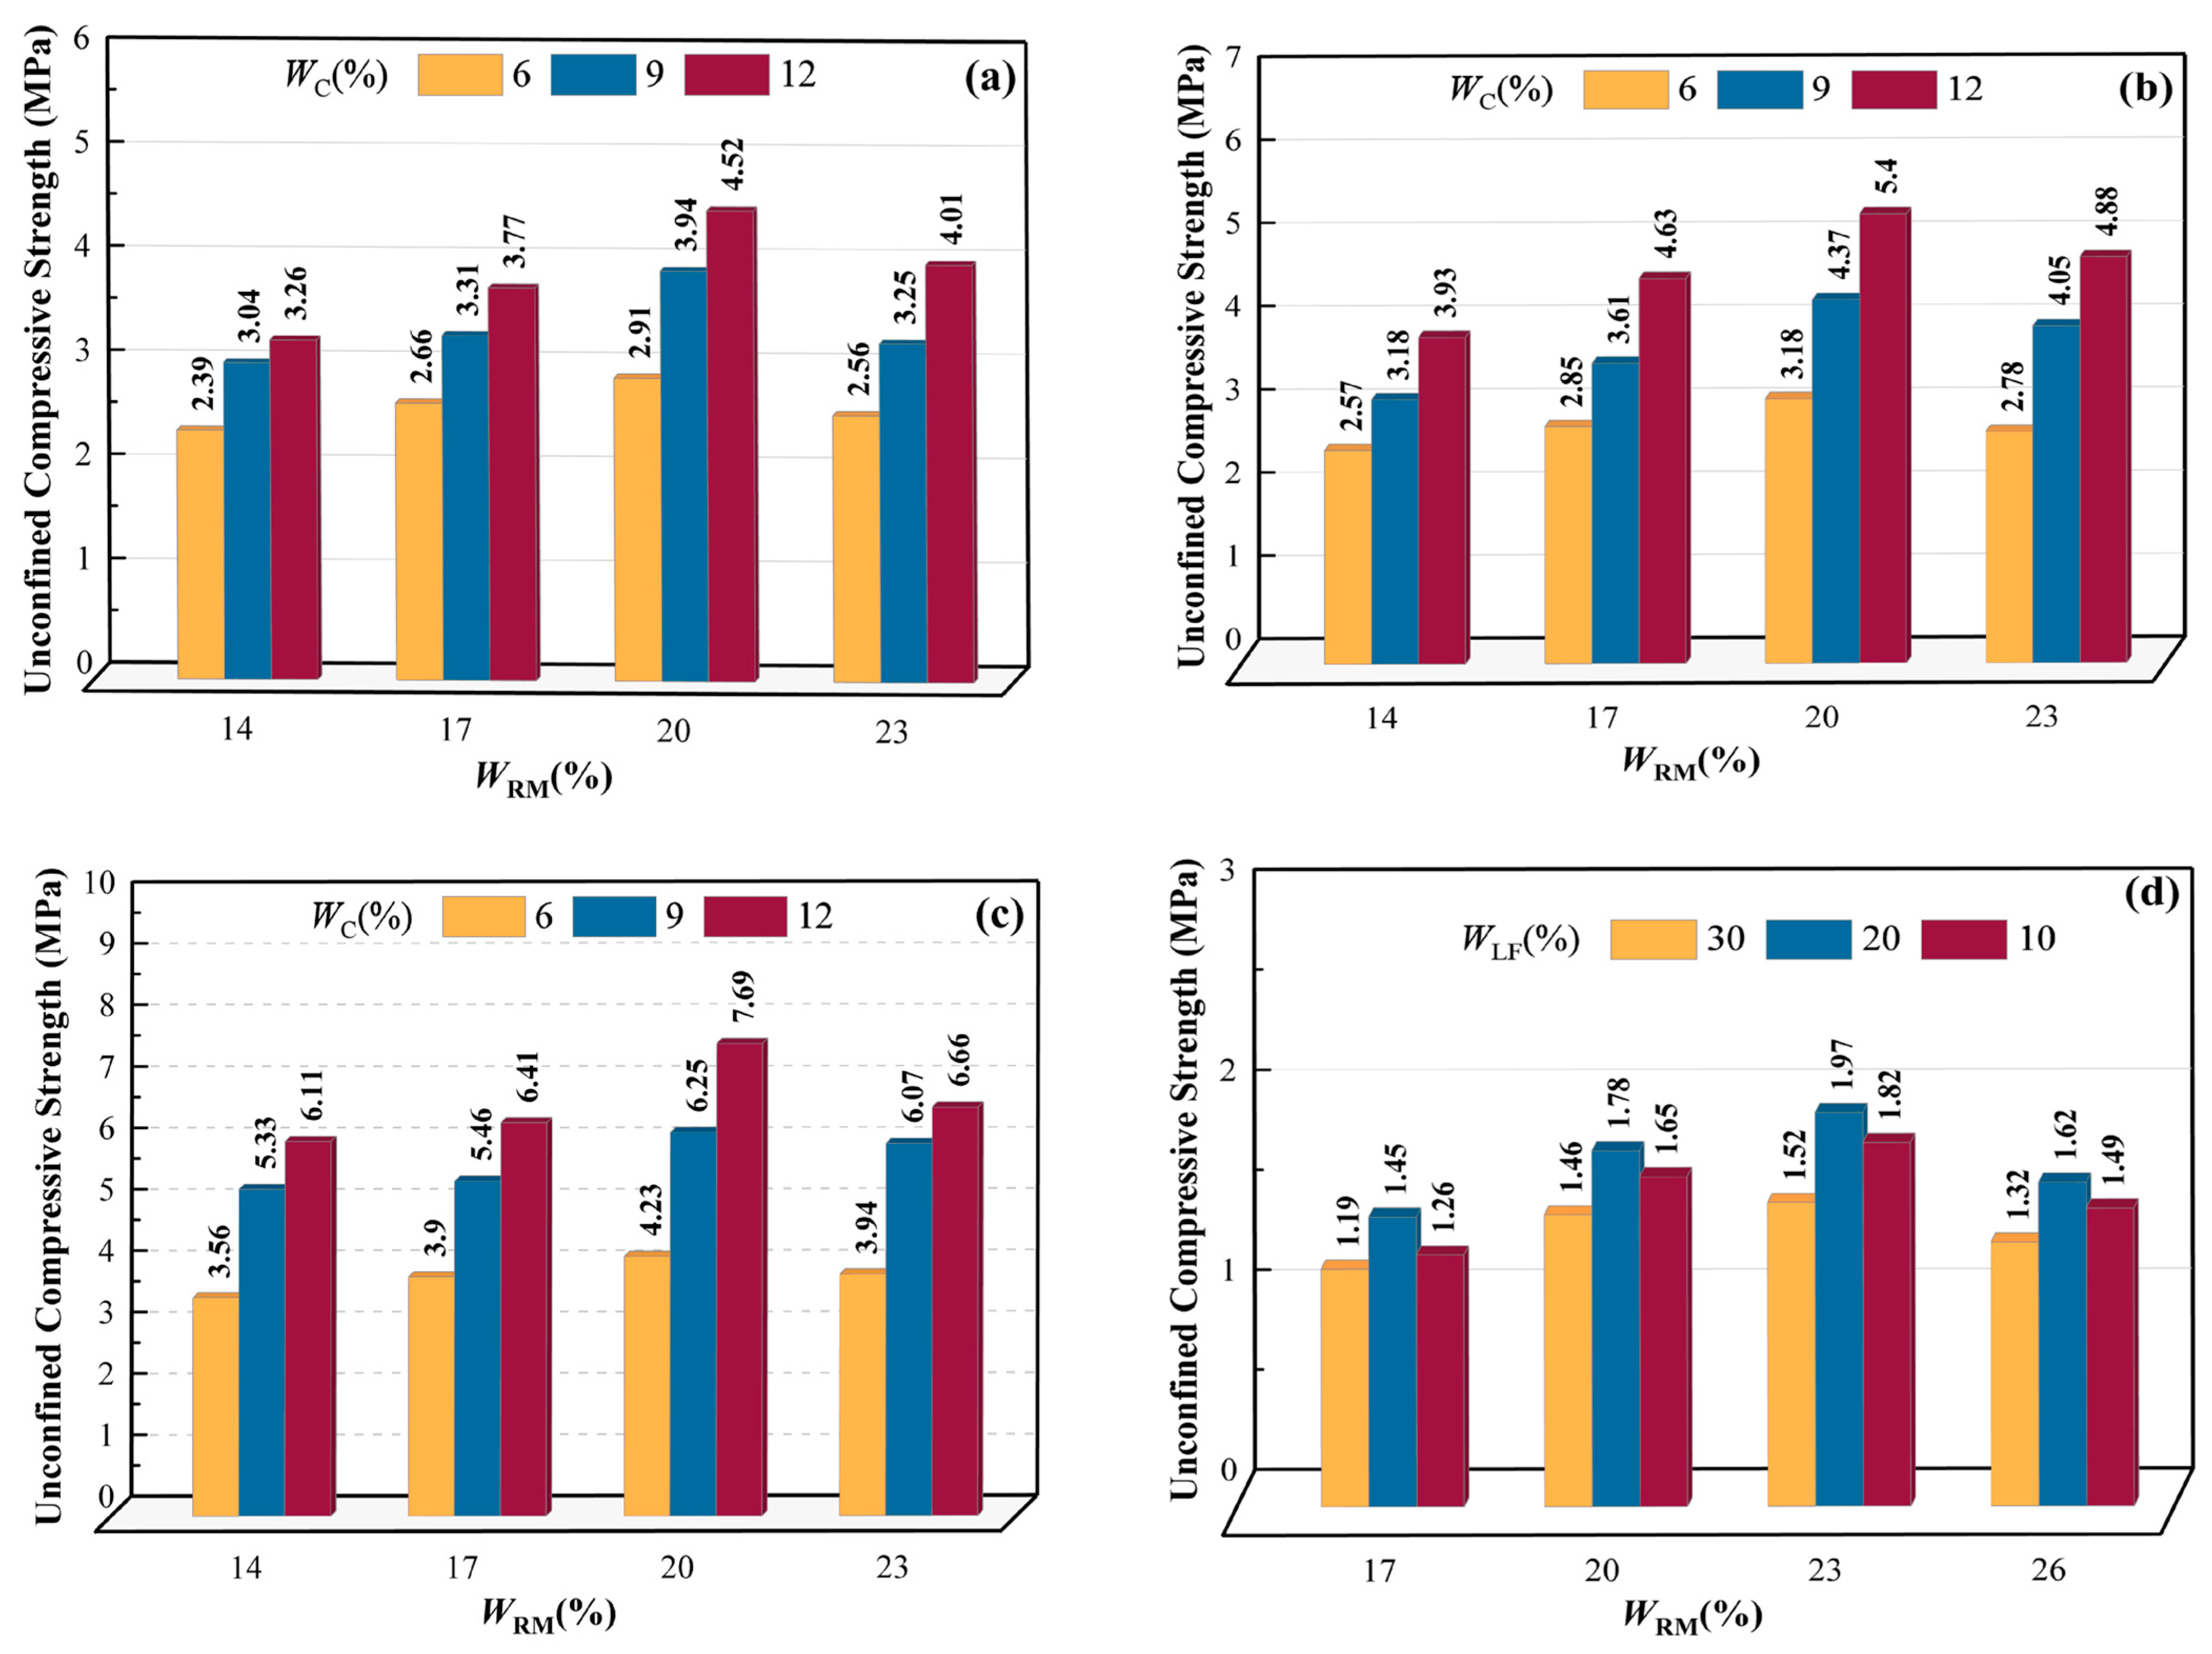
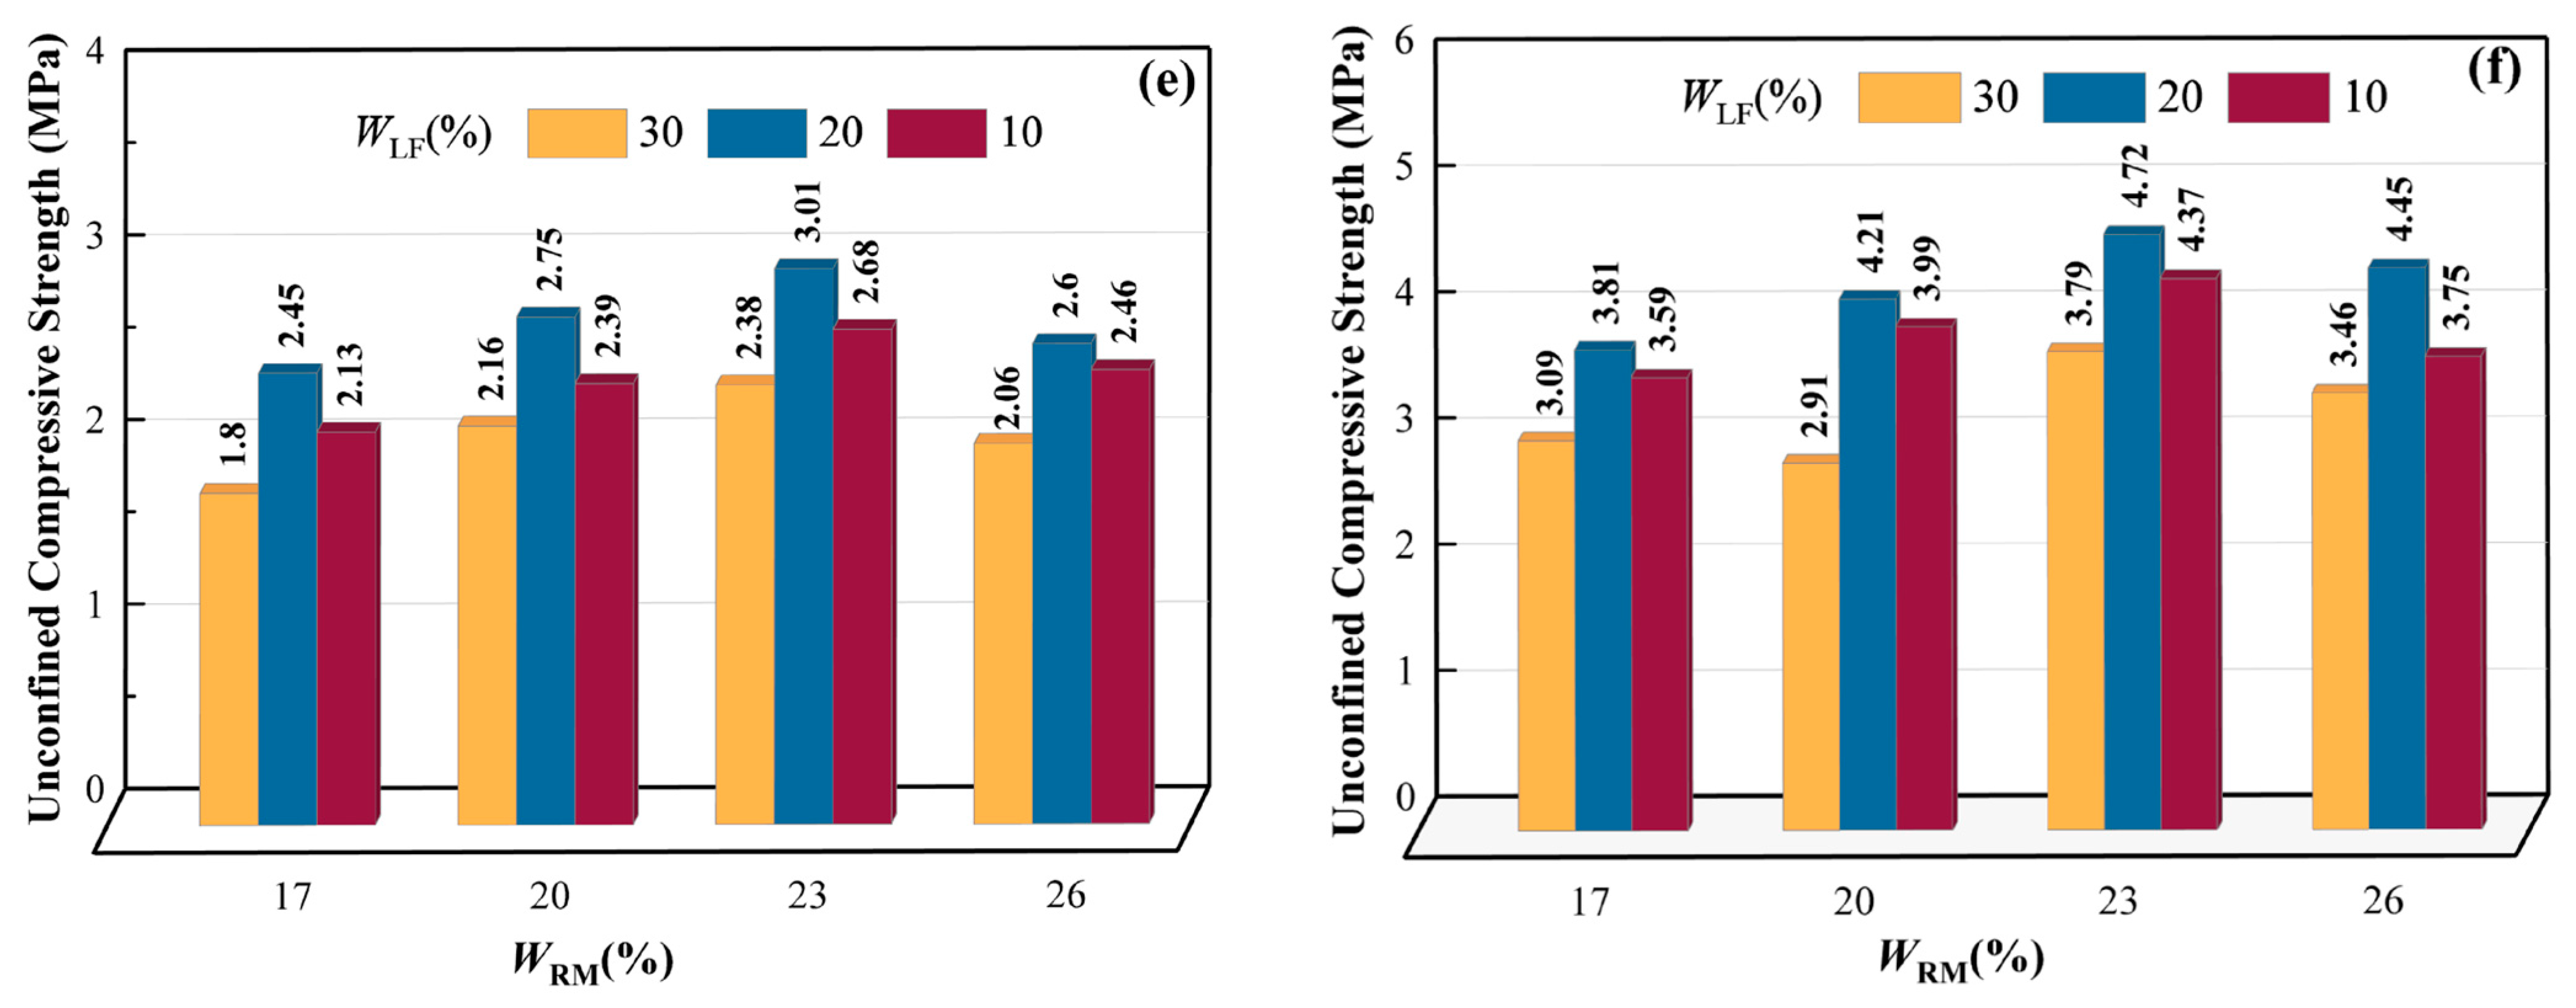
3.1.3. Compressive Strength

Figure 12a–c shows the unconfined compressive strength of the C-RMS specimens. At the same ages and with constant cement content, the unconfined compressive strength of C-RMS samples exhibits a trend that first increases and then decreases with the gradual increase in red mud content. Similarly, at the same curing age and constant red mud content, the unconfined compressive strength of C-RMS samples shows a gradual increase with increasing cement content. Consequently, the optimal value for the red mud content is 20% (WRM = 20%), at which point the unconstrained compressive strength of the sample reaches its maximum. Figure 12d–f illustrates the unconstrained compressive strength of LF-RMS specimens. At the same age and with constant lime-fly ash content, LF-RMS specimens show a similar trend to the C-RMS specimens’ initial increase, followed by a decrease as red mud content gradually increases. Likewise, with constant red mud content but varying lime-fly ash levels, LF-RMS specimens also display an initial increase followed by a decrease in unconfined compressive strength. Therefore, it is found that the optimal values for both red mud and lime-fly ash contents are 23% (WRM = 23%) and 20% (WLF = 20%), respectively; These values correspond to the point in time at which the maximum unrestricted compressive strength is reached. It should be noted that although the unconfined compressive strength of the LF-RMS samples is consistently lower than that of the C-RMS samples, their growth rate is significantly higher due to the slow formation of strength within a cementitious system based on lime and red mud, which results in low initial strengths for LF-RMS specimens.
For C-RMS specimens, the unconfined compressive strength peaks at WRM = 20%. However, when the red mud content exceeds 20%, the unconfined compressive strength of the specimen decreases. This is due to a large number of red mud particles being adsorbed around the hydration products, reducing the compactness of the soil and therefore its unconfined compressive strength. Therefore, it is important to carefully control red mud levels during use. Figure 12d–f shows the unconstrained compressive strength of LF-RMS specimens. It is observed that the unconfined compressive strength of these specimens peaks at WRM = 23%. The addition of red mud creates an alkaline environment for the hydration reaction system, facilitating lime hydration and promoting increased cement production. This also improves soil mass strength by increasing fly ash activity through accelerated dissociation rates and promoting the degradation of active substances such as silica–aluminum vitreous fly ash [33].
Figure 13 illustrates the fitting curves representing the relationships between unconfined compressive strength (UCS) and failure strain (εf), as well as the deformation coefficient (E50) for C-RMS and LF-RMS specimens. The fitting relation for C-RMS specimens can be represented as εf = 0.3 UCS and E50 = 5.51 UCS, with fitting parameters of 0.3 and 5.51, respectively. Similarly, the fitting relationship for LF-RMS specimens can be expressed as εf = 0.3 UCS and E50 = 8.9 UCS, with fitting parameters of 0.3 and 8.9, respectively. The figure indicates that an increase in the unconfined compressive strength of both C-RMS and LF-RMS specimens corresponds to a general trend of increased failure strain (εf) and deformation coefficient (E50). This suggests that the higher strength of the improved soil results in increased toughness and resistance to deformation. A comparative analysis of the relationship between unconfined compressive strength and deformation parameters in Figure 13a,c reveals that the failure strain of LF-RMS is 0.3 times its unconfined compressive strength, which is consistent with C-RMS. In addition, the deformation coefficient of the LF-RMS specimen is 8.9 times its unconfined compressive strength, exceeding that of the C-RMS specimen by 5.51 times. It is evident that as the strength of the LF-RMS specimen increases, its resistance to deformation also increases rapidly.
In summary, the brittle failure characteristics of the axial stress-strain curves of C-RMS samples are more pronounced at the same curing age. The failure strains of the LF-RMS specimens exceed those of the C-RMS specimens, while the deformation coefficients are smaller in comparison. Therefore, LF-RMS specimens have high toughness, whereas C-RMS specimens have strong deformation resistance. Upon combined analysis with failure strain and deformation coefficients, it is evident that the C-RMS specimens with WRM = 20% display superior toughness and deformation resistance. When the curing age is 7 days, with a cement content of 9% and a red mud content of 20%, the unconfined compressive strength of the C-RMS specimen reaches 3.94 MPa. As for the LF-RMS specimens, those with WLF = 20% and WRM = 23% show optimal deformation characteristics. At this juncture, when the curing age is 7 days, with the content of lime and fly ash at 20% and the red mud content at 23%, the unconstrained compressive strength of the LF-RMS specimen stands at 1.97 MPa. According to the Technical Instructions for highway pavement base construction (JTG/TF20-2015), it is found that C-RMS can be used for the base of secondary and sub-secondary highways (3.5 MPa~4.5 MPa) or the base of expressways and first-class highways (2.5 MPa~3.5 MPa). LF-RMS can be used on the base of highways and primary roads (≥1.1 MPa) or the bottom base (≥0.8 MPa). In addition, although the unconfined compressive strength of both LF-RMS samples is lower than that of the C-RMS samples, they have better toughness. In addition, a larger amount of red mud can be used in LF-RMS samples to consume more red mud and fly ash, resulting in higher economic and environmental benefits. Therefore, prioritizing the use of LF-RMS should be primarily considered for low-grade highways where a low-strength road surface is required.

3.2. Comparative Analysis of Tensile Properties

3.2.1. Stress-Strain Curve

The damage patterns of C-RMS and LF-RMS specimens in the split tensile test are essentially the same, with both specimens splitting from the center and being damaged in half. The damaged surfaces of all samples had vertical and uneven damage surfaces at 90° angles and showed typical gap damage characteristics. As a result, the trends of their tensile stress-strain curves are quite similar at different ages. Therefore, we analyzed the stress-strain relationship of modified soil by comparing the tensile stress-strain relationship curves of C-RMS specimens and LF-RMS specimens at a curing age of 28 days. Figure 14 and Figure 15 depict the tensile stress-strain curves of C-RMS and LF-RMS specimens, respectively. From these figures, it can be seen that both tensile stress-strain curves have distinct peak points representing sudden failure, which is consistent with the axial stress-strain trend. The difference is that the stress peak on the σ-ε curve is smaller, the stress develops smoothly with strain, and there are no distinct elastic or plastic deformation stages. After specimen destruction, there is a rapid stress drop without residual stress effect, indicating obvious brittle failure characteristics.
Compared with the stress-strain curves (a), (b), and (c), the figures show different degrees of discretization in the tensile behavior of C-RMS. A significant dispersion is observed in the curve when the cement content is 6%, whereas this dispersion decreases when the cement content increases to 12%. This suggests that higher cement content diminishes the influence of red mud on tensile strength, with cement playing a dominant role. Similarly, Figure 15 depicts a stress-strain curve for LF-RMS following a comparable pattern. Specifically, with higher lime-fly ash content, the influence of different red mud contents on tensile strength diminishes, with lime-fly ash taking precedence. At a constant lime-fly ash content and WRM = 23%, the curve exhibits the steepest slope and rapid development of stress with increasing strain. This can be attributed to the fact that 23% red mud is optimal to more effectively modify the soil reaction and increase the structural cementation strength.

3.2.2. Deformation Characteristic Analysis

As depicted in Figure 16, the tensile failure strain and deformation coefficient of C-RMS samples, both limited to 20% red mud content, exhibit a general trend of first increasing and then decreasing. The peak point occurs at WRM = 20%, indicating that C-RMS samples have the highest tensile strength at a red mud content of 20%. Furthermore, the compression set properties of C-RMS follow a similar trend. For LF-RMS samples with WRM = 23% as the limit, the tensile failure strain initially decreases and then increases, while the deformation coefficient shows an opposite pattern of increase and then decrease. Consequently, at a red mud content of 23%, the failure strain is minimized and the deformation coefficient is maximized. A comparison reveals that both the tensile failure strain and the deformation coefficient reach their maximum values when WRM = 23% and WLF = 20%. This trend is consistent with that observed in the LF-RMS compression deformation properties for similar reasons.

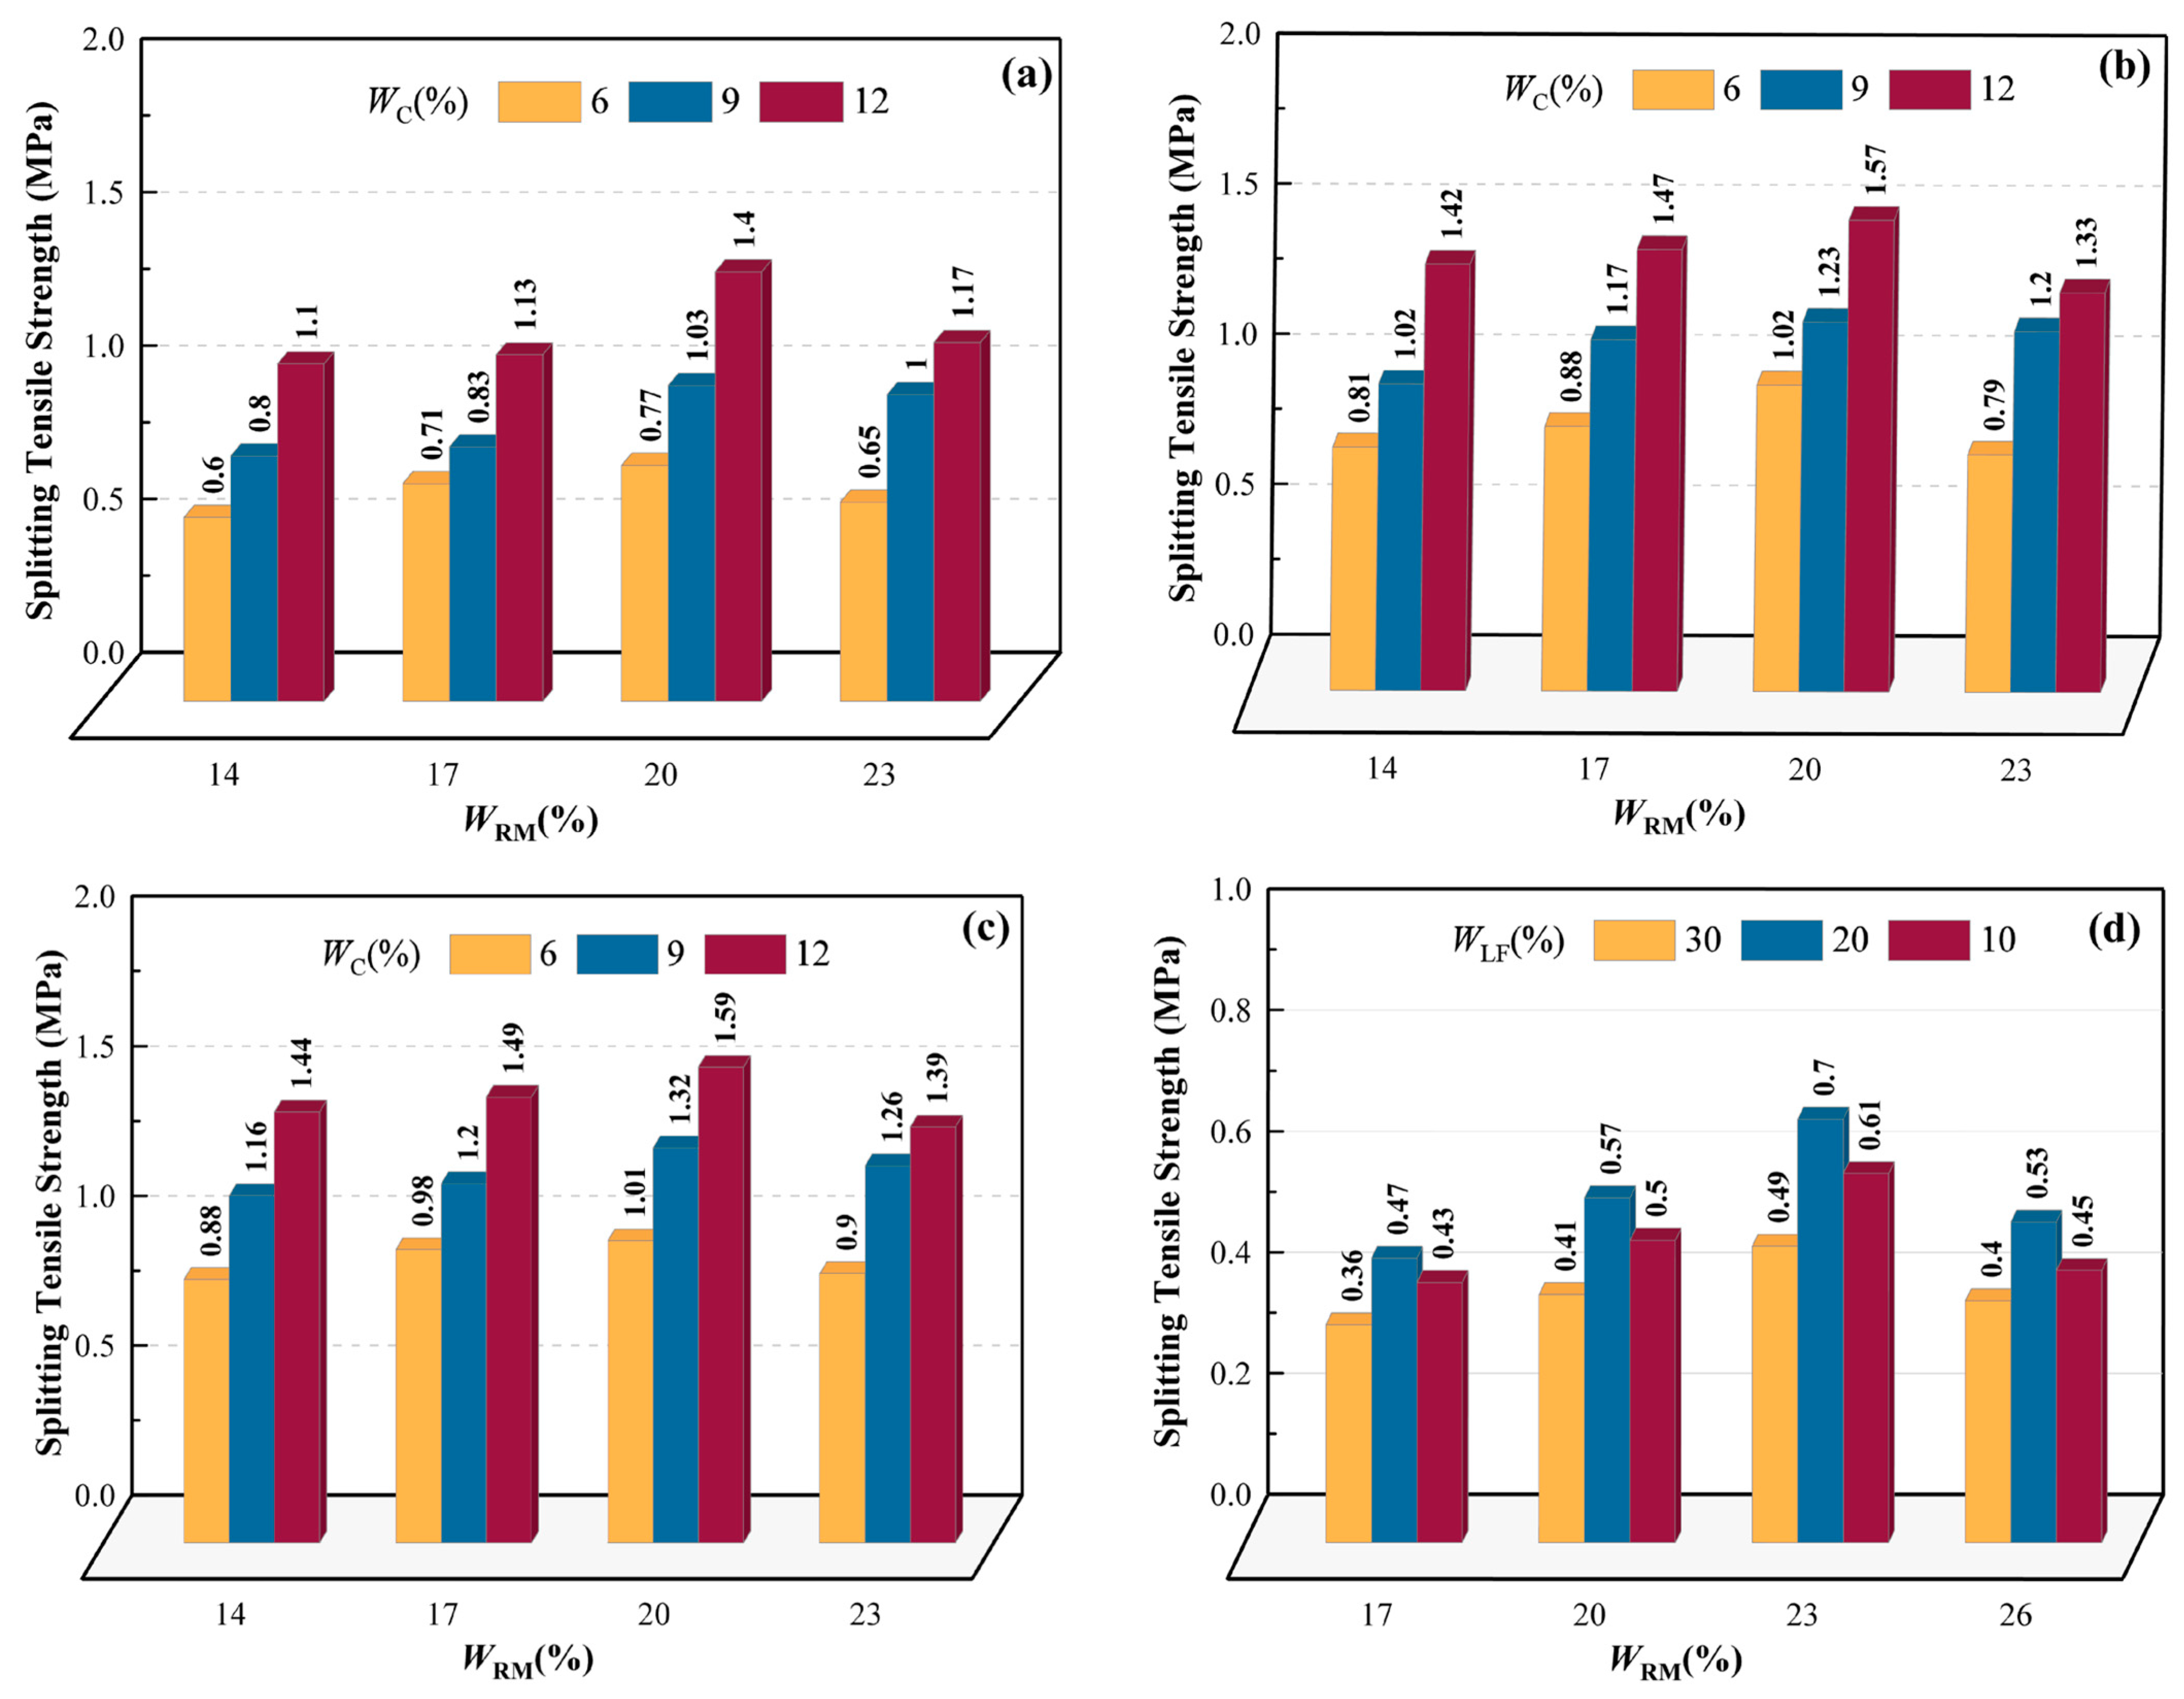
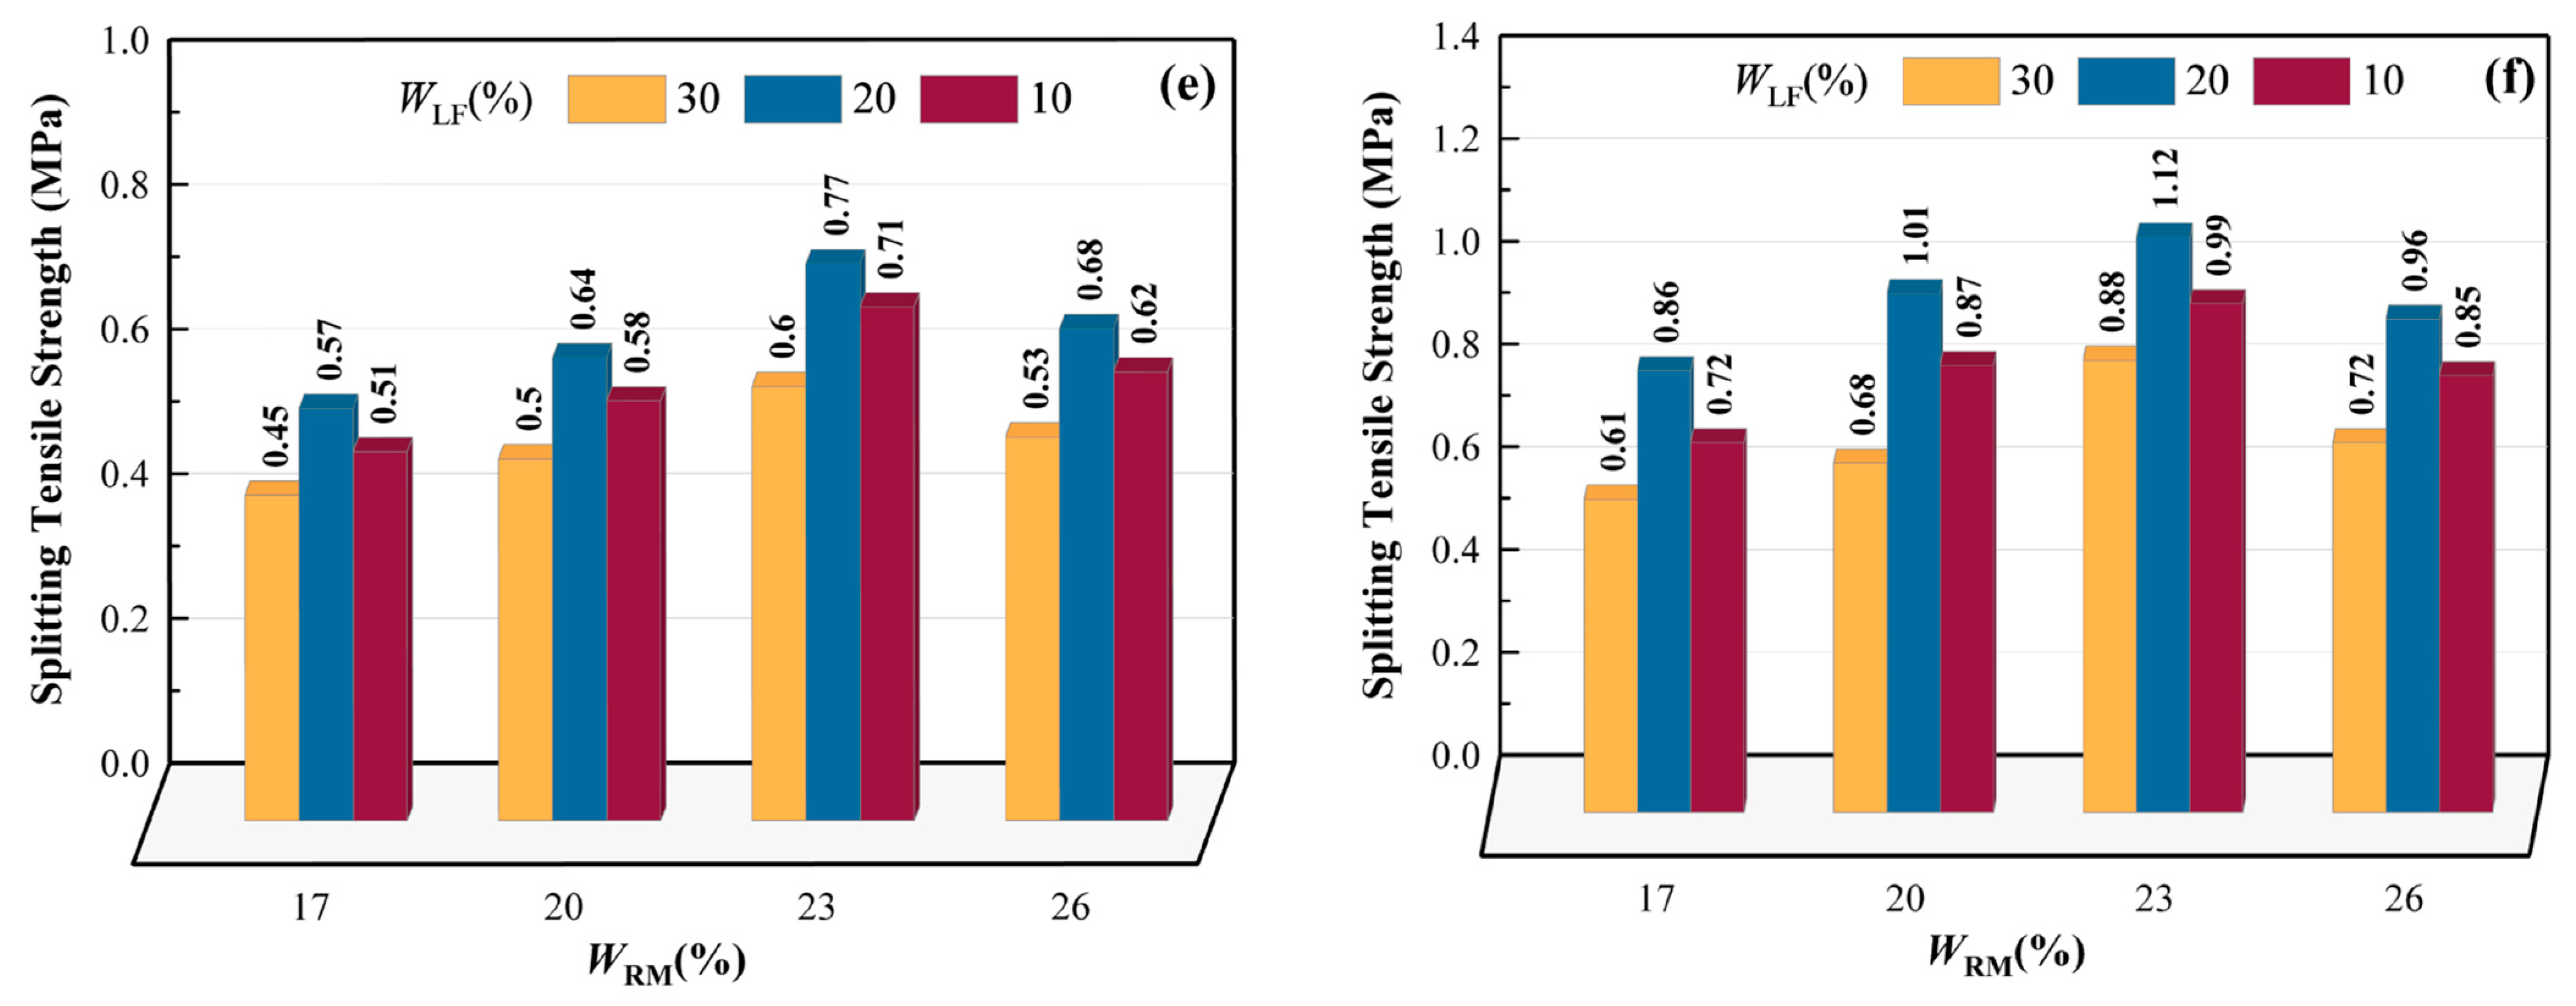
3.2.3. Tensile Strength

According to Figure 17a–c, the tensile strength of the sample initially increases and then decreases at the same age and cement content, with the red mud content WRM = 20% being the limit value. Thus, the maximum value of tensile strength for the samples is achieved when WRM = 20%. This change follows a similar pattern to the unconstrained C-RMS compressive strength, with a consistent underlying mechanism but different numerical values. A comprehensive analysis of the tensile deformation properties and tensile strength of C-RMS, combined with unconfined compressive strength test results, shows that both the compressive and tensile properties are optimal at a red mud content of 20%. As depicted in Figure 17d–f, the tensile strength of the samples with the same age and identical lime-fly ash admixture initially increases before decreasing with increasing red mud content. If the red mud mixture is kept constant over a certain age, an increase in lime-fly ash content will result in an initial increase followed by a decrease in the tensile strength of the sample. Consequently, there is an optimal value for both the red mud dosage and the lime fly ash content, at which the maximum splitting tensile strength is WRM = 23% and the lime-fly ash content WLF = 20%. The fundamental reason for this phenomenon is consistent with that observed for the unconfined LF-RMS compressive strength. A comprehensive analysis combining both stress-deformation properties and unconfined compressive strength test results suggests that optimal compressive and tensile properties for LF-RMS samples are achieved at 23% red mud content and 20% lime-fly ash.
In summary, the rules for apportioning tensile strength and confined compressive strength are identical for C-RMS and LF-RMS, and the underlying mechanisms are also the same. The only difference is the size of the values. Furthermore, considering the strength properties of unconfined compressive strength, it can be concluded that the optimal compressive and tensile properties of C-RMS samples are achieved when WRM = 20%. Similarly, for LF-RMS samples, the compressive and tensile properties are optimized at WRM = 23% and WLF = 20% content.

3.3. Comparative Analysis of Microscopic Experiments

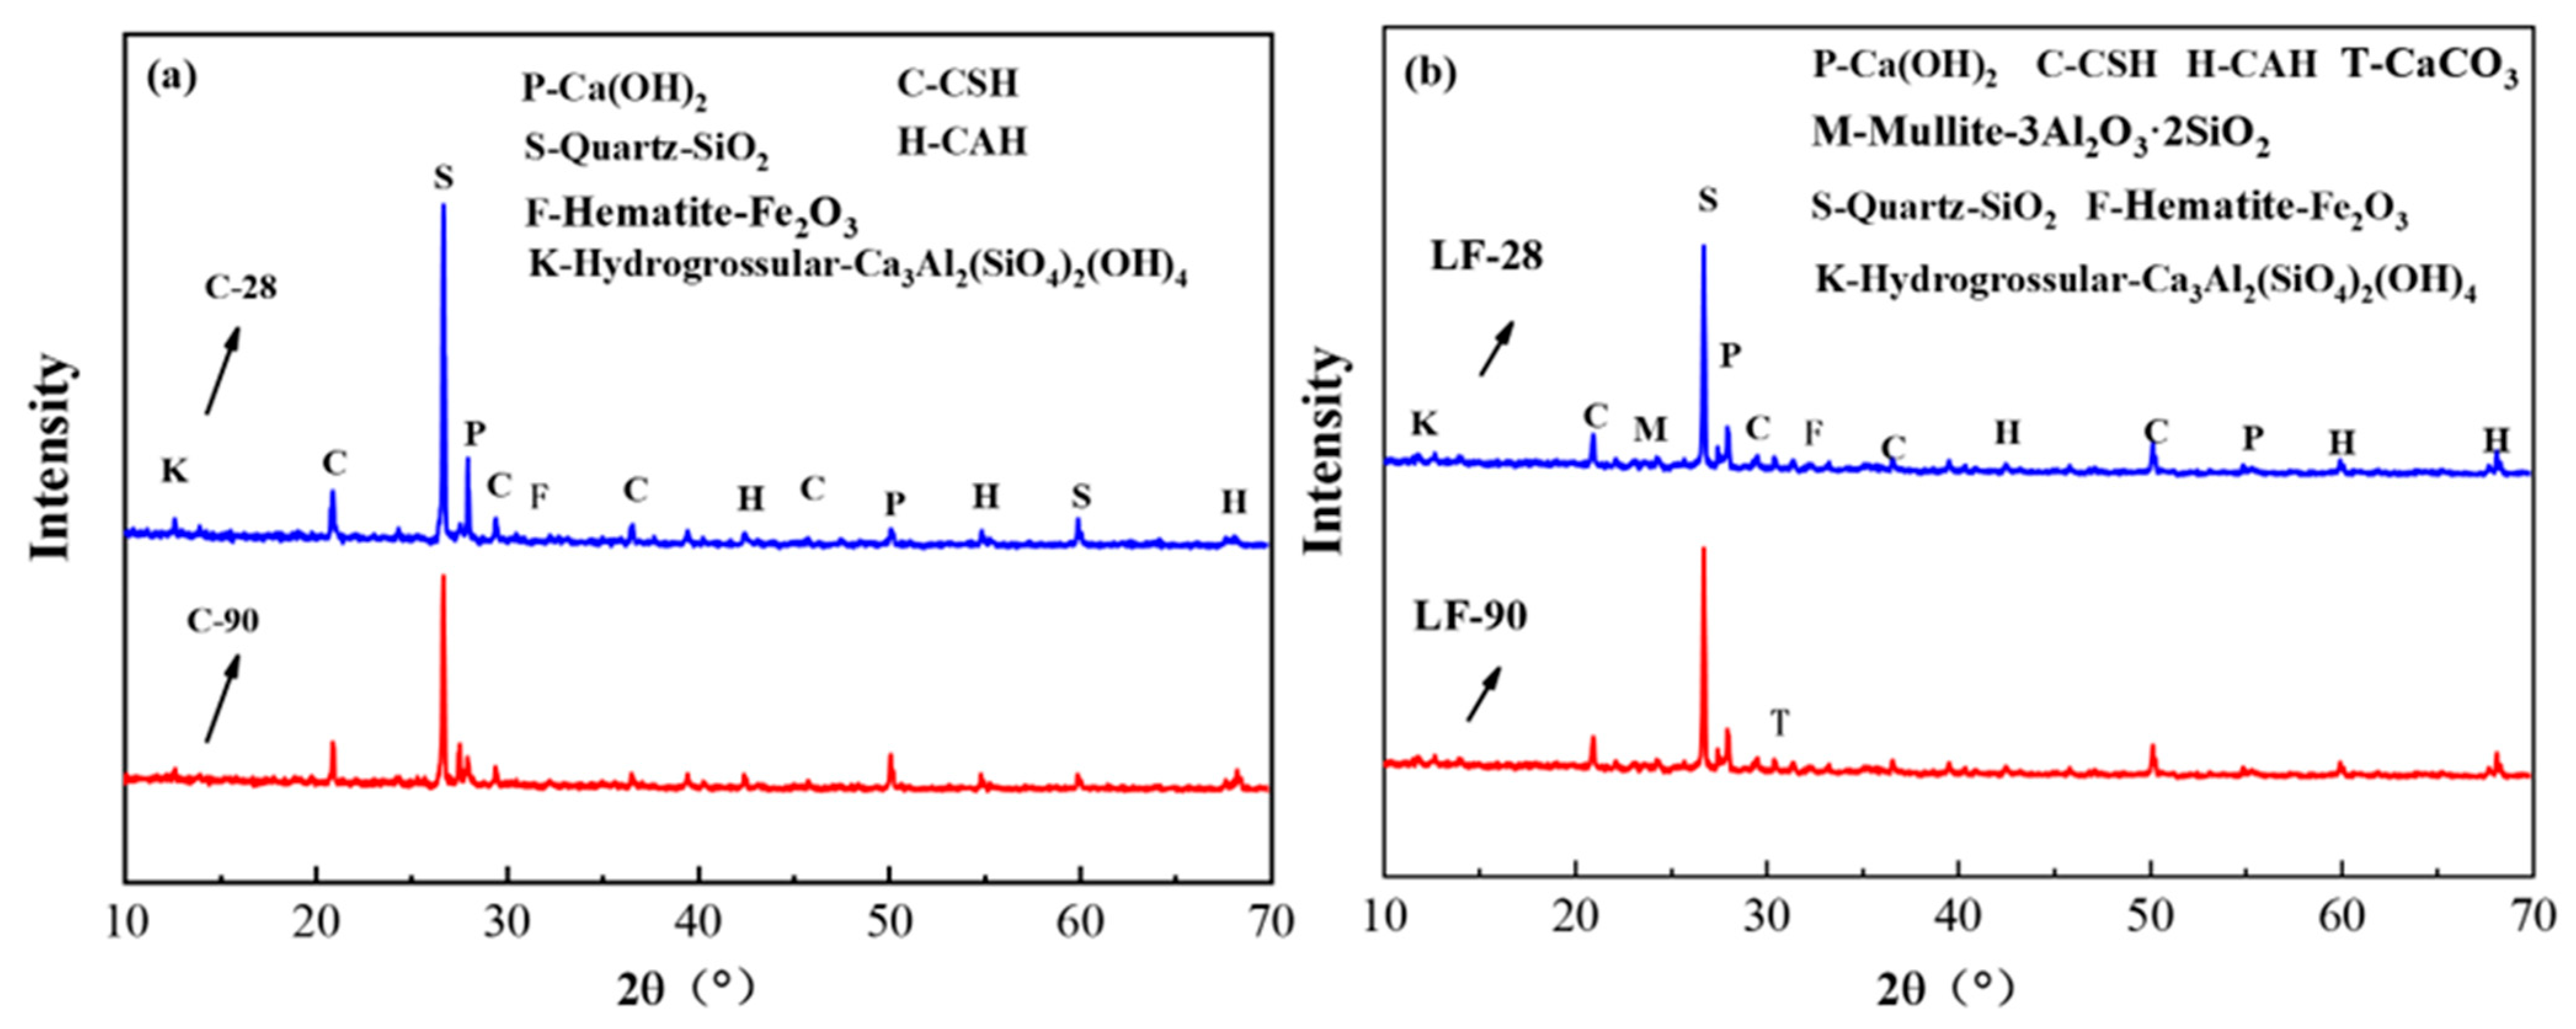
3.3.1. Hydration Product Analysis

Figure 18 shows the XRD spectra for the C-RMS and LF-RMS specimens, respectively. Comparing Figure 18a,b reveals that both C-RMS and LF-RMS specimens contain native red mud minerals, such as hematite, hydrocalumite, and quartz. The LF-RMS samples contain a small amount of low-activity minerals such as mullite due to the presence of fly ash. These minerals have low activity and are difficult to participate in hydration reactions. Therefore, they do not influence the changes in the strength of the modified soil. Figure 18a shows the XRD patterns of C-RMS specimens at 7 d and 90 d ages. From the picture, the main hydration products of the C-RMS specimen include crystalline calcium hydroxide (Ca(OH)2), calcium silicate hydrate (C-S-H), and calcium aluminate hydrate (C-A-H). This is because, under the alkaline conditions of red mud, the silica-alumina tetrahedra in the cement admixture can depolymerize and re-polymerize into cementitious products, generating calcium hydroxide. At the same time, the hydration reaction of cement produces calcium hydroxide, which causes the cleavage of aluminum-oxygen and oxygen bonds in the reactive minerals in the red mud, thereby forming silicon and aluminum monomers. As the hydration reaction of the cement progresses, a significant amount of calcium hydroxide is produced. The calcium ions (Ca2+) continue to polymerize with silicon and aluminum monomers, forming cementitious products (C-S-H). The hydration products are the main reason for the increase in strength of cement-red mud-stabilized (C-RMS) specimens after the addition of red mud. The main reaction equations are outlined below (1)–(4).
2(3CaO·SiO2) + 6H2O→3CaO·2SiO2·3H2O + 3Ca(OH)2
2(2CaO·SiO2) + 4H2O→3CaO·2SiO2·3H2O + Ca(OH)2
3CaO·Al2O3 + 6H2O→3(CaO·Al2O3·2H2O)
Ca(OH)2+ SiO2+ H2O→CSH
From Figure 18b, it can be found that LF-RMS specimens contain an additional calcium carbonate (CaCO3) product, resulting from the crystallizing and carbonizing of lime compared to C-RMS specimens. When lime comes into contact with water, it initially forms Ca(OH)2. As the solution of Ca(OH)2 becomes saturated, it gradually crystallizes into calcium hydroxide crystals (Ca(OH)2 · nH2O). Some of the calcium hydroxide will continue to react with carbon dioxide (CO2) in the air, leading to the formation of calcium carbonate (CaCO3) crystals. However, this reaction process occurs slowly. The LF-90 specimen, cured for 90 days, also shows a characteristic peak of CaCO3 crystals at 30.6°. The main reaction equations for the early stage are shown as Equations (5)–(7).
CaO + H2O→Ca(OH)2
Ca(OH)2 + nH2O→Ca(OH)2 · nH2O
Ca(OH)2 + CO2 + nH2O→CaCO3 + (n + 1)H2O
The initial strength of LF-RMS primarily stems from the hydration of lime and the pozzolanic reactions between lime and red mud, as well as fly ash. When lime is dissolved in water, it produces calcium hydroxide (Ca(OH)2). The resulting dissociated Ca2+ and OH ions react with the silicon and aluminum reactive materials released from fly ash and red mud to form cementitious products such as calcium silicate hydrate (C-S-H) and calcium aluminate hydrate (C-A-H). This reaction process is similar to that of C-RMS, as seen in Equations (1)–(4).

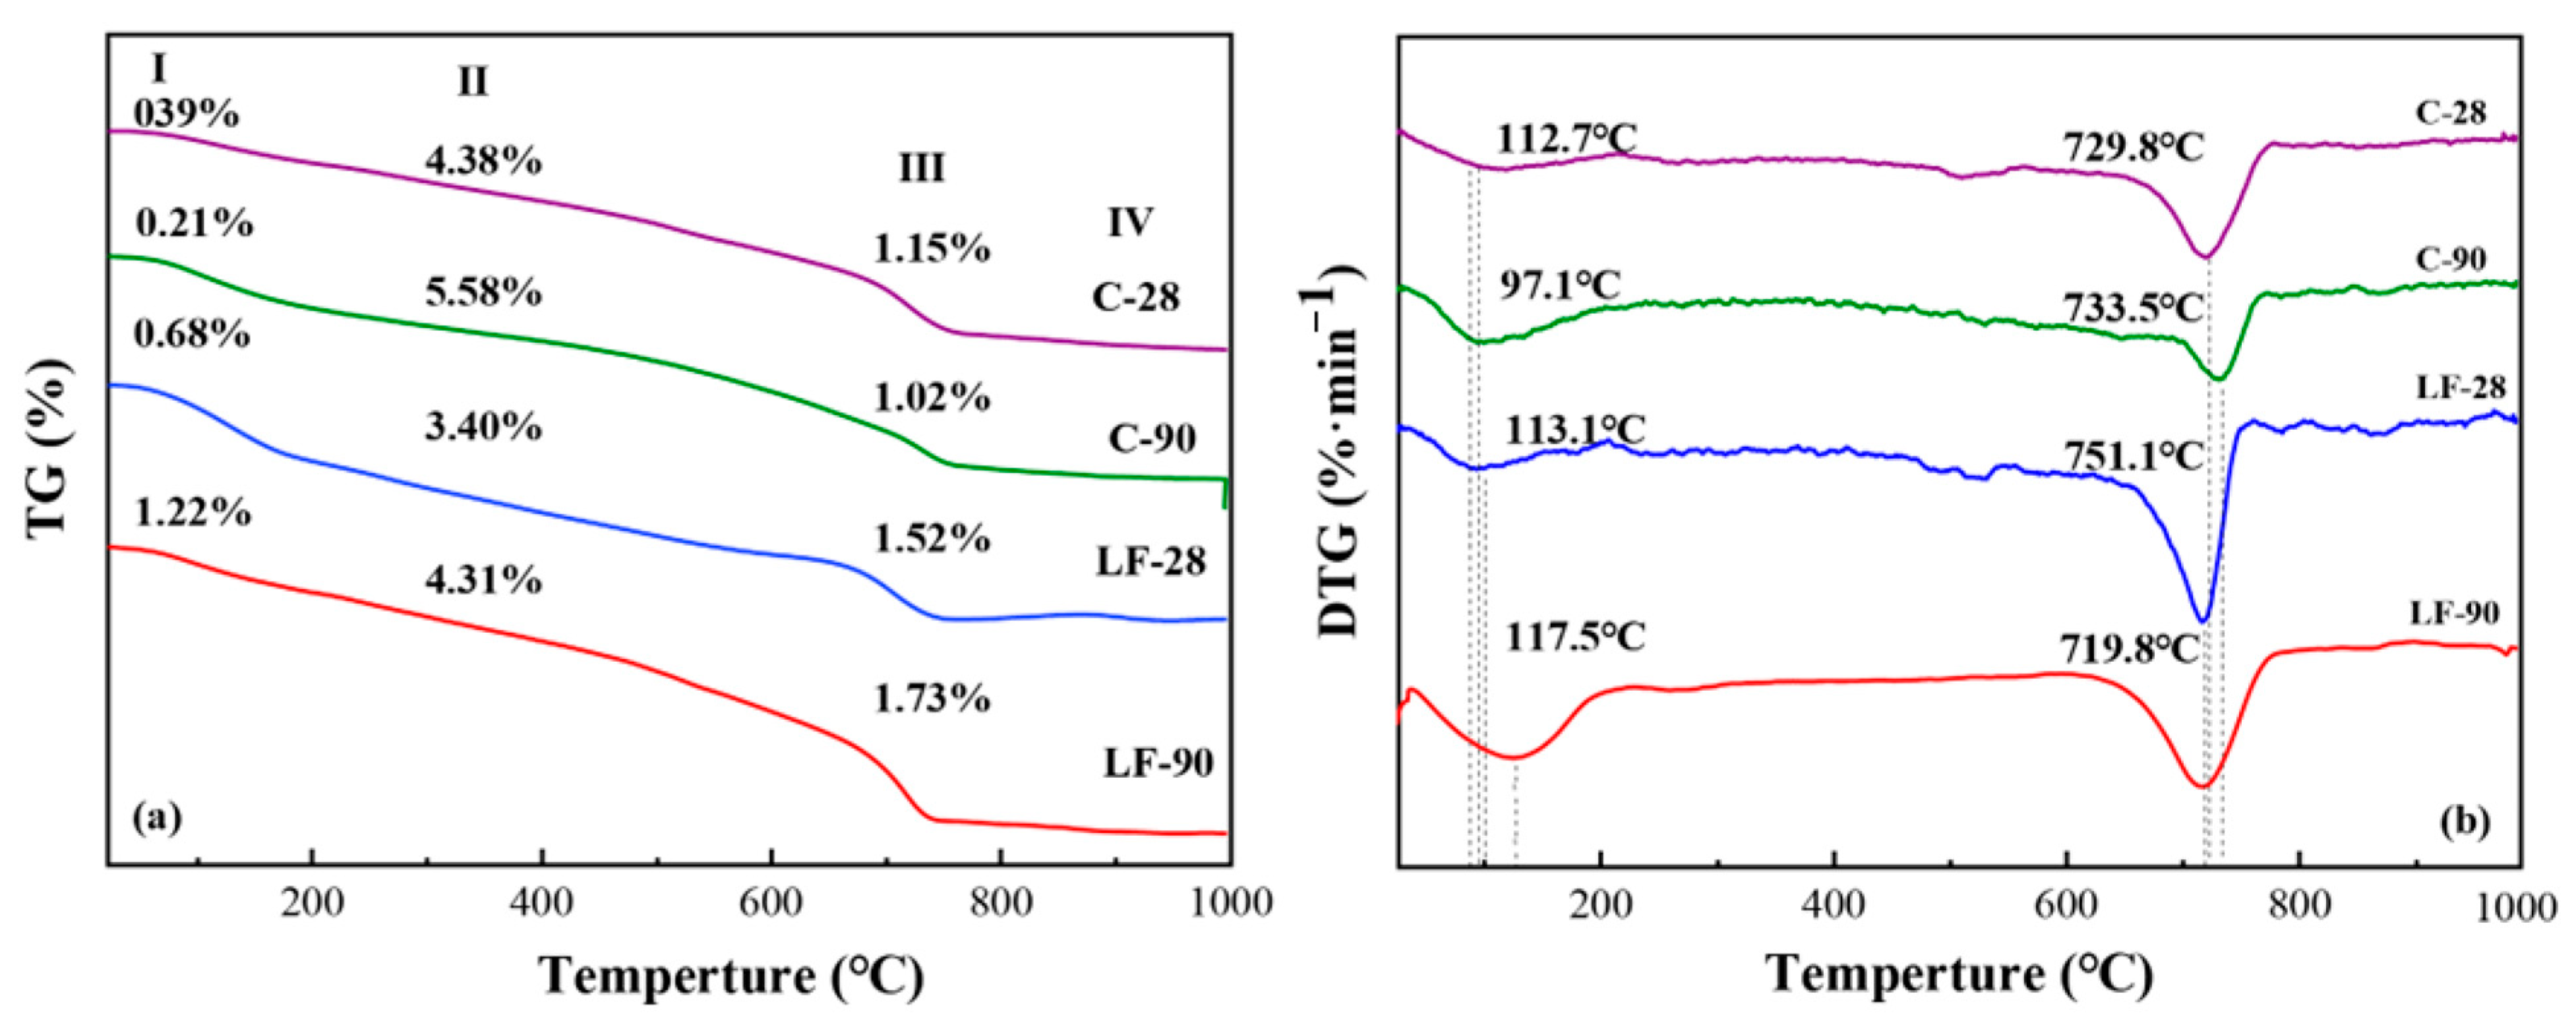
3.3.2. Thermogravimetric Analysis

Figure 19 shows the thermogravimetric diagrams of C-RMS and LF-RMS. By examining the mass loss and mass loss rate at various stages of the TG-DTG curve, along with the results of the XRD test, we can quantitatively analyze the specific substances present in the specimen. This approach also helps to reveal the mechanisms behind the strength variation of the modified soil.
Figure 19a,b displays the TG-DTG curves of C-RMS specimens and LF-RMS specimens. In both cases, the initial weight loss occurs at around 120 °C. This loss is primarily due to the removal of free water in the modified soil. In the first stage, the mass loss rates are as follows: the C-28 specimen shows a mass loss of 0.39%, the C-90 specimen has a rate of 0.21%, the LF-28 specimen is at 0.68%, and the LF-90 specimen registers a loss of 1.22%. Generally, the mass loss rate for C-RMS specimens is lower than that for LF-RMS specimens. This occurs because the hydration reaction in the CM-RMS specimens is more complete at this early stage, leading to greater consumption of free water in the modified soil. The second stage takes place within the temperature range of 120 °C to 720 °C and is primarily attributed to the dehydration and breakdown of hydration products, along with the elimination of bound water from certain minerals. The mass loss rates observed for the specimens are as follows: C-28 has a mass loss rate of 4.38%, C-90 is at 5.58%, LF-28 is 3.40%, and LF-90 is at 4.31%. Overall, the mass loss rate of the C-RMS specimens is lower than that of the LF-RMS specimens. These results suggest that the hydration product content in the C-RMS specimens is higher compared to that in the LF-RMS specimens. This difference can be attributed to a more effective hydration reaction in the C-RMS specimens. Among the specimens, C-90 exhibits the highest mass loss rate at 5.58%, whereas C-28 has a rate of 4.38%. As the curing time increased, the content of hydration products also rose, resulting in greater strength. Similarly, LF-90 shows a higher mass loss rate compared to LF-28, for the same underlying reasons. The third and fourth stages of weight loss occur around 720 °C to 1000 °C, primarily due to the decomposition of calcium hydroxide crystals in the C-RMS specimen, resulting in mass loss. At this stage, the C-90 specimen exhibits the lowest weight loss rate at 1.02%. It indicates that a greater amount of Ca(OH)2 crystals formed during cement hydration is being utilized. As a result, more hydration products are formed, contributing to an increase in the strength of the specimen. The weight loss of the LF-RMS specimens during the third stage is mainly attributed to the breakdown of calcium hydroxide crystals and CaCO3. In this stage, the weight loss of the LF-90 specimen is 1.73%, which is greater than the weight loss of the LF-28 specimen. This indicates that after a curing period of 90 days, the modified soil, under the effects of crystallization and carbonation of lime, has produced significant amounts of Ca(OH)2 and CaCO3 crystals. This process also explains the increase in strength of the LF-RMS specimens during the later stages. In the fourth stage, the weight loss of the C-RMS specimens is mainly attributed to the destruction of stable aluminosilicate structures within the red mud. In contrast, for the LF-RMS specimens, weight loss occurs due to the breakdown and decomposition of certain inert substances and mineral structures found in both the red mud and fly ash. This paper primarily investigates the impact of gel products formed during the hydration reaction on the strength of modified soil specimens, and the fourth stage will not be elaborated on in detail.

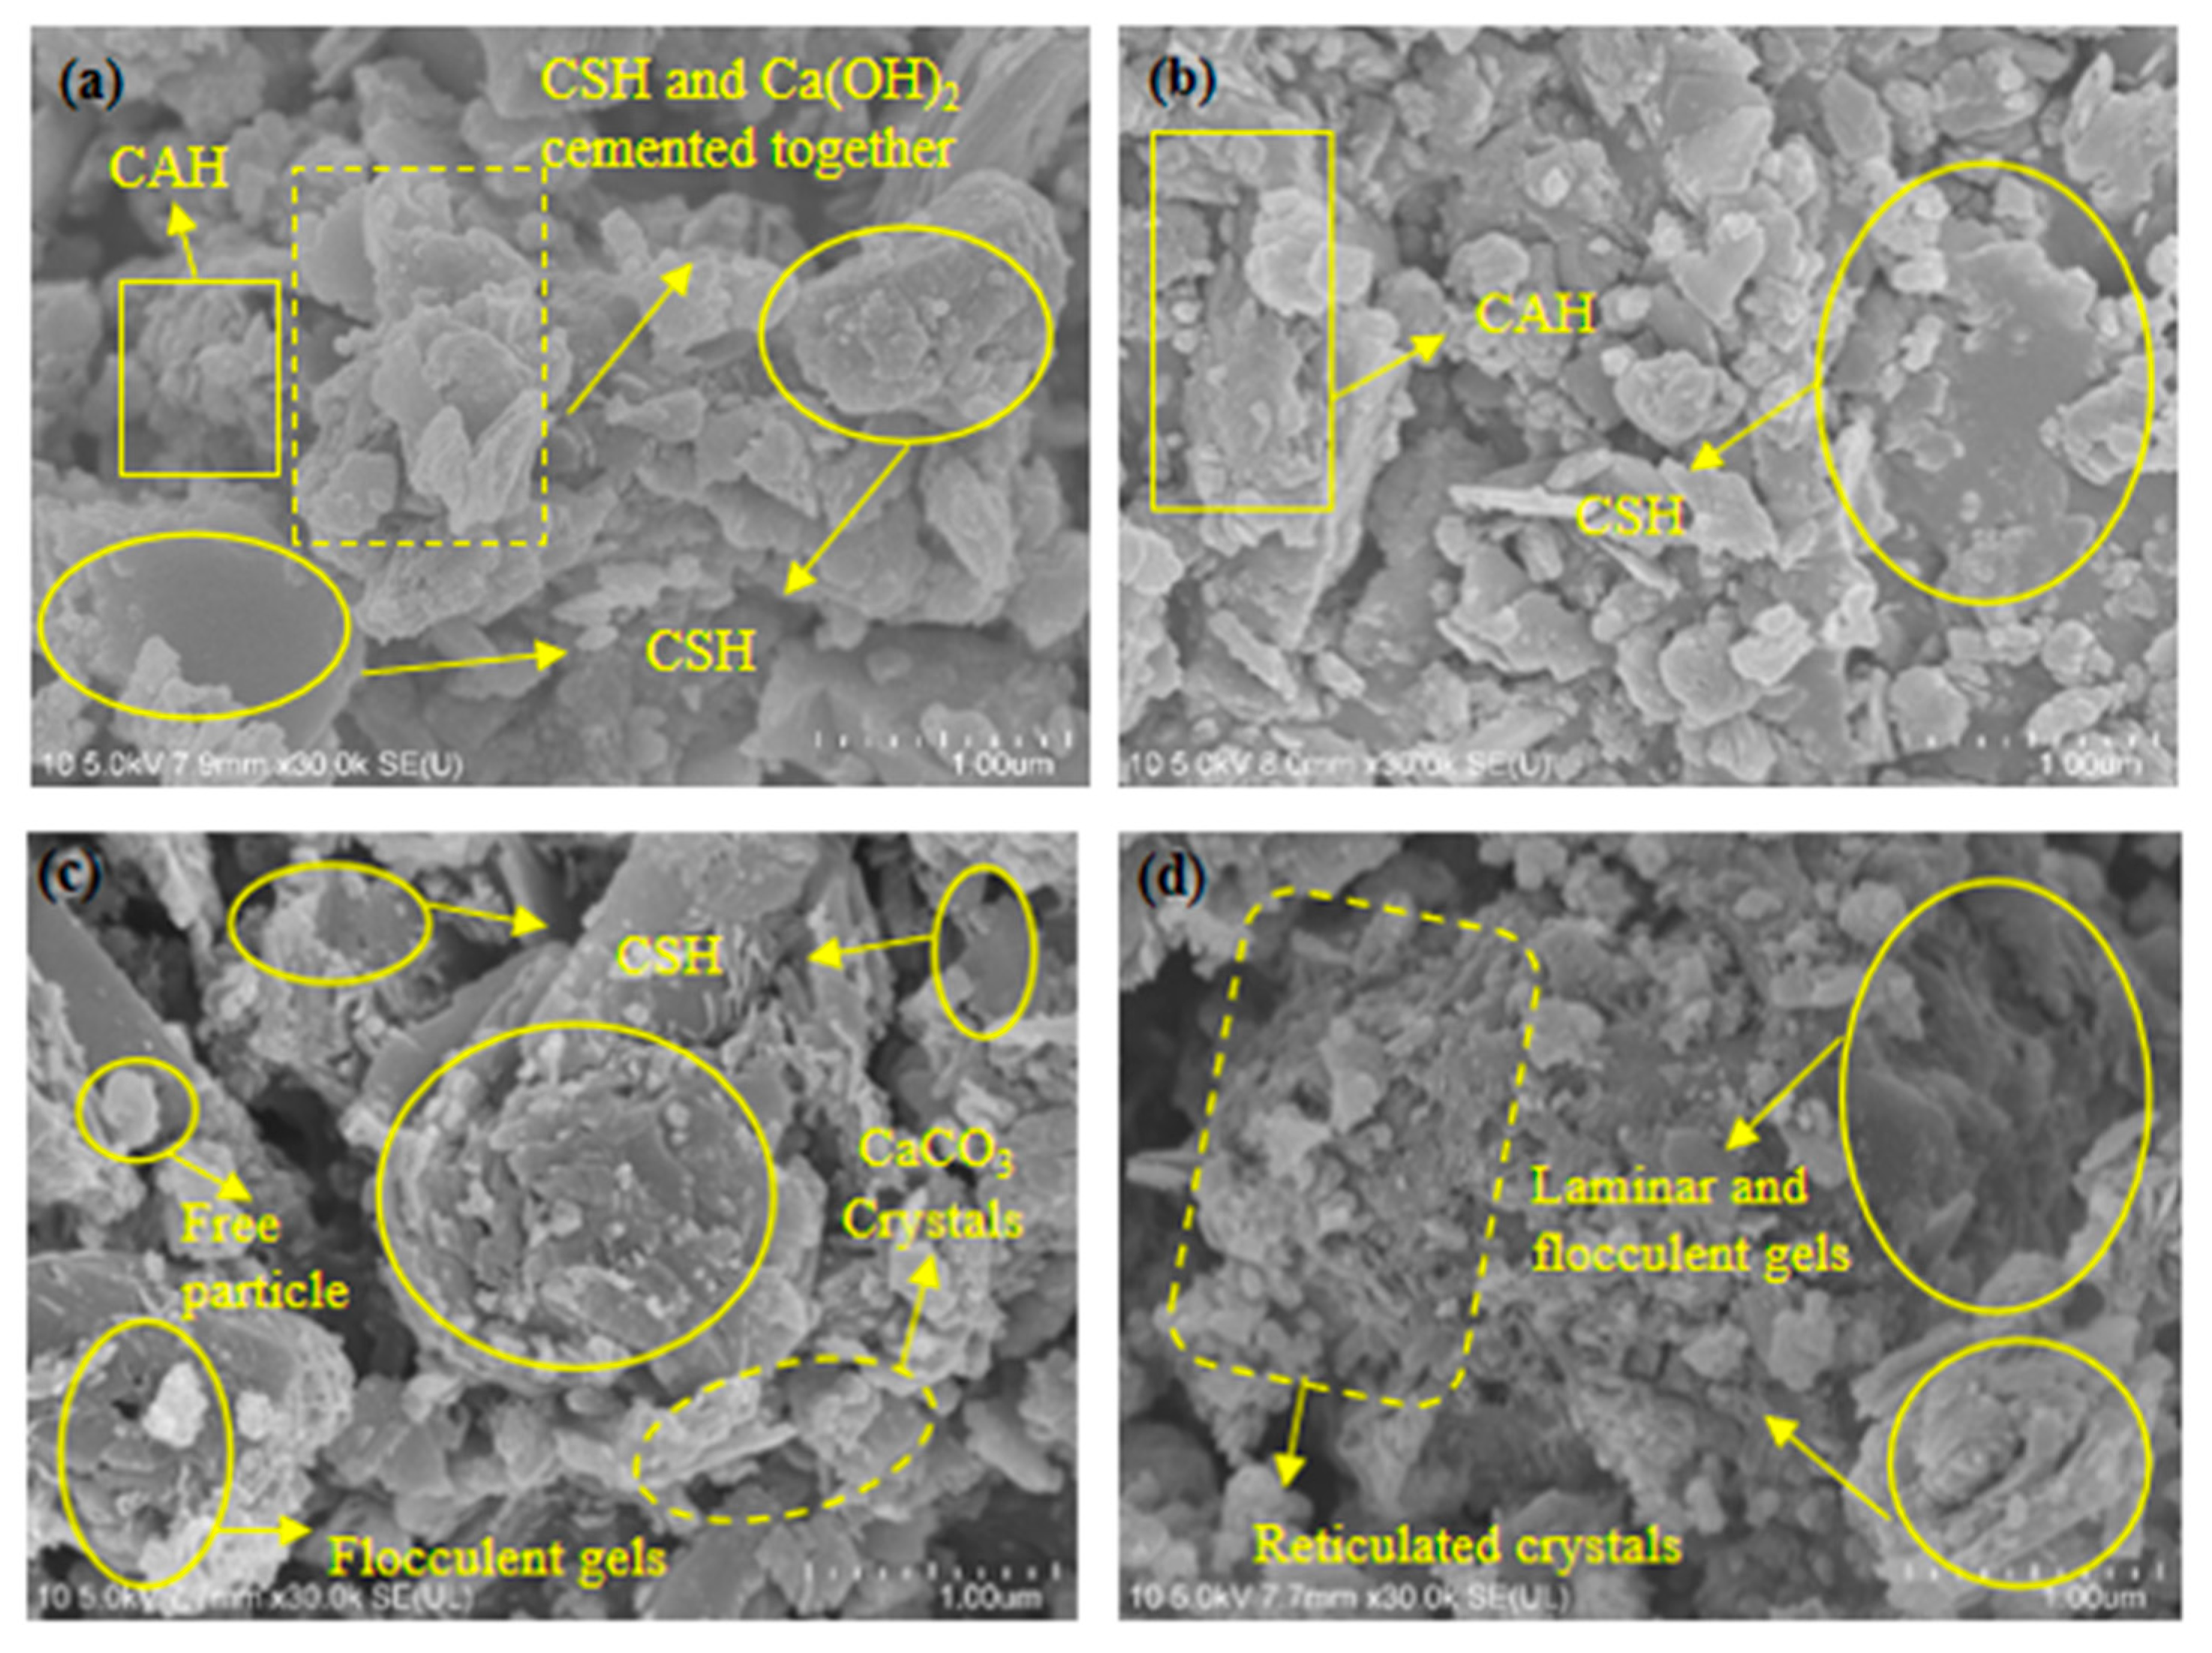
3.3.3. Microscopic Morphology Analysis

The strength of modified soil is mainly related to the content, distribution, and cementation form of hydration products, as well as the porosity of the soil. Figure 20 shows SEM images of C-RMS and LF-RMS specimens magnified 1000 times. Comparing a–d in Figure 20, it is evident that the coverage area of hydration products in the C-RMS specimens is larger than that in the LF-RMS specimens. This difference can be attributed to the more complete hydration reaction occurring in the C-RMS specimens, which aligns with the findings from the thermogravimetric tests. In conjunction with the XRD test results, as can be seen from Figure 20a,b, the hydration products of the C-RMS specimens are primarily C-S-H gels and Ca(OH)2 crystals. As the curing age is 28 days, as shown in Figure 20a, it can be observed that the overall soil structure is compact with only a few minor micropores present. The C-S-H in the soil exhibits a flattened shape, and a few layered C-A-H are produced. Those forms have a greater wrapping surface area and stronger cementing capability, which will effectively fill the pores in the soil, making the microstructure more compact. Additionally, a small number of C-S-H gels and Ca(OH)2 are intercrossed, cementing together, forming a denser structure, and increasing the soil’s strength. When the curing age is increased to 90 days, as shown in Figure 20b, the C-RMS specimens fully develop a dense structure, and at this point, the strength of the C-RMS specimens is at its highest. Consistent with the results of macroscopic mechanical tests. Figure 20c presents the SEM image of the LF-RMS specimen at a curing age of 28 days. It can be observed that although there are some non-hydrated red mud and fly ash particles in the soil, they are tightly adsorbed around the gel products and do not affect the strength of the soil structure. The cementitious products, such as C-S-H in the soil, are flaky and flocculated, with a large wrapping area and densely filled pores. As the curing age increases to 90 days, as shown in Figure 20d, it can be seen that there is a large amount of layered and flocculated gel substances or reticulated crystalline substances in the LF-RMS specimens at this time. The soil structure becomes more compact, which can improve the strength of the modified soil. This explains the increase in strength of the LF-RMS specimen in later stages.

3.4. Environmental Impact Assessment

If the strength of the improved red mud-based silty soil meets the roadworthiness requirements, its environmental impact indices must also meet these requirements. Therefore, representative specimens were selected based on the optimal ratio for testing and evaluating the environment of C-RMS and LF-RMS at a curing age of 28 days, with specimens containing 6% C + 20% RM and 20% LF + 23% RM. Table 9 shows that specific activities of radionuclides (226Ra, 232U, 40K) in the modified red mud-based silty soil decreased compared to those in pure red mud, with a larger decrease observed in C-RMS than in LF-RMS. The specific activities for radionuclides (226Ra, 232U, 40K) were found to be 103 Bq·kg−1, 52 Bq·kg−1, and 198 Bq·kg−1, respectively, for C-RMS, while for LF-RMS they were measured at 181 Bq·kg−1, 97 Bq·kg−1, and 332 Bq·kg−1, respectively. Subsequently, IRa =0.52 and Ir = 0.53 were calculated for C-RMS, whereas IRa = 0.91 and Ir = 0.94 for LF-RMS. These values meet requirements and indicate suitability for roadbed filling purposes [34,35].
Table 10 presents the concentrations of toxic leachate and the reduction percentages for both C-RMS and LF-RMS. According to the table, compared to pure red mud, the leaching toxicity of heavy metals in the modified red mud-based silty soil has decreased, with all heavy metal toxicity leachate concentrations meeting the requirements [36]. As shown in Table 10, the fluoride leaching concentration decreased from 0.9 mg/L in pure red mud to 0.44 and 0.53 mg/L, a reduction of 51.1% and 41.1%, respectively. The average reduction in toxic leach concentration was found to be 91% and 51.53%, respectively. Furthermore, IRa and IR for C-RMS experienced a decrease of 2.02 and 2.1, corresponding to reductions of approximately 79.5% and 79.8%. Similarly, IRa and Ir of LF-RMS decreased by 1.63 and 1.69, respectively, resulting in a decrease of 64.2% and 64.3%. LF-RMS was found to be inferior to C-RMS in all environmental indicators. However, compared to pure red mud, the modified soil showed improvements in all environmental indicators. It is noteworthy that the concentration of leached heavy metals in the modified soil decreased significantly. This is because heavy metal elements can enter into charge-balancing reactions with Al-O, Si-O, or Fe-O tetrahedra and can replace metal cations such as Al3+ and Ca2+ to participate in hydration reactions. This process fixes heavy metal ions into stable hydration products, thereby reducing their leaching and migration. In addition, the alkaline nature of red mud provides OH ions during the hydration reaction, which facilitates the formation of hydroxides or coprecipitation of heavy metal elements in the modified red mud-based silty soil [37]. Over time, this process transforms heavy metal elements from an unstable exchangeable state to a stable residual state, thereby reducing the leaching concentration of heavy metals and further suppressing their toxicity. The substitution reactions of heavy metal ions for Si and Al in silicates and aluminosilicates are relatively complex, but such reactions are generally prevalent and effective in solidifying heavy metal ions. In addition, the replacement efficiency and the way of different heavy metal ions are also different. For example, Cd2+ can replace Ca2+ in C-S-H gel, thus achieving the solidification of Cd2+. Pb2+ can not only replace Ca2+ in the interlayer structure of silicate gel but also form a variety of amorphous silica by connecting with the silica tetrahedron at the end of the C-S-H chain. Therefore, the curing methods and curing efficiency of Si and Ca in silicate gel products by different heavy metal ions need further study. In summary, the immobilization effect of heavy metal ions in modified soil is closely related to the progress of hydration reactions and the rate of formation of cementitious materials [38,39,40]. The hydration reaction of C-RMS is more effective, resulting in a higher abundance of hydration products. This can also explain the greater precipitation of heavy metals from C-RMS compared to LF-RMS.
In our study, we found that there are great differences in mechanical properties and environmental effects between cement-modified red mud-based silty soil and lime-fly ash-modified red mud-based silty soil. Based on varying red mud consumption rates, strength characteristics, and environmental impacts, this paper offers rational suggestions for the application of these two methods of modified red mud-based silty soil in highway engineering. Regarding red mud consumption: The consumption of red mud–based silty soil modified with cement is less than that modified with lime–fly ash. When strength requirements are met, lime–fly ash–modified red mud–based silty soil should be preferred. Regarding strength characteristics: In contrast, lime–fly ash–modified red mud–based silty soil forms strength more slowly in the early stages, but its strength will gradually increase over time. The lime-fly ash-modified red mud-based silty soil forms strength more slowly at the early stage, but its strength will gradually increase later. Environmental impact: Compared to cement–modified red mud–based silty soil, the environmental indicators of lime–fly ash–modified red mud–based silty soil are relatively poor. In addition, cement and lime are relatively low in price, readily available, and have broader potential for industrial promotion. Moreover, fly ash is itself a solid waste that can be utilized.
In addition, given that the research on modified soil is primarily applied in highway engineering, and the materials selected in this paper all come from Zhengzhou, China, we conduct macroscopic mechanical tests following relevant Chinese highway specifications. These include the “Highway Geotechnical Testing Code” (JTG 3430-2020) and the “Technical Specifications for Construction of Highway Subgrade and Base Courses” (JTG/T F20-2015). Tests such as unconfined compressive strength tests and splitting tensile strength tests are performed to better align with the applications in highway engineering. Based on the results of the macroscopic mechanical tests conducted in the paper, we preliminarily judge that cement-modified red mud-based silty soil can be used for the base or subbase courses of secondary and lower-grade highways according to the “Technical Specifications for Construction of Highway Subgrade and Base Courses” (JTG/T F20-2015). Lime-fly ash-modified red mud-based silty soil can be used for the base or subbase courses of expressways and first-class highways. After considering the red mud content, strength characteristics, and environmental impact, it is determined that the optimal red mud content in the lime-fly ash-modified red mud-based silty soil is higher, allowing for the consumption of more red mud. At the same time, it utilizes fly ash, which is also a solid waste, resulting in higher economic and environmental benefits. Therefore, for roads with lower strength requirements for subgrades, lime-fly ash-modified red mud-based silty soil should be given priority.
Because of the long-term characteristics of highway engineering, a systematic long-term monitoring and evaluation framework should be established for the environmental impact effects of red mud-based modified silt. This will facilitate providing a more comprehensive and in-depth analysis of the environmental impact associated with red mud-based subgrade stabilized soil. Furthermore, considering that subgrade stabilized soil is exposed to dynamic loads throughout its service life and exhibits long-term durability characteristics, further research is required to enhance its dynamic properties, fatigue performance under prolonged loading conditions, as well as its durability and water stability. In subsequent research, we plan to optimize the content and proportion of the binder by integrating experimental research with numerical simulation, thereby enhancing the performance and sustainability of the material. Additionally, we will explore the use of alternative adhesive types and industrial waste to further improve the material’s performance and sustainability.

4. Conclusions

(1)
The brittle failure characteristics of C-RMS are evident. The maximum strength, optimal toughness, and deformation resistance of the specimen occur at a red mud content of 20%. In contrast, LF-RMS exhibits stronger plastic damage properties, with maximum strength and better deformation properties at 23% red mud content and 20% lime-fly ash content.
(2)
Although LF-RMS has lower strength compared to C-RMS, it has better toughness and can utilize more red mud, resulting in greater economic and environmental efficiency. Therefore, it is recommended to prioritize LF-RMS for low-grade highways with lower road strength requirements.
(3)
In the splitting tensile test, all specimens of the modified red mud-based silty soil display typical splitting tensile failure patterns, with a 90° vertical direction and an uneven fracture surface. Furthermore, the tensile failure strength and deformation characteristics of the modified red mud-based silty soil are consistent with those observed in their unconfined compressive strength tests.
(4)
According to the Technical Instructions for highway pavement base construction (JTG/TF20-2015), it is found that C-RMS can be used for the base of secondary and sub-secondary highways (3.5 MPa~4.5 MPa) or the base of expressways and first-class highways (2.5 MPa~3.5 MPa). LF-RMS can be used on the base of highways and primary roads (≥1.1 MPa) or the bottom base (≥0.8 MPa).
(5)
The primary hydration products of C-RMS and LF-RMS are calcium silicate hydrate (CSH), calcium aluminate hydrate (CAH), and Ca(OH)2. In the LF-RMS at a curing age of 90 days, some CaCO3 crystals are present. At a curing age of 90 days, both C-RMS and LF-RMS are most fully hydrated, producing the greatest amount of gel.
(6)
The environmental indices of modified red mud-based silty soil meet the requirements for roadbed filling. Although the environmental indices of LF-RMS are slightly inferior to those of C-RMS, the red mud-based modified silty soil shows significant improvement in environmental impact compared to pure red mud.

Author Contributions

S.Y.: Methodology, investigation, data curation, writing—original draft. Y.L.: Supervision, writing—reviewing and editing. X.L.: resources, software, supervision, validation. P.W.: Data curation, supervision. Z.W.: Data curation. Y.W.: Data curation, investigation. All authors have read and agreed to the published version of the manuscript.

Funding

This research was funded by the National Natural Science Foundation of China (Nos. 51709290), Key Research Projects of Higher Education Institutions in Henan Province (22A580008), Key Scientific and Technological Project of Henan Province (242102320294), the Natural Science Foundation Project of Zhongyuan University of Technology (K2025ZD013).

Data Availability Statement

The original contributions presented in this study are included in the article. Further inquiries can be directed to the corresponding author.

Conflicts of Interest

The authors declare no conflict of interest.

References

  1. Patangia, J.; Saravanan, T.J.; Kabeer, K.S.A.; Bisht, K. Study on the utilization of red mud (bauxite waste) as a supplementary cementitious material: Pathway to attaining sustainable development goals. Constr. Build. Mater. 2023, 375, 131005. [Google Scholar] [CrossRef]
  2. Babisk, M.P.; Amaral, L.F.; da Silva Ribeiro, L.; Vieira, C.M.F.; do Prado, U.S.; Gadioli, M.C.B.; da Costa Garcia Filho, F.J. Evaluation and application of sintered red mud and its incorporated clay ceramics as materials for building construction. Mater. Res. Technol. 2020, 9, 2186–2195. [Google Scholar] [CrossRef]
  3. Agrawal, V.; Paulose, R.; Arya, R.; Rajak, G.; Giri, A.; Bijanu, A.; Salammal, S.T. Green conversion of hazardous red mud into diagnostic X-ray shielding tiles. J. Hazard. Mater. 2022, 424, 127507. [Google Scholar] [CrossRef] [PubMed]
  4. Pan, X.; Wu, H.; Lv, Z.; Yu, H.; Tu, G. Recovery of valuable metals from red mud: A comprehensive review. Sci. Total Environ. 2023, 904, 166686. [Google Scholar] [CrossRef] [PubMed]
  5. Khanna, R.; Konyukhov, Y.V.; Burmistrov, I.; Cayumil, R.; Belov, V.A.; Rogachev, S.O.; Mukherjee, P.S. An innovative route for valorising iron and aluminium oxide rich industrial wastes: Recovery of multiple metals. J. Environ. Manag. 2021, 295, 113035. [Google Scholar] [CrossRef]
  6. Vigneshwaran, S.; Uthayakumar, M.; Arumugaprabu, V. Development and sustainability of industrial waste-based red mud hybrid composites. J. Clean. Prod. 2019, 30, 862–868. [Google Scholar] [CrossRef]
  7. Arroyo, F.; Luna-Galiano, Y.; Leiva, C.; Vilches, L.F.; Fernández-Pereira, C. Environmental risks and mechanical evaluation of recycling red mud in bricks. Environ. Res. 2020, 186, 109537. [Google Scholar] [CrossRef]
  8. Leiva, C.; Arroyo-Torralvo, F.; Luna-Galiano, Y.; Villegas, R.; Vilches, L.F.; Fernández Pereira, C. Valorization of Bayer red mud in a circular economy process: Valuable metals recovery and further brick manufacture. Processes 2022, 10, 2367. [Google Scholar] [CrossRef]
  9. Taneez, M.; Hurel, C. A review on the potential uses of red mud as amendment for pollution control in environmental media. Environ. Sci. Pollut. Res. 2019, 26, 22106–22125. [Google Scholar] [CrossRef]
  10. Kryvenko, P.; Rudenko, I.; Sikora, P.; Sanytsky, M.; Konstantynovskyi, O.; Kropyvnytska, T. Alkali-activated cements as sustainable materials for repairing building construction: A review. J. Build. Eng. 2024, 90, 109399. [Google Scholar] [CrossRef]
  11. Roy, S.K.; Nayak, D.; Rath, S.S. A review on the enrichment of iron values of low-grade Iron ore resources using reduction roasting-magnetic separation. Powder Technol. 2020, 367, 796–808. [Google Scholar] [CrossRef]
  12. Habibi, H.; Pirouzan, D.; Shakibania, S.; Pourkarimi, Z.; Mokmeli, M. Physical and chemical separation of Ti, rare earth elements, Fe, and Al from red mud by carbothermal reduction, magnetic separation, and leaching. Environ. Sci. Pollut. Res. 2022, 29, 62952. [Google Scholar] [CrossRef] [PubMed]
  13. Agrawal, S.; Dhawan, N. Hydrogen reduction of red mud for extraction of metallic values. J. Sustain. Metall. 2023, 9, 386–397. [Google Scholar] [CrossRef]
  14. Agrawal, S.; Dhawan, N. Microwave acid baking of red mud for extraction of titanium and scandium values. Hydrometallurgy 2021, 4, 105704. [Google Scholar] [CrossRef]
  15. Loebsack, G.; Kang, K.; Klinghoffer, N.B.; Yeung, K.K.C.; Torsello, D.; Gerbaldo, R.; Berruti, F. Adsorption mechanisms and optimal production of magnetic biochar composites from red mud and soft wood biomass. J. Anal. Appl. Pyrol. 2024, 177, 106340. [Google Scholar] [CrossRef]
  16. Zhang, D.; Yan, K.; Liu, Y.; Naidu, R. Effects of phosphate, red mud, and biochar on As, Cd, and Cu immobilization and enzymatic activity in a Co-Contaminated soil. Processes 2022, 10, 1127. [Google Scholar] [CrossRef]
  17. Oprčkal, P.; Mladenovič, A.; Zupančič, N.; Ščančar, J.; Milačič, R.; Serjun, V.Z. Remediation of contaminated soil by red mud and paper ash. J. Clean. Prod. 2020, 256, 120440. [Google Scholar] [CrossRef]
  18. Xiao, R.; Nie, Q.; Dai, X.; Wan, Z.; Zhong, J.; Ma, Y.; Huang, B. Developing alkali-activated controlled low-strength material (CLSM) using urban waste glass and red mud for sustainable construction. J. Build. Eng. 2024, 98, 111202. [Google Scholar] [CrossRef]
  19. Ślosarczyk, A.; Fořt, J.; Klapiszewska, I.; Thomas, M.; Klapiszewski, Ł.; Černý, R.A. literature review of the latest trends and perspectives regarding alkali-activated materials in terms of sustainable development. J. Mater. Res. Technol. 2023, 25, 5394–5425. [Google Scholar] [CrossRef]
  20. Wang, C.; Liu, H.; Wu, D.; Liu, X. Engineering and environmental evaluation of red mud amended volcanic ash as a sustainable subgrade material. J. Clean. Prod. 2023, 393, 136353. [Google Scholar] [CrossRef]
  21. Singh, V.; Bano, S.; Chauhan, V.B.; Pal, P.; Kumar, A.; Srivastava, J.B. Red mud as a sustainable road construction material: An experimental investigation. Constr. Build. Mater. 2024, 411, 134549. [Google Scholar] [CrossRef]
  22. Salim, M.U.; Mosaberpanah, M.A.; Danish, A.; Ahmad, N.; Khalid, R.A.; Moro, C. Role of bauxite residue as a binding material and its effect on engineering properties of cementitious Composites: A review. Constr. Build. Mater. 2023, 409, 133844. [Google Scholar] [CrossRef]
  23. Singh, S.; Kumar, A.; Sitharam, T.G. Experimental study on strength, durability, hydraulic and toxicity characteristics of soil treated with mine tailings based geopolymers for sustainable road subgrade application. Constr. Build. Mater. 2024, 414, 134894. [Google Scholar] [CrossRef]
  24. Saranya, V.; Karthiyaini, S.; Stone, D. Enhancement of strength and microstructural characterization in red mud-iron carbonate binders: Effects of CO2 sequestration and oxalic acid concentration. Results Eng. 2025, 25, 104539. [Google Scholar] [CrossRef]
  25. Du, Z.; Sheng, S.; Guo, J. Effect of composite activators on mechanical properties, hydration activity and microstructure of red mud-based geopolymer. J. Mater. Res. Technol. 2023, 24, 8077–8085. [Google Scholar] [CrossRef]
  26. Chandra, K.S.; Krishnaiah, S.; Reddy, N.G.; Hossiney, N.; Peng, L. Strength development of geopolymer composites made from red mud–fly ash as a subgrade material in road construction. J. Hazard. Toxic. Radio 2021, 1, 04020068. [Google Scholar] [CrossRef]
  27. Koshy, N.; Dondrob, K.; Hu, L.; Wen, Q.; Meegoda, J.N. Mechanical properties of geopolymers synthesized from fly ash and red mud under ambient conditions. Crystals 2019, 9, 572. [Google Scholar] [CrossRef]
  28. Liu, S.; Li, Z.; Li, Y.; Cao, W. Strength properties of Bayer red mud stabilized by lime-fly ash using orthogonal experiments. Constr. Build. Mater. 2018, 166, 554–563. [Google Scholar] [CrossRef]
  29. Panda, S.; Pradhan, M.; Panigrahi, S.K. Optimal Red Mud Replacement Level Evaluation in Conventional Concrete Based on Fresh and Hardened Concrete Characteristics. J. Sustain. Metall. 2024, 10, 835–850. [Google Scholar] [CrossRef]
  30. Wu, Y.; Li, Z.; Yin, S.; Yan, P.; Wang, Y.; Li, X. Experimental study on the mixing ratio of cement and red mud to improve silty soil. Light. Met. 2023, 4, 13–20. [Google Scholar] [CrossRef]
  31. Suo, C.; Yao, X.; Song, Z.; Dong, X. Mechanical and leaching characteristics of red mud residue solidified/stabilized high Cu (II)-contaminated soil. Environ. Earth Sci. 2022, 81, 9. [Google Scholar] [CrossRef]
  32. Aziman, E.S.; Ismail, A.F.; Jubri, S.F.; Rahmat, M.A.; Idris, W.M.R. Environmental impact assessment of post illegal mining activities in Chini Lake with regards to natural radionuclides and heavy metals in water and sediment. J. Radioanal. Nucl. Chem. 2021, 330, 667–683. [Google Scholar] [CrossRef]
  33. Tastan, E.O.; Edil, T.B.; Benson, C.H.; Aydilek, A.H. Stabilization of organic soils with fly ash. J. Geotech. Geoenviron. 2011, 137, 819–833. [Google Scholar] [CrossRef]
  34. Somlai, J.; Jobbagy, V.; Kovacs, J.; Tarján, S.; Kovács, S.T. Radiological aspects of the usability of red mud as building material additive. J. Hazard. Mater. 2008, 150, 541–545. [Google Scholar] [CrossRef]
  35. Ozden, B.; Brennan, C.; Landsberger, S. Environmental assessment of red mud by determining natural radionuclides using neutron activation analysis. Environ. Earth Sci. 2019, 78, 114. [Google Scholar] [CrossRef]
  36. Nguyen, H.T.; Bui, T.H.; Pham, V.T.H.Q.; Do, M.Q.; Hoang, M.D.; Le, V.Q. Leaching behavior and immobilization of heavy metals in geopolymer synthesized from red mud and fly ash. Key Eng. Mater. 2018, 777, 518–522. [Google Scholar] [CrossRef]
  37. Żak, R.; Deja, J. Spectroscopy study of Zn, Cd, Pb and Cr ions immobilization on C–S–H phase. Spectrochim. Acta A 2015, 134, 614–620. [Google Scholar] [CrossRef]
  38. Król, M.; Florek, P.; Marzec, M.; Wójcik, S.; Dziża, K.; Mozgawa, W. Structural studies of calcium silicate hydrate modified with heavy metal cations. Spectrochim. Acta Part A Mol. Biomol. Spectrosc. 2024, 321, 124681. [Google Scholar] [CrossRef]
  39. Król, M.; Florek, P.; Dziża, K.; Mozgawa, W. Spectroscopic studies of heavy metal cations influence on the structure of synthetic hydrated calcium aluminosilicates. Spectrochim. Acta Part A Mol. Biomol. Spectrosc. 2023, 294, 122559. [Google Scholar] [CrossRef]
  40. Yang, F.; Pang, F.; Xie, J.; Wang, W.; Wang, W.; Wang, Z. Leaching and solidification behavior of Cu2+, Cr3+ and Cd2+ in the hydration products of calcium sulfoaluminate cement. J. Build. Eng. 2020, 46, 103696. [Google Scholar] [CrossRef]
Figure 1. Grain grading curve of red mud and silty soil.
Processes 13 01955 g001
Figure 2. XRD patterns of red mud and silty soil.
Processes 13 01955 g002
Figure 3. C-RMS Compaction curve; (a) WC = 6% (7 d); (b) WC = 9% (28 d); (c) WC = 12% (90 d).
Processes 13 01955 g003
Figure 4. LF-RMS Compaction curve; (a) WLF 10% (7 d); (b) WLF 20% (28 d); (c) WLF = 30% (90 d).
Processes 13 01955 g004
Figure 5. Test process: (a) Unconfined compressive strength meter, (b) Specimen mold, (c) Specimen curing.
Processes 13 01955 g005
Figure 6. Test instruments: (a) X-ray diffraction tester, (b) Synchronous thermal analyzer, (c) Scanning electron microscope.
Processes 13 01955 g006
Figure 7. Cement-modified red mud-based silty soil stress-strain relationship curves; (ac) show the stress-strain curves of C-RMS with cement contents of 6%, 9%, and 12%, respectively, after a curing period of 7 days; (df) show the stress-strain curves of C-RMS with cement contents of 6%, 9%, and 12%, respectively, after a curing period of 28 days; (gi) show the stress-strain curves of C-RMS with cement contents of 6%, 9%, and 12%, respectively, after a curing period of 90 days.
Processes 13 01955 g007
Figure 8. Lime-fly ash modified red mud-based silty soil stress-strain relationship curves; (ac) show the stress-strain curves of LF-RMS with Lime-fly ash contents of 10%, 20%, and 30%, respectively, after a curing period of 7 days; (df) show the stress-strain curves of LF-RMS with Lime-fly ash contents of 6%, 9%, and 12%, respectively, after a curing period of 28 days; (gi) show the stress-strain curves of LF-RMS with Lime-fly ash contents of 6%, 9%, and 12%, respectively, after a curing period of 90 days.
Processes 13 01955 g008
Figure 9. Development model of stress-strain relationship; (a) Development models; (b) Development process.
Processes 13 01955 g009
Figure 10. Relationship curves between failure strain and red mud content of C-RMS and LF-RMS. (a) 7 d; (b) 28 d; (c) 90 d.
Processes 13 01955 g010
Figure 11. Relationship curves between deformation coefficient and red mud content of C-RMS and LF-RMS. (a) 7 d; (b) 28 d; (c) 90 d.
Processes 13 01955 g011
Figure 12. (ac) is the compressive strength of C-RMS with curing ages of 7 days, 28 days, and 90 days, respectively; (df) are the compressive strength of LF-RMS with curing ages of 7 days, 28 days, and 90 days, respectively.
Processes 13 01955 g012aProcesses 13 01955 g012b
Figure 13. Relationship curve between unconfined compressive strength and deformation characteristic parameters. (a) C-RMS unconfined compressive strength and failure strain; (b) C-RMS unconfined compressive strength and deformation coefficient; (c) LF-RMS unconfined compressive strength and failure strain; (d) LF-RMS unconfined compressive strength and deformation coefficient.
Processes 13 01955 g013
Figure 14. C-RMS tensile stress-strain relationship curve (28 d); (a) Wc = 6%; (b) Wc = 9%; (c) Wc = 12%.
Processes 13 01955 g014
Figure 15. LF-RMS tensile stress-strain relationship curve (28 d); (a) WLF = 10%; (b) WLF = 20%; (c) WLF = 30%.
Processes 13 01955 g015
Figure 16. Relationship between the tensile deformation characteristics of C-RMS and LF-RMS. (a) Variation curve of failure strain and WRM; (b) Variation curve of E50 and WRM.
Processes 13 01955 g016
Figure 17. (ac) is the splitting tensile strength of C-RMS with curing ages of 7 days, 28 days, and 90 days, respectively; (df) are the splitting tensile strength of LF-RMS with curing ages of 7 days, 28 days, and 90 days, respectively.
Processes 13 01955 g017aProcesses 13 01955 g017b
Figure 18. X-ray diffraction patterns of C-RMS and LF-RMS. (a) C-RMS, (b) LF-RMS.
Processes 13 01955 g018
Figure 19. Thermogravimetric spectra of C-RMS and LF-RMS. (a) TG curve of C-RMS and LF-RMS, (b) DTG curve of C-RMS and LF-RMS.
Processes 13 01955 g019
Figure 20. SEM images of C-RMS and LF-RMS; (a) 9% C + 20% RM (28 d); (b) 9% C + 20% RM (90 d); (c) 20% LF + 23% RM (28 d); (d) 20% LF + 23% RM (90 d).
Processes 13 01955 g020
Table 1. Chemical Composition and Material Content.
MaterialsMass Fraction (%)
Al2O3SiO2Fe2O3CaOTiO2K2OMgONa2OSO3Others
Red mud20.1013.283.3232.023.810.351.1610.90/15.06
Silty soil9.5867.895.973.042.861.752.82/0.465.63
Lime///95.6//0.96/0.063.38
Fly ash36.342.61.954.61.150.52//0.0612.88
Table 2. Cement and Fly ash quality index.
MaterialsSpecific Area
(m2·kg−1)
Cl
(%)
SO3
(%)
MgO
(%)
Loss-on-Ignition
(%)
Initial Setting Time
(min)
Final Setting Time
(min)
Stability
Cement3520.0432.773.513.51209291qualified
Fly ash326/0.06/15.2//qualified
Table 3. Results of toxicity testing for the leaching of red mud.
Test ItemsLimiting Value (mg/L)RM Test Result (mg/L)
Cu1000.0441
Zn1000.00315
Cd10.000042
Pb50.000533
Cr150.0371
Cr (VI)50.000029
Hg0.10.000099
Be0.02/
Ba1000.0319
Ni50.00246
Ag5/
As50.0109
Se10.0258
FL1000.9
Table 4. Radioactive properties of red mud.
Radionuclides226Ra232U40K
Radioactive specific activity/Bq·kg−15082651050
Table 5. Experimental design.
Test ObjectRed Mud Content WRM (%)Cement Content Wc (%)Lime-Fly Ash Content WLF (%)Curing Age (d)
C-RMS14, 17, 20, 236, 9, 1207, 28, 90
LF-RMS17, 20, 23, 26010, 20, 30
Table 6. Microcosmic test specimen number.
Test SpecimenSpecimen Number
12% P + 20% RM (28 d)C-1
9% P + 20% RM (28 d)C-2
9% P + 23% RM (28 d)C-3
9% P + 20% RM (90 d)C-4
20% LF + 26% RM (28 d)LF-1
30% LF + 23% RM (28 d)LF-2
20% LF + 23% RM (28 d)LF-3
20% LF + 23% RM (90 d)LF-4
Table 7. Summary of Main Instruments.
Equipment NameModelManufacturerSensitivity/Accuracy
Unconfined Compressive Strength TestYYW-2Zhengzhou, Henan Province, ChinaThe axial strain rate is 1 mm/min
X-ray diffraction analysisBruker D8 AdvanceMunich, GermanyThe working voltage is 20 to 60 kV, the current is 10 to 300 mA, the constant step size is 0.002° to 90°, and the scanning rate is 0.002 to 100°/min
Synchronous thermal analyzer STA 499 F5Munich, GermanyThe output pressure of the protective gas is 0.04 MPa, the heating rate is 20 °C/min, and the temperature range is 0–1000 °C
Scanning electron microscope.SU8100Tokyo, JapanThe resolution is 1.3 nm/1.0 kV
γ spectrometerFP-90041Zhengzhou, Henan Province, ChinaIts expanded uncertainty is less than 15%, the energy resolution is less than 7%, and the measurable range of nuclide activity is 10 Bq to 2 kBq
Table 8. Introduction to Origin 2024.
Functional ModuleDetailed DescriptionCharacteristics
Support for dark modeSupports dark mode independent of system themes, provides multiple built-in dark themes, and allows for the customization of chart background colorsEnhance visual comfort and be suitable for long-term use
Interactively adjust the axis scaleClick and drag the red dot at the end of the axis to set the start and end values, supporting real-time drawing effectsConvenient operation and real-time feedback
Browser graph based on worksheetData can be selected from multiple worksheets for plotting, facilitating quick chart updatesImprove the visualization efficiency of multiple datasets
Interactive data extractionData can be interactively selected on the chart and extracted to a new worksheetFacilitate the further analysis of the data
Table 9. Radioactive specific activity of RM, C-RMS, and LF-RMS.
Radionuclides226Ra232U40K
RM (Bq·kg−1)5082651050
C-RMS (Bq·kg−1)10352198
LF-RMS (Bq·kg-1)18197332
Table 10. Reduction of leaching toxicity in amended soil.
Test ItemC-RMS Toxicity Reduction (%)LF-RMS Toxicity Reduction (%)
Cu97.380.5
Zn87.275
Cd45.590
Pb9795.5
Cr9875.6
Cr (VI)10062.8
Hg10088
Ba9996
Ni10098
As90.550
Se8785.5
FL51.141.1
Disclaimer/Publisher’s Note: The statements, opinions and data contained in all publications are solely those of the individual author(s) and contributor(s) and not of MDPI and/or the editor(s). MDPI and/or the editor(s) disclaim responsibility for any injury to people or property resulting from any ideas, methods, instructions or products referred to in the content.

