Article

Impact of Ammonia Energy Ratio on the Performance of an Ammonia/Diesel Dual-Fuel Direct Injection Engine Across Different Combustion Modes

1
School of Funeral Service, Changsha Social Work College, Changsha 410004, China
2
School of Energy Science and Engineering, Central South University, Changsha 410083, China
*
Authors to whom correspondence should be addressed.
Processes 2025, 13(7), 1953; https://doi.org/10.3390/pr13071953
Submission received: 5 June 2025 / Revised: 17 June 2025 / Accepted: 18 June 2025 / Published: 20 June 2025
(This article belongs to the Section Energy Systems)

Abstract

:
The ammonia energy ratio (AER) is a critical parameter influencing the performance of ammonia/diesel dual-fuel engines. In this study, a numerical simulation was conducted based on a high-pressure dual-fuel (HPDF) direct injection ammonia/diesel engine to investigate the impact of the AER on combustion and emissions under two distinct combustion modes. By adjusting the ammonia start of injection timing (ASOI), the combustion mode was transitioned from diffusion combustion (HPDF1) to partially premixed combustion (HPDF2). The results show that under the HPDF1 mode, a three-stage heat release pattern is observed, and the evolution curves of NO and NO2 exhibit fluctuations similar to the heat release process. As the AER increases, the second heat release stage is suppressed, the high-temperature region narrows, the ignition delay is extended, and the CA10–CA50 interval shortens, leading to a higher maximum pressure rise rate (MPRR) at a high AER. Conversely, in the HPDF2 mode, the combustion process is characterized by a two-stage heat release. With an increasing AER, the high-temperature region expands, the ignition delay and CA10–CA50 interval are prolonged, while the CA50–CA90 interval shortens, and the MPRR becomes the lowest at a high AER. For both combustion modes, total greenhouse gas (GHG) emissions decrease with an increasing AER. However, in the HPDF2 mode with an AER = 95%, N2O accounts for up to 78% of the total GHG emissions. Additionally, a trade-off relationship exists between NOx emissions and indicated thermal efficiency (ITE). When the ASOI is set to −8°CA ATDC, the engine operates in a transitional combustion mode between HPDF1 and HPDF2. At this point, setting the AER to 95% effectively mitigates the trade-off, achieving an ITE of 53.56% with NOx emissions as low as 578 ppm.

1. Introduction

Compression ignition (CI) engines continue to play an indispensable role in marine and heavy machinery applications due to their superior reliability and higher fuel combustion efficiency compared to gasoline engines [1,2]. However, growing concerns over global warming and climate change have prompted many countries and regions to introduce more stringent carbon reduction policies [3]. To achieve carbon reductions in the transportation sector, the adoption of low- or zero-carbon alternative fuels presents an ideal solution [4,5]. As one of the most promising zero-carbon fuels, hydrogen produces only water upon complete combustion, resulting in minimal environmental impact. However, challenges related to its production, storage, distribution, and relatively low volumetric energy density hinder its widespread adoption [6]. Ammonia, as an efficient hydrogen carrier with a well-established transportation infrastructure and high volumetric energy density, is considered a suitable alternative fuel for use in internal combustion engines [7,8,9].
Ammonia has a low flame propagation rate and narrow ignition limits, requiring higher compression ratios for ideal combustion when used alone in an engine. To address this challenge, igniting ammonia with highly reactive fuels is considered an effective solution [10,11]. In CI engines, ammonia is injected into the intake manifold to form a premixed air–fuel mixture, while highly reactive fuel is directly injected into the cylinder to ignite the premixture. This method is considered effective in enhancing ammonia combustion, increasing the combustion rate, and improving thermal efficiency [12]. Many experts and scholars have conducted experimental and numerical studies to improve engine performance in this mode. Wu et al. [13] investigated the effects of the AER, the diesel start of injection timing (DSOI), and the diesel injection pressure (DIP) on the combustion and emission characteristics of a heavy-duty single-cylinder engine under low load conditions. They found that when the AER = 50%, the DIP = 60 MPa, and the DSOI = −40° CA ATDC, the engine achieved a peak ITE of 49.7%, while GHG emissions were reduced by 44% compared to the diesel-only mode. Yousefi et al. conducted extensive research on the combustion and emission characteristics of a diesel pilot-ignited premixed ammonia engine. They first examined the effects of the AER and DSOI, finding that increasing the AER leads to higher N2O emissions, which offsets the benefits of CO2 reduction. Additionally, advancing the DSOI was shown to reduce GHG emissions by 12% compared to the diesel-only mode [14]. In a subsequent study, they examined the benefits of diesel split injection, finding that up to a 1.1% increase in ITE could be achieved compared to the diesel-only mode, along with a reduction in GHG emissions of up to 30.6%. However, despite the significant decrease in unburned NH3 emissions with split diesel injection under all tested conditions, these emissions remained above recommended exposure limits, and NOx emissions were also elevated [15]. In a study conducted by Pei et al. [16], it was suggested that different diesel injection strategies could be employed to achieve performance comparable to the diesel-only mode under various load and speed conditions. However, in premixed combustion of ammonia, the low flame propagation rate limits the combustion speed and results in high unburned ammonia emissions. Consequently, the issues of low combustion efficiency and low ammonia substitution rate are difficult to effectively resolve using this approach. Additionally, ammonia injected into the intake manifold displaces part of the intake air, reducing volumetric efficiency and power output [17]. In this context, direct injection of ammonia appears to be a promising alternative strategy.
Li et al. [18] compared engine performance under high-pressure dual-fuel (HPDF) direct injection ammonia/diesel and low-pressure dual-fuel (LPDF) direct injection ammonia/diesel modes. Their results showed that the optimal AER for the LPDF mode was 80%, while the HPDF mode could achieve an AER of up to 97%. In contrast, the LPDF mode delivered higher ITE, whereas the HPDF mode significantly reduced unburned ammonia, NOx, and GHG emissions. Scharl et al. [19] conducted experiments on a diesel engine using liquid ammonia spray flames in a fast compression expander. They reported that a pilot diesel fuel with an energy fraction of 3.2% reliably ignited liquid ammonia in the HPDF mode. In this mode, ammonia combustion occurs in a diffusion flame, where the heat release rate depends on the fuel–air mixing rate, rather than in a premixed flame, where it is governed by the flame propagation speed. This approach effectively addresses the challenges of low combustion efficiency and high unburned ammonia emissions associated with premixed ammonia combustion, enabling higher ammonia substitution rates. Zhou et al. [20] developed a numerical model based on a diesel/ammonia dual-fuel reaction mechanism to simulate a pilot-ignited diesel engine operating under premixed and high-pressure spray combustion modes. They investigated and optimized engine performance and emissions for both modes, finding that the HPDF mode could achieve comparable thermal efficiency and reduce NOx emissions by 47% compared to the premixed mode, with negligible unburned ammonia emissions. Zhang et al. [21] evaluated the effects of ammonia injection volume, ammonia injection timing, and diesel injection timing on the ammonia/diesel dual direct injection mode in a two-stroke low-speed engine. Their study showed that diesel flame ignition accelerated ammonia combustion duration, thereby improving ITE. Additionally, fuel-based NOx emissions, primarily generated from ammonia combustion, can be effectively controlled by optimizing the injection timing of diesel and ammonia.
A review of previous studies reveals that the HPDF mode can maintain high thermal efficiency while more effectively controlling NOx and NH3 emissions, and also achieving a higher ammonia substitution rate, thereby reducing fossil fuel consumption. Owing to the flexibility offered by dual direct injection of ammonia and diesel, various combustion modes can be realized by adjusting the injection timings of the two fuels. When ammonia is injected earlier than diesel, a portion of the ammonia–air mixture is formed prior to diesel ignition. This combustion behavior is classified as a partially premixed combustion mode. In contrast, when ammonia is injected later than diesel, the diesel ignites first, followed by the ignition of directly injected ammonia. In this case, the ammonia combusts while being injected, and the mixing rate significantly influences the combustion process, representing a typical diffusion combustion mode.
However, current research in this area remains limited. Only the studies by Pires et al. [22] and Yang et al. [17]. have investigated ammonia partially premixed combustion and ammonia diffusion combustion. Furthermore, the study by Zuo et al. [23] highlights that the AER is another critical parameter influencing the performance of ammonia/diesel dual-fuel engines, in addition to the combustion mode. Nevertheless, most existing research on the AER has primarily focused on premixed combustion configurations with ammonia injection into the intake port [24,25,26,27,28]. In this context, the objective of this study is to investigate the influence of the AER on engine performance under different combustion modes, with the aim of providing theoretical guidance for the optimized development of ammonia/diesel dual-fuel engines.

2. Methodology

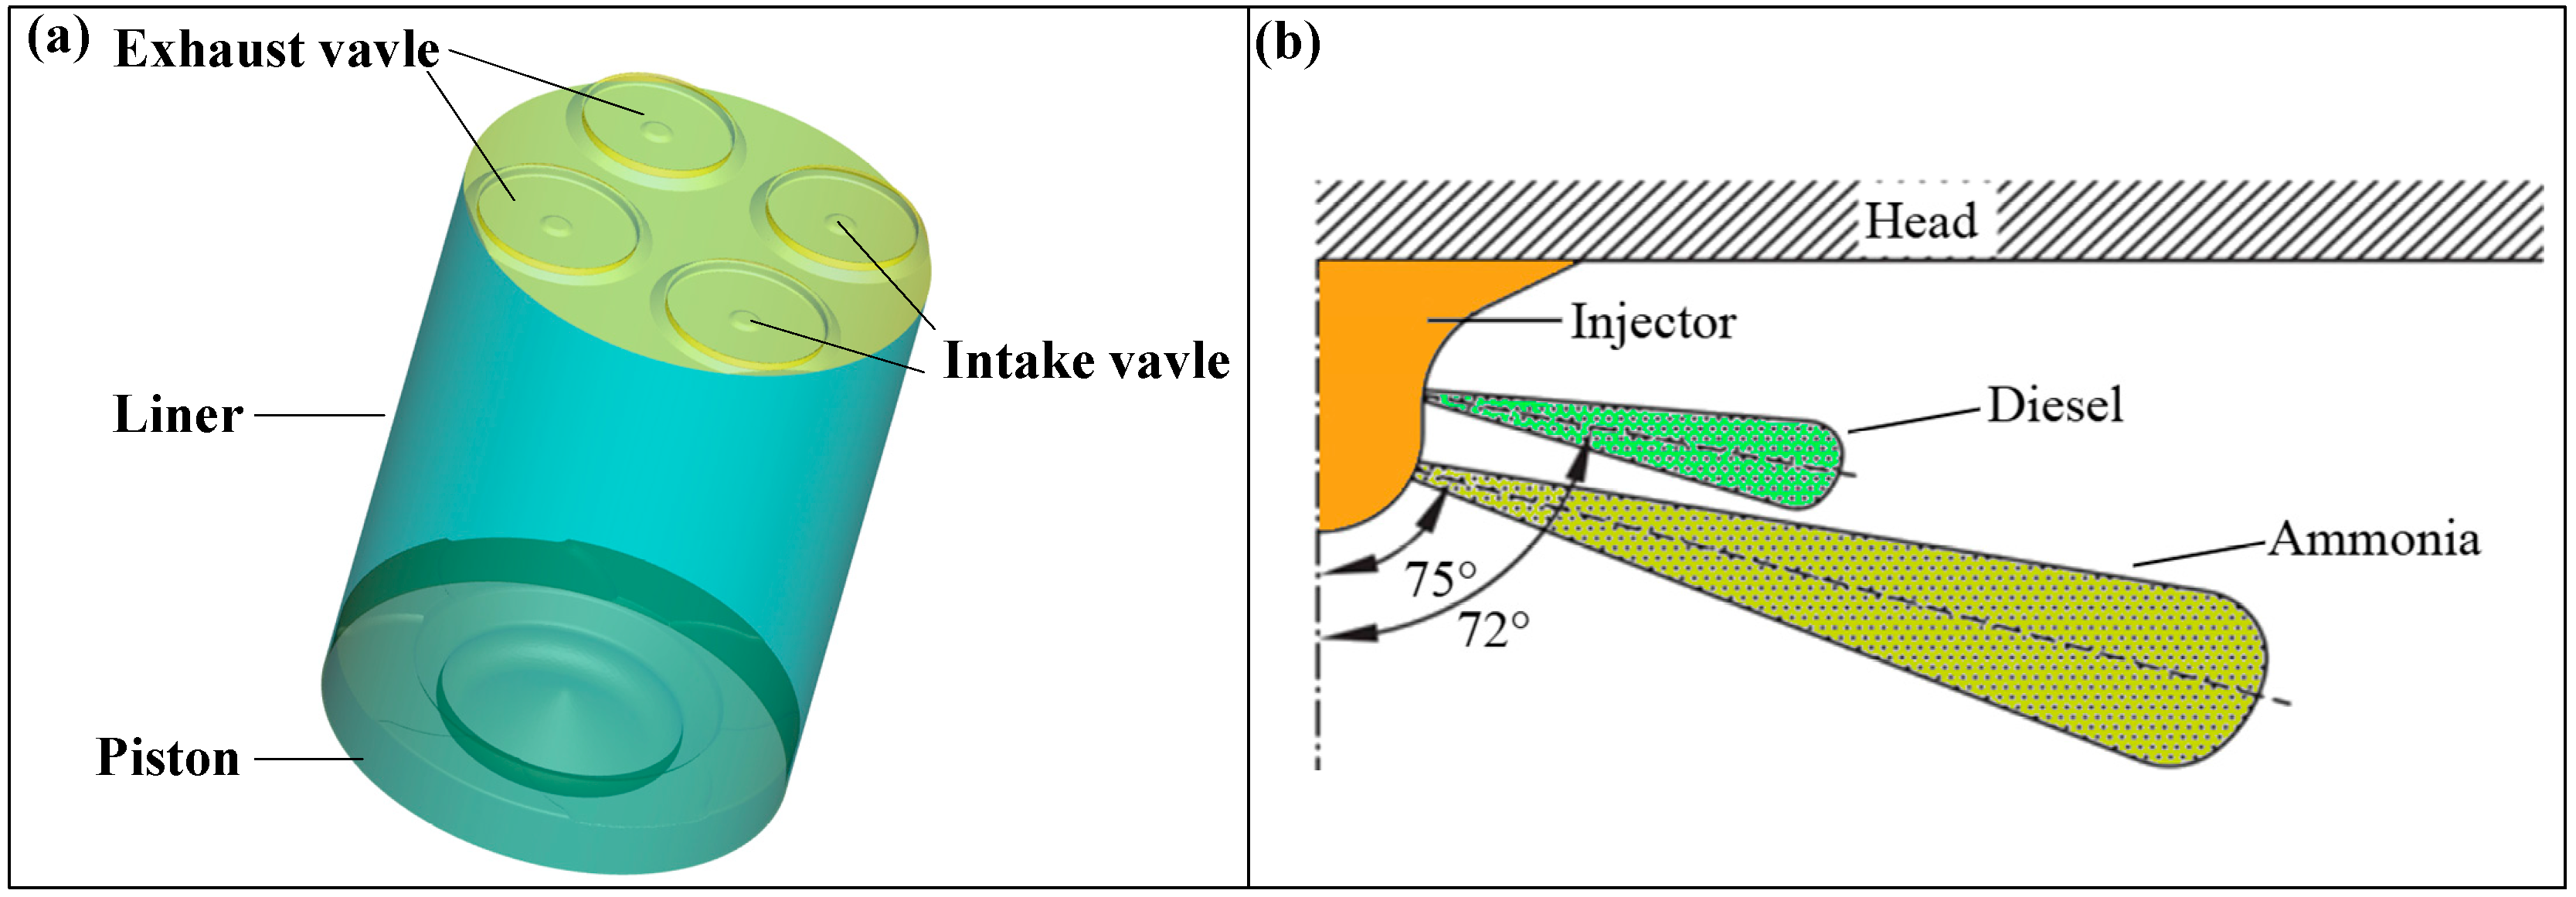
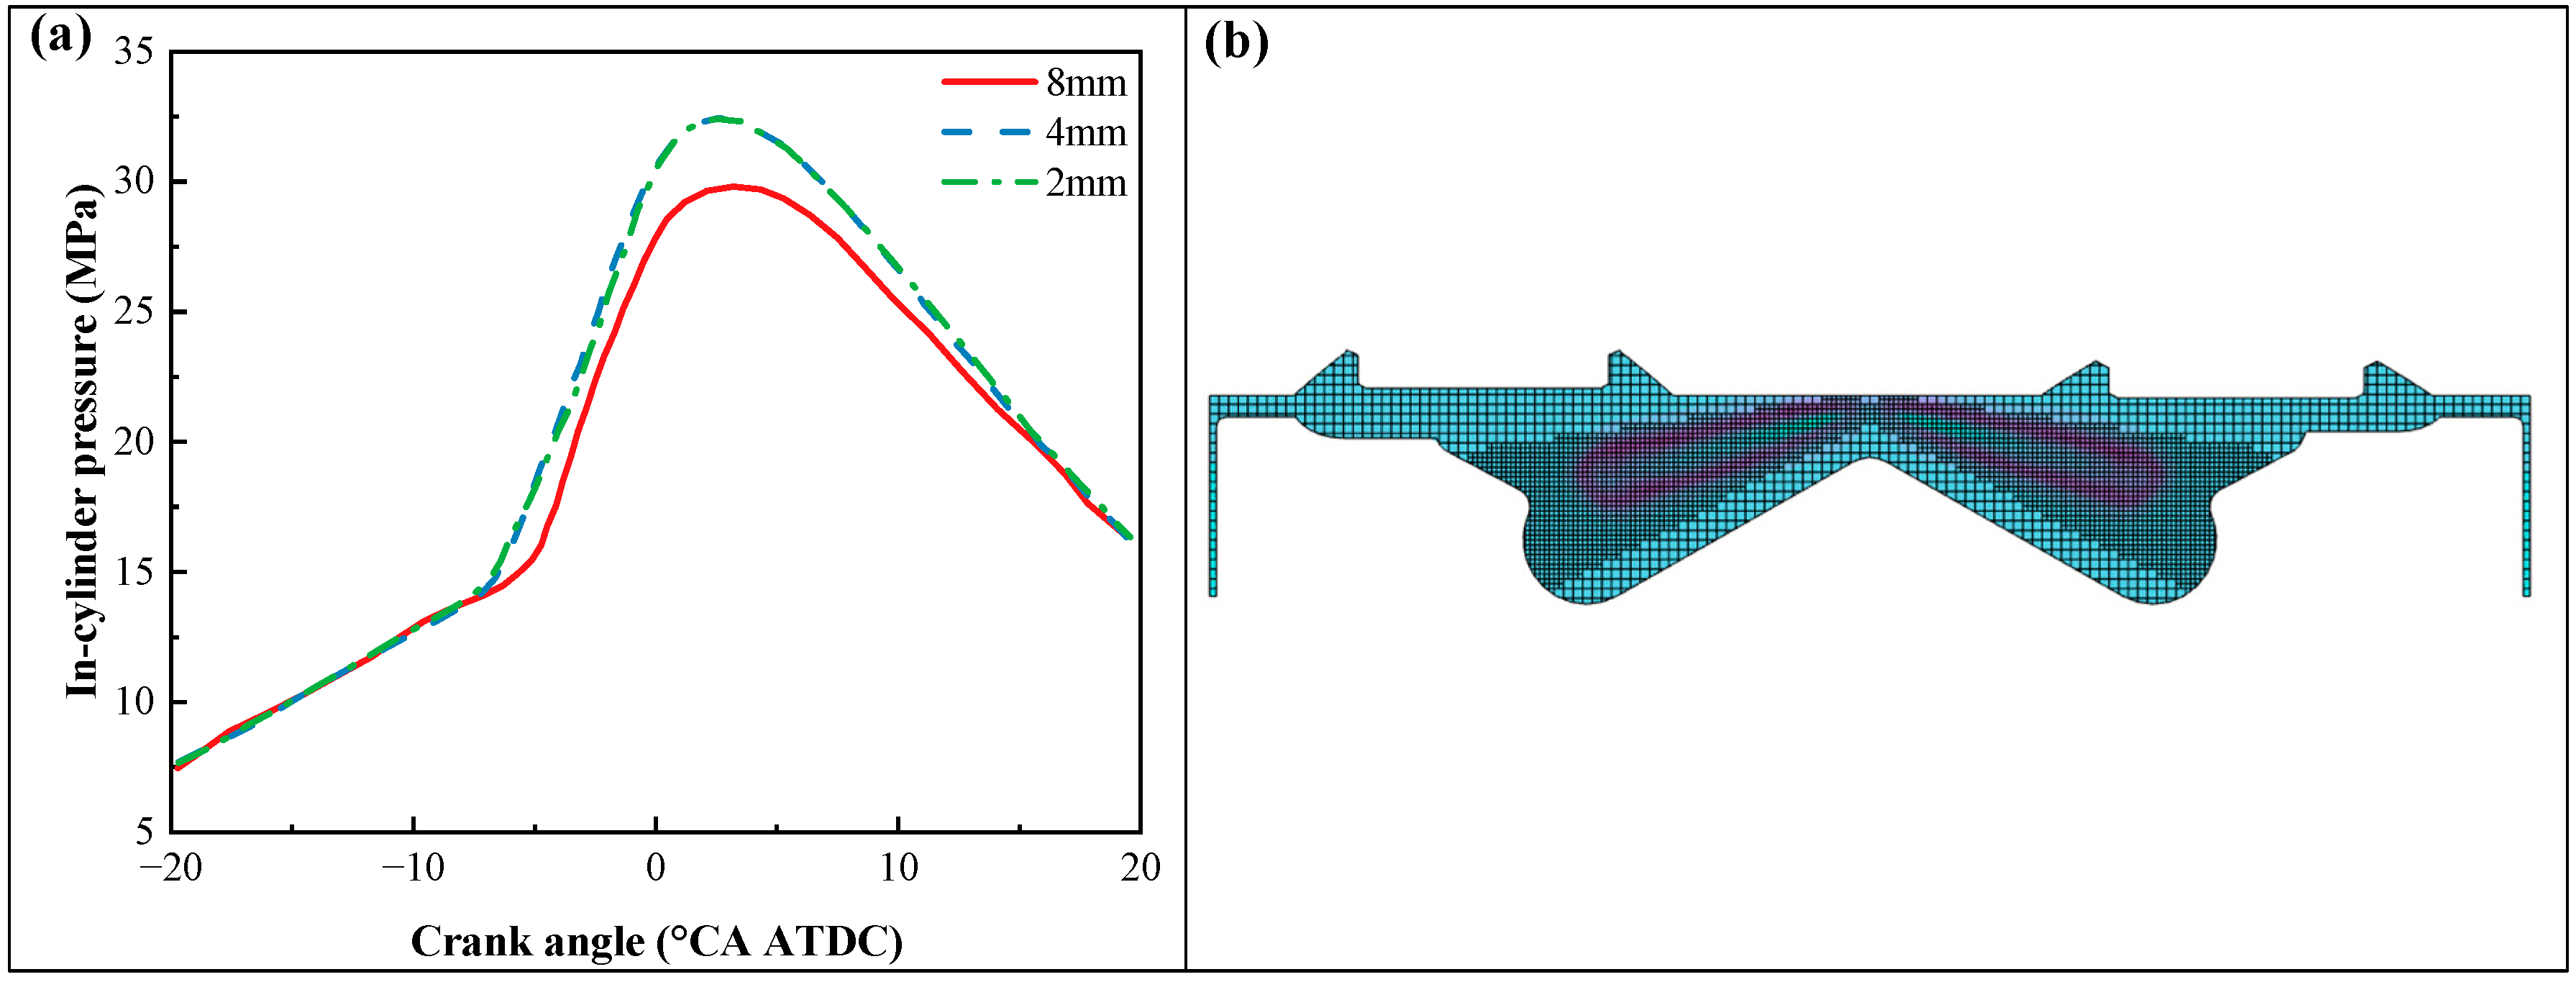
2.1. Construction of the Numerical Model

In this study, a CFD model of an ammonia/diesel dual direct injection engine was developed using CONVERGE 2.4 software, with the specific parameters listed in Table 1. The RNG k-ε turbulence model [29] was employed to predict the in-cylinder flow field, as it provides a good compromise between computational accuracy and efficiency. Wall heat transfer was modeled using the O’Rourke and Amsden approach [30]. The KH-RT model [31] was applied to simulate droplet breakup and atomization, and the no-time counter (NTC) method [32] was used to describe droplet collisions. Spray–wall interactions were modeled using the O’Rourke model [33], and droplet evaporation was described using the Frossling model [34]. In this work, n-heptane was selected as a surrogate for diesel fuel. The in-cylinder combustion process was simulated using the SAGE detailed chemical kinetics solver [35], combined with the ammonia/n-heptane dual-fuel reaction mechanism developed by Xu et al. [36]. This mechanism has been thoroughly validated against ignition delay times, laminar flame speeds, and the molar fractions of NO, N2O, and NH3.
The CFD simulation mesh was constructed based on the actual geometry of the engine. To reduce computational cost, the intake and exhaust strokes were excluded from the simulation, and therefore the intake and exhaust ports were not included in the model. To ensure the accuracy of the simulation, initial in-cylinder conditions such as pressure and temperature at the moment of intake valve closure were experimentally measured. These conditions are detailed in Table 2. Fuel injection for both ammonia and diesel was modeled using a coaxial dual-fuel injector, with spray angles of 75° and 72° relative to the injector axis for ammonia and diesel, respectively [17]. The final engine geometry model and a schematic of the ammonia/diesel injector are presented in Figure 1.
To ensure the convergence of the simulation results, a mesh sensitivity analysis was conducted. Mesh sizes of 8 mm, 4 mm, and 2 mm were selected for validation. As illustrated in Figure 2a, when the mesh size is reduced to 4 mm, further refinement to 2 mm yields negligible changes in the results, indicating that a 4 mm mesh ensures sufficient accuracy while significantly improving computational efficiency compared to the 2 mm mesh. Therefore, a 4 mm mesh was adopted in this study. Additionally, key regions were locally refined, and the spray region of the liquid fuel was discretized with three levels of mesh refinement. To accurately capture in-cylinder temperature variations, adaptive mesh refinement was applied: regions with high velocity and temperature gradients were refined to 1/2 and 1/4 of the base mesh size. The final mesh distribution of the CFD model is illustrated in Figure 2b.

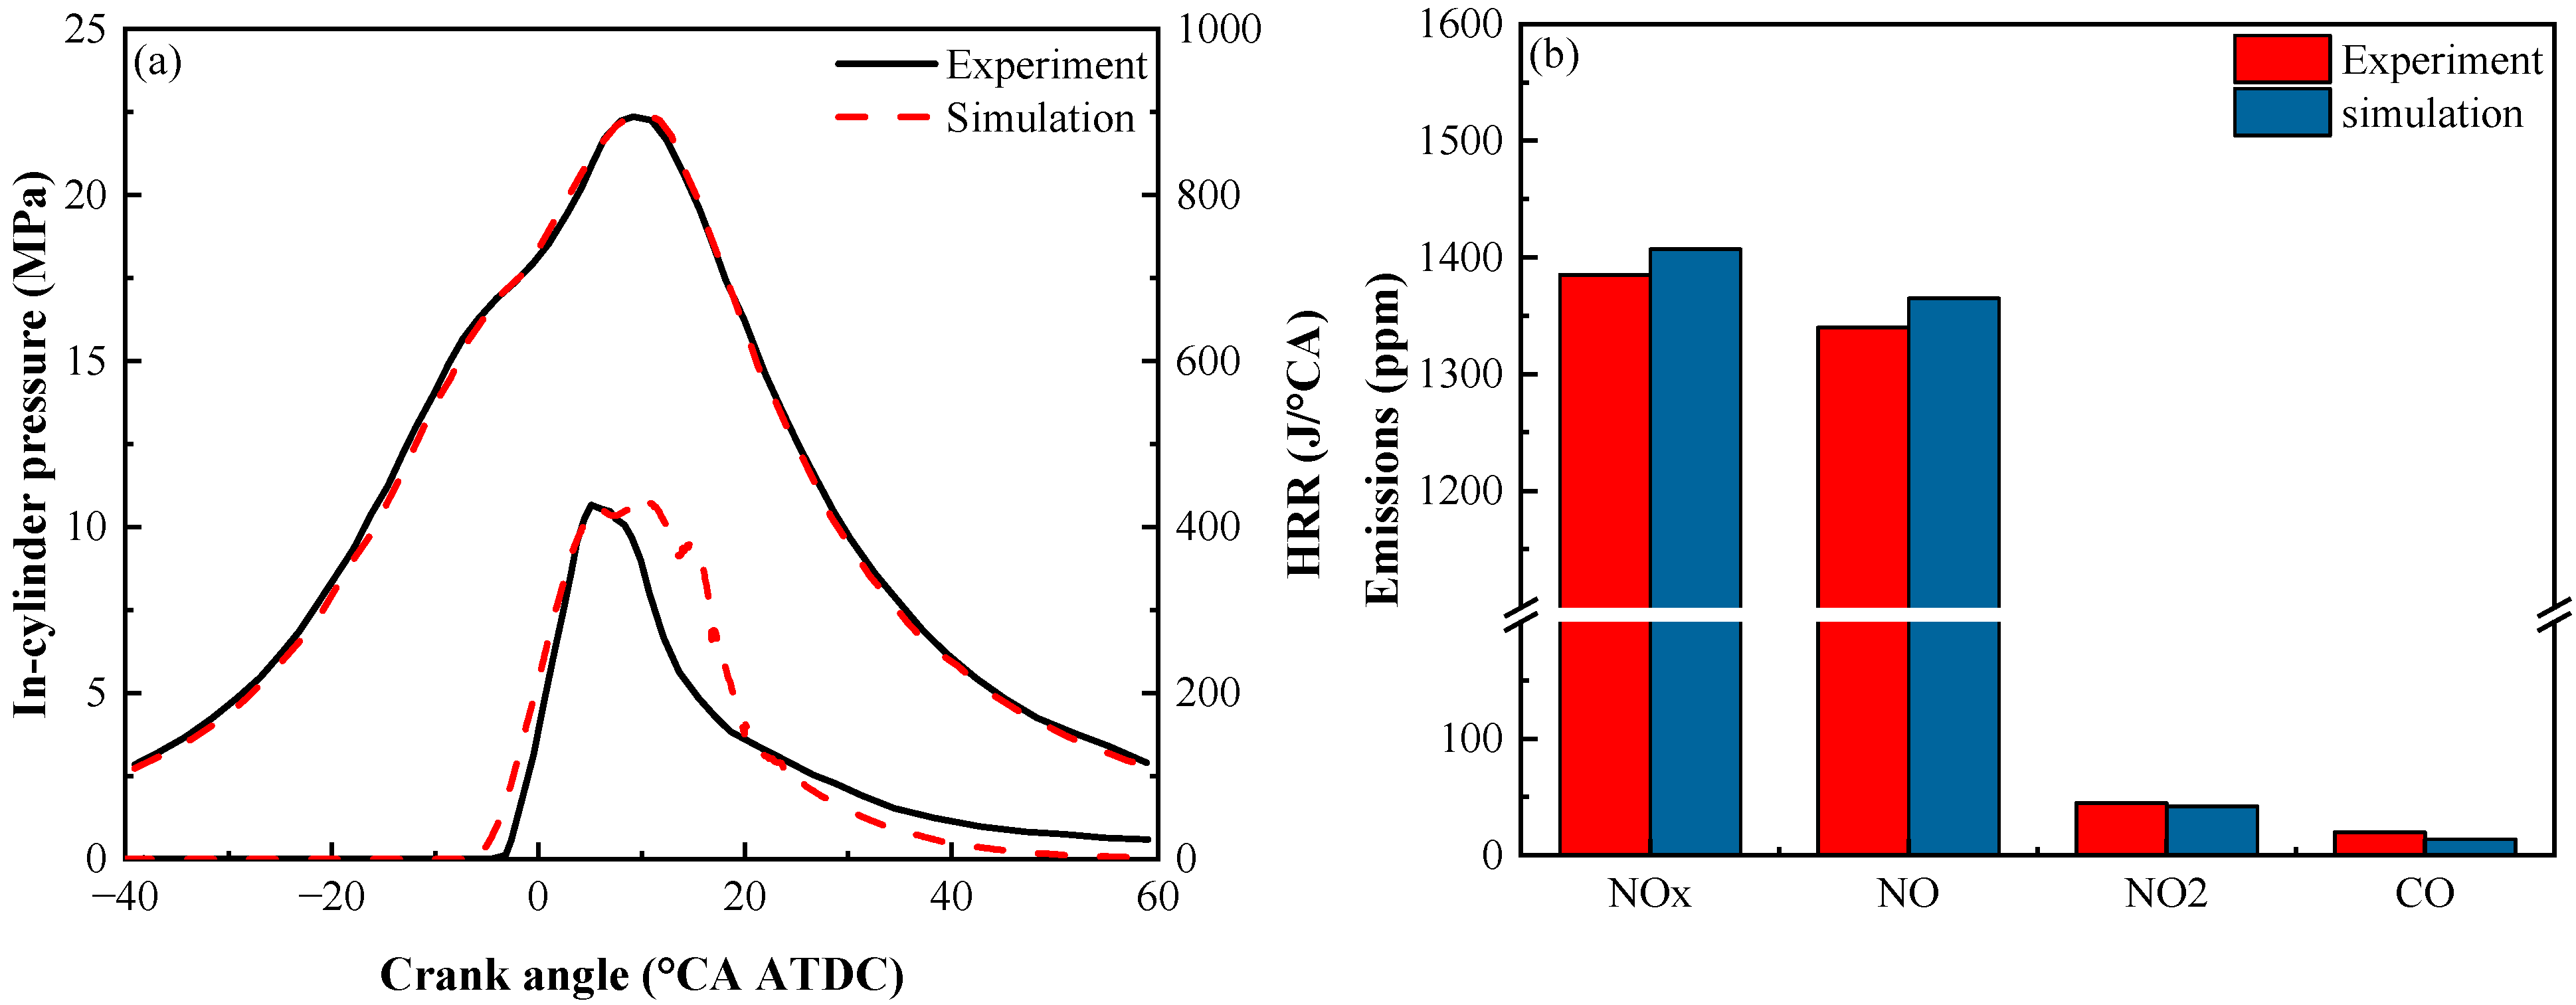
2.2. Validation of Numerical Model

To verify the reliability of the constructed CFD model, engine operation under a total energy of 8679 J/cycle and a speed of 1100 rpm was simulated. According to Figure 3, the in-cylinder pressure and heat release rate (HRR) predicted by the model closely match the experimentally measured values. The prediction errors for various emission parameters are minimal, further demonstrating the accuracy and reliability of the developed CFD model. In addition, to enhance the reliability of the numerical model, the accuracy of the ammonia spray model was also validated. This validation was conducted using the experimental data provided by Li et al. [18], and the comparison results are presented in Figure 4.

2.3. Case Setup

After validating the accuracy of the model, a series of cases were established to investigate the effect of the ammonia energy ratio (AER) on the combustion and emission characteristics of an ammonia/diesel dual direct injection engine under different combustion modes. The transition between combustion modes was achieved by varying the ammonia start of injection (ASOI), while the diesel injection timing was fixed at −8°CA ATDC. The ASOI was gradually advanced from 0°CA ATDC to −16°CA ATDC in 4°CA increments, resulting in a shift from a diffusion combustion mode (HPDF1) to a partially premixed combustion mode (HPDF2). The combustion and emission characteristics were compared across AER values of 75%, 85%, 90%, and 95% for both combustion modes.

3. Results and Discussion

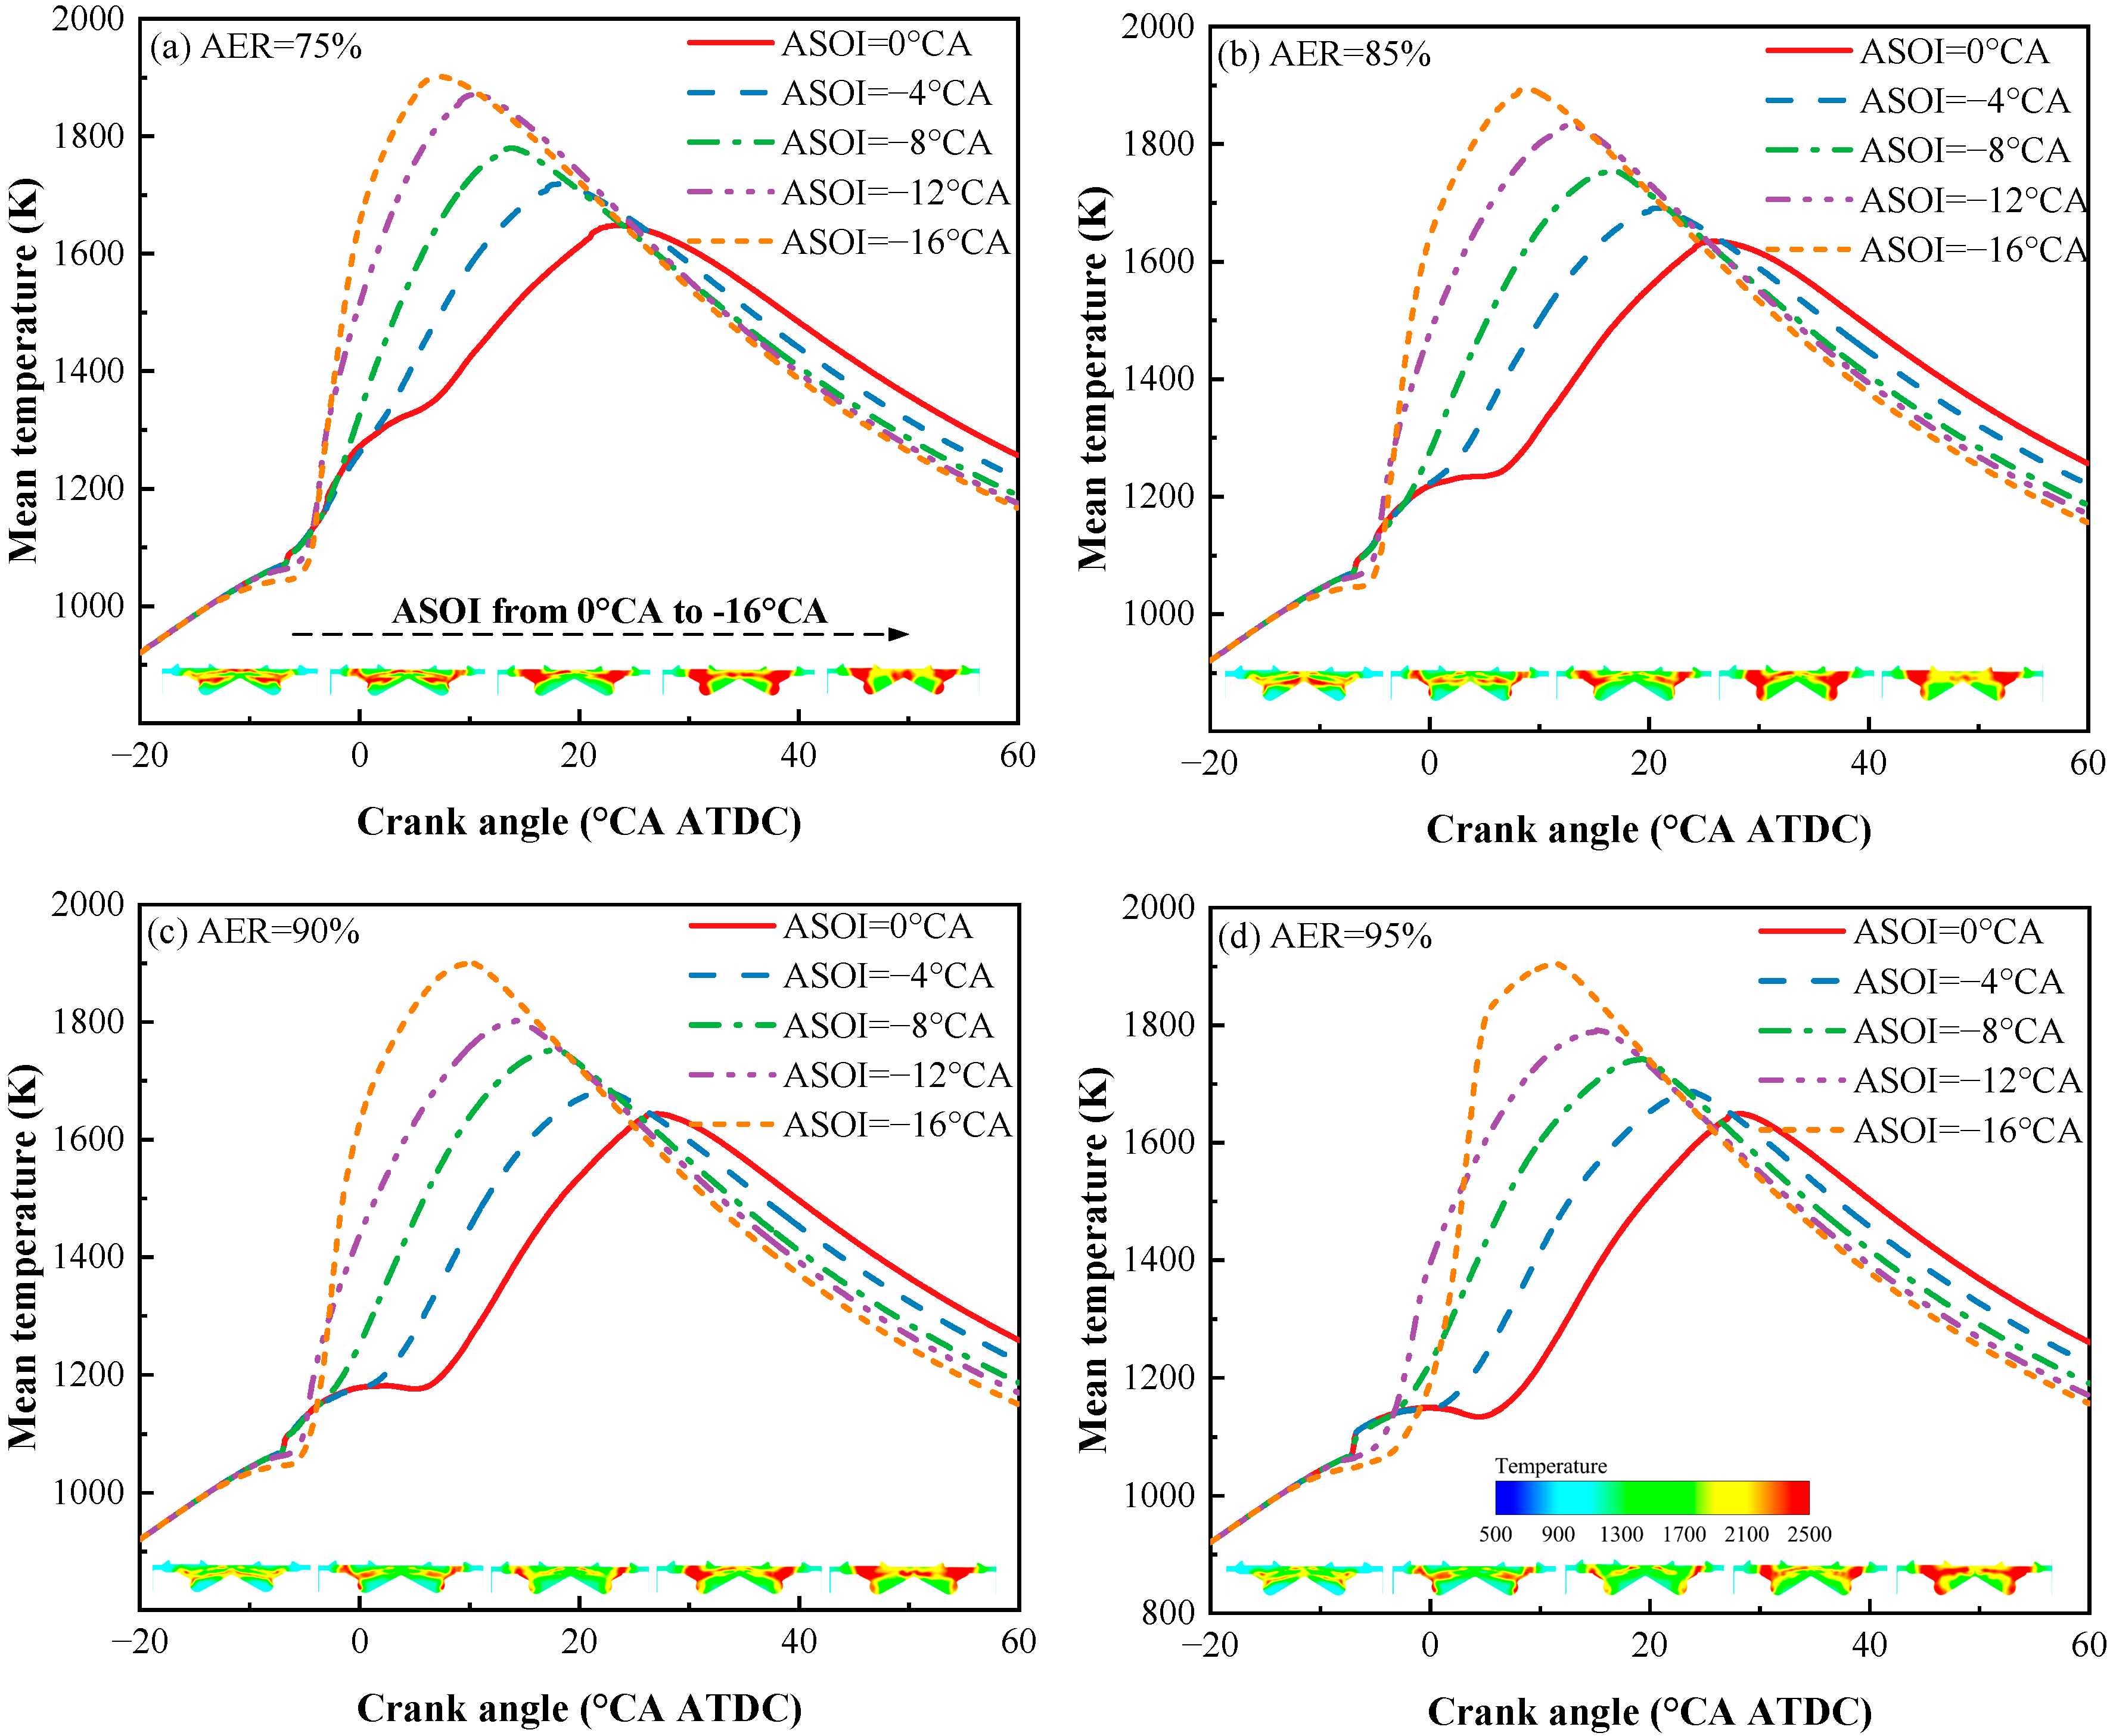
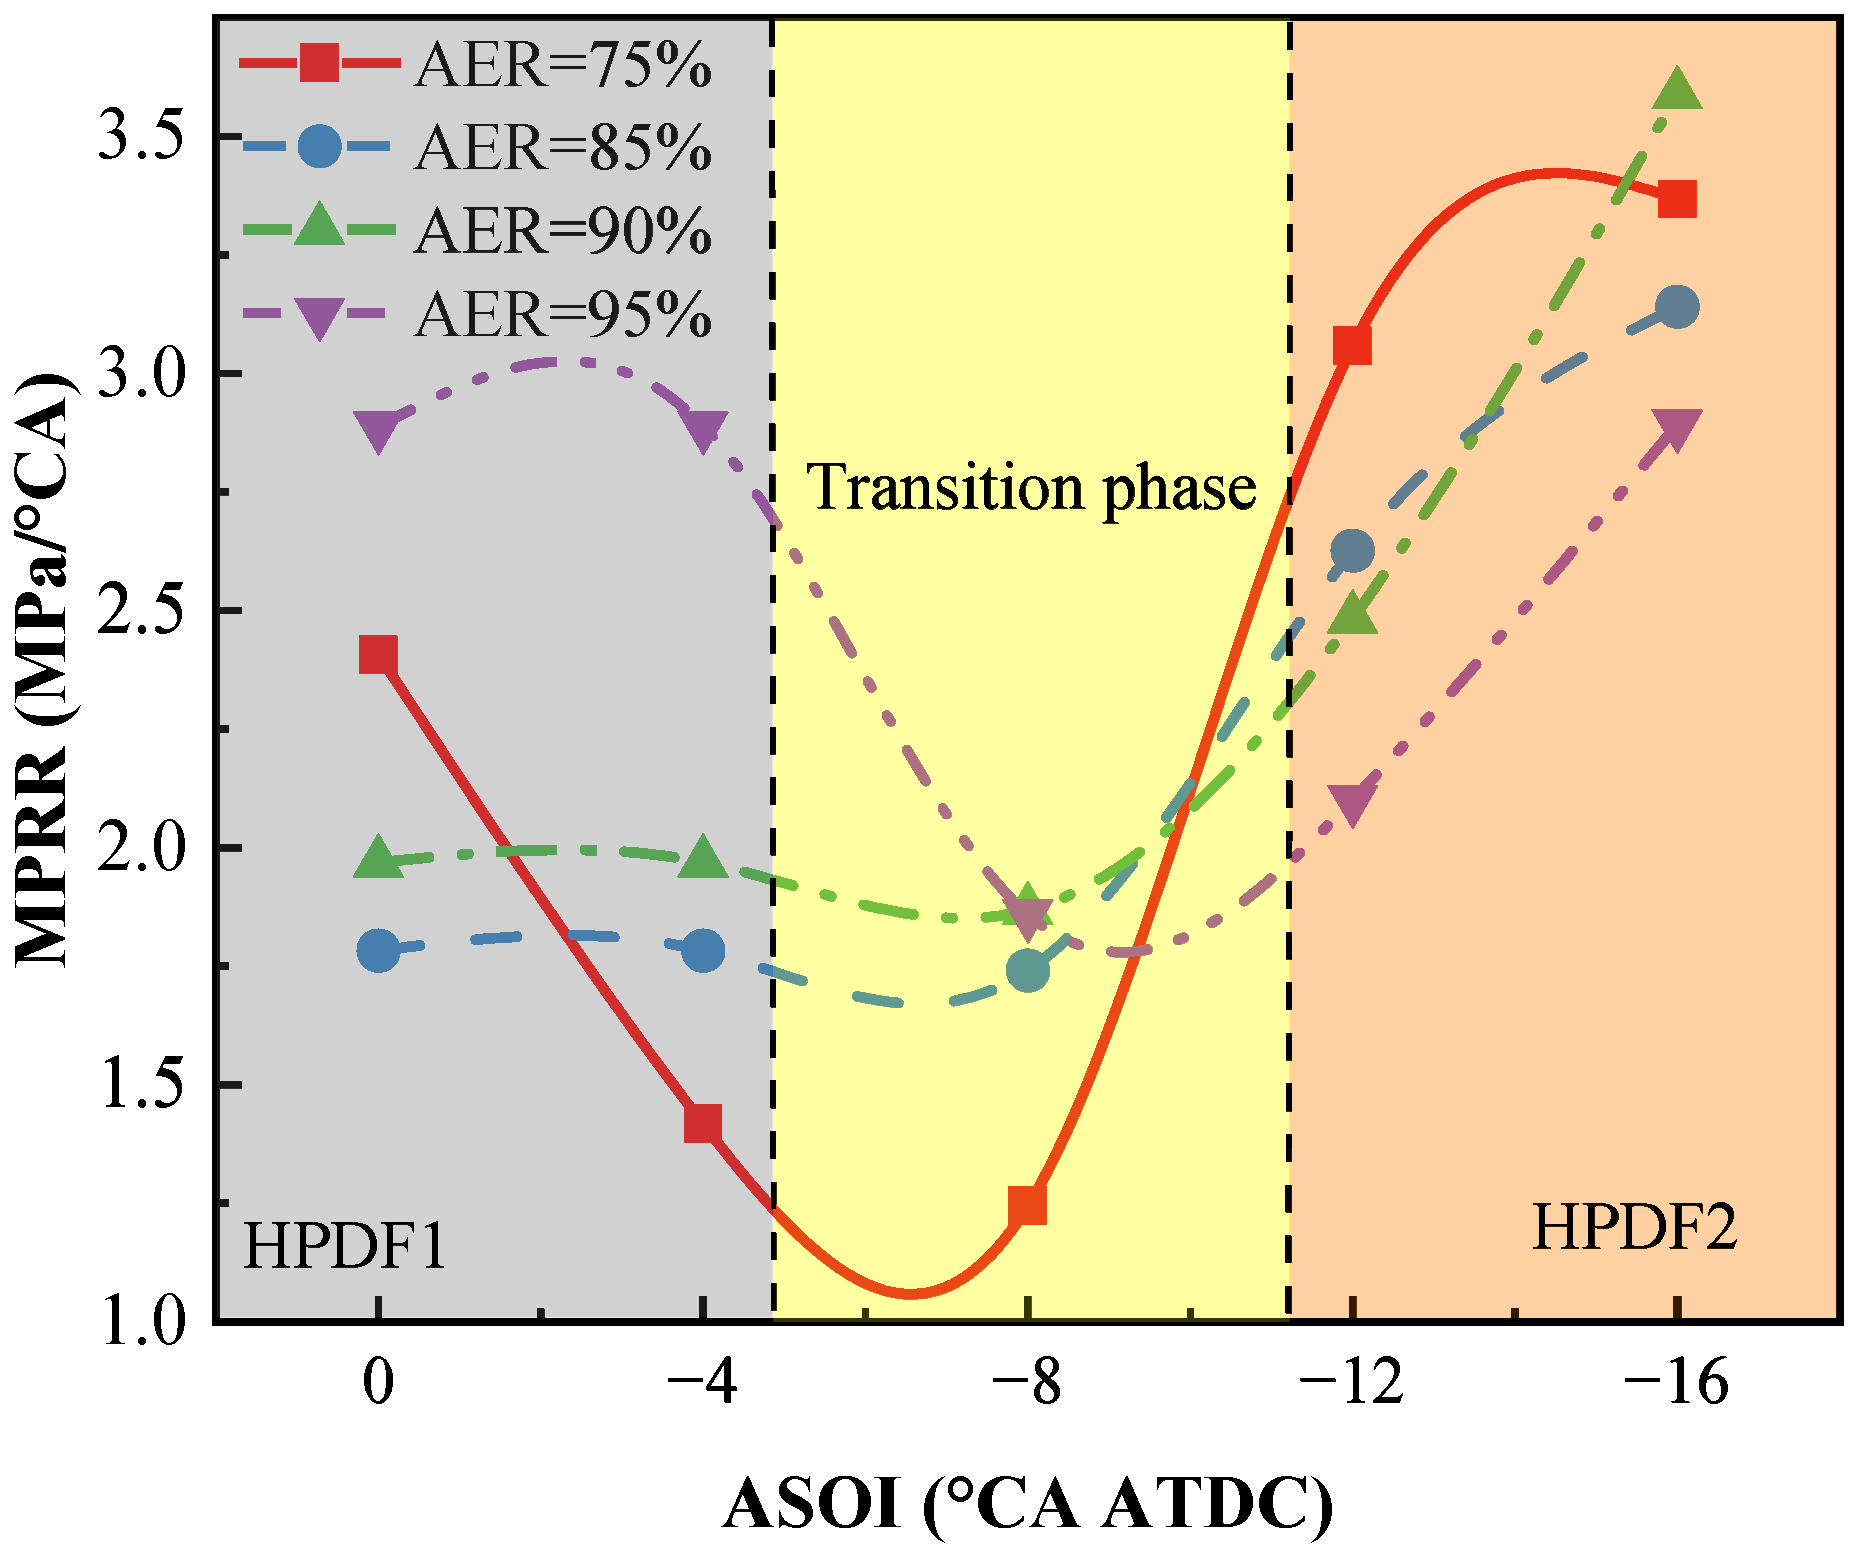
3.1. Combustion Characteristics

Figure 5 presents the variations in cylinder pressure and heat release rate with the ASOI at different AERs. Advance ASOI will shift the combustion mode from HPDF1 to HPDF2, increasing the proportion of premixed combustibles in the cylinder and shortening and concentrating the combustion heat release time, resulting in an increase in peak cylinder pressure and the second heat release peak [17]. However, the effect of increasing the AER on cylinder pressure and heat release rate is also dependent on the ASOI. Specifically, when the ASOI is set to 0°CA ATDC and −4°CA ATDC, the combustion mode is classified as HPDF1. Under these conditions, an increase in AER leads to a reduction in the proportion of ignited diesel fuel, thereby shortening the combustible interval in the cylinder before the onset of ammonia diffusion combustion. As a result, overall combustion is negatively affected, and lower cylinder pressures are observed with higher AERs at these ASOIs. At ASOIs = −12° and −16°CA ATDC, the combustion enters the HPDF2 mode. Under this condition, a higher AER improves mixture preparation before ignition. This improvement offsets the reduced amount of diesel fuel. Consequently, the changes in cylinder pressure and heat release rate with an increasing AER are less pronounced at these times. Moreover, at an ASOI = −16°CA ATDC and an AER = 95%, an increasing trend in both cylinder pressure and heat release rate is observed. Additionally, the exergy rate curves at AERs of 75% and 85% in the HPDF1 mode exhibit a triple-peak structure: the first peak corresponds to premixed combustion of diesel, the second to diesel diffusion combustion, and the third to ammonia diffusion combustion initiated by diesel. At higher AERs, this triple-peak transitions to a dual-peak profile. In HPDF2 mode, the exergy rate consistently displays a dual-peak pattern, where the first peak results from diesel–ammonia–air premixed combustion and the second from ammonia diffusion combustion.
Figure 6 illustrates the average in-cylinder temperature profiles at different AERs and the variation in temperature distribution clouds at 10°CA ATDC under varying ASOIs. It can be observed that, at all AER levels, the maximum average temperature increases as the ASOI is advanced. This is attributed to the more concentrated combustion resulting from the shift in combustion mode and the improvement in mixture quality as previously discussed. However, with delayed combustion phases, a retarded ASOI during the later stages of combustion leads to higher in-cylinder temperatures, which in turn increases heat transfer losses and negatively impacts the engine’s thermal efficiency. From the temperature distribution contour plots, it is evident that the high-temperature region within the cylinder becomes more widely distributed as the ASOI is advanced. When the ASOI is set to 0°, −4°, −8°, and −12°CA ATDC, the high-temperature region narrows with an increasing AER. In contrast, when the ASOI is set to −16°CA ATDC, a slight expansion of the high-temperature region is observed with an increasing AER. This indicates that, in the HPDF1 mode and the HPDF2 mode with a lower premixing ratio, lower AERs are more favorable for combustion, resulting in a broader high-temperature distribution. However, in the HPDF2 mode with a higher premixing ratio, the application of a higher AER does not degrade combustion performance; rather, it enhances it due to a more homogeneous mixture distribution.
Figure 7 illustrates the variation in combustion duration and ignition delay with the ASOI under different AERs. During the combustion process, the crank angles corresponding to 10%, 50%, and 90% of the total accumulated heat release are denoted as CA10, CA50, and CA90, respectively. The ignition delay is defined as the interval between the start of the diesel injection and CA10, while the combustion duration is represented by CA10–CA90. The data suggest that, at an AER = 75%, the ignition delay initially increases and then decreases as the ASOI is advanced. Conversely, at AER levels of 85%, 90%, and 95%, the ignition delay first decreases and then increases with advancing ASOI, with the minimum ignition delay occurring at an ASOI = −12°CA ATDC. Although the ignition delay is expected to increase with a higher presence of ammonia—due to its competition with diesel for OH radicals—when the ASOI coincides with the DSOI, stronger in-cylinder turbulence promotes the formation of a combustible mixture, thereby reducing the ignition delay. This enhancing effect is diminished when the ASOI is further advanced to −16°CA ATDC, resulting in a longer ignition delay. When comparing ignition delays at identical ASOIs, it is evident that increasing the AER leads to longer ignition delays. This can be attributed to ammonia’s high specific heat capacity and diluting effect, which act to slow auto-ignition. Regarding combustion duration, when the ASOI is set to 0° or −4°CA ATDC (corresponding to the HPDF1 combustion mode), an increase in the AER leads to a shortened combustion duration. This is primarily influenced by the extended ignition delay at higher AERs, which allows more premixed ammonia–air to form prior to ignition. The pre-formed mixture burns faster than in mixing-controlled combustion. This is evident from the significant reduction in the CA10–CA50 interval. In contrast, when the ASOI is advanced to −12° or −16°CA ATDC (representing the HPDF2 mode), the combustion duration initially increases and then decreases with an increasing AER. This trend results from a reduced overall fuel reactivity and the pronounced cooling and dilution effects of ammonia, which prolong the combustion process. However, as the AER continues to increase, the degree of premixing is further enhanced, which shortens the CA50–CA90 interval and consequently reduces the overall combustion duration. Additionally, it is noteworthy that in HPDF1 mode, a larger proportion of the combustion time is taken up by the CA10–CA50 phase, whereas in HPDF2 mode, a greater portion of the combustion duration falls within the CA50–CA90 interval.
Figure 8 illustrates the variation in the MPRR with the ASOI under different AERs. It is evident that the MPRR exhibits a decreasing and then increasing trend with the advancement of the ASOI across all AERs. In the HPDF1 mode, when the AER = 75%, the heat release rate curve shown in Figure 5a reveals three distinct peaks: the first peak corresponds to a small amount of premixed diesel combustion in the early stage, the second to diesel diffusion combustion, and the third to ammonia diffusion combustion. At an ASOI = 0°CA ATDC, the MPRR occurs during the second peak, which is associated with diesel diffusion combustion. When the ASOI is advanced to −4°CA ATDC, the diesel diffusion combustion is suppressed, and the MPRR occurs during the early-stage premixed diesel combustion, resulting in a reduction in the MPRR. At AER values of 85%, 90%, and 95%, due to the reduced amount of diesel and increased proportion of ammonia, the secondary heat released from the diesel combustion is significantly weakened. As the ASOI advances from 0°CA ATDC to −4°CA ATDC, the MPRR occurs during the early premixed diesel combustion phase (prior to ammonia injection), resulting in minimal variation in the MPRR with the ASOI. When the combustion mode transitions to HPDF2, the advancing ASOI leads to a higher premixing ratio, shortened combustion duration, and increased combustion intensity, all of which contribute to an increase in the MPRR. Moreover, in HPDF1 mode, the ignition delay is extended at higher AERs, allowing more time for the premixing of diesel fuel. This enhances early-stage premixed combustion, thereby resulting in a higher MPRR at elevated AERs. Conversely, in the HPDF2 mode, due to the slower combustion rate of ammonia and the lower fuel reactivity caused by reduced diesel content, the MPRR is lowest when the AER = 95%.
Figure 9 illustrates the variation in combustion loss under different AERs and ASOIs; the combustion loss was calculated using Equation (1). This indicates that at ASOIs = 0, −4, −8, and −12°CA ATDC, combustion loss gradually decreases with an increasing AER. However, at an ASOI = −16°CA ATDC, combustion loss first decreases and then increases as the AER continues to rise. This behavior can be attributed to the combustion modes corresponding to each ASOI. At ASOIs = 0, −4, −8, and −12°CA ATDC, the combustion mode is either HPDF1 or HPDF2 with a relatively low proportion of premixed combustion. At these timings, combustion loss is inherently small, and increasing the AER suppresses the secondary diffusion combustion of diesel fuel, thereby reducing incomplete combustion and decreasing overall combustion loss. At an ASOI = −16°CA ATDC, increasing the AER first improves premixed combustion, which enhances combustion efficiency and lowers combustion loss. But at a very high AER, diesel no longer provides enough ignition energy. Moreover, the excess ammonia may accumulate near the piston’s compression region, leading to incomplete combustion and a subsequent rise in combustion loss.
Combustion   loss = Total   energy   of   fuel Total   heat   release Total   energy   of   fuel
I T E = Gross   Indicated   power m D × L H V D + m N H 3 × L H V N H 3
Figure 10 illustrates the variation in ITE under different AERs and ASOIs; the ITE was calculated using Equation (2). The results reveal that the trend of ITE with respect to the ASOI varies across AER levels and can be divided into two categories: at AERs = 75% and 85%, ITE initially increases and then decreases as the ASOI advances; whereas at AERs = 90% and 95%, ITE increases monotonically with the advancing ASOI. The improvement in ITE with the advanced ASOI is primarily due to the shortened combustion duration and the advancement of the combustion phase. However, at AERs = 75% and 85%, when the ASOI is advanced to −16°CA ATDC, the corresponding CA50 values reach −0.6° and −0.38°CA ATDC, respectively. This indicates that more than half of the combustion occurs before the top dead center (TDC), which significantly increases compression negative work and thereby reduces ITE. In contrast, at AERs = 90% and 95%, even when the ASOI is advanced to −16°CA ATDC, the corresponding CA50 values still occur after TDC. As a result, thermal efficiency continues to improve compared to an ASOI = −12°CA ATDC. Additionally, a comparison between combustion modes shows that ITE is generally higher in the HPDF2 mode than in the HPDF1 mode, with a maximum increase of 1.88% at an AER = 75% and up to 4.15% at an AER = 95%.

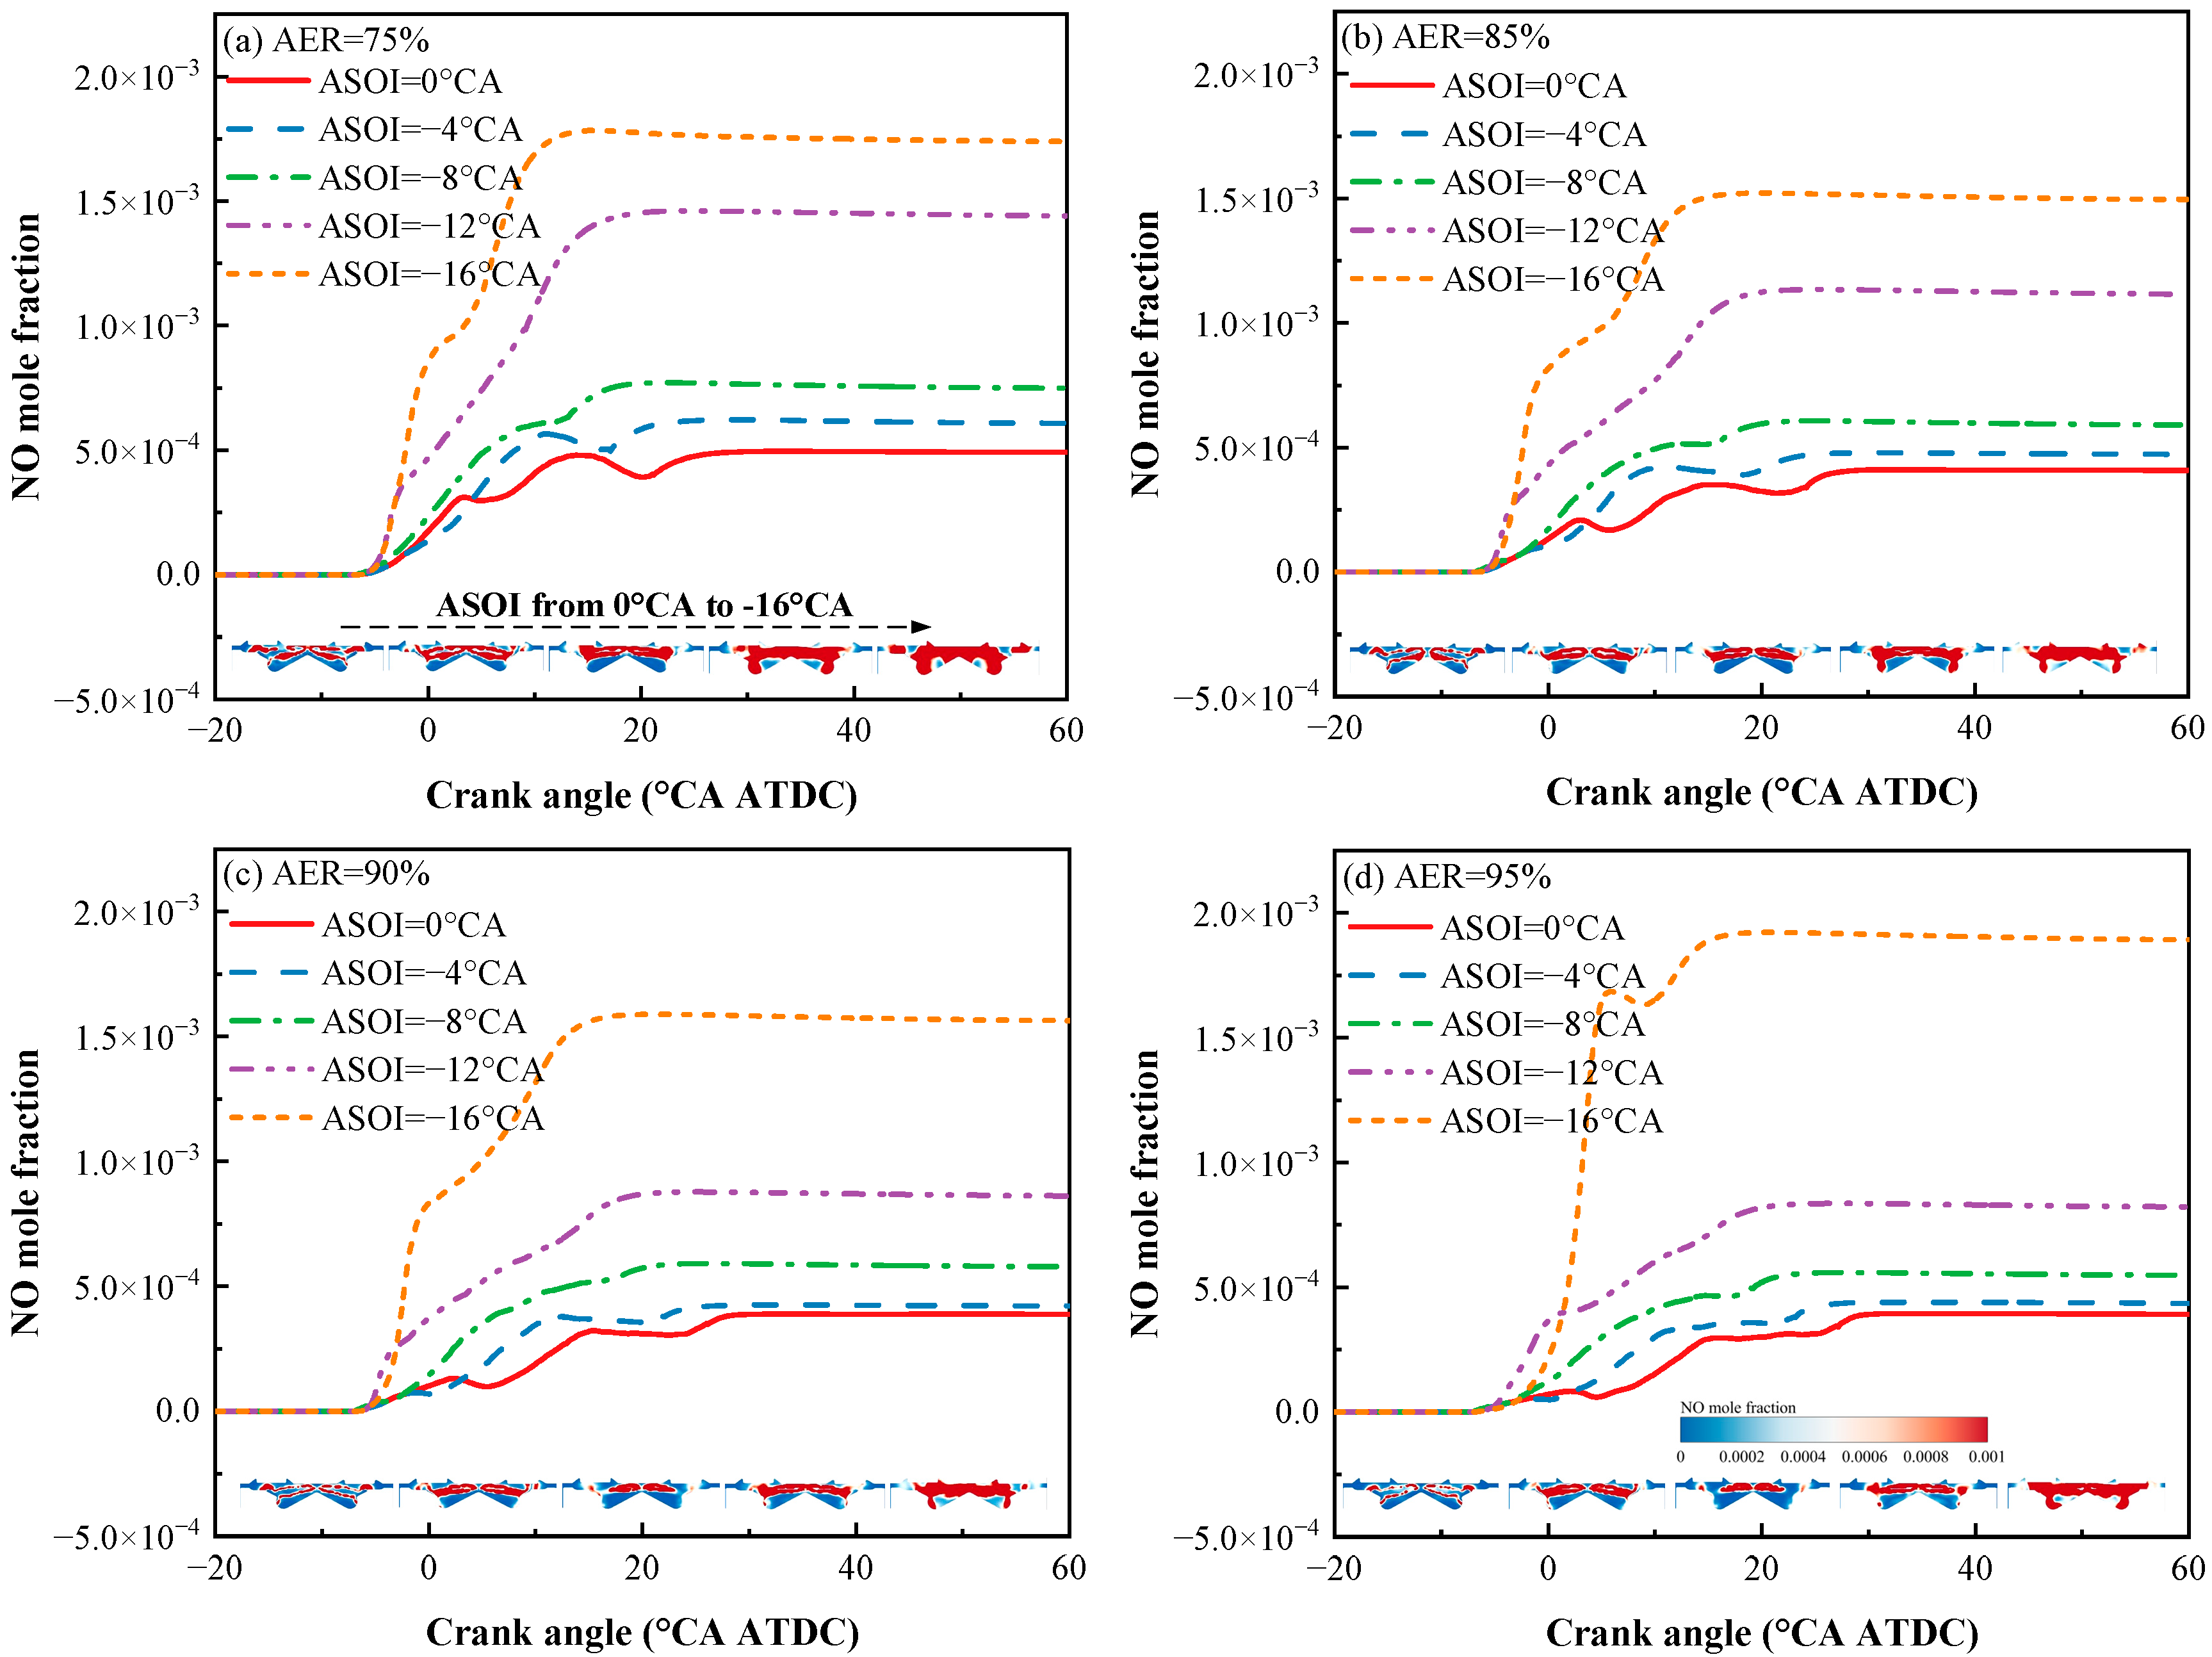
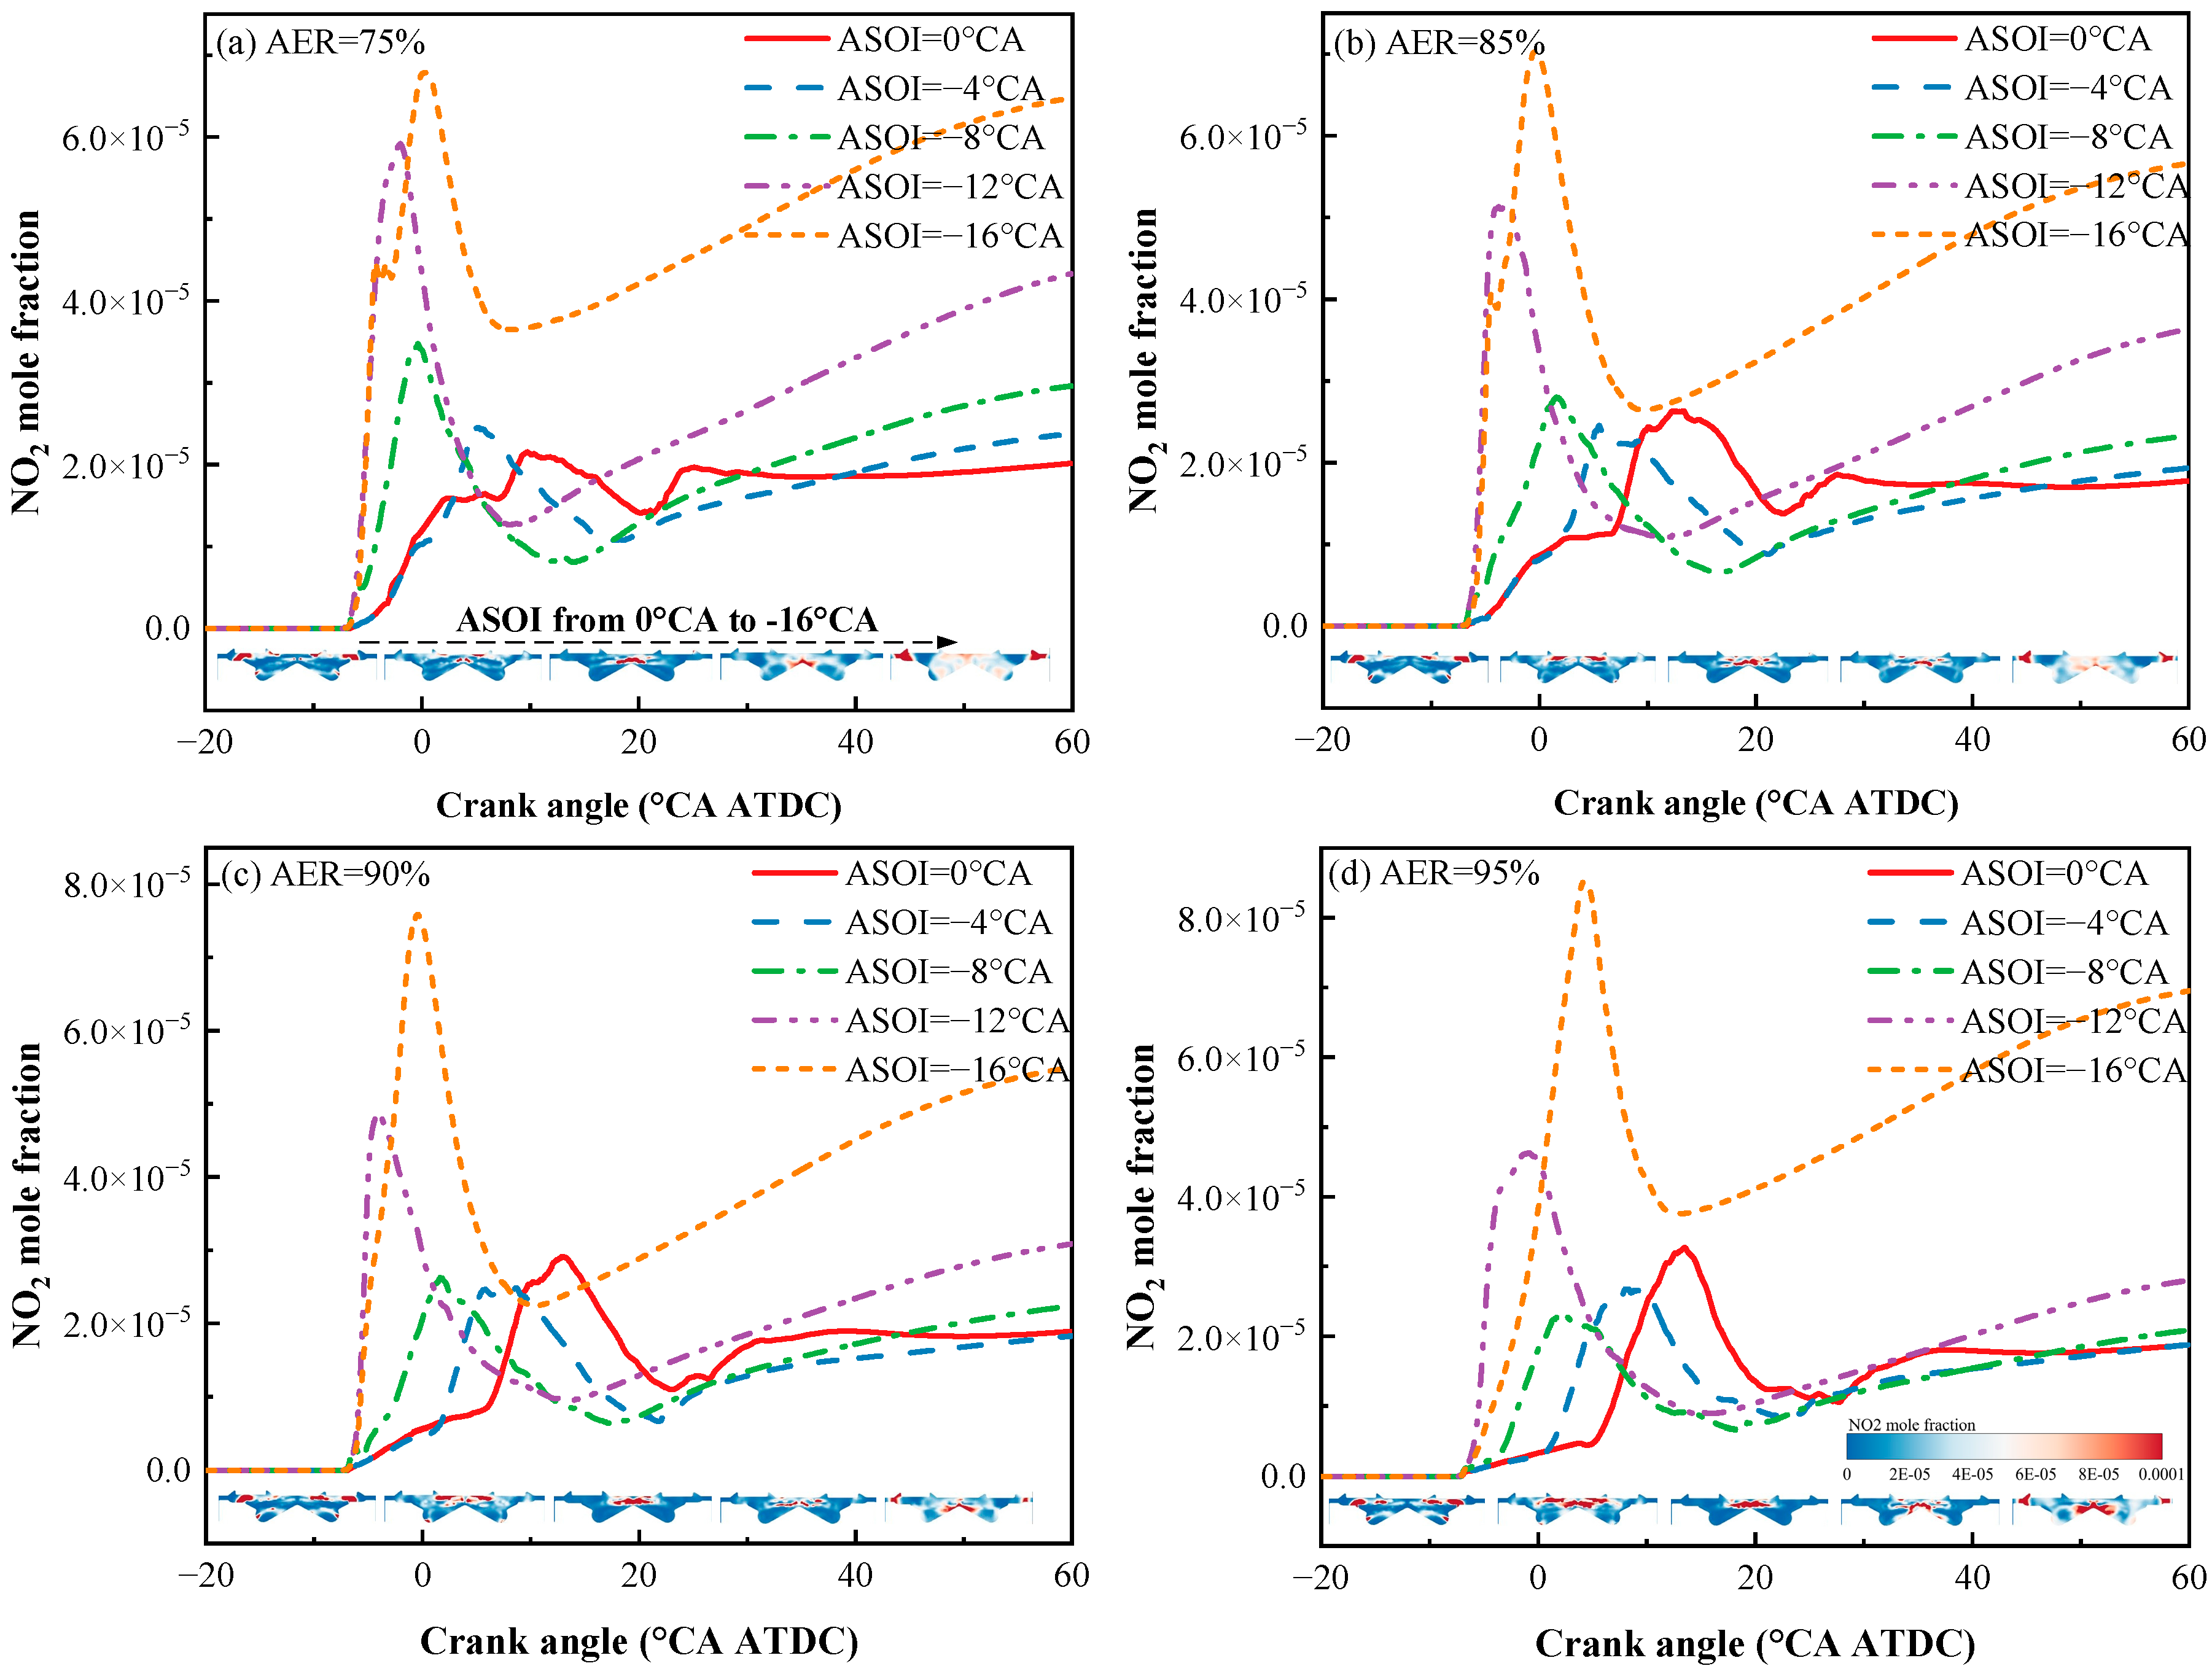
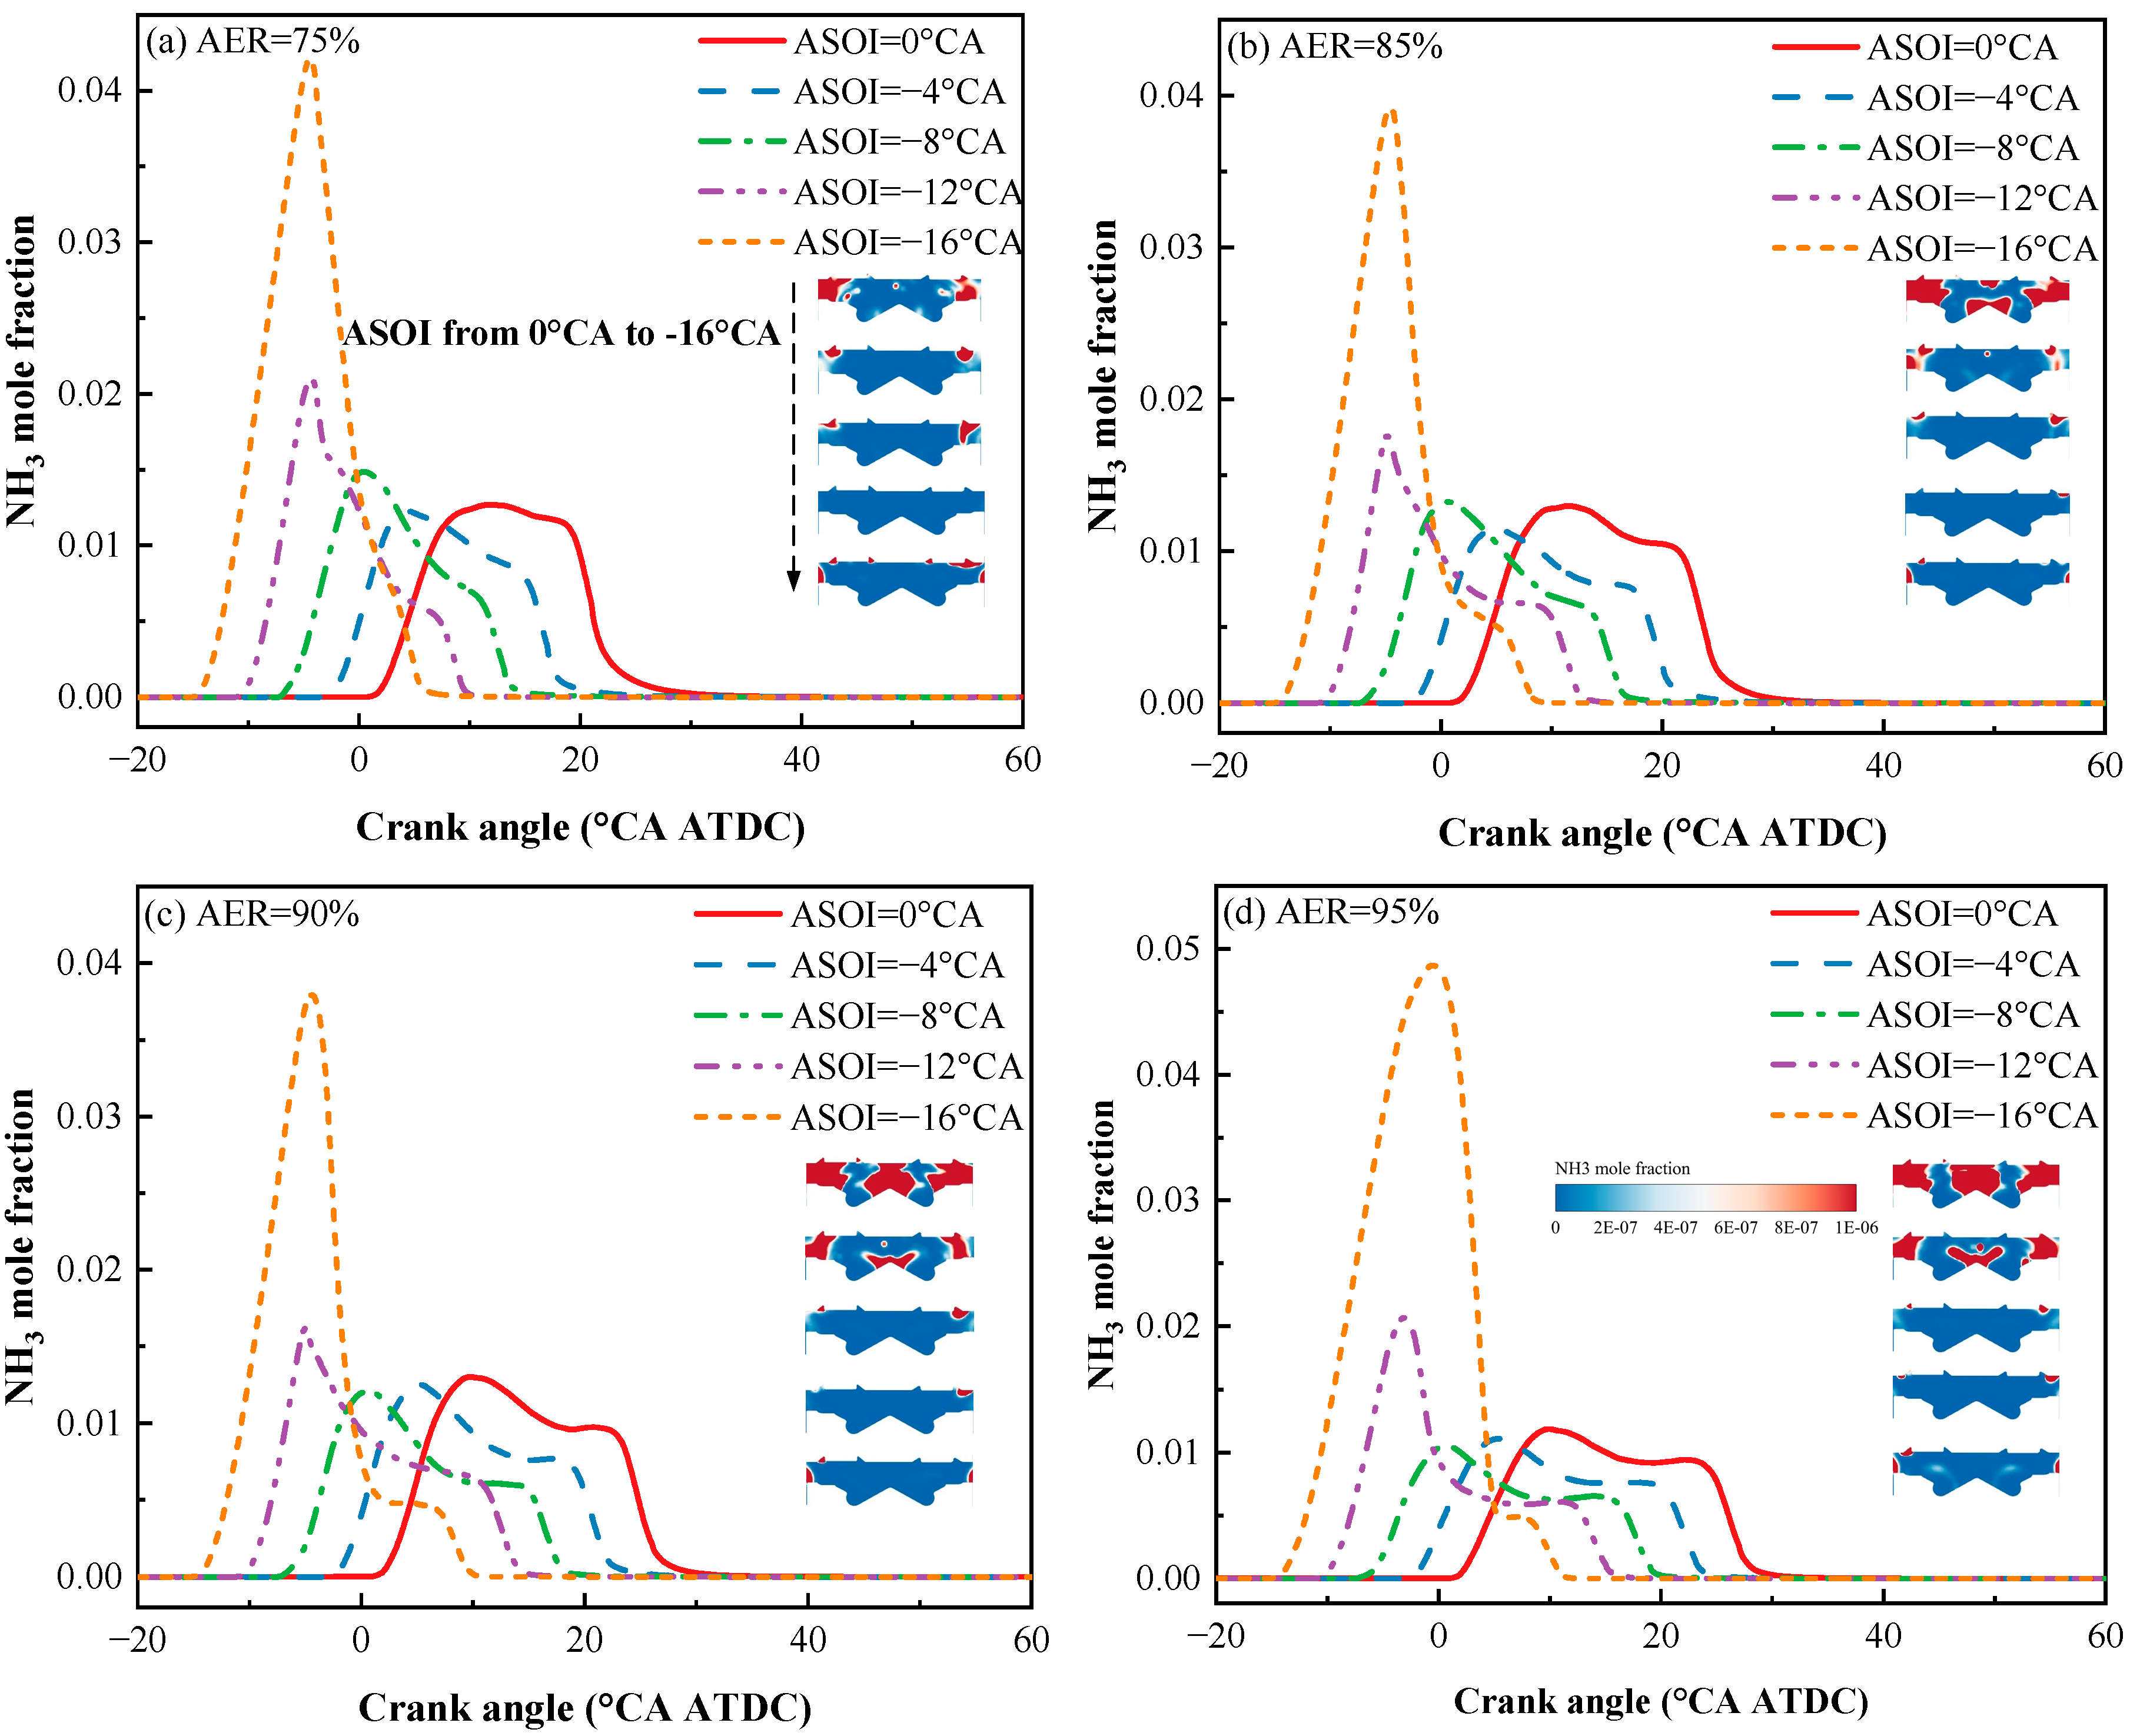
3.2. Emission Characteristics

Figure 11 illustrates the variation in NO mole fraction curves and distribution clouds with the ASOI under different AERs. As the ASOI is advanced, the combustion mode shifts, and the proportion of premixed combustion increases. This leads to a broader distribution of high-temperature regions within the cylinder, creating more favorable conditions for NO formation in terms of mixture equivalence ratio and temperature. Consequently, under all AERs, both the NO mole fraction and its spatial distribution increase with ASOI advancement. When comparing the variation in the NO mole fraction with the AER at the same ASOI, it is observed that at ASOIs = 0 and −4°CA ATDC, corresponding to the HPDF1 mode, the combustion follows a three-stage heat release pattern. Accordingly, the NO mole fraction curves exhibit a characteristic three-peak fluctuation at all AERs, with this fluctuation becoming progressively weaker as the AER increases. In the HPDF1 mode, the final NO emissions show a trend of decreasing and then increasing with the rising AER. This is due to the lower combustion rate of ammonia at higher AERs, which reduces combustion temperatures and suppresses thermal NO formation. However, the increased ammonia concentration also raises fuel-bound NO emissions, resulting in a competing effect that leads to the observed trend. At ASOIs = −12° and −16°CA ATDC, the combustion enters the HPDF2 mode, which is characterized by a two-stage heat release pattern. In this case, the NO mole fraction curves exhibit bimodal fluctuations, although these fluctuations are less pronounced. Due to the same competition between thermal NO and fuel-bound NO formation mechanisms, the final NO emissions in the HPDF2 mode also follow a trend of decreasing and then increasing with the rising AER.
In addition to NO, the remaining major component of total engine NOx emissions is NO2. Figure 12 presents the NO2 mole fraction curves and distribution cloud maps at different AERs with varying ASOI values. The data suggest that the overall variation trend of NO2 closely resembles that of NO. However, at an ASOI = 0°CA ATDC, the NO2 mole fraction curves remain relatively stable during the late combustion stage. In contrast, under the other four ASOI conditions, the NO2 mole fraction curves exhibit a clear increasing trend in the late stage. This difference arises because, at an ASOI = 0°CA ATDC, the combustion process is predominantly diffusion-controlled, resulting in higher in-cylinder temperatures during the latter part of combustion (as shown in Figure 6). Conversely, at the other ASOI settings, the late-stage combustion temperatures are significantly lower, which promotes the gradual oxidation of NO into NO2. As a result, the NO2 mole fraction increases steadily during the late phase of combustion under these conditions.
Figure 13 presents the NH3 mole fraction curves and distribution cloud plots corresponding to different ASOI values at various AERs. A clear trend is observed where the rate of NH3 consumption continuously accelerates as the ASOI is advanced from 0°CA ATDC to −16°CA ATDC. From the distribution cloud plots at 30°CA ATDC, the spatial distribution range of NH3 initially increases and then decreases with ASOI advancement. Similarly, the final unburned NH3 emissions at all AERs show a trend of decreasing followed by increasing with further ASOI advancement. This phenomenon can be explained as follows: as the ASOI is advanced, the combustion mode gradually shifts, increasing the proportion of premixed NH3. This intensifies the combustion process, shortens combustion duration, and promotes faster NH3 oxidation, thereby reducing NH3 emissions. However, when the ASOI is advanced excessively, the proportion of premixed NH3 becomes significantly higher, and NH3 is more widely distributed throughout the cylinder. At this point, due to the inherently slow flame propagation characteristics of NH3, especially in regions near the piston crevice, complete combustion becomes more difficult. As a result, unburned NH3 in these regions increases, ultimately leading to higher NH3 emissions.
Figure 14 illustrates the relationship between ITE and NOx emissions at different AERs and ASOIs; the emission unit “ppm” corresponds to a mole fraction multiplied by 106. The results reveal that the ITE is significantly higher in the HPDF2 mode compared to the HPDF1 mode, albeit at the cost of increased NOx emissions. At all AERs, the ITE under HPDF2 is higher than that under HPDF1, whereas NOx emissions are substantially lower in the HPDF1 mode. This trade-off between NOx emissions and ITE appears difficult to resolve efficiently. However, when the ASOI is set to −8°CA ATDC, where the ammonia and diesel injection timings significantly overlap, the strong in-cylinder turbulence enhances combustion. Meanwhile, the combustion remains primarily diffusion-controlled, which helps suppress NOx formation while maintaining high ITE. Specifically, at an ASOI = −8°CA ATDC and an AER = 95%, an ITE of 53.56% is achieved with NOx emissions limited to just 578 ppm.
N2O is a potent greenhouse gas with a global warming potential (GWP) of 310 and an exceptionally long atmospheric lifetime, making it a significant contributor to global warming. Therefore, N2O emissions cannot be overlooked when evaluating GHG emissions from ammonia/diesel dual-fuel engines. In this study, the equivalent greenhouse gas (EGHG) metric is adopted to assess the overall GHG emissions. The variation in EGHG with the ASOI at different AERs is shown in Figure 15. First, it is evident that CO2 emissions are solely influenced by the AER and the ASOI has no impact on them. Second, N2O emissions exhibit a trend of initially decreasing and then increasing as the ASOI is advanced, with a sharp rise observed when the ASOI is advanced to −16°CA ATDC. This trend is attributed to the fact that the advancing ASOI raises the combustion temperature. When the temperature exceeds 1300 K, it promotes the decomposition of N2O. However, at an ASOI = −16°CA ATDC, the high premixed ratio and moderate oxygen concentration in the combustible mixture favor the formation of N2O. This combination of factors explains the observed decrease followed by an increase in N2O emissions with the advancing ASOI. Additionally, it is observed that N2O emissions increase with a rising AER. Notably, at an AER = 95% and an ASOI = −16°CA ATDC, N2O accounts for more than 78% of the total GHG emissions, highlighting its dominant role under these conditions.

4. Conclusions

In this study, the variations in combustion and emission characteristics of a high-pressure dual-fuel (HPDF) direct injection ammonia/diesel engine under different combustion modes and AERs were investigated using numerical simulations based on CONVERGE software. The main conclusions are as follows:
(1) As the ASOI is advanced from 0°CA ATDC to −16°CA ATDC, the combustion mode transitions from the diffusion-dominated HPDF1 mode to the partially premixed HPDF2 mode. This advancement increases the in-cylinder pressure and changes the heat release pattern from a three-stage to a two-stage combustion process across all AERs. The effect of the AER on the temperature distribution varies depending on the combustion mode. In the HPDF1 and HPDF2 modes with a low premixing ratio, a lower AER enhances combustion characteristics and leads to a broader high-temperature region. In contrast, in the HPDF2 mode with a higher premixing ratio, a high AER does not impair combustion performance but instead promotes a wider distribution of high temperatures due to a more homogeneous fuel–air mixture.
(2) Due to the high specific heat capacity of ammonia and its dilution effect as an inert component, the auto-ignition delay is prolonged with an increasing AER, regardless of the combustion mode. However, the influence of the AER on the durations of CA10–CA50 and CA50–CA90 is combustion mode-dependent. In the HPDF1 mode, increasing the AER shortens the CA10–CA50 interval, while the change in CA50-CA90 is negligible. Conversely, in the HPDF2 mode, CA10–CA50 is extended with an increasing AER, whereas CA50–CA90 is shortened. The MPRR is strongly correlated with the heat release characteristics of the combustion mode. In the HPDF1 mode with a high AER, the MPRR is relatively high, while in the HPDF2 mode, the MPRR reaches its minimum at an AER = 95%.
(3) NOx emissions primarily consist of NO and NO2, and the fluctuations in their formation curves align closely with the heat release characteristics under different combustion modes. In an engine using ammonia as the main fuel, fuel-based NOx becomes significant and cannot be neglected. As the AER increases, thermal NOx and fuel-based NOx exhibit strong competitive behavior, resulting in a trend where overall NOx emissions first decrease and then increase with a rising AER. N2O, on the other hand, is recognized as a potent greenhouse gas. At an AER = 95% and an ASOI = −16°CA ATDC, N2O accounts for up to 78% of the total EGHG emissions.
(4) The ITE in the HPDF2 mode is generally higher than that in the HPDF1 mode, though the degree of improvement varies with the AER. It can be up to 1.88% higher at an AER of 75%, and up to 4.15% higher at an AER of 95%. A clear trade-off exists between NOx emissions and ITE; higher ITE is typically achieved at the expense of increased NOx emissions. However, at an ASOI = −8°CA ATDC and an AER = 95%, this trade-off is mitigated: the ITE can reach as high as 53.56%, while NOx emissions remain relatively low at just 578 ppm, and more importantly, the ASOI effectively mitigates the risk of elevated N2O emissions under high AER conditions.
Due to limitations in experimental conditions, this study only investigates the influence of a single total fuel energy and a fixed engine speed on performance. Future work should further explore the impact of the AER on engine combustion and emission characteristics under different combustion modes across the full engine operating range.

Author Contributions

Conceptualization, C.L.; methodology, S.Y.; software, C.L.; validation, C.L., S.Y., and Y.L.; formal analysis, C.L.; investigation, C.L.; resources, Y.L.; data curation, C.L.; writing—original draft preparation, C.L.; writing—review and editing, C.L.; visualization, S.Y.; supervision, Y.L.; project administration, S.Y. and Y.L.; funding acquisition, Y.L. All authors have read and agreed to the published version of the manuscript.

Funding

This work is supported by the National Natural Science Foundation of China (Grant No. 52176147) and the Hunan Provincial Natural Science Foundation (Grant No. 2023JJ30677).

Data Availability Statement

The original contributions presented in this study are included in the article; further inquiries can be directed to the corresponding authors.

Conflicts of Interest

The authors declare no conflicts of interest.

References

  1. Dimitriou, P.; Javaid, R. A review of ammonia as a compression ignition engine fuel. Int. J. Hydrogen Energy 2020, 45, 7098–7118. [Google Scholar] [CrossRef]
  2. Zhang, J.; Chen, D.; Lai, S.; Li, J.; Huang, H.; Kobayashi, N. Numerical simulation and spray model development of liquid ammonia injection under diesel-engine conditions. Energy 2024, 294, 130833. [Google Scholar] [CrossRef]
  3. Daniel Tang, K.H. Climate change policies of the four largest global emitters of greenhouse gases: Their similarities, differences and way forward. J. Energy Res. Rev. 2022, 10, 19–35. [Google Scholar] [CrossRef]
  4. Akal, D.; Öztuna, S.; Büyükakın, M.K. A review of hydrogen usage in internal combustion engines (gasoline-lpg-diesel) from combustion performance aspect. Int. J. Hydrogen Energy 2020, 45, 35257–35268. [Google Scholar] [CrossRef]
  5. Wang, W.; Fan, L.W.; Zhou, P. Evolution of global fossil fuel trade dependencies. Energy 2022, 238, 121924. [Google Scholar] [CrossRef]
  6. Serrano, R.; Uriondo, Z.; Del Portillo, L.; Basterretxea, A. A study on the optimal adjustment of a turbocharged marine compression-ignition engine with double pilot fuel injection operating under a diesel—h2 dual fuel. Appl. Therm. Eng. 2025, 270, 126233. [Google Scholar] [CrossRef]
  7. Kojima, Y.; Yamaguchi, M. Ammonia as a hydrogen energy carrier. Int. J. Hydrogen Energy 2022, 47, 22832–22839. [Google Scholar] [CrossRef]
  8. Kobayashi, H.; Hayakawa, A.; Somarathne, K.D.K.A.; Okafor, E.C. Science and technology of ammonia combustion. Proc. Combust. Inst. 2019, 37, 109–133. [Google Scholar] [CrossRef]
  9. Cheng, Q.; Muhammad, A.; Kaario, O.; Ahmad, Z.; Martti, L. Ammonia as a sustainable fuel: Review and novel strategies. Renew. Sustain. Energy Rev. 2025, 207, 114995. [Google Scholar] [CrossRef]
  10. Chiong, M.-C.; Chong, C.T.; Ng, J.-H.; Mashruk, S.; Chong, W.W.F.; Samiran, N.A.; Mong, G.R.; Valera-Medina, A. Advancements of combustion technologies in the ammonia-fuelled engines. Energy Convers. Manag. 2021, 244, 114460. [Google Scholar] [CrossRef]
  11. Zhu, J.; Zhou, D.; Yang, W.; Qian, Y.; Mao, Y.; Lu, X. Investigation on the potential of using carbon-free ammonia in large two-stroke marine engines by dual-fuel combustion strategy. Energy 2023, 263, 125748. [Google Scholar] [CrossRef]
  12. Khateeb, A.A.; Guiberti, T.F.; Zhu, X.; Younes, M.; Jamal, A.; Roberts, W.L. Stability limits and no emissions of technically-premixed ammonia-hydrogen-nitrogen-air swirl flames. Int. J. Hydrogen Energy 2020, 45, 22008–22018. [Google Scholar] [CrossRef]
  13. Zi, Z.; Jin, S.; Shi, T.; Zhu, L.; Wu, B. Effect of ammonia energy fraction and diesel injection strategy on load extension and greenhouse gas reduction potential of ammonia-diesel premixed-charge compression ignition engine. Fuel 2025, 398, 135351. [Google Scholar] [CrossRef]
  14. Yousefi, A.; Guo, H.; Dev, S.; Liko, B.; Lafrance, S. Effects of ammonia energy fraction and diesel injection timing on combustion and emissions of an ammonia/diesel dual-fuel engine. Fuel 2022, 314, 122723. [Google Scholar] [CrossRef]
  15. Yousefi, A.; Guo, H.; Dev, S.; Lafrance, S.; Liko, B. A study on split diesel injection on thermal efficiency and emissions of an ammonia/diesel dual-fuel engine. Fuel 2022, 316, 123412. [Google Scholar] [CrossRef]
  16. Pei, Y.; Wang, D.; Jin, S.; Gu, Y.; Wu, C.; Wu, B. A quantitative study on the combustion and emission characteristics of an ammonia-diesel dual-fuel (addf) engine. Fuel Process. Technol. 2023, 250, 107906. [Google Scholar] [CrossRef]
  17. Yang, R.; Yue, Z.; Zhang, S.; Yu, Z.; Wang, H.; Liu, H.; Yao, M. A novel approach of in-cylinder nox control by inner selective non-catalytic reduction effect for high-pressure direct-injection ammonia engine. Fuel 2025, 381, 133349. [Google Scholar] [CrossRef]
  18. Li, T.; Zhou, X.; Wang, N.; Wang, X.; Chen, R.; Li, S.; Yi, P. A comparison between low- and high-pressure injection dual-fuel modes of diesel-pilot-ignition ammonia combustion engines. J. Energy Inst. 2022, 102, 362–373. [Google Scholar] [CrossRef]
  19. Scharl, V.; Sattelmayer, T. Ignition and combustion characteristics of diesel piloted ammonia injections. Fuel Commun. 2022, 11, 100068. [Google Scholar] [CrossRef]
  20. Zhou, X.; Li, T.; Wang, N.; Wang, X.; Chen, R.; Li, S. Pilot diesel-ignited ammonia dual fuel low-speed marine engines: A comparative analysis of ammonia premixed and high-pressure spray combustion modes with cfd simulation. Renew. Sustain. Energy Rev. 2023, 173, 113108. [Google Scholar] [CrossRef]
  21. Zhang, Z.; Long, W.; Dong, P.; Tian, H.; Tian, J.; Li, B.; Wang, Y. Performance characteristics of a two-stroke low speed engine applying ammonia/diesel dual direct injection strategy. Fuel 2023, 332, 126086. [Google Scholar] [CrossRef]
  22. Bjørgen, K.O.P.; Emberson, D.R.; Løvås, T. Combustion of liquid ammonia and diesel in a compression ignition engine operated in high-pressure dual fuel mode. Fuel 2024, 360, 130269. [Google Scholar] [CrossRef]
  23. Zuo, Q.; Chen, L.; Chen, W.; Zhu, G.; Wang, Z.; Ma, Y.; Shen, Z.; Lu, C. Performance analysis of ammonia energy ratio on an ammonia-diesel engine in different fuel supply modes. Fuel 2025, 384, 134038. [Google Scholar] [CrossRef]
  24. Qian, F.; Zhang, S.; Wang, J.; Zhu, N.; Bao, X.; Yang, H.; Xu, X.; Alshahrani, W.A.; Helal, M.H.; Guo, Z. Ammonia Energy Fraction Effect on the Combustion and Reduced NOX Emission of Ammonia/Diesel Dual Fuel. Environ. Res. 2024, 261, 119530. [Google Scholar] [CrossRef]
  25. Wu, B.; Zi, Z.; Jin, S.; Pei, Y.; Wang, D. Effect of diesel injection strategy and ammonia energy fraction on ammonia-diesel premixed-charge compression ignition combustion and emissions. Fuel 2024, 357, 129785. [Google Scholar] [CrossRef]
  26. Liu, J.; Liu, J. Experimental investigation of the effect of ammonia substitution ratio on an ammonia-diesel dual-fuel engine performance. J. Clean. Prod. 2024, 434, 140274. [Google Scholar] [CrossRef]
  27. Zhang, S.; Tang, Q.; Liu, H.; Yang, R.; Yao, M. Numerical investigation and optimization of the ammonia/diesel dual fuel engine combustion under high ammonia substitution ratio. J. Energy Inst. 2024, 117, 101797. [Google Scholar] [CrossRef]
  28. Mi, S.; Wu, H.; Pei, X.; Liu, C.; Zheng, L.; Zhao, W.; Qian, Y.; Lu, X. Potential of ammonia energy fraction and diesel pilot-injection strategy on improving combustion and emission performance in an ammonia-diesel dual fuel engine. Fuel 2023, 343, 127889. [Google Scholar] [CrossRef]
  29. Han, Z.; Reitz, R.D. Turbulence modeling of internal combustion engines using rng κ-ε models. Combust. Sci. Technol. 1995, 106, 267–295. [Google Scholar] [CrossRef]
  30. Wang, H.; Ji, C.; Wang, D.; Wang, Z.; Yang, J.; Meng, H.; Shi, C.; Wang, S.; Wang, X.; Ge, Y.; et al. Investigation on the potential of using carbon-free ammonia and hydrogen in small-scaled wankel rotary engines. Energy 2023, 283, 129166. [Google Scholar] [CrossRef]
  31. Reitz, R.D.; Beale, J.C. Modeling spray atomization with the kelvin-helmholtz/rayleigh-taylor hybrid model. At. Sprays 1999, 9, 623–650. [Google Scholar] [CrossRef]
  32. Schmidt, D.P.; Rutland, C.J. A new droplet collision algorithm. J. Comput. Phys. 2000, 164, 62–80. [Google Scholar] [CrossRef]
  33. Wang, B.; Wang, H.; Yang, C.; Hu, D.; Duan, B.; Wang, Y. Effect of different ammonia/methanol ratios on engine combustion and emission performance. Appl. Therm. Eng. 2024, 236, 121519. [Google Scholar] [CrossRef]
  34. Reitz, R. Development and testing of diesel engine cfd models. Prog. Energy Combust. Sci. 1995, 21, 173–196. [Google Scholar] [CrossRef]
  35. Wang, B.; Yang, C.; Wang, H.; Hu, D.; Wang, Y. Effect of diesel-ignited ammonia/hydrogen mixture fuel combustion on engine combustion and emission performance. Fuel 2023, 331, 125865. [Google Scholar] [CrossRef]
  36. Xu, L.; Chang, Y.; Treacy, M.; Zhou, Y.; Jia, M.; Bai, X.S. A skeletal chemical kinetic mechanism for ammonia/n-heptane combustion. Fuel 2023, 331, 125830. [Google Scholar] [CrossRef]
Figure 1. (a) Engine geometry model and (b) fuel injection schematic.
Processes 13 01953 g001
Figure 2. (a) Grid sensitivity validation and (b) engine grid.
Processes 13 01953 g002
Figure 3. Comparison of simulated and experimental data: (a) in-cylinder pressure and HRR and (b) emissions.
Processes 13 01953 g003
Figure 4. Vapor penetration and liquid penetration of ammonia spray.
Processes 13 01953 g004
Figure 5. In-cylinder pressure and exothermic rate at different AERs and ASOIs.
Processes 13 01953 g005
Figure 6. Temperature at different AERs and ASOIs.
Processes 13 01953 g006
Figure 7. Combustion times at different AERs and ASOIs.
Processes 13 01953 g007
Figure 8. MPRR at different AERs and ASOIs.
Processes 13 01953 g008
Figure 9. Combustion loss at different AERs and ASOIs.
Processes 13 01953 g009
Figure 10. ITE at different AERs and ASOIs.
Processes 13 01953 g010
Figure 11. NO generation curves and distribution clouds at different AERs and ASOIs.
Processes 13 01953 g011
Figure 12. NO2 generation curves and distribution clouds at different AERs and ASOIs.
Processes 13 01953 g012
Figure 13. NH3 generation curves and distribution clouds at different AERs and ASOIs.
Processes 13 01953 g013
Figure 14. Relationship between ITE and NOx emissions under different AERs and ASOIs.
Processes 13 01953 g014
Figure 15. GHG emissions at different AERs and ASOIs.
Processes 13 01953 g015
Table 1. Engine specifications [17].
ParametersValue
Bore (mm)138
Stroke (mm)165
Connecting rod (mm)258.5
Compression ratio22.69
Speed (r/min)1100
Intake valve close (°CA ATDC)−166
Exhaust valve open (°CA ATDC)134
No. diesel injector hole × diameter (mm)10 × 0.213
No. ammonia injector hole × diameter (mm)10 × 0.3
Injection pressure (MPa)80 (diesel)/80 (ammonia)
Table 2. Initial conditions of the model [17].
ItemValue
Initial pressure (bar)2.66
Initial temperature (K)370
Piston temperature (K)550
Cylinder wall temperature (K)500
Cylinder head temperature (K)600
Disclaimer/Publisher’s Note: The statements, opinions and data contained in all publications are solely those of the individual author(s) and contributor(s) and not of MDPI and/or the editor(s). MDPI and/or the editor(s) disclaim responsibility for any injury to people or property resulting from any ideas, methods, instructions or products referred to in the content.

