
Research on the Low-Carbon Economic Operation Optimization of Virtual Power Plant Clusters Considering the Interaction Between Electricity and Carbon


Abstract
1. Introduction
1.1. Literature Review
1.2. Contributions
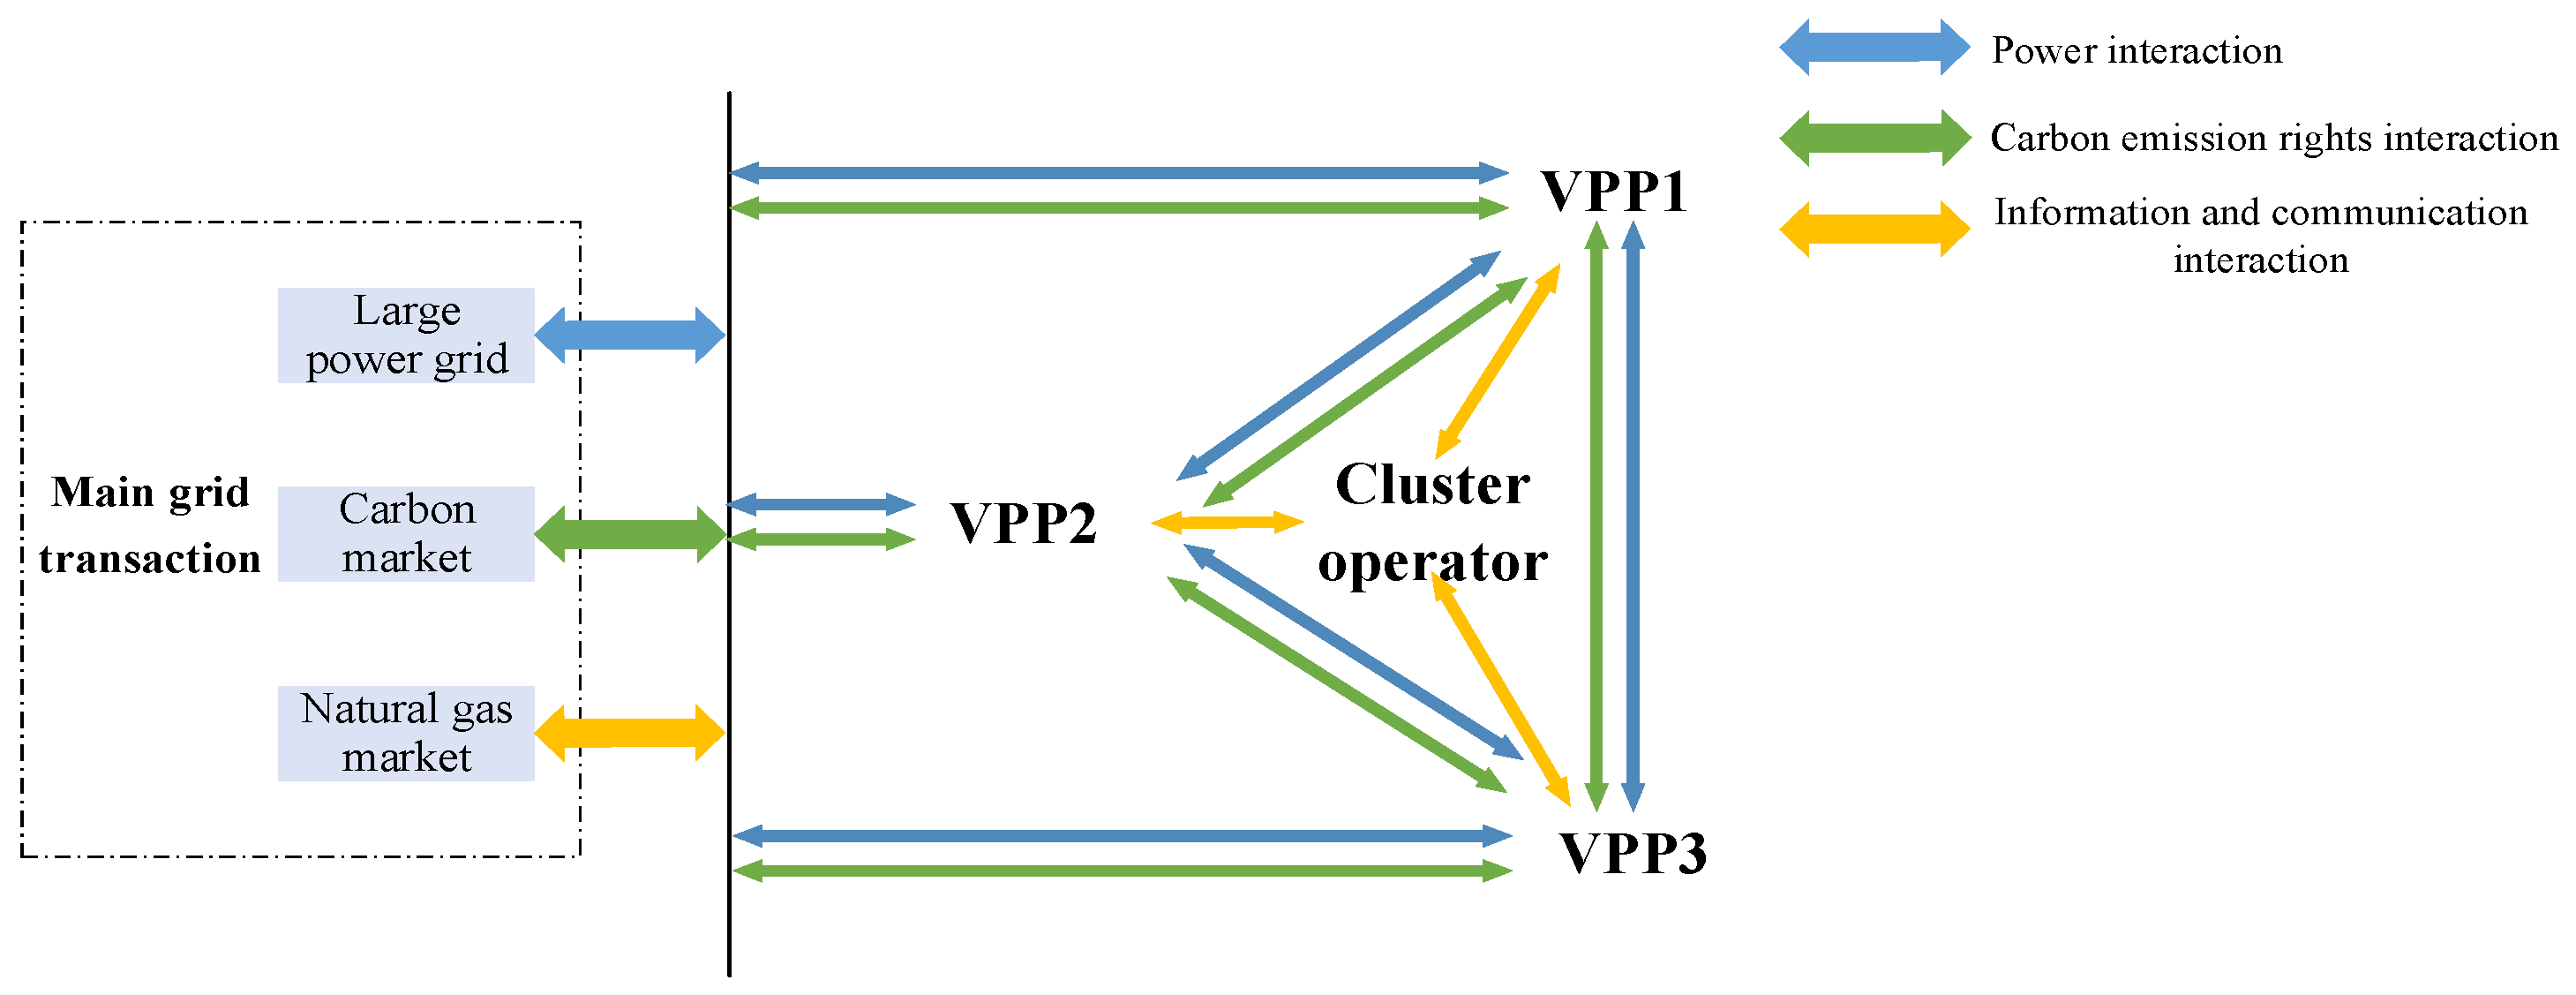
- Electricity–carbon interactive architecture:
- Privacy-preserving distributed optimization:
- Improved ADMM algorithm:
2. Framework of VPPC
3. Distributed Operation Model of VPPC Based on Nash Negotiation
3.1. Nash Bargaining Model of Cooperative Game
3.1.1. Basic Principle of Nash Negotiation
3.1.2. Nash Negotiation Model of VPPC
- Subproblem 1 guarantees the solution lies on the Pareto frontier (i.e., no other feasible physical schedule yields a higher total gain total achievable coalition gain), satisfying the collective optimality requirement.
- Subproblem 2, using the bargaining indices derived from Subproblem 1’s KKT conditions (which encode sensitivity at the optimum), ensures the distribution of total achievable coalition gain adheres to the proportional fairness inherent in the Nash product. The combined solution therefore satisfies the necessary optimality conditions for the original problem.
3.2. Calculation of the Individual Benefits of VPPs Under the Cooperative Alliance
3.2.1. Objective Function
- Interaction Cost with the External Market
- P2P Interaction Cost
- Carbon Cost
- Carbon Sequestration and Transportation Costs
- Operation and Maintenance Cost
- Interruptible Load Compensation Cost
Constraints
- Power Balance Constraint
- P2P Transaction Constraint
- P2P price transaction constraint
- Other constraints
3.3. Uncertainty Measurement of VPPs Based on Conditional Value at Risk
3.4. Distributed Optimization Model for Cluster Operation
3.4.1. Subproblem 1: Model for Minimizing the Total Cost of the VPPC
3.4.2. Subproblem 2: Model for Minimizing the Operating Cost of Each VPP
4. Model Solution Method and Solution Process
4.1. ADMM Computational Framework
4.2. Improved ADMM Method
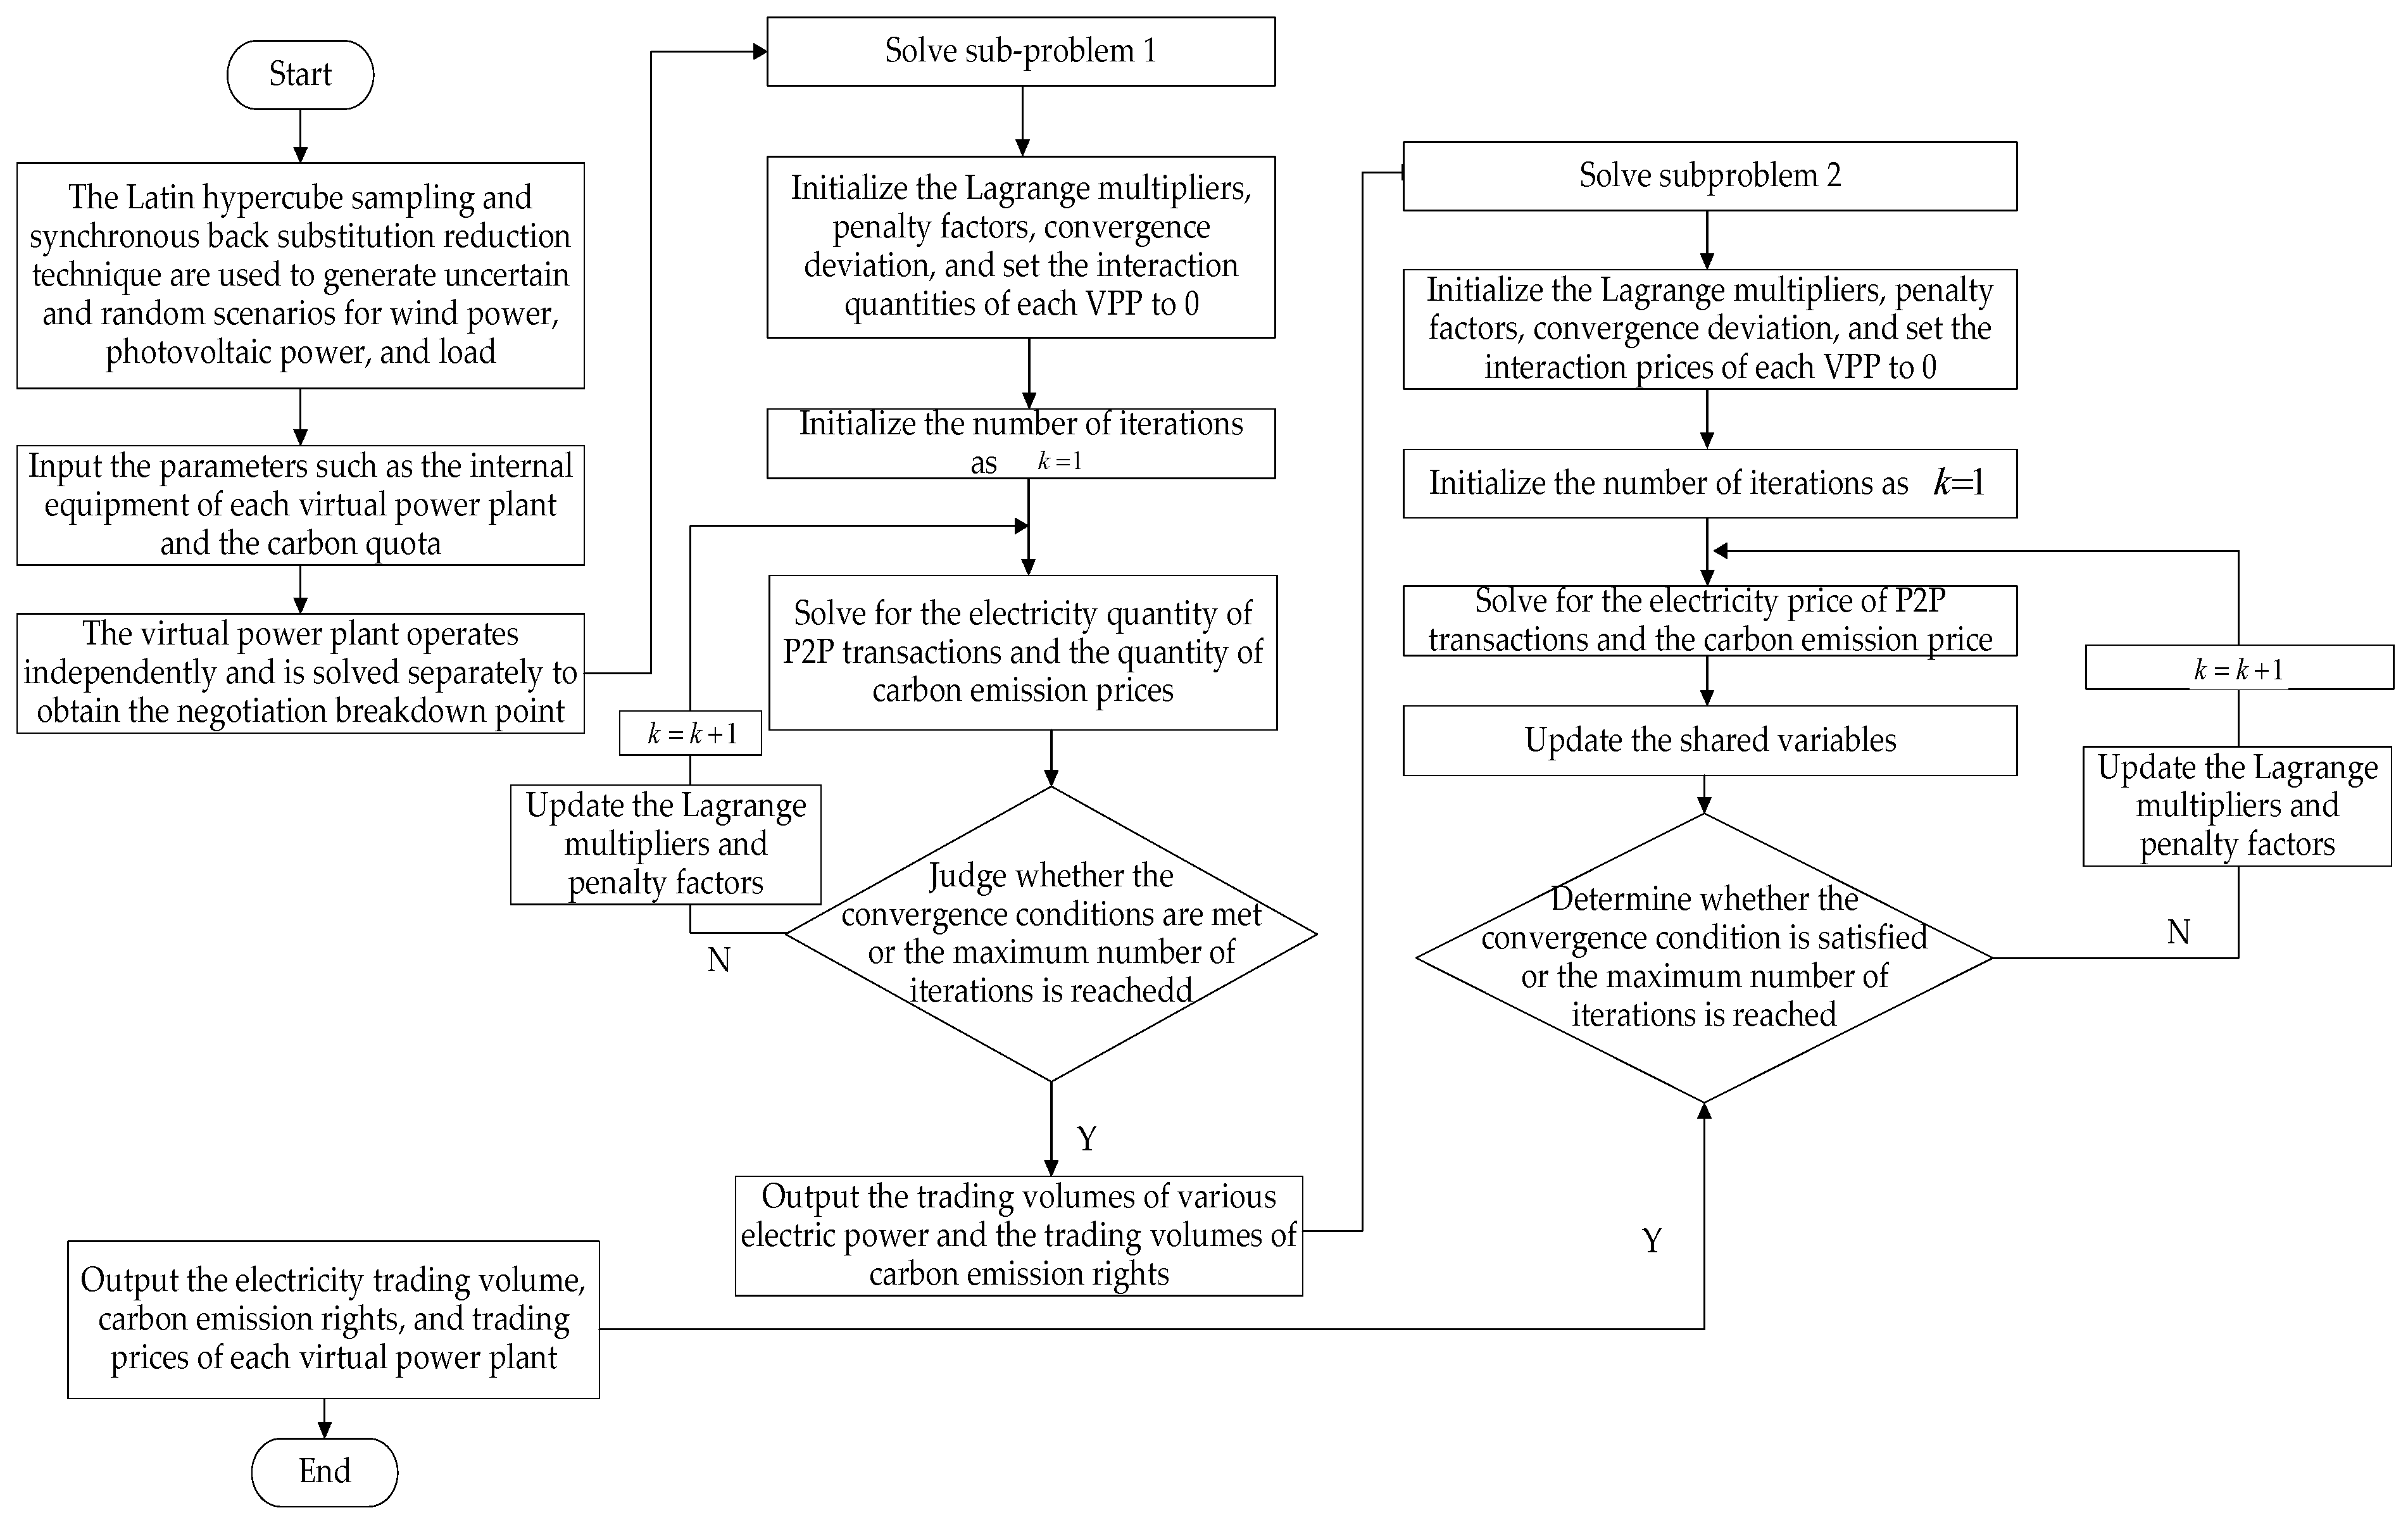
4.3. Model Solution Process
5. Case Analysis
5.1. Basic Data
5.2. Result of Operation Optimization
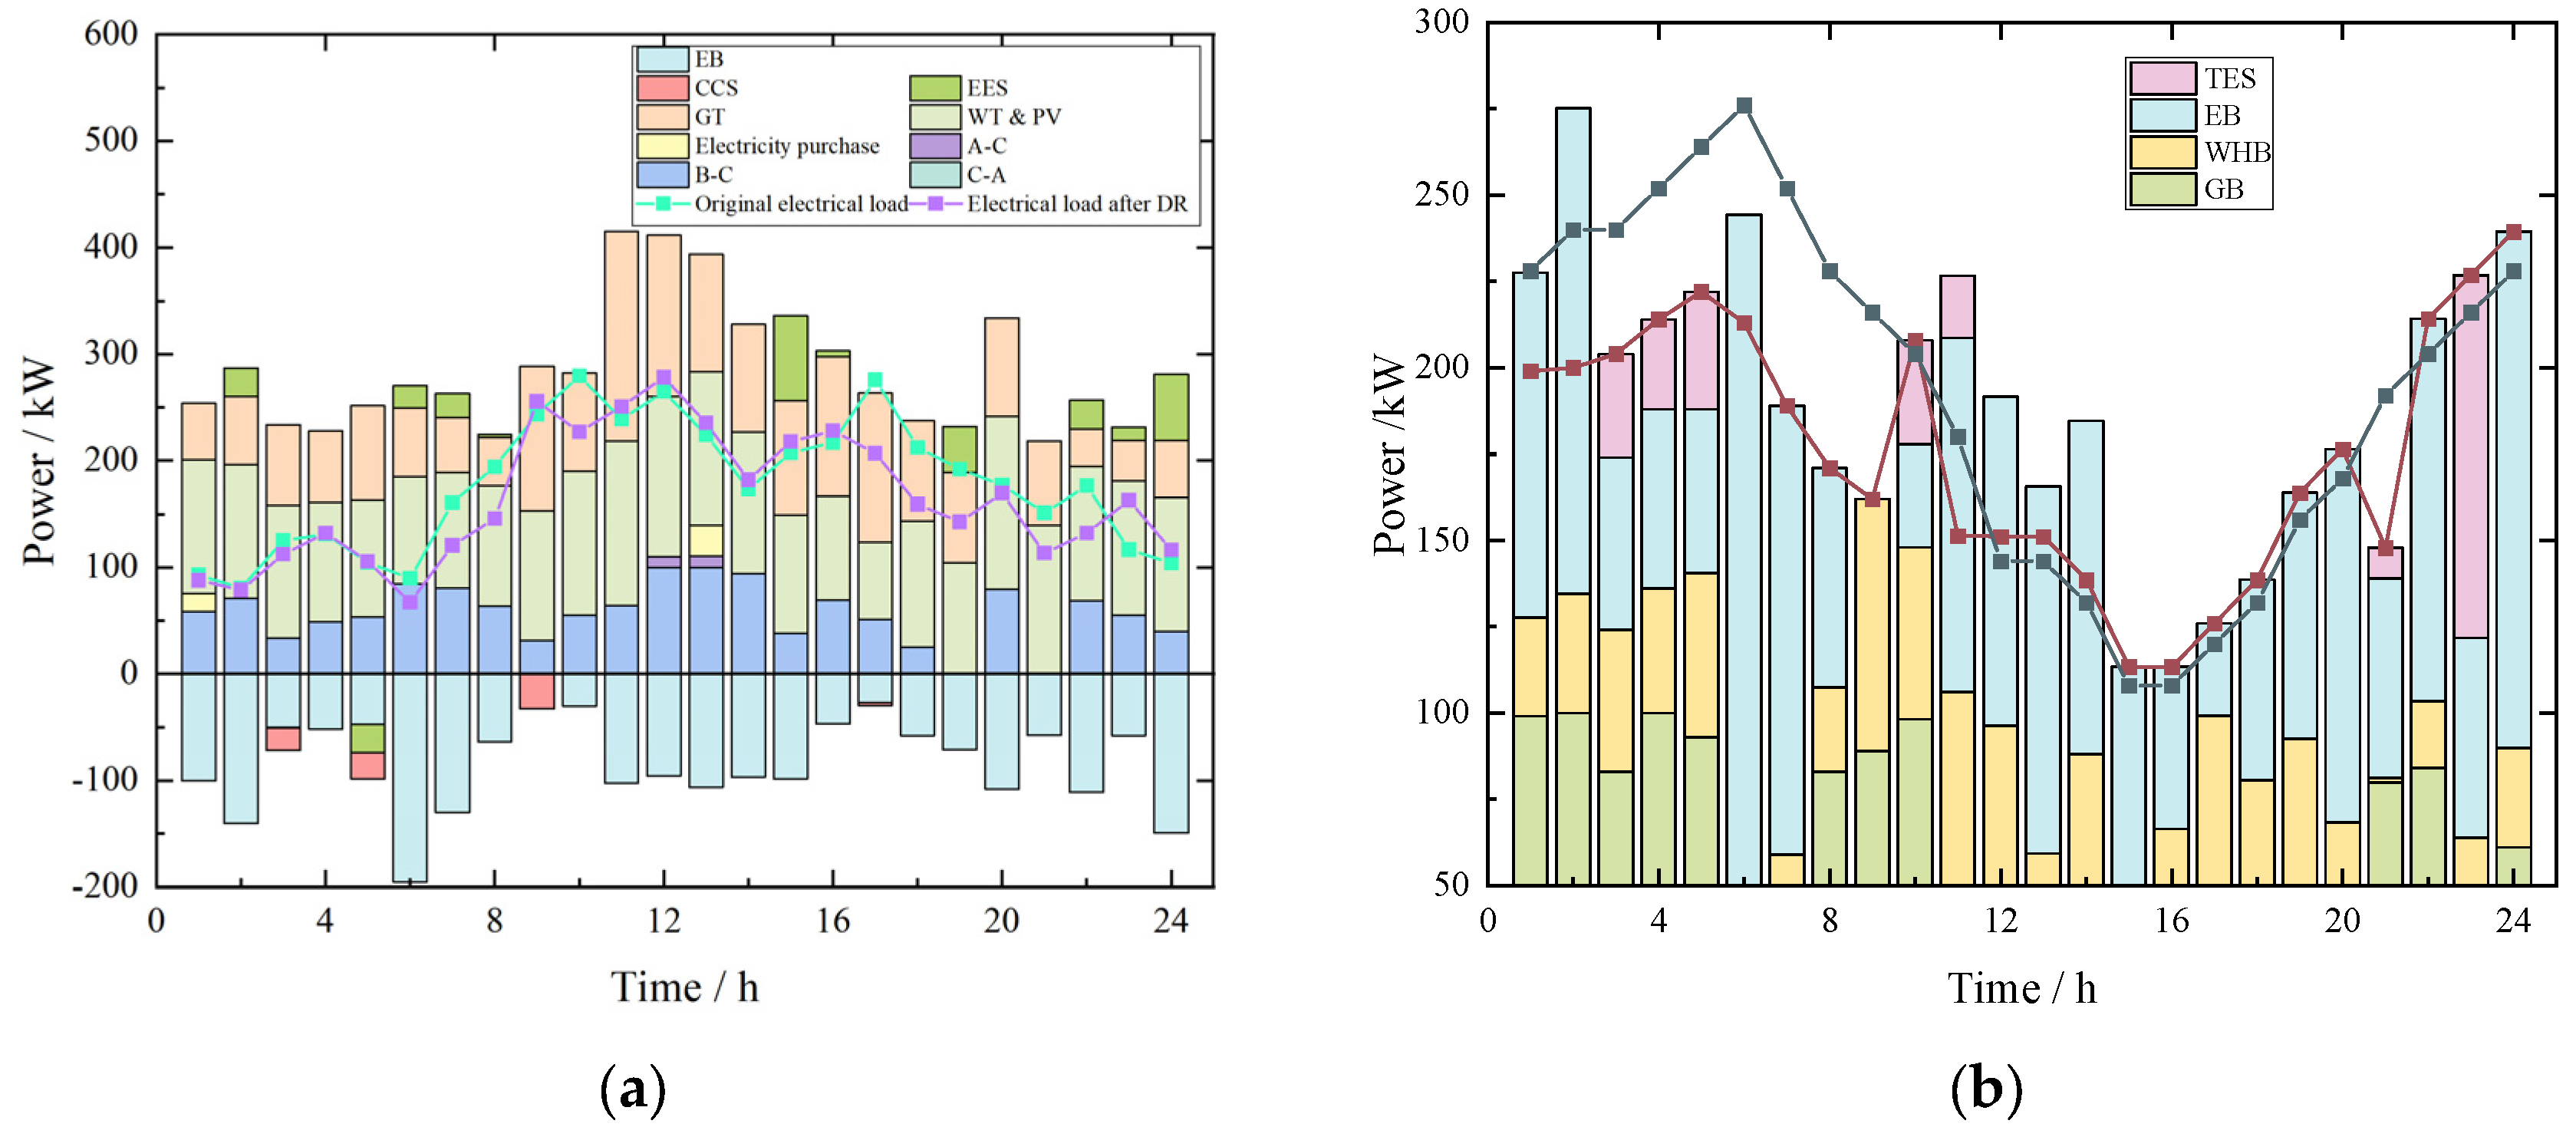
5.2.1. Operation Results of the VPPC
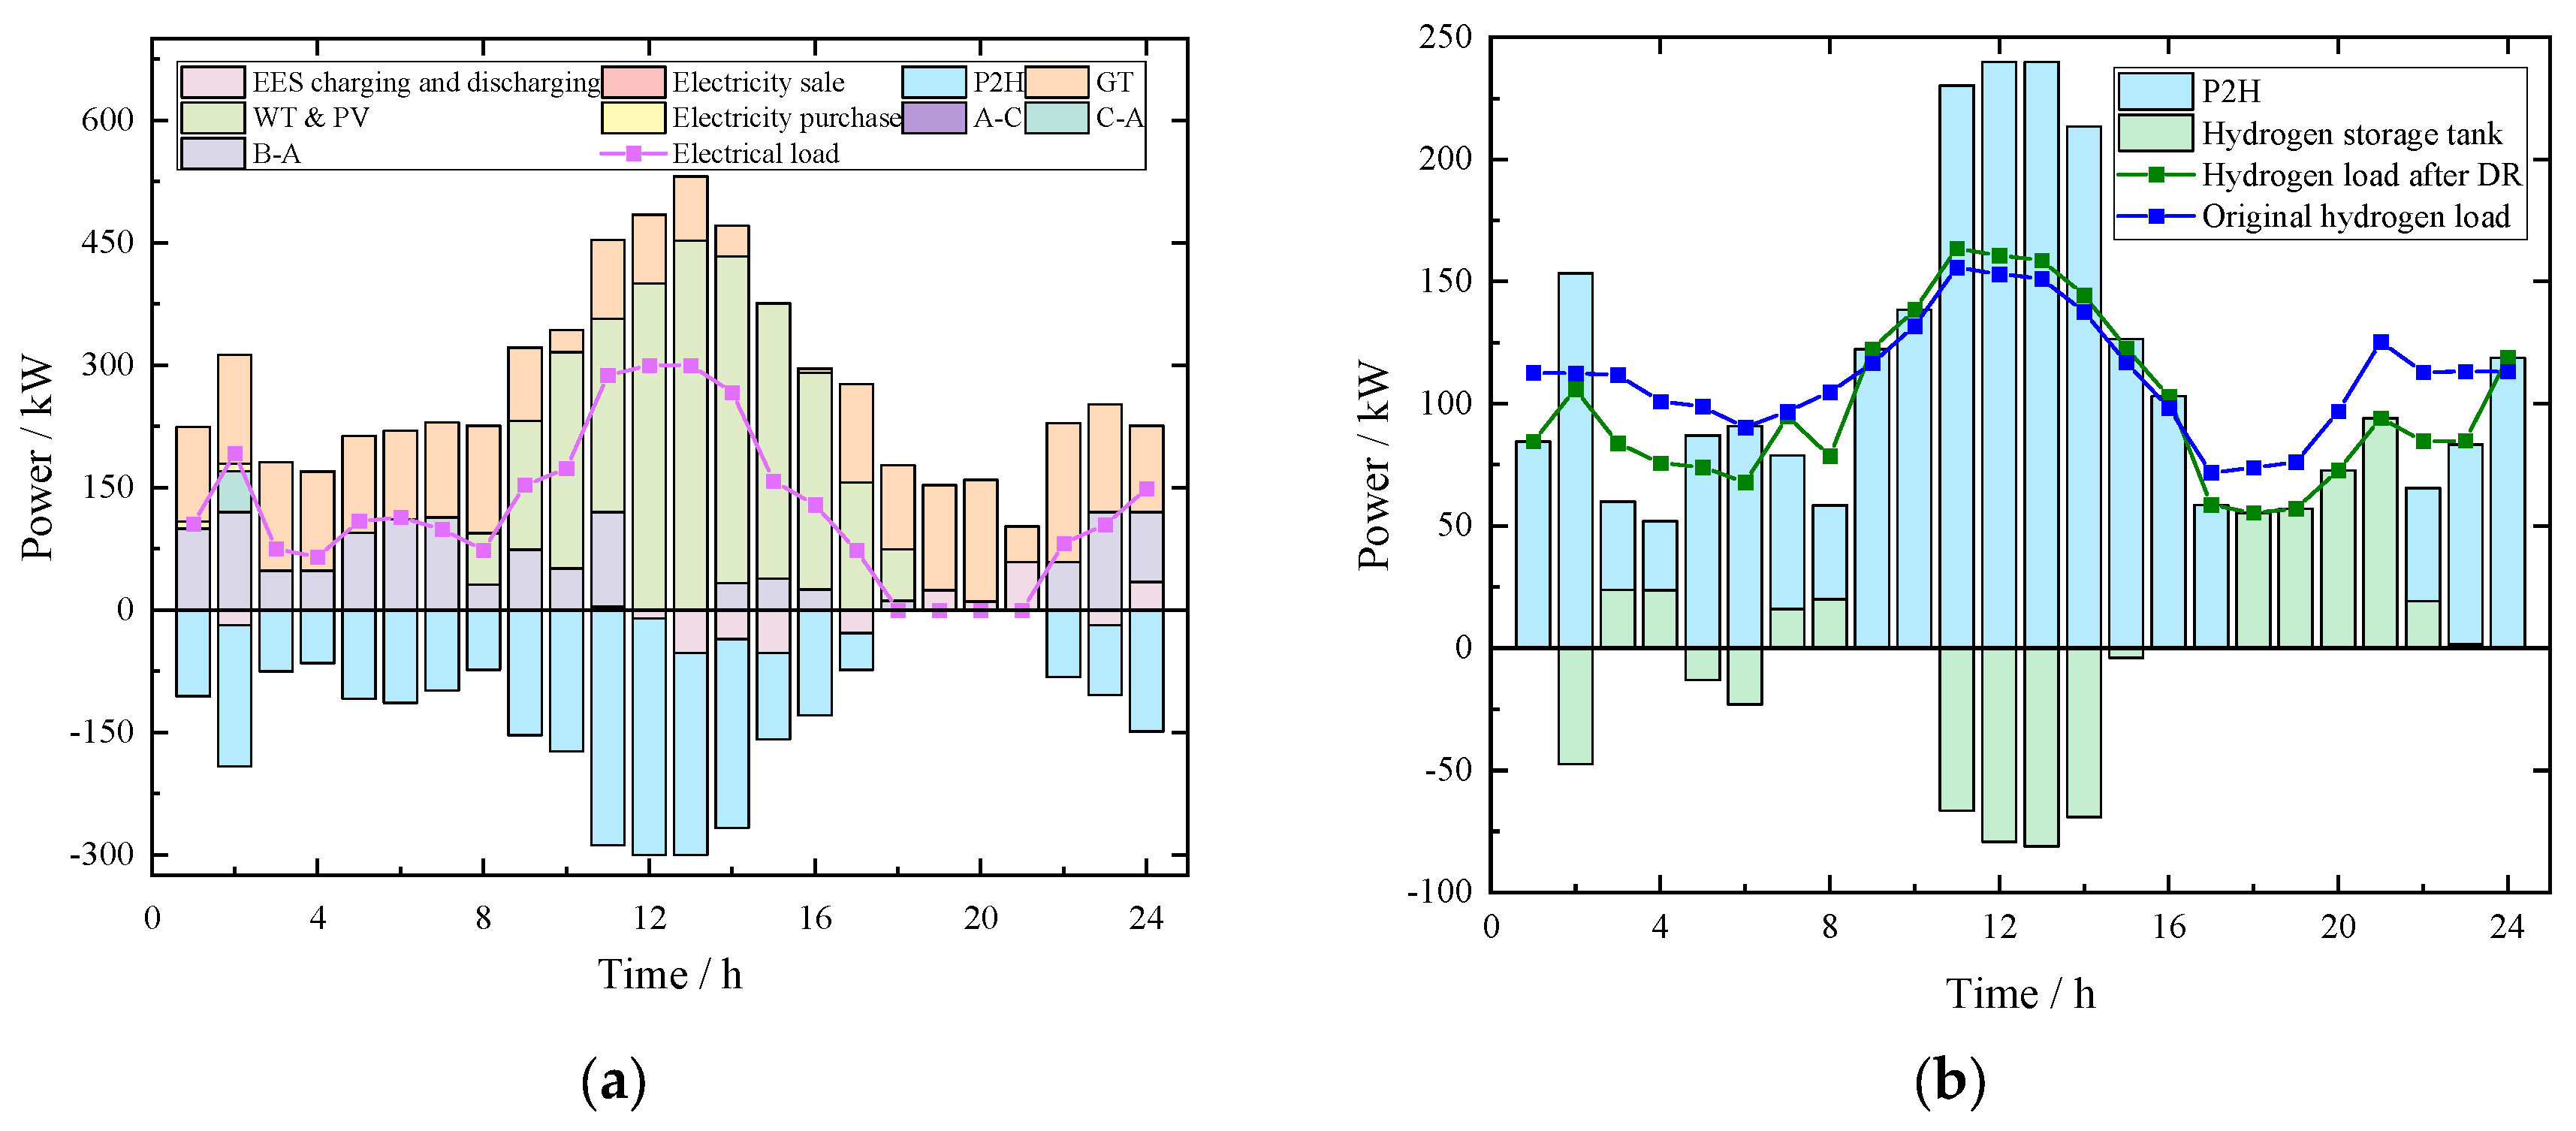
- VPP1
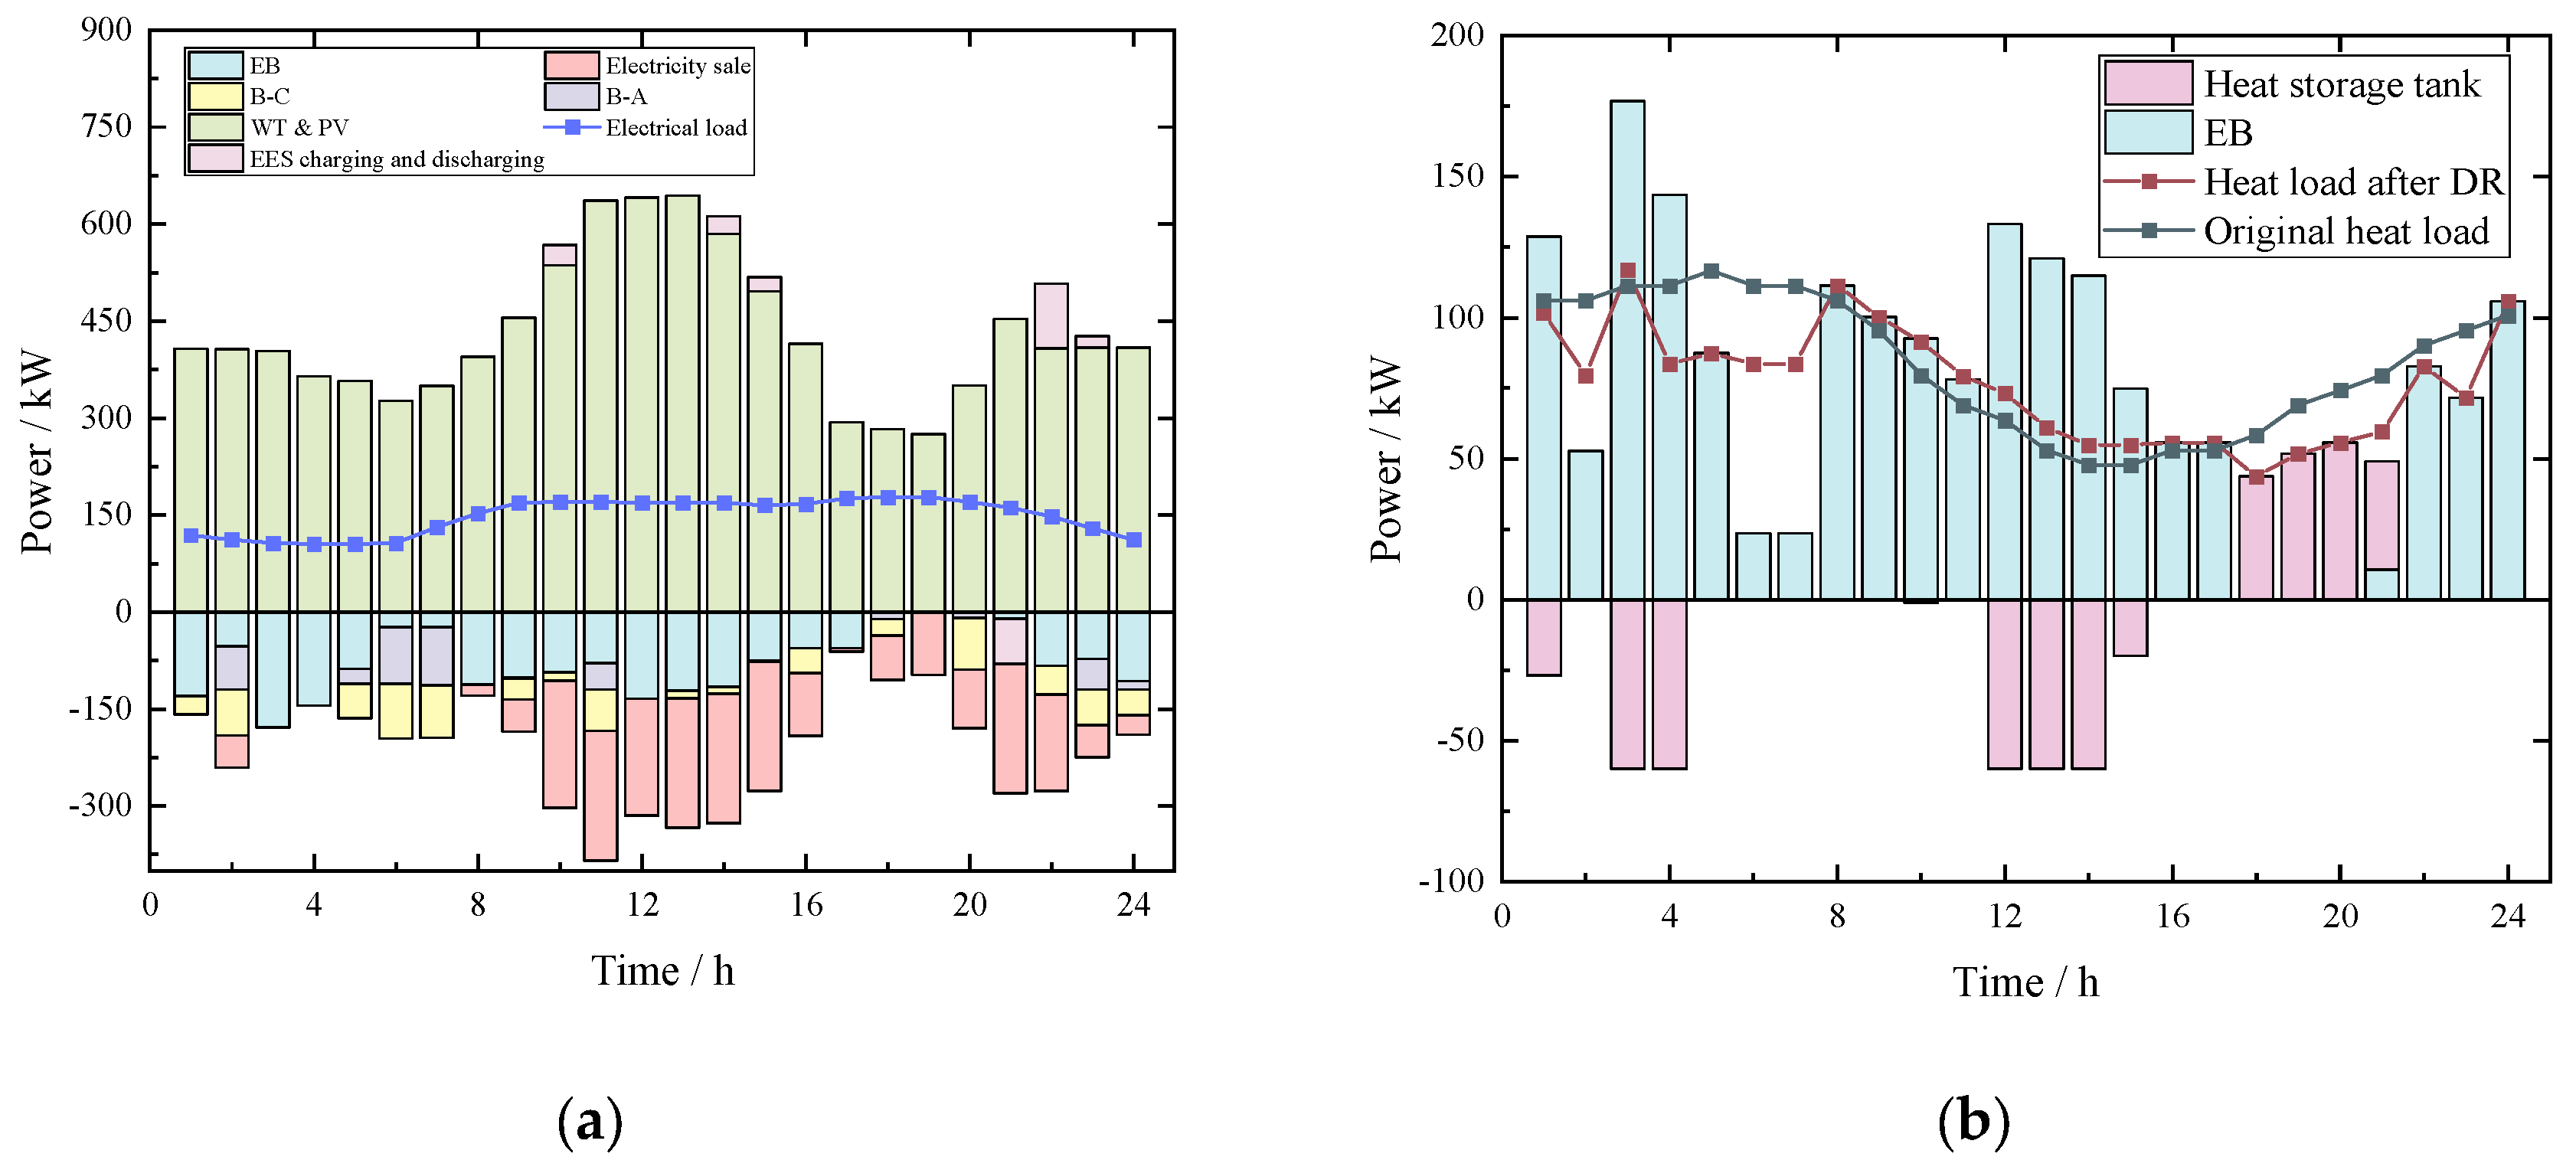
- VPP2
- VPP3
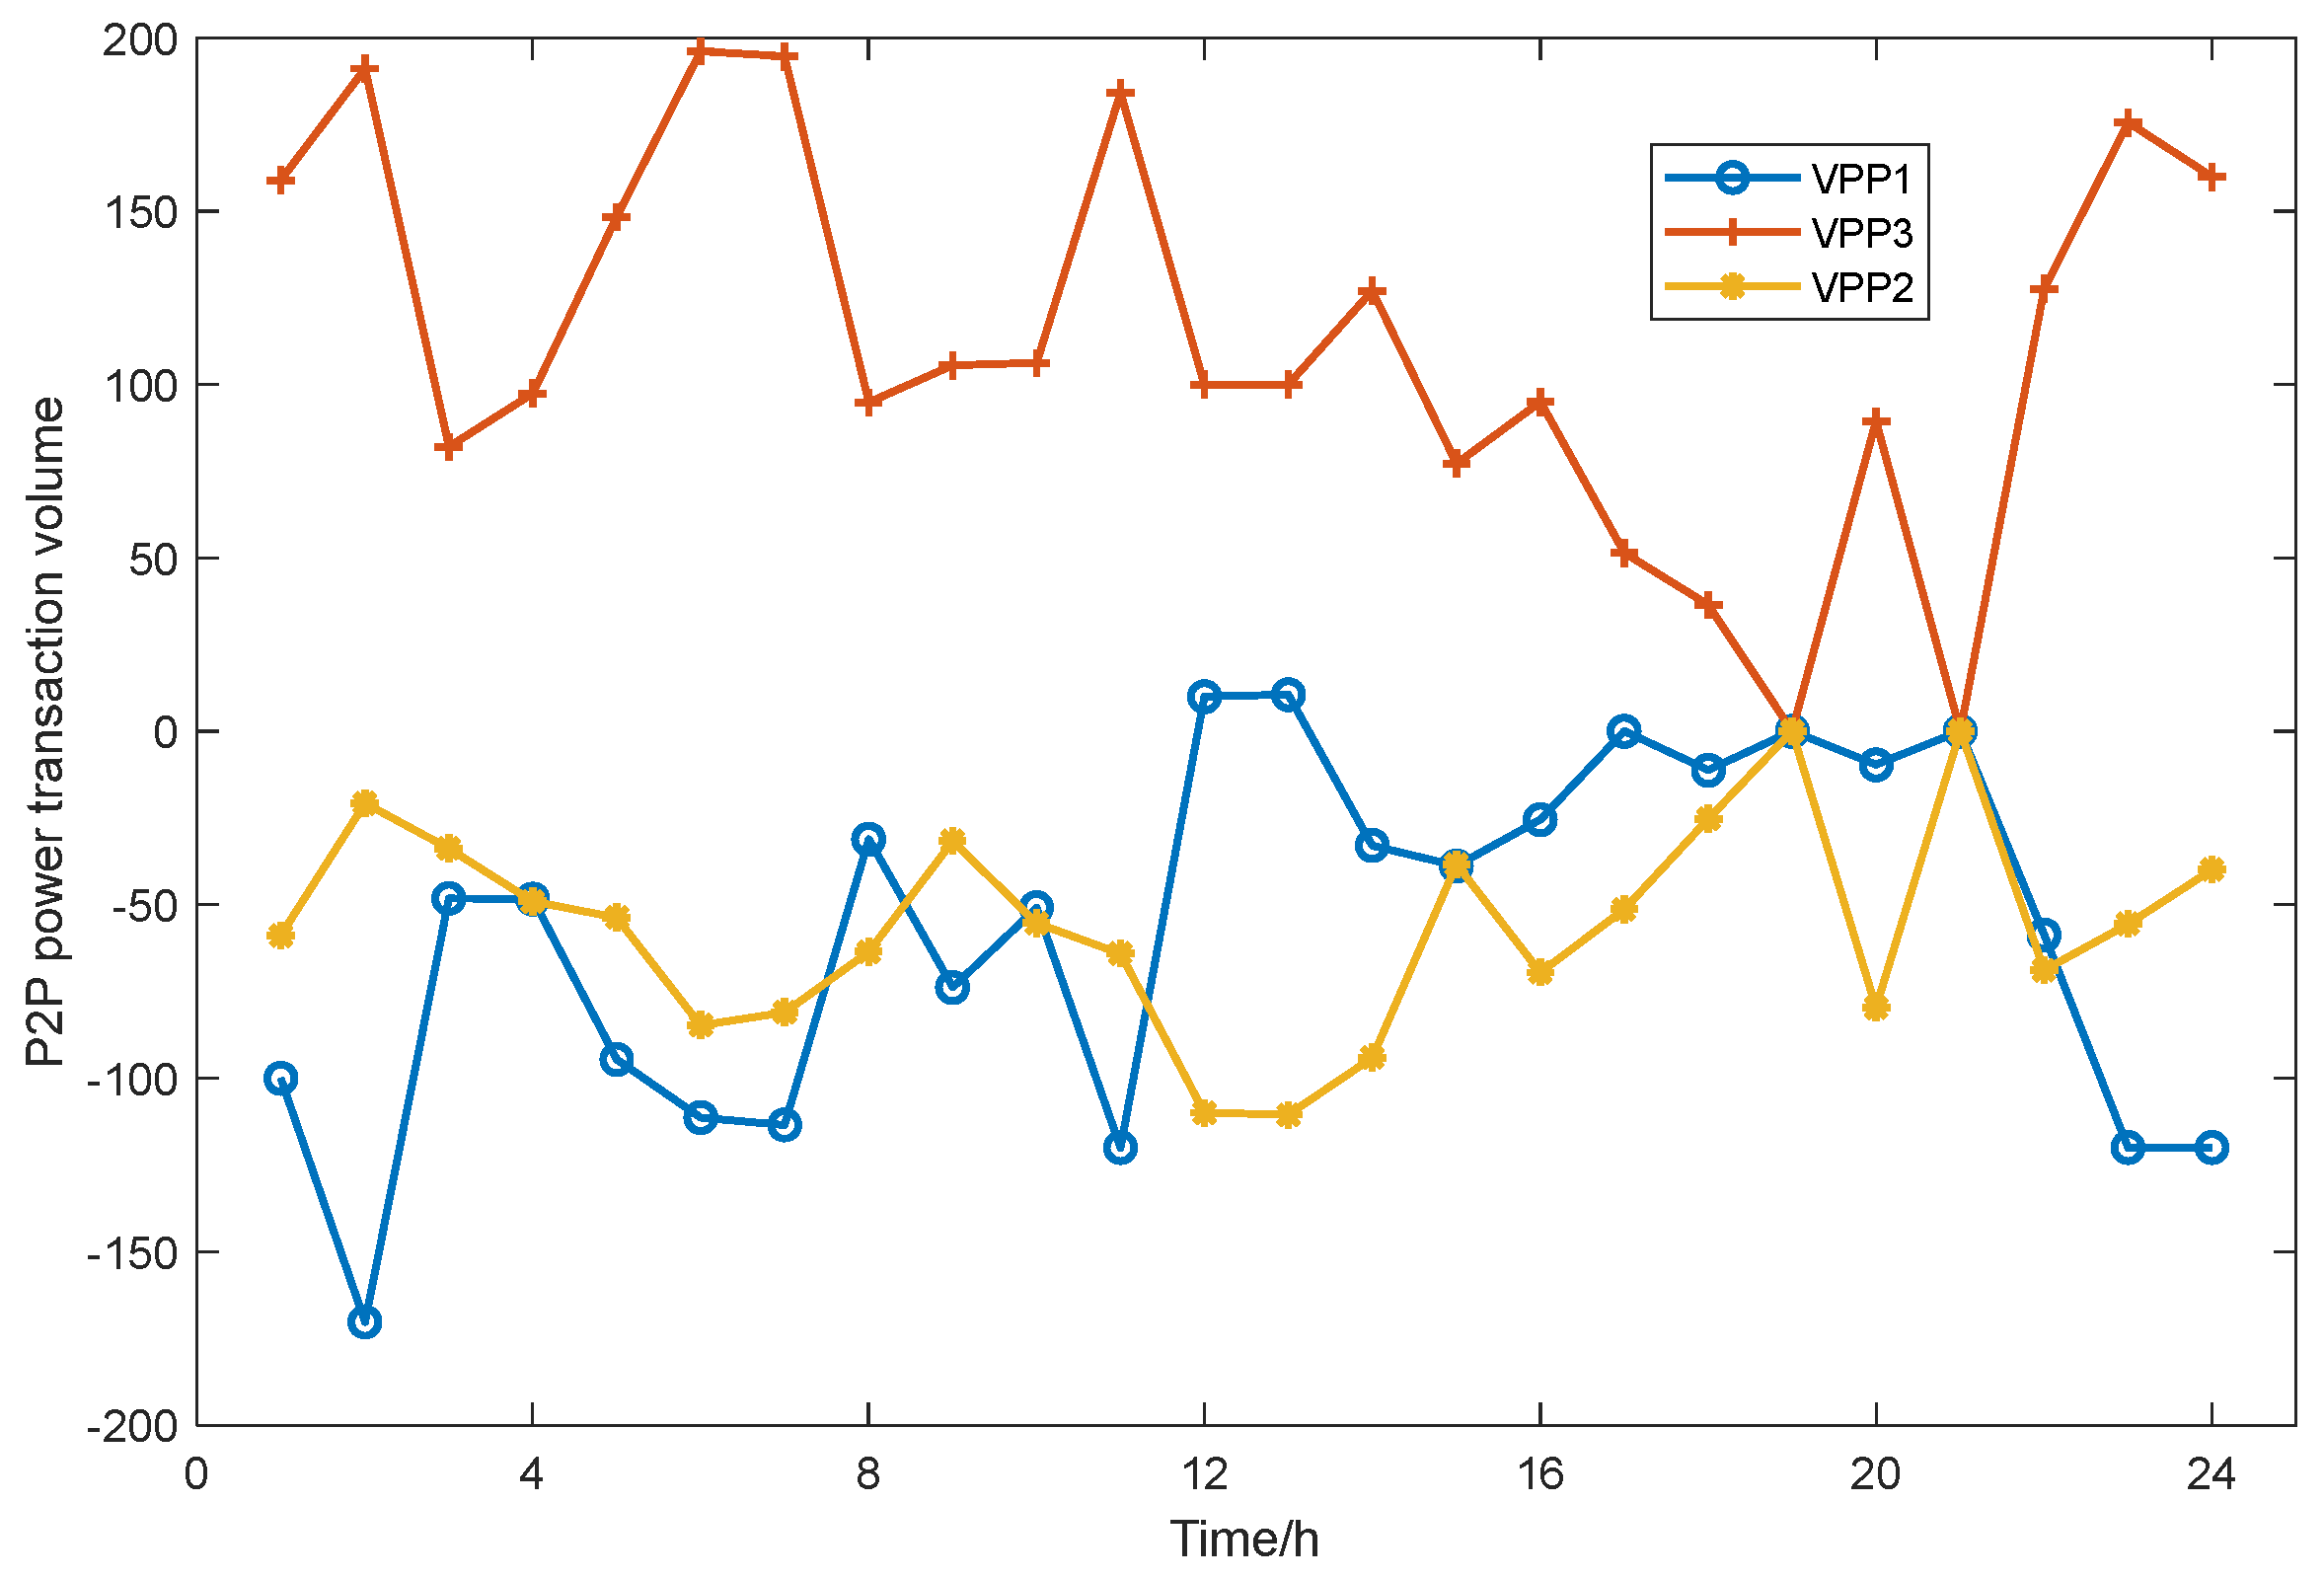
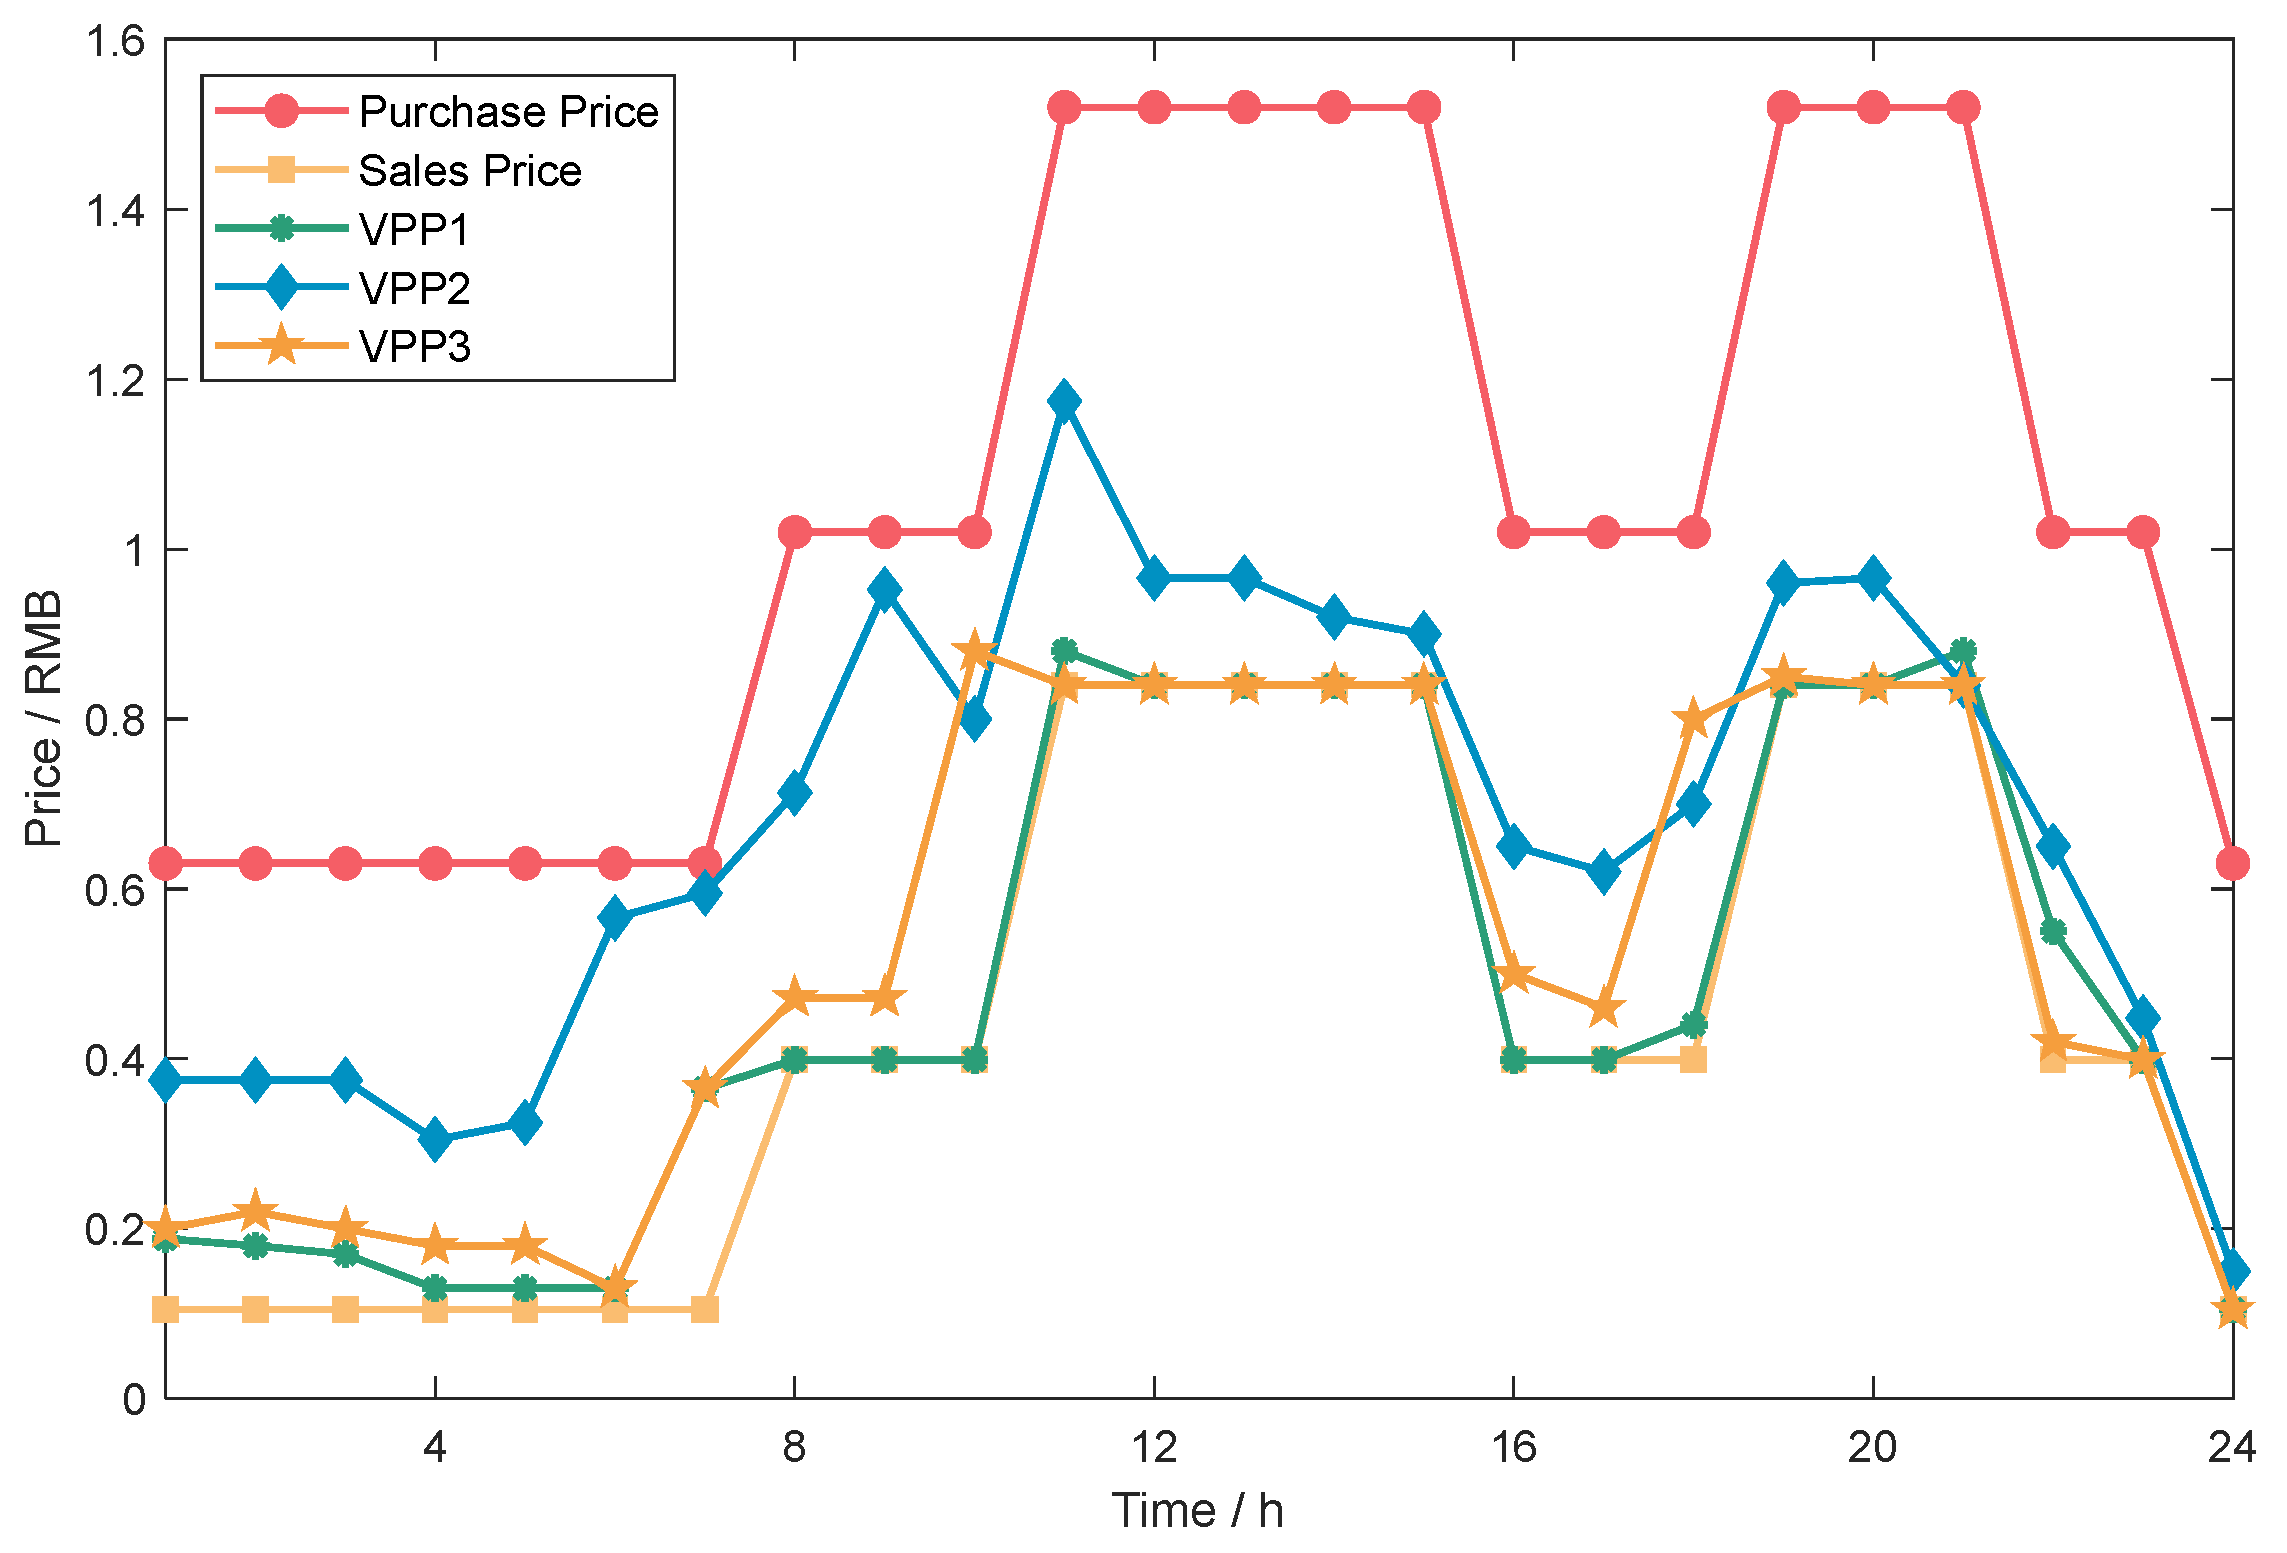
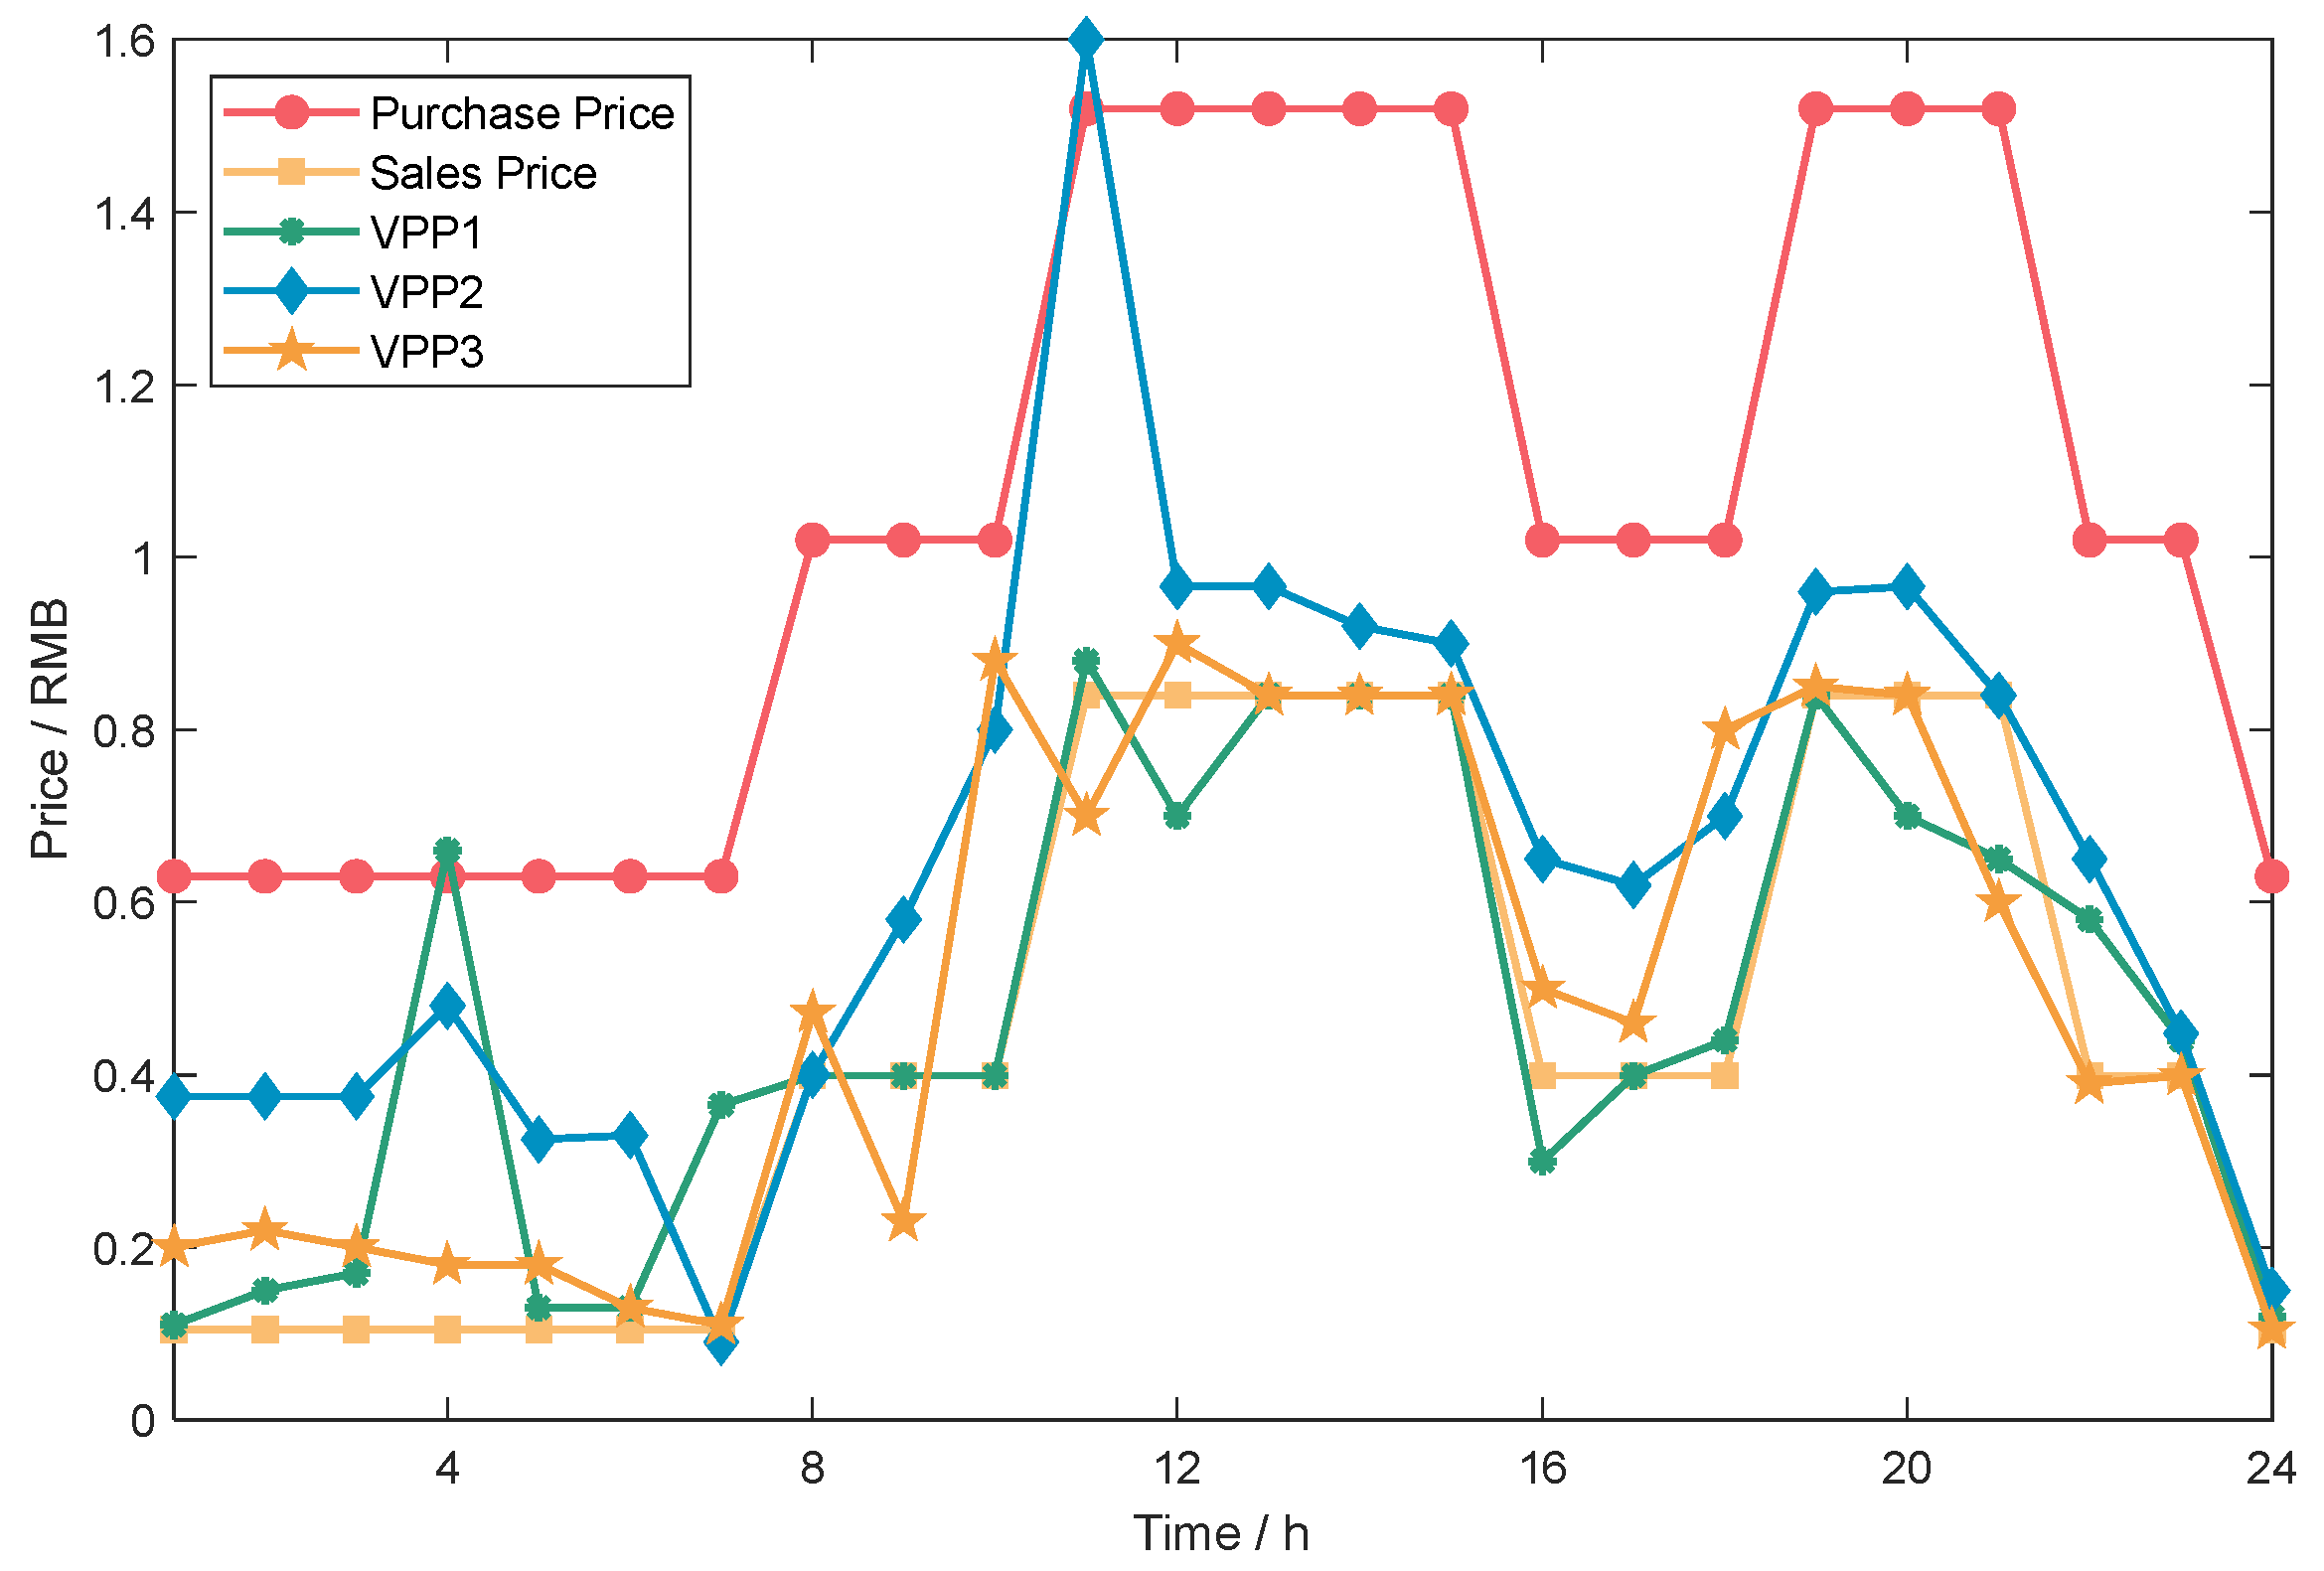
5.2.2. Power Interaction Situation
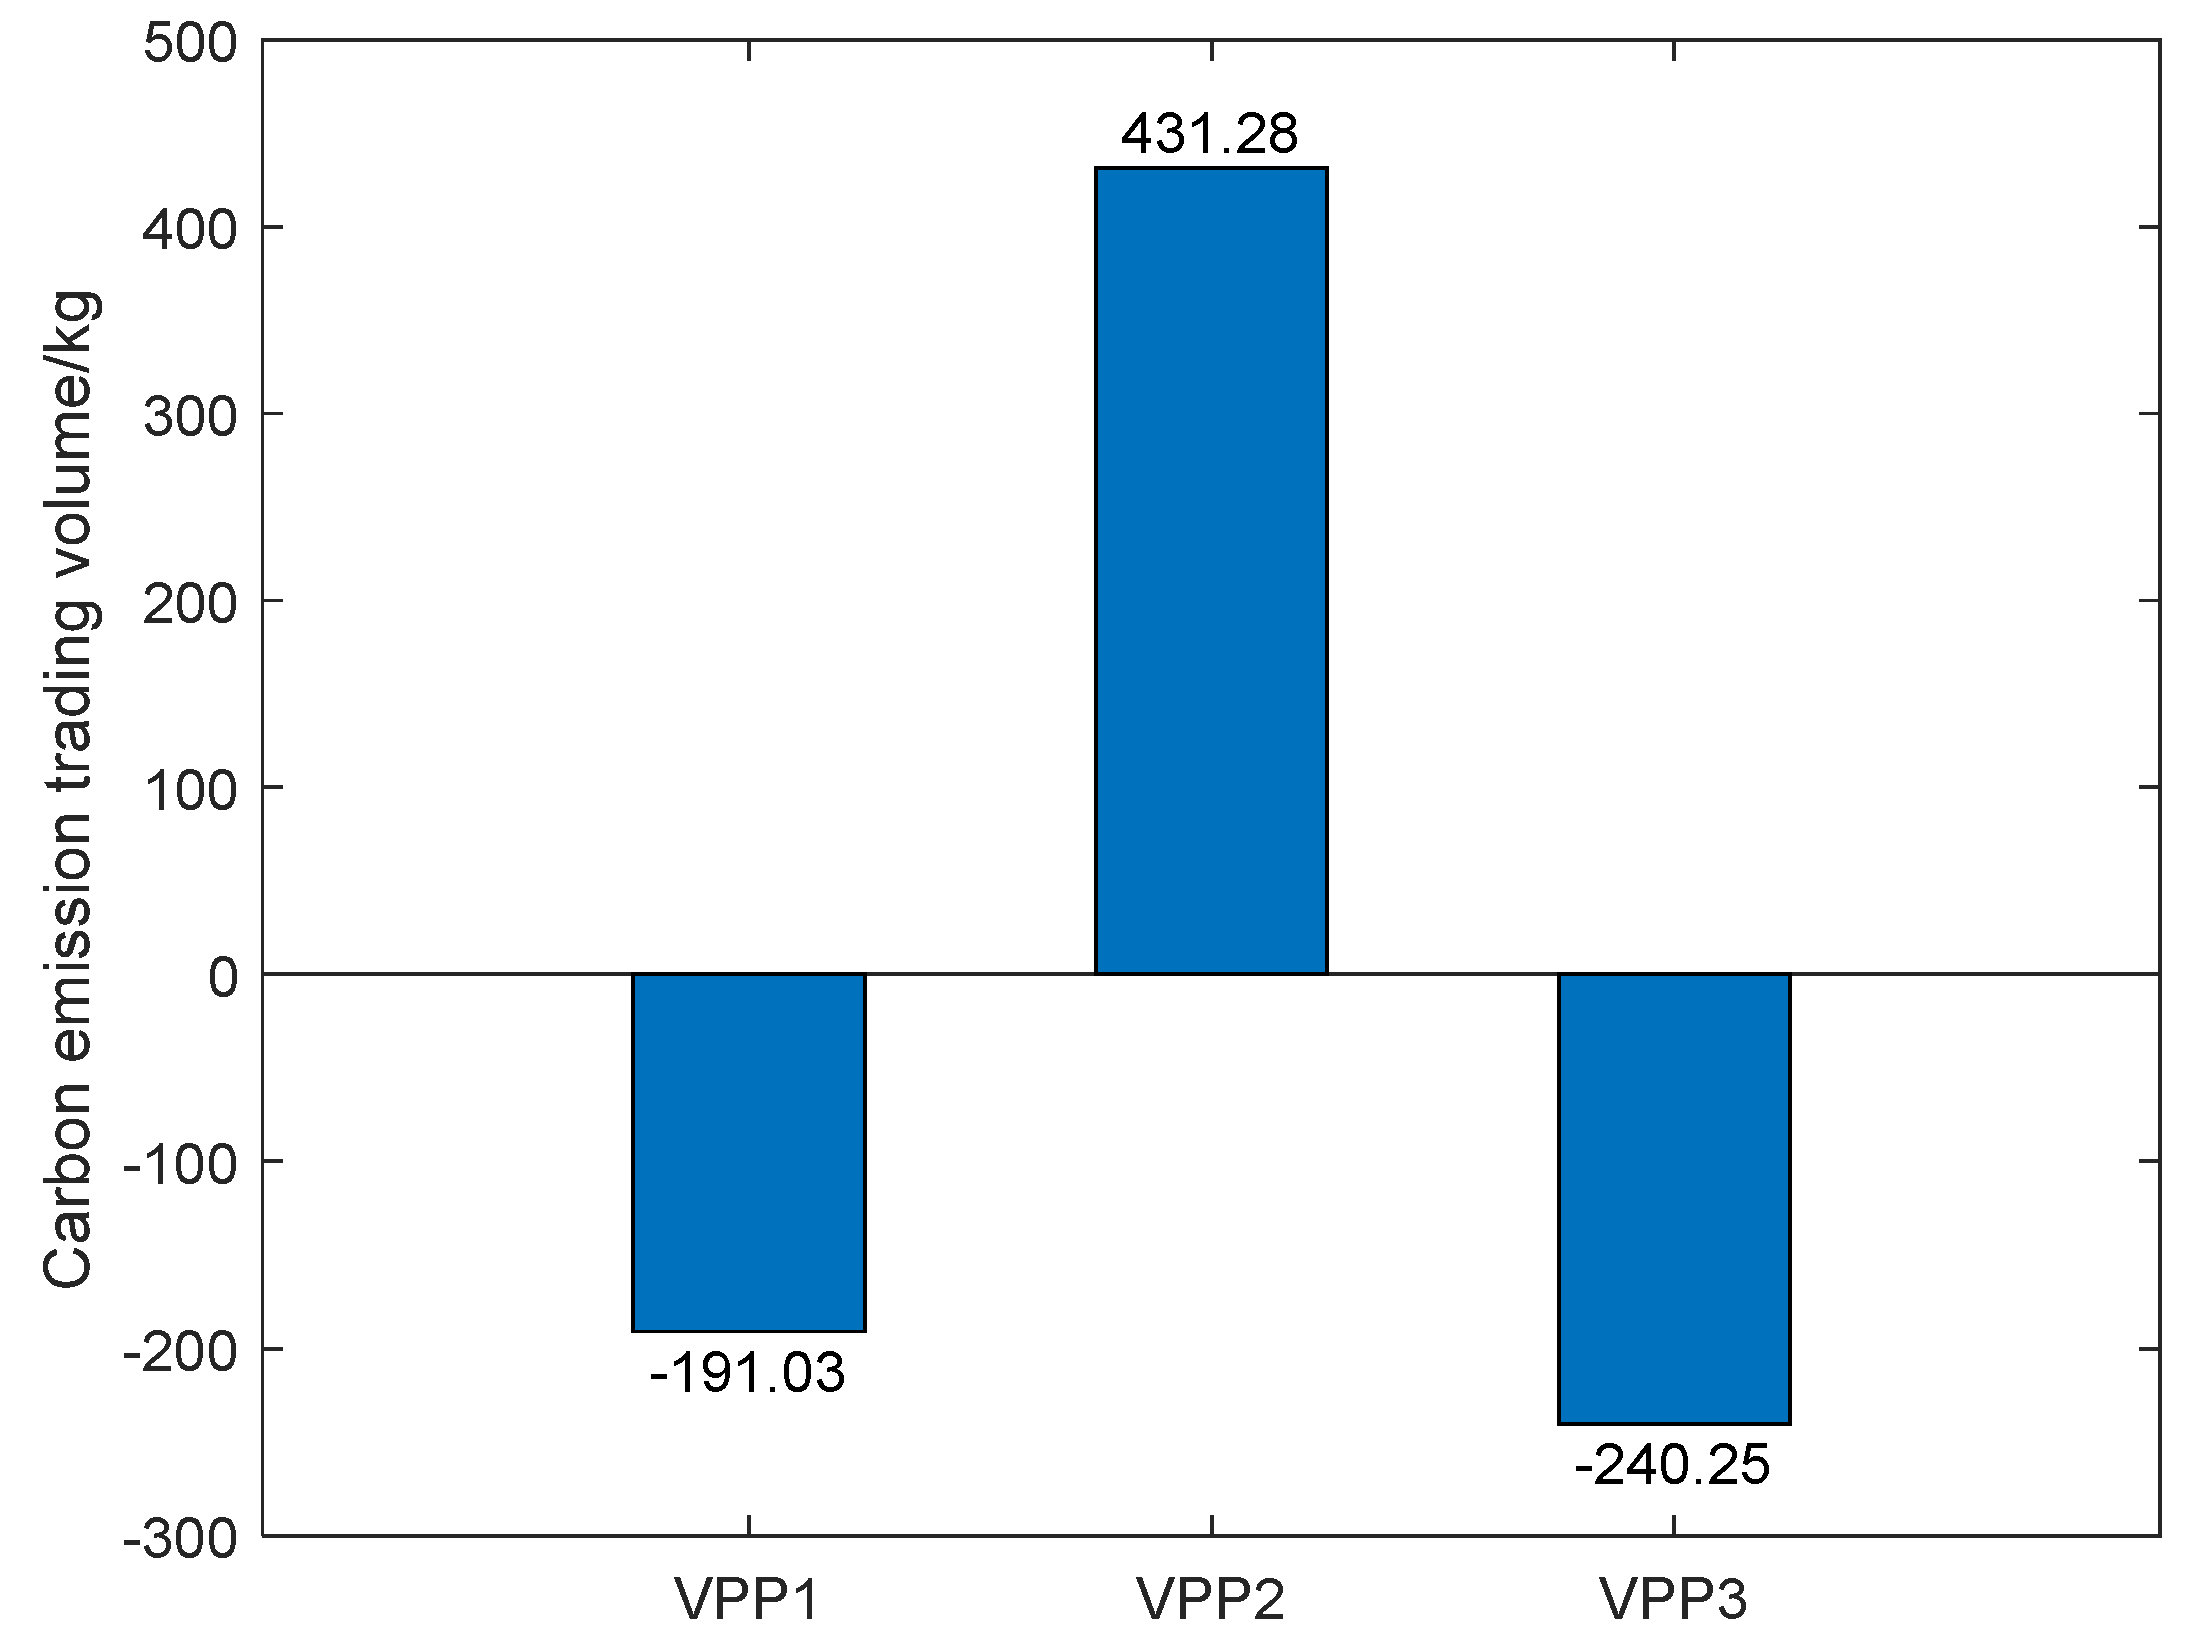
5.2.3. Interaction Situation of Carbon Emission Allowances
5.2.4. Economic Analysis of VPPC
5.2.5. Analysis of the Low Carbon Nature of the VPPC
5.2.6. Performance Comparison: Original vs. Improved ADMM
6. Conclusions
Author Contributions
Funding
Data Availability Statement
Conflicts of Interest
Abbreviations
| VPPC | Virtual Power Plant Cluster |
| VPP | Virtual Power Plant |
| CCS | Carbon Capture and Storage |
| P2G | Power-to-Gas |
| ADMM | Alternating-Direction Method of Multipliers |
| CHP | Combined Heat and Power |
| WT | Wind Turbine |
| PV | Photovoltaic |
| EES | Electrical Energy Storage |
| TES | Thermal Energy Storage |
| GT | Gas Turbine |
| WHB | Waste Heat Boiler |
| GB | Gas Boiler |
| CVaR | Conditional Value at Risk |
References
- Schipfer, F.; Mäki, E.; Schmieder, U.; Lange, N.; Schildhauer, T.; Hennig, C.; Thrän, D. Status of and Expectations for Flexible Bioenergy to Support Resource Efficiency and to Accelerate the Energy Transition. Renew. Sustain. Energy Rev. 2022, 158, 112094. [Google Scholar] [CrossRef]
- Ju, L.; Lv, S.; Li, Y.; Li, Y.; Qi, X.; Li, G.; Zhang, F. Two-Stage Scheduling Optimization Model and Benefit Allocation Strategy for Virtual Power Plant Clusters Aggregated by Multidimensional Information Indicators. Renew. Energy 2025, 240, 122245. [Google Scholar] [CrossRef]
- Rouzbahani, H.M.; Karimipour, H.; Lei, L. A Review on Virtual Power Plant for Energy Management. Sustain. Energy Technol. Assess. 2021, 47, 101370. [Google Scholar] [CrossRef]
- Guo, B.; Li, F.; Yang, J.; Yang, W.; Sun, B. The Application Effect of the Optimized Scheduling Model of Virtual Power Plant Participation in the New Electric Power System. Heliyon 2024, 10, e31748. [Google Scholar] [CrossRef]
- Dong, Z.; Zhang, Z.; Huang, M.; Yang, S.; Zhu, J.; Zhang, M.; Chen, D. Research on Day-Ahead Optimal Dispatching of Virtual Power Plants Considering the Coordinated Operation of Diverse Flexible Loads and New Energy. Energy 2024, 297, 131235. [Google Scholar] [CrossRef]
- Wang, Y.; Huang, W.; Chen, H.; Yu, Z.; Hu, L.; Huang, Y. Optimal Scheduling Strategy for Virtual Power Plants with Aggregated User-Side Distributed Energy Storage and Photovoltaics Based on CVaR-Distributionally Robust Optimization. J. Energy Storage 2024, 86, 110770. [Google Scholar] [CrossRef]
- Lin, X.; Lin, X.; Zhong, W.; Zhou, Y. Predictive Operation Optimization of Multi-Energy Virtual Power Plant Considering Behavior Uncertainty of Diverse Stakeholders. Energy 2023, 280, 128130. [Google Scholar] [CrossRef]
- Sun, L.; Li, H.; Jia, Q.; Zhang, G. Optimization Method of Dynamic Reconfiguration in Virtual Power Plants. Renew. Energy 2024, 228, 120667. [Google Scholar] [CrossRef]
- Ju, L.; Lv, S.; Zhang, Z.; Li, G.; Gan, W.; Fang, J. Data-Driven Two-Stage Robust Optimization Dispatching Model and Benefit Allocation Strategy for a Novel Virtual Power Plant Considering Carbon-Green Certificate Equivalence Conversion Mechanism. Appl. Energy 2024, 362, 122974. [Google Scholar] [CrossRef]
- Ning, L.; Liang, K.; Zhang, B.; Li, G. A Two-Layer Optimal Scheduling Method for Multi-Energy Virtual Power Plant with Source-Load Synergy. Energy Rep. 2023, 10, 4751–4760. [Google Scholar] [CrossRef]
- Yan, X.; Gao, C.; Song, M.; Rizwan, M. AUGMECON2-Based Multi-Objective Optimization of Virtual Power Plant Considering Economical and Security Operation of the Distribution Networks. Sustain. Energy Grids Netw. 2024, 38, 101388. [Google Scholar] [CrossRef]
- Yan, X.; Gao, C.; Jiang, H.; Francois, B. Multi-Objective Optimization and Profit Allocation of Virtual Power Plant Considering the Security Operation of Distribution Networks. J. Energy Storage 2024, 89, 111607. [Google Scholar] [CrossRef]
- Liu, X.; Li, M.; Wang, R.; Feng, J.; Dong, C.; Sun, Q. Low-Carbon Operation of Multi-Virtual Power Plants with Hydrogen Doping and Load Aggregator Based on Bilateral Cooperative Game. Energy 2024, 309, 132984. [Google Scholar] [CrossRef]
- Wen, J.; Jia, R.; Cao, G.; Guo, Y.; Jiao, Y.; Li, W.; Li, P. Multi-Source Shared Operation Optimization Strategy for Multi-Virtual Power Plants Based on Distributionally Robust Chance Constraint. Energy 2025, 322, 135761. [Google Scholar] [CrossRef]
- Hou, H.Y.; Ge, X.L.; Cao, X.D. Cooperative Game Optimization Method for Multi-Virtual Power Plant Alliance Considering Carbon Trading. J. Electr. Power Syst. Autom. 2023, 35, 77–85. [Google Scholar]
- Liu, X. Bi-Layer Game Method for Scheduling of Virtual Power Plant with Multiple Regional Integrated Energy Systems. Int. J. Electr. Power Energy Syst. 2023, 149, 109063. [Google Scholar] [CrossRef]
- Cheng, X.T.; Wang, J.H.; Jin, Y.L.; Li, R.; Bao, Y.; Deng, H. Cooperative Game Strategy for Multi-Virtual Power Plants Considering Distribution Network Operation Constraints. South Power Syst. Technol. 2023, 17, 119–131. [Google Scholar]
- Ge, X.L.; Cao, X.D.; Li, Y.L. Optimization Operation Method for Multi-Virtual Power Plants Considering Risk and Carbon Flow. J. Electr. Power Syst. Autom. 2023, 35, 126–135. [Google Scholar]
- Chen, F.; Deng, H.; Chen, Y.; Wang, J.; Jiang, C.; Shao, Z. Distributed Robust Cooperative Scheduling of Multi-Region Integrated Energy System Considering Dynamic Characteristics of Networks. Int. J. Electr. Power Energy Syst. 2023, 145, 108605. [Google Scholar] [CrossRef]
- Pan, J.; Liu, X.; Huang, J. Multi-Level Games Optimal Scheduling Strategy of Multiple Virtual Power Plants Considering Carbon Emission Flow and Carbon Trade. Electr. Power Syst. Res. 2023, 223, 109669. [Google Scholar] [CrossRef]
- Sun, Y.; Liu, X.; Wang, R.; Dong, C.; Sun, Q. Distributed Optimal Scheduling of VPP Based on EST: An ADMM Algorithm Based on Historical Data Online Transfer. Appl. Energy 2023, 347, 121416. [Google Scholar] [CrossRef]
- Esfahani, M.; Alizadeh, A.; Amjady, N.; Kamwa, I. A Distributed VPP-Integrated Co-Optimization Framework for Energy Scheduling, Frequency Regulation, and Voltage Support Using Data-Driven Distributionally Robust Optimization with Wasserstein Metric. Appl. Energy 2024, 361, 122883. [Google Scholar] [CrossRef]
- Jiang, A.; Yuan, H.; Li, D. Energy Management for a Community-Level Integrated Energy System with Photovoltaic Prosumers Based on Bargaining Theory. Energy 2021, 225, 120272. [Google Scholar] [CrossRef]
- Zhang, Z.H.; Xiong, X.Y.; Wan, C. Cooperative Operation Optimization Strategy for Multi-Microgrid Considering Electricity-Carbon Trading and Comprehensive Contribution Rate. Power Syst. Technol. 2024, 48, 3258–3268. [Google Scholar]
- Li, X.; Li, C.; Liu, X.; Chen, G.; Dong, Z.Y. Two-Stage Community Energy Trading Under End-Edge-Cloud Orchestration. IEEE Internet Things J. 2022, 10, 1961–1972. [Google Scholar] [CrossRef]


| VPP | WT | PV | GT | Electric Load/Electricity Demand Response | Heat Load/Thermal Demand Response | Waste Heat Recovery Device | Combined System of P2G and CCS | GB | EB | Energy Storage |
|---|---|---|---|---|---|---|---|---|---|---|
| VPP1 | × | √ | √ | √ | × | × | √ | × | × | EES |
| VPP2 | √ | √ | × | √ | √ | × | × | × | √ | EES |
| VPP3 | √ | √ | √ | √ | √ | √ | × | √ | √ | EES, TES |
| Equipment | Carbon Quota (kg/kWh) | Carbon Emission Intensity (kg/kWh) | |
|---|---|---|---|
| CHP | GT | 0.424 | 0.7 power/0.4 heat |
| WHB | |||
| ORC | |||
| GB | 0.21 | 0.29 | |
| EB | / | / | |
| Power purchase from the power grid | 0.78 | 0.85 | |
| WT | 0.078 | / | |
| PV | / | ||
| Equipment | Parameters | Value | ||
|---|---|---|---|---|
| VPP1 | VPP2 | VPP3 | ||
| GT | 0.35 | / | 0.35 | |
| 0/170 kW | / | 0/200 kW | ||
| GB | 0.9 | / | / | |
| 0/100 kW | / | / | ||
| EB | 0.9 | 0.92 | 0.9 | |
| 0/200 kW | 0/180 kW | 0/200 kW | ||
| EES | 0.85/0.9 | 0.9/0.96 | 0.85/0.9 | |
| 60 kW | 100 kW | 80 kW | ||
| TES | / | 0.9/0.95 | 0.9/0.95 | |
| / | 60 kW | 100 kW | ||
| CCS | 0.65 | 0.65 | ||
| / | 0/50 kW | 0/50 kW | ||
| P2G | / | 0.7 | / | |
| / | 0/300 kW | / | ||
| Carbon Trading Volume, /kg | Carbon Trading Price/(yuan/kg) | |
|---|---|---|
| VPP1–VPP2 | −191.2 | 0.352 |
| VPP1–VPP3 | 32.75 | 0.298 |
| VPP2–VPP3 | 203.68 | 0.347 |
| VPP | Independent Operation Cost | Cluster Operation Cost | |
|---|---|---|---|
| Total Cost (Including P2P) | P2P Cost | ||
| VPP1 | 1732.5 | 1683.23 | 440 |
| VPP2 | −1206.55 | −1454 | −802 |
| VPP3 | 2298.4 | 2243.95 | 474 |
| VPP | Carbon Emission/kg | The Proportion of New Energy Consumption | ||
|---|---|---|---|---|
| Independent Operation | Cluster Operation | Independent Operation | Cluster Operation | |
| VPP1 | 457.57 | 478.04 | 70.92% | 87.75% |
| VPP2 | −759.68 | −803.74 | ||
| VPP3 | 500.3 | 527.65 | ||
| Iteration Count (Iterations) | Total Solve Time (s) | ||
|---|---|---|---|
| Subproblem 1 | Subproblem 2 | ||
| Original ADMM | 45 | 27 | 202.37 |
| Improved ADMM | 28 | 15 | 168.72 |
Disclaimer/Publisher’s Note: The statements, opinions and data contained in all publications are solely those of the individual author(s) and contributor(s) and not of MDPI and/or the editor(s). MDPI and/or the editor(s) disclaim responsibility for any injury to people or property resulting from any ideas, methods, instructions or products referred to in the content. |
© 2025 by the authors. Licensee MDPI, Basel, Switzerland. This article is an open access article distributed under the terms and conditions of the Creative Commons Attribution (CC BY) license (https://creativecommons.org/licenses/by/4.0/).
Share and Cite
Pan, T.; Zhao, Q.; Zhao, J.; Wang, L. Research on the Low-Carbon Economic Operation Optimization of Virtual Power Plant Clusters Considering the Interaction Between Electricity and Carbon. Processes 2025, 13, 1943. https://doi.org/10.3390/pr13061943
Pan T, Zhao Q, Zhao J, Wang L. Research on the Low-Carbon Economic Operation Optimization of Virtual Power Plant Clusters Considering the Interaction Between Electricity and Carbon. Processes. 2025; 13(6):1943. https://doi.org/10.3390/pr13061943
Chicago/Turabian StylePan, Ting, Qiao Zhao, Jiangyan Zhao, and Liying Wang. 2025. "Research on the Low-Carbon Economic Operation Optimization of Virtual Power Plant Clusters Considering the Interaction Between Electricity and Carbon" Processes 13, no. 6: 1943. https://doi.org/10.3390/pr13061943
APA StylePan, T., Zhao, Q., Zhao, J., & Wang, L. (2025). Research on the Low-Carbon Economic Operation Optimization of Virtual Power Plant Clusters Considering the Interaction Between Electricity and Carbon. Processes, 13(6), 1943. https://doi.org/10.3390/pr13061943