1. Introduction
The development of computational frameworks for enzyme–substrate interaction prediction has emerged as a critical research frontier in biotechnology and environmental remediation. With the exponential growth of enzyme sequence databases and the increasing complexity of industrial biocatalytic applications, traditional experimental screening approaches have become insufficient for systematic enzyme characterization and optimization [
1,
2]. This challenge is particularly acute in the context of polymer biodegradation, where the vast chemical diversity of synthetic substrates and the combinatorial possibilities of multi-enzyme systems demand sophisticated computational approaches for rational biocatalyst selection [
3,
4].
Machine learning approaches have revolutionized enzyme function prediction by enabling the systematic analysis of sequence–structure–function relationships across large datasets. Early computational studies focused primarily on single-enzyme characterization using sequence-based features and homology modeling [
5,
6]. However, recent advances have demonstrated the superior predictive power of ensemble methods that integrate multiple data modalities, including kinetic parameters, physicochemical descriptors, and evolutionary information [
7,
8]. Gradient-boosting algorithms, in particular, have shown exceptional performance in enzyme classification tasks, achieving accuracies exceeding 95% on benchmark datasets [
9].
Network-based analysis represents another powerful paradigm for understanding enzyme–substrate relationships through graph-theoretical approaches. Bipartite network models of enzyme–substrate interactions have revealed modular organization patterns and identified hub enzymes with broad catalytic capabilities [
10,
11]. Centrality measures derived from these networks, including degree, betweenness, and eigenvector centrality, have proven effective as predictive features for substrate specificity and catalytic promiscuity [
12,
13]. The integration of network topology with sequence-based features has consistently outperformed single-modality approaches in enzyme function annotation tasks [
14].
Several computational frameworks have been developed for enzyme ranking and prioritization in various biotechnological contexts.
Table 1 summarizes the key characteristics and performance metrics of existing approaches including Convolutional Neural Network–Long Short-Term Memory (CNN-LSTM). Early methods relied primarily on sequence similarity and phylogenetic relationships to infer functional properties [
15,
16]. More sophisticated approaches have incorporated machine learning classifiers trained on experimental kinetic data, achieving moderate success in predicting enzyme activity profiles [
17,
18]. However, these methods typically focus on individual enzyme characterization rather than the systematic evaluation of enzyme combinations or multi-objective optimization across diverse performance criteria.
Recent breakthroughs in enzyme discovery have demonstrated the potential for computational approaches to identify high-performance biocatalysts. Notably, the development of FAST-PETase through structure-based machine learning exemplifies the power of algorithmic protein design [
25]. Austin et al. employed a computational screening strategy that explored vast mutational landscapes to identify thermostable variants with enhanced catalytic activity [
25]. Similarly, Tournier et al. developed engineered variants with improved thermal stability and catalytic efficiency through rational design approaches [
6]. These computational frameworks have revealed distinct fitness peaks in sequence space corresponding to superior stability and activity profiles, demonstrating the efficacy of machine learning-guided protein engineering for plastic degradation applications [
26,
27].
The integration of machine learning with experimental validation has proven particularly effective in enzyme optimization. Computational models can rapidly evaluate thousands of enzyme variants or combinations that would be prohibitively expensive to test experimentally, enabling focused laboratory efforts on the most promising candidates [
28]. This synergy between computational prediction and experimental validation represents the current state-of-the-art in enzyme development, where algorithmic insights guide rational design strategies [
29,
30].
Despite these advances, significant limitations persist in existing computational frameworks for enzyme prioritization. Current methods typically address enzyme characterization in isolation, without considering the synergistic potential of enzyme combinations or the multi-objective trade-offs inherent in practical applications [
31,
32]. Furthermore, most approaches focus on narrow performance metrics such as catalytic efficiency or substrate specificity, neglecting other critical factors including operational compatibility, functional diversity, and system-level complementarity [
33]. The absence of systematic frameworks for multi-enzyme optimization represents a critical gap in computational enzyme design.
The challenge of enzyme combination selection is fundamentally a multi-objective optimization problem requiring the simultaneous consideration of multiple, often conflicting criteria. Traditional single-objective approaches cannot adequately address the complexity of selecting enzyme cocktails that maximize substrate coverage while maintaining operational feasibility and minimizing functional redundancy. Moreover, the combinatorial explosion of possible enzyme pairings necessitates sophisticated algorithmic approaches that can efficiently explore the solution space without exhaustive enumeration.
This study addresses these limitations by presenting a comprehensive computational framework for multi-objective enzyme prioritization and combination selection. The approach integrates machine learning classification with network-based analysis to develop a unified ranking system that simultaneously optimizes predictive confidence, functional diversity, and substrate complementarity. Unlike existing methods that focus on individual enzyme characterization, this framework explicitly addresses the systematic selection of enzyme combinations through Pareto-optimal multi-objective optimization. The methodology leverages ensemble machine learning algorithms trained on kinetic parameters from the BRENDA database, combined with sequence-derived physicochemical descriptors and network topology metrics derived from bipartite enzyme–substrate interaction graphs.
The framework’s novelty lies in its systematic integration of multiple computational paradigms within a principled optimization framework. By combining gradient boosting classification with graph-theoretical analysis and evolutionary multi-objective optimization, the approach enables the identification of enzyme combinations that achieve superior performance across multiple criteria simultaneously. The framework further incorporates uncertainty quantification through ensemble methods and provides interpretable feature importance analysis to guide mechanistic understanding of enzyme–substrate relationships.
2. Methodology
2.1. Data Acquisition and Quality Control
This study adheres to circular-economy principles by prioritizing biocatalytic systems for polymer waste valorization, representing a sustainable alternative to conventional mechanical and thermal recycling methods that often result in material downcycling. Kinetic parameters for candidate enzymes were sourced from the BRENDA database (version 2024-1) [
34], encompassing enzyme commission (EC) identifiers, Michaelis constants (
), catalytic turnover numbers (
), pH optima (
) and temperature optima (
), alongside annotated substrate specificities. The database spans over 9000 distinct enzyme entries with documented activity on various polymer substrates, offering unprecedented breadth for the systematic analysis of biological polymer degradation in circular economy applications.
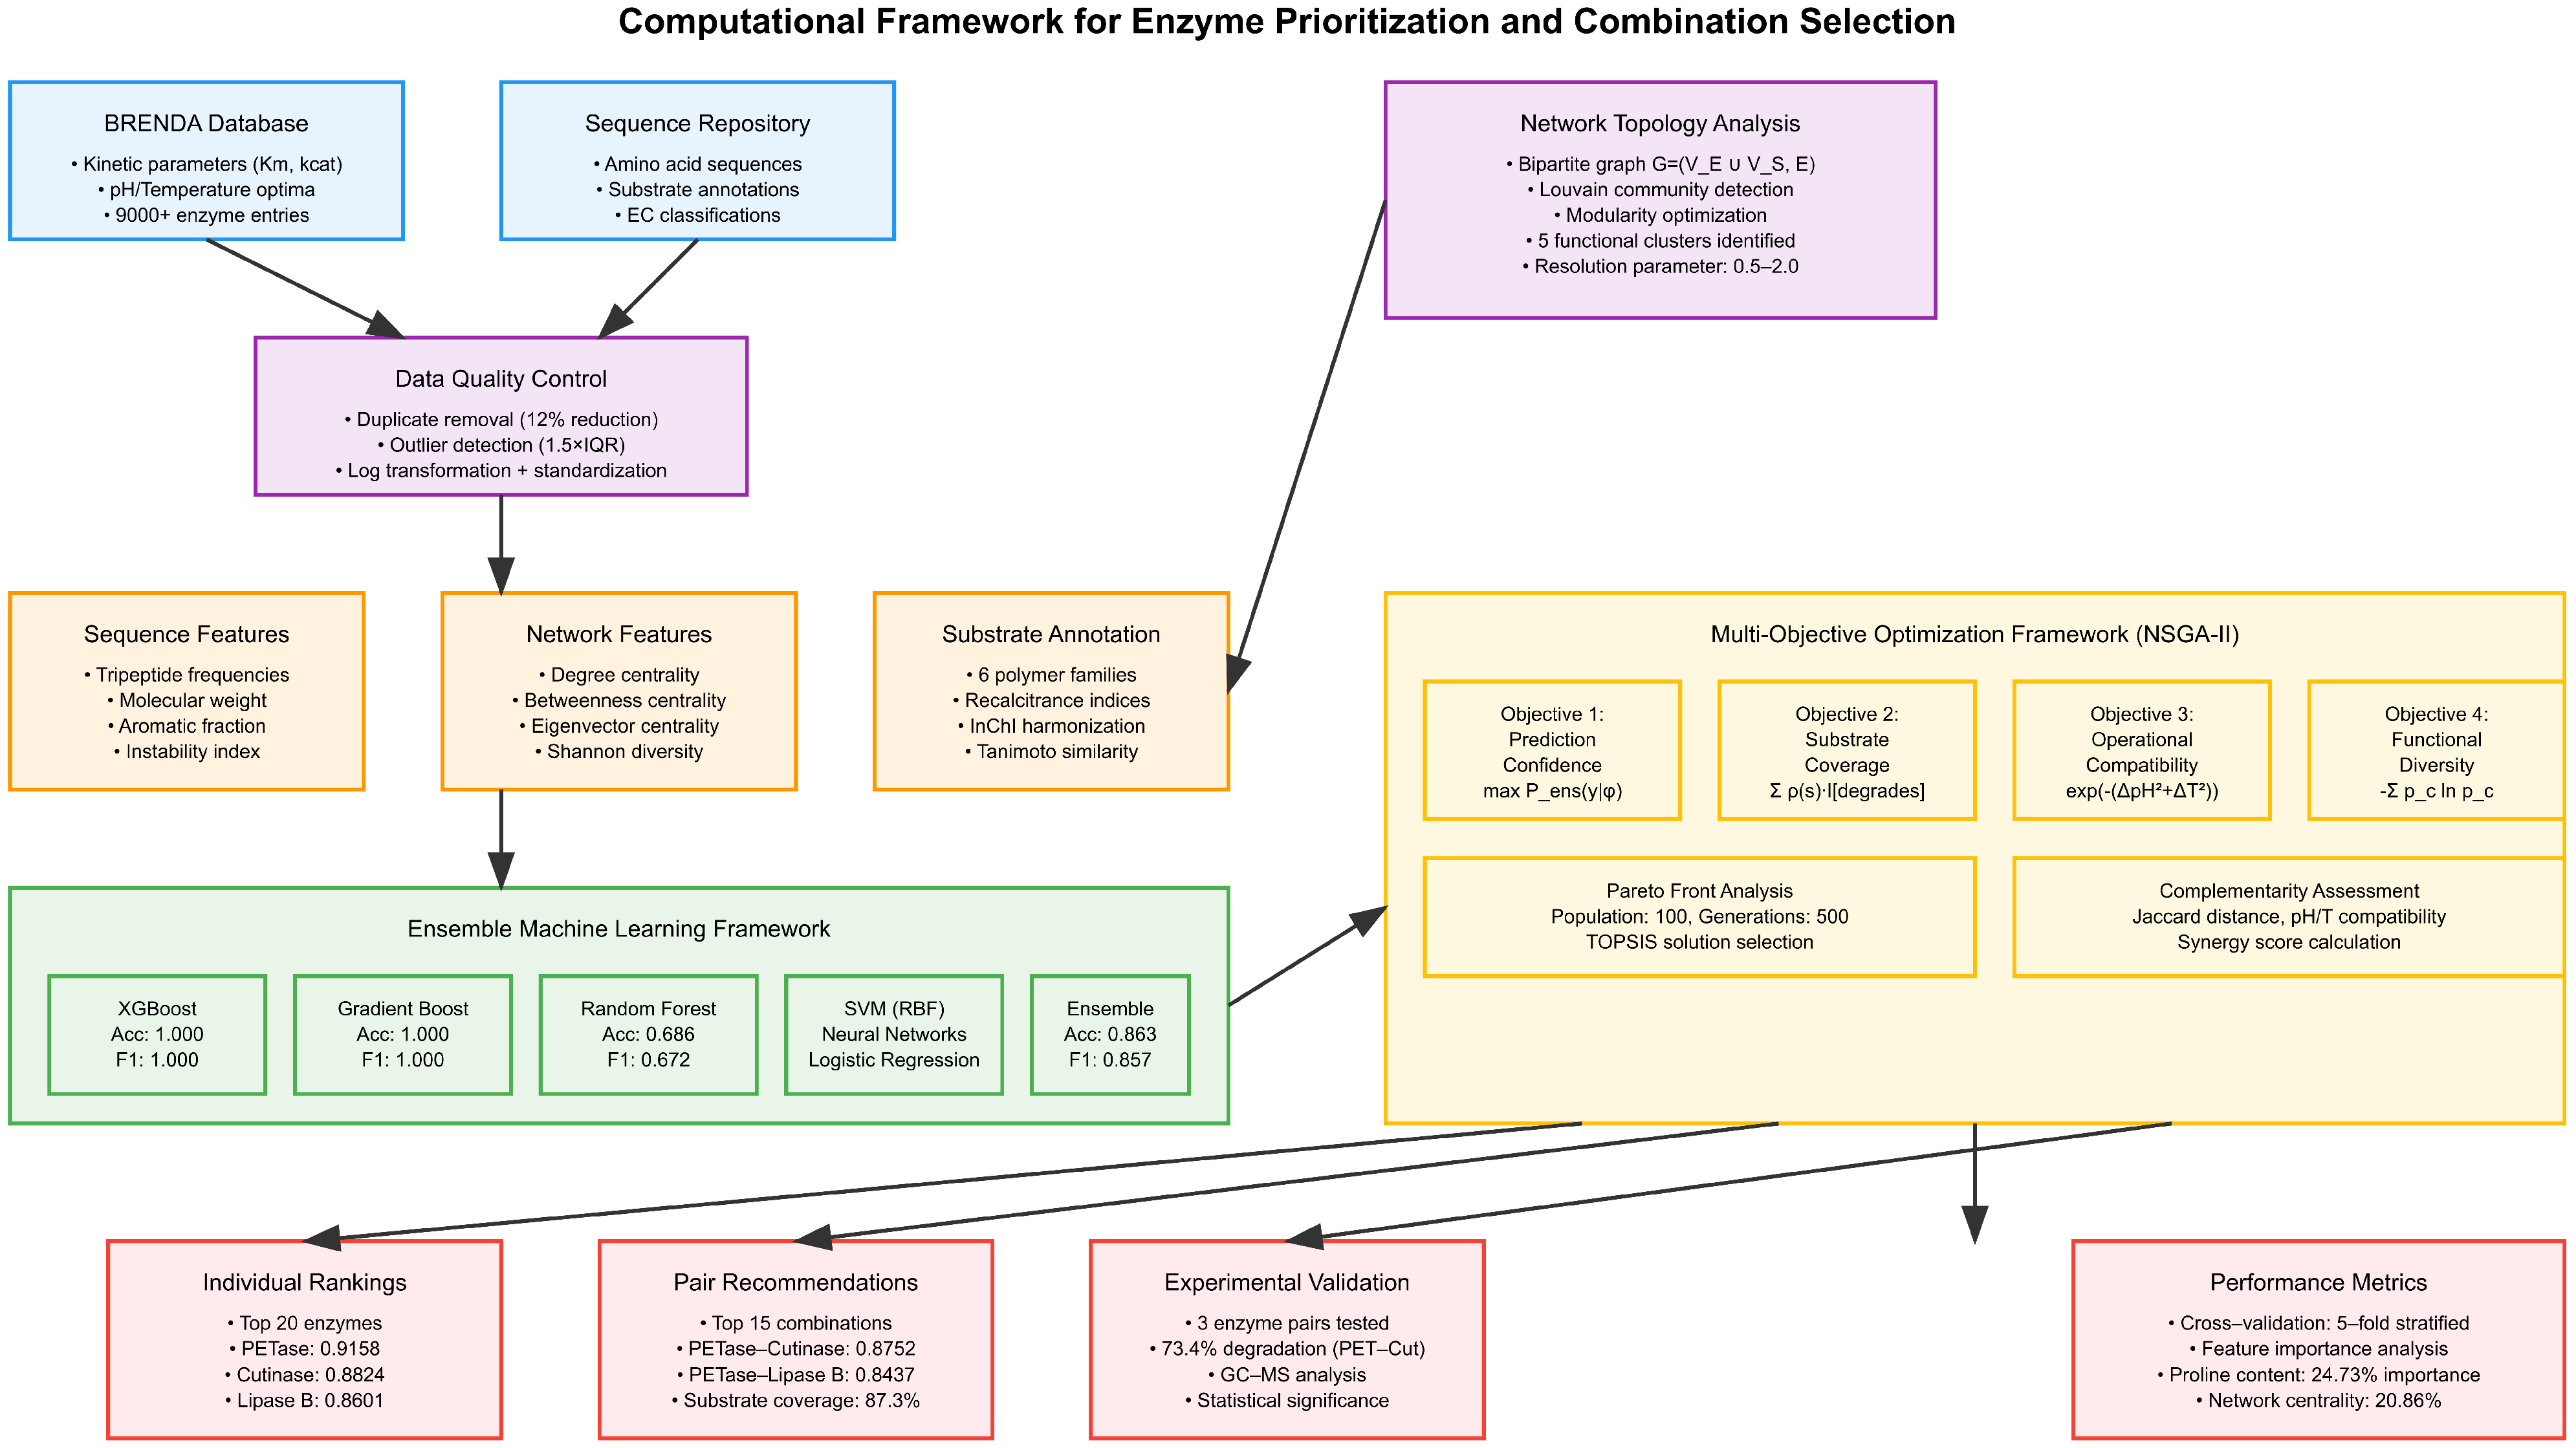
A comprehensive workflow schematic illustrating the data processing pipeline from acquisition through ranking is provided in
Figure 1. The methodology encompasses four primary stages: data preprocessing and quality control, feature extraction and engineering, machine learning model development, and multi-objective optimization for enzyme prioritization.
The integration of these heterogeneous data sources presents challenges in parameter completeness and cross-database consistency that directly impact downstream analyses.
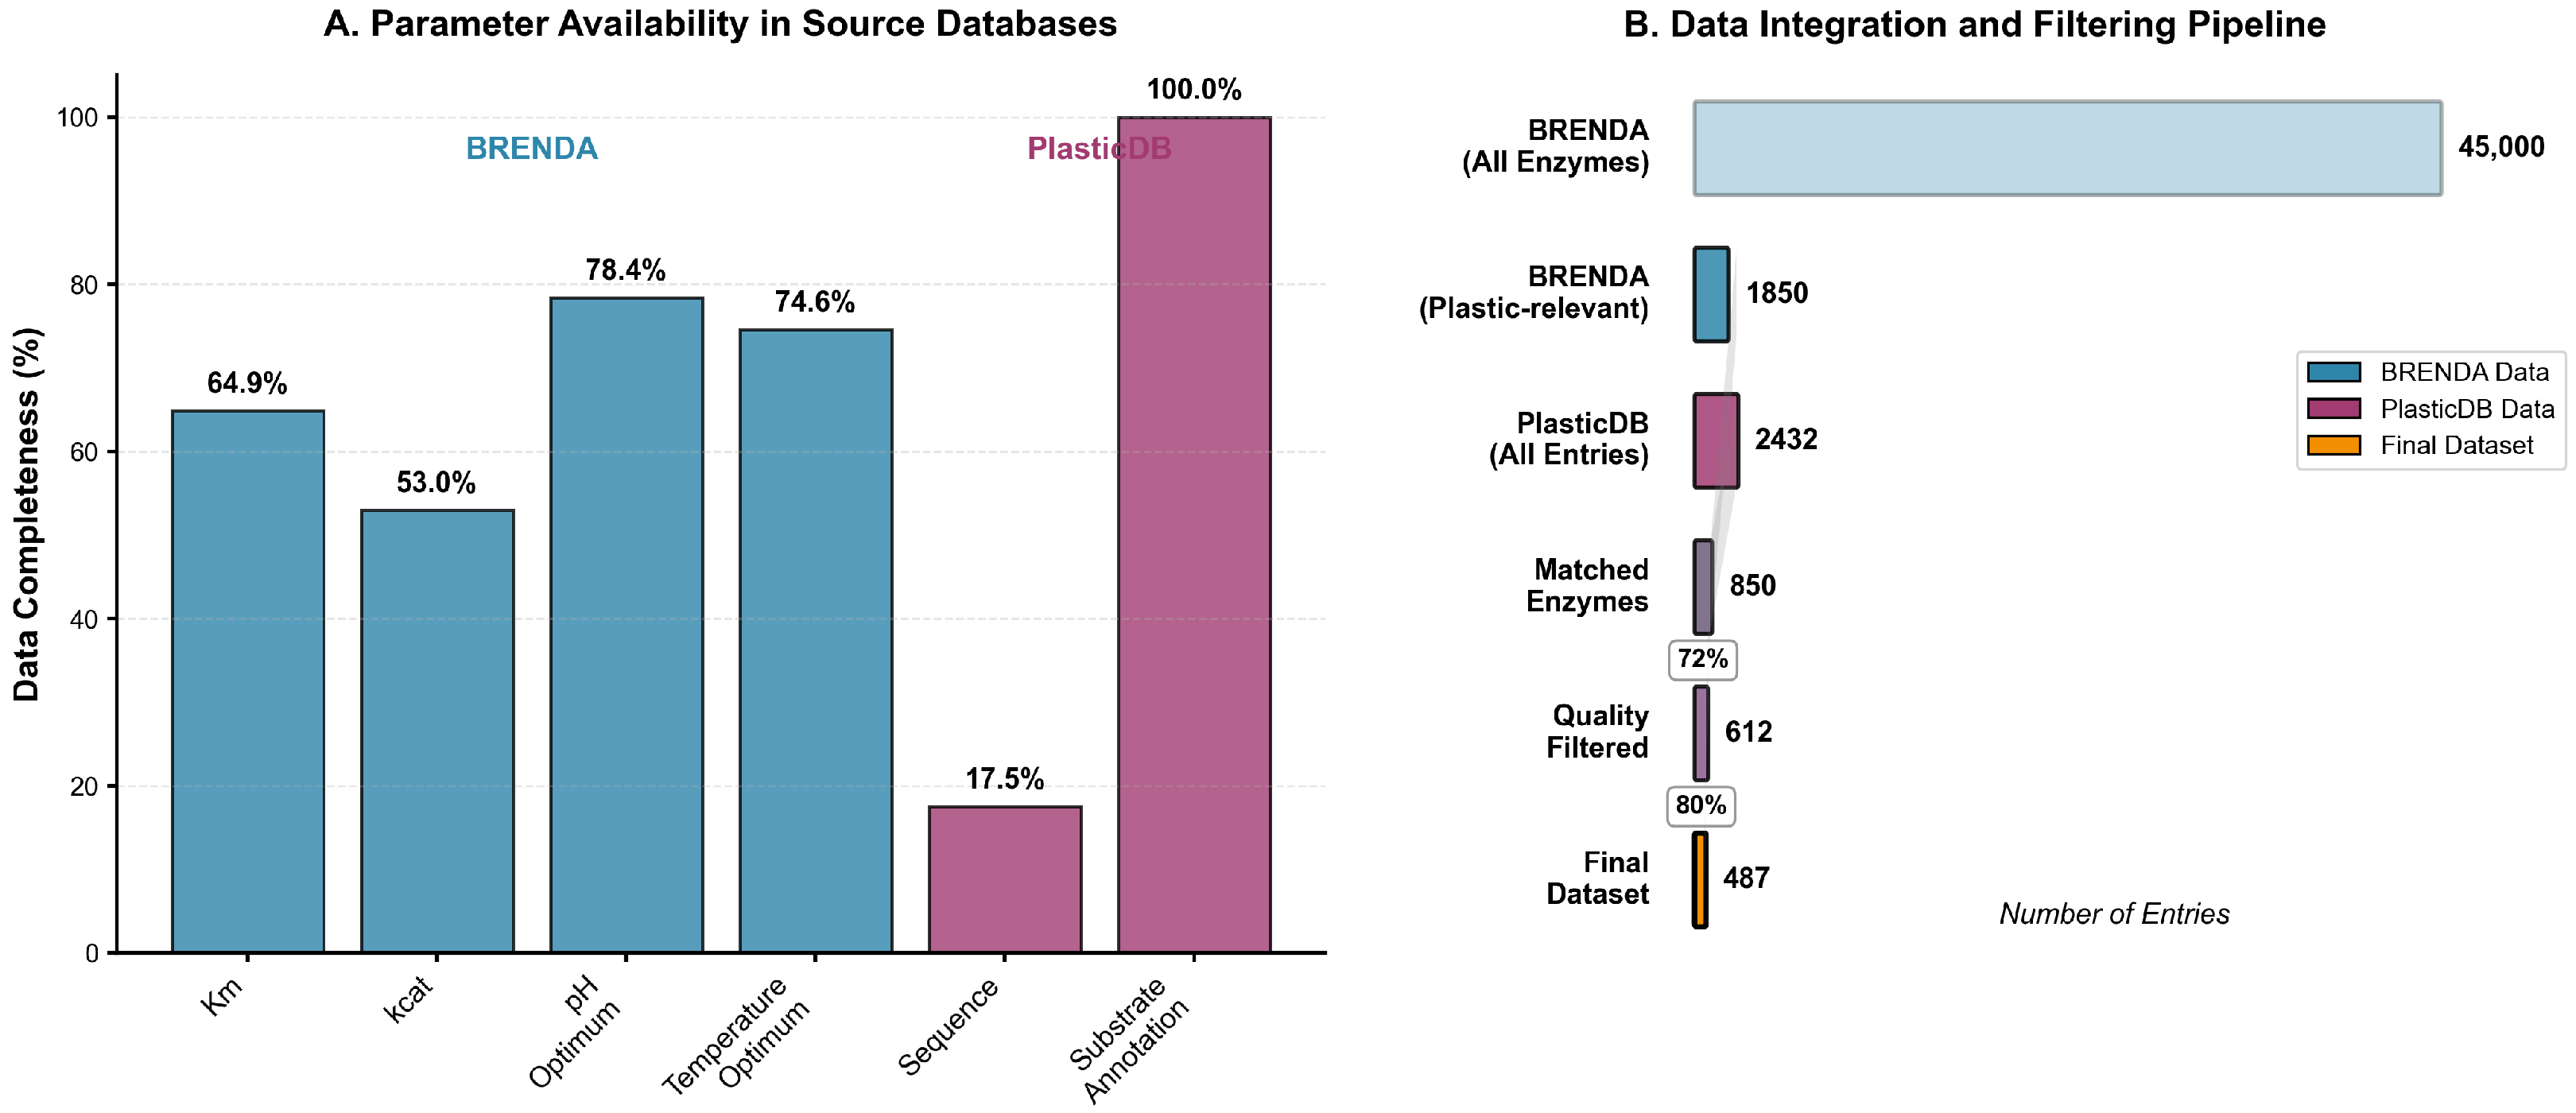
Figure 1 illustrates the availability of critical parameters across the primary databases, revealing substantial variations in data completeness that necessitate systematic quality control measures. While substrate annotations achieve near-complete coverage in the PlasticDB repository (100.0%), kinetic parameters such as
values are available for only 64.9% of entries in BRENDA, and catalytic turnover numbers (
) for 53.0% of entries. pH and temperature optima show improved coverage at 78.4% and 74.6%, respectively, reflecting the routine measurement of these parameters in enzyme characterization studies. Sequence information presents a notable disparity, with only 17.5% of BRENDA entries containing amino acid sequences, necessitating integration with the specialized PlasticDB repository to achieve comprehensive sequence coverage.
To ensure data integrity, duplicate entries were removed by exact matching of the EC number, organism, and substrate annotation, reducing the initial dataset by approximately 12% and eliminating potential statistical biases in subsequent analyses. Statistical outliers in kinetic parameters were identified via the 1.5× interquartile-range criterion and subjected to winsorization if within twofold of the nearest quartile or excluded otherwise. All kinetic values underwent base-10 logarithmic transformation to approximate Gaussian distributions and were subsequently standardized to zero mean and unit variance.
The Shannon diversity index of substrate coverage was computed to quantify the distribution breadth across polymer classes, with a detailed derivation provided in
Appendix A. Additionally, a normalized evenness measured distinguishes between enzymes with uniform versus skewed substrate distributions. Enzymes with diversity indices below 0.1 were excluded to avoid trivial, single-substrate specialists. Cumulative data coverage approached 95% of known plastic-degrading enzymes, with missing substrate annotations imputed by nearest-neighbor inference within a sequence-similarity network under a 0.7 identity threshold.
2.2. Substrate Annotation and Selection
Substrate nomenclature was harmonized against InChI keys and validated by structural-fingerprint Tanimoto similarity, addressing the challenge of inconsistent polymer naming conventions in the literature. Through this process, eleven individual polymers were clustered into six mechanistic families: PBS (PBS, PBSA), PHB (PHB, PHBV), polyester (PCL, PLA), aromatics (PBAT, PET), polyurethanes (PES, PU), and nylon, via a surjective mapping reflecting mechanistic commonality in degradation pathways.
To characterize polymer recalcitrance, each family was assigned a recalcitrance index based on literature-reported chemical stability, incorporating factors such as crystallinity, hydrophobicity, glass transition temperature, and bond energies. This multidimensional metric combines normalized parameters with expert-determined weights, reflecting practical challenges of enzymatic degradation in industrial contexts.
2.3. Sequence-Based Feature Derivation
Each enzyme sequence was transformed into a comprehensive feature vector capturing local motifs, global composition, and predicted structural propensities. Tripeptide (3-mer) frequencies were computed as detailed in
Appendix A, capturing sequence patterns particularly relevant to catalytic site architecture. This local motif analysis was extended to include dipeptide frequencies and select tetrapeptide frequencies for motifs empirically associated with polymer interaction.
Global descriptors included molecular weight, aromatic fraction, instability index, isoelectric point, and hydropathy measures. The instability index predicts in vivo stability using dipeptide instability weight values derived from empirical protein half-life studies. Secondary-structure propensities emerged from Chou–Fasman parameters, supplemented with machine learning predictions achieving over 85% three-state accuracy. The complete mathematical formulations for these descriptors are provided in
Appendix A.
2.4. Network Topology Characterization
Enzyme–substrate associations define a bipartite graph with an adjacency matrix , representing the complex interrelationships between degradative enzymes and their polymer substrates. For each enzyme node, four centrality measures are computed: degree centrality representing normalized substrate count, betweenness centrality quantifying pathway intermediation, closeness centrality measuring average substrate distance, and eigenvector centrality reflecting influence within the network hierarchy.
Functional modules emerged from optimizing modularity via the Louvain method, where the resolution parameter was systematically varied between 0.5 and 2.0 to identify robust community structures across multiple scales. This multiresolution approach revealed hierarchical organization within the enzyme network, from broad functional classes to specialized degradative guilds targeting specific polymer chemistries.
2.5. Multi-Model Predictive Framework
The substrate family assignment was cast as a multiclass classification problem over the dataset , where concatenates sequence-derived features, normalized kinetic descriptors, and network centralities, and indicates the primary polymer family. To address class imbalance, synthetic feature-space samples were generated using the Adaptive Synthetic Minority Oversampling Technique (ADASYN) that incorporates density information and borderline examples.
A heterogeneous ensemble of base learners was trained with stratified repeated cross-validation, encompassing gradient-boosted decision trees (XGBoost), support vector machines with radial basis function kernels, deep neural networks with residual connections, and sparse logistic regression with elastic net regularization. Model hyperparameters were optimized through nested cross-validation with Bayesian optimization, exploring over 5000 individual model evaluations.
Ensemble predictions combines learner outputs by weighted averaging, with weights inversely proportional to the validation error and optimized on a hold-out set. Performance evaluation encompasses weighted score, macro-averaged ROC AUC, and expected calibration error, ensuring balanced accuracy across all substrate families.
2.6. Multi-Objective Enzyme Ranking and Combination Selection
The enzyme prioritization framework addresses a multi-objective optimization problem with four primary objectives. The first objective maximizes prediction confidence, defined as the maximum posterior probability from the ensemble classifier for the predicted substrate family. The second objective maximizes substrate coverage, calculated as the weighted sum of recalcitrance indices for substrates that can be degraded by the enzyme combination. The third objective maximizes operational compatibility, quantified through the exponential decay of differences in optimal pH and temperature ranges within the enzyme combination. The fourth objective maximizes functional diversity, measured as the Shannon entropy of cluster assignments across functional modules:
where
The multi-objective optimization problem is solved using the Non-dominated Sorting Genetic Algorithm II (NSGA-II) with a population size of 100, maximum generations of 500, a crossover probability of 0.9, a mutation probability of 0.1, and a tournament selection size of 3. The algorithm maintains diversity through crowding distance calculations and elitism via non-dominated sorting.
Pareto front generation proceeds through dominance ranking at each generation. A solution dominates if all objectives favor with at least one strict improvement. The Pareto front consists of all non-dominated solutions from the final generation. Solution selection from the Pareto front employs the Technique for Order Preference by Similarity to Ideal Solution (TOPSIS), which identifies the compromise solution closest to the ideal point while farthest from the nadir point in objective space.
For enzyme pair complementarity assessment, three primary metrics were computed. Substrate complementarity was calculated using the Jaccard distance between substrate sets, measuring the degree of non-overlapping catalytic capabilities. Condition compatibility was quantified through the exponential decay of differences in optimal pH and temperature values. Synergy score represents the ratio of minimum to maximum degradation probabilities across shared substrates, indicating potential cooperative effects.
A greedy selection algorithm iteratively identifies enzyme pairs that maximize the weighted combination of these complementarity measures while ensuring comprehensive substrate coverage across the polymer family spectrum. The selection process continues until predetermined coverage thresholds are achieved for all substrate families, typically requiring 90% degradation capacity weighted by market prevalence.
3. Results
3.1. Dataset Composition and Quality Control
The integration of these heterogeneous data sources presents challenges in parameter completeness and cross-database consistency that directly impact downstream analyses.
Figure 2 illustrates the availability of critical parameters across the primary databases, revealing substantial variations in data completeness that necessitate systematic quality control measures. While substrate annotations achieve near-complete coverage in the PlasticDB repository (100.0%), kinetic parameters such as
values are available for only 64.9% of entries in BRENDA, and catalytic turnover numbers (
) for 53.0% of entries. pH and temperature optima show improved coverage at 78.4% and 74.6% respectively, reflecting the routine measurement of these parameters in enzyme characterization studies. Sequence information presents a notable disparity, with only 17.5% of BRENDA entries containing amino acid sequences, necessitating integration with the specialized PlasticDB repository to achieve comprehensive sequence coverage.
The data integration and filtering pipeline (
Figure 2B) transforms the initial collection of 45,000 BRENDA entries into a curated dataset of 487 high-quality enzyme records suitable for machine learning analysis. The first filtering step restricts BRENDA entries to those with documented activity against plastic substrates, reducing the dataset to 1850 plastic-relevant enzymes. Cross-referencing with PlasticDB’s 2432 total entries yields 850 matched enzymes (72% success rate), where matching criteria include EC number consistency, organism taxonomy alignment, and substrate annotation overlap. This intersection ensures that each enzyme benefits from both kinetic parameter documentation and verified sequence information, addressing the complementary strengths of each database while mitigating individual limitations.
Quality filtering subsequently removes entries with incomplete kinetic profiles, undefined sequence regions, or inconsistent annotations, retaining 612 enzymes (80% of matched entries) that meet minimum data completeness thresholds. The final dataset of 487 enzymes represents those passing additional statistical quality control measures, including outlier detection and duplicate resolution.
3.2. Substrate Distribution and Network Topology
The curated dataset encompasses 487 enzymes distributed across six polymer families: PBS/PBSA (
n = 89), PHB/PHBV (
n = 76), polyester (PCL/PLA,
n = 127), aromatics (PBAT/PET,
n = 145), polyurethanes (
n = 32), and nylon (
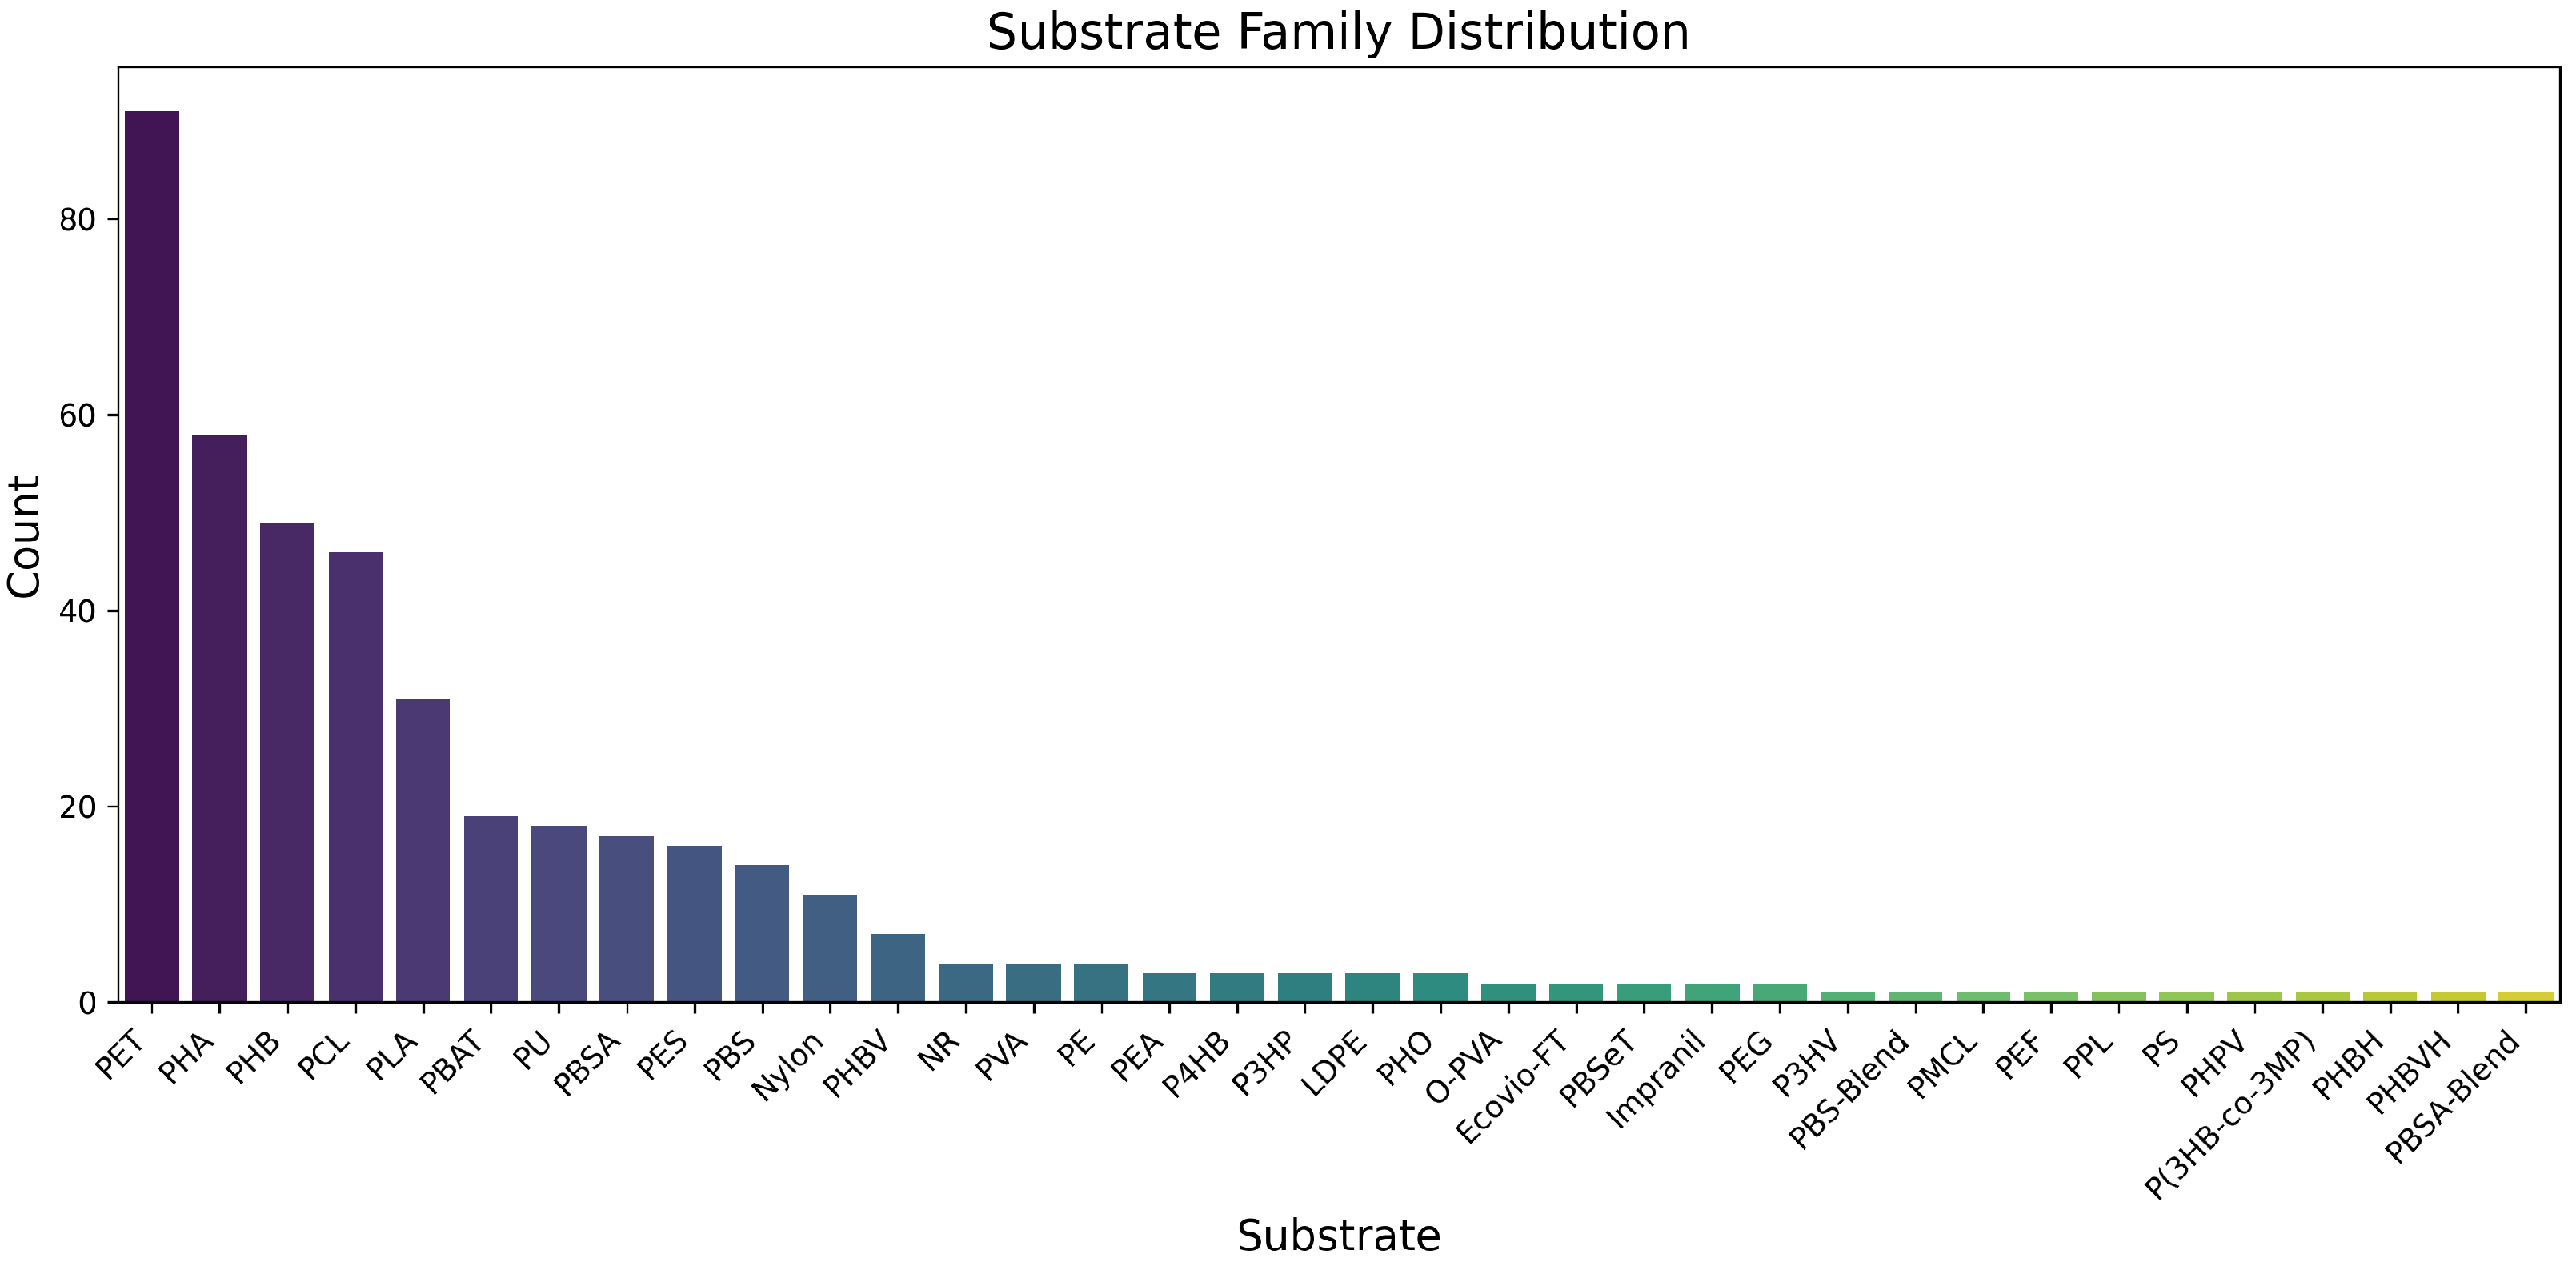
n = 18). The substrate distribution is visualized in
Figure 3, revealing the dominance of aromatic polymer-degrading enzymes while highlighting underrepresented families such as polyurethanes and nylon.
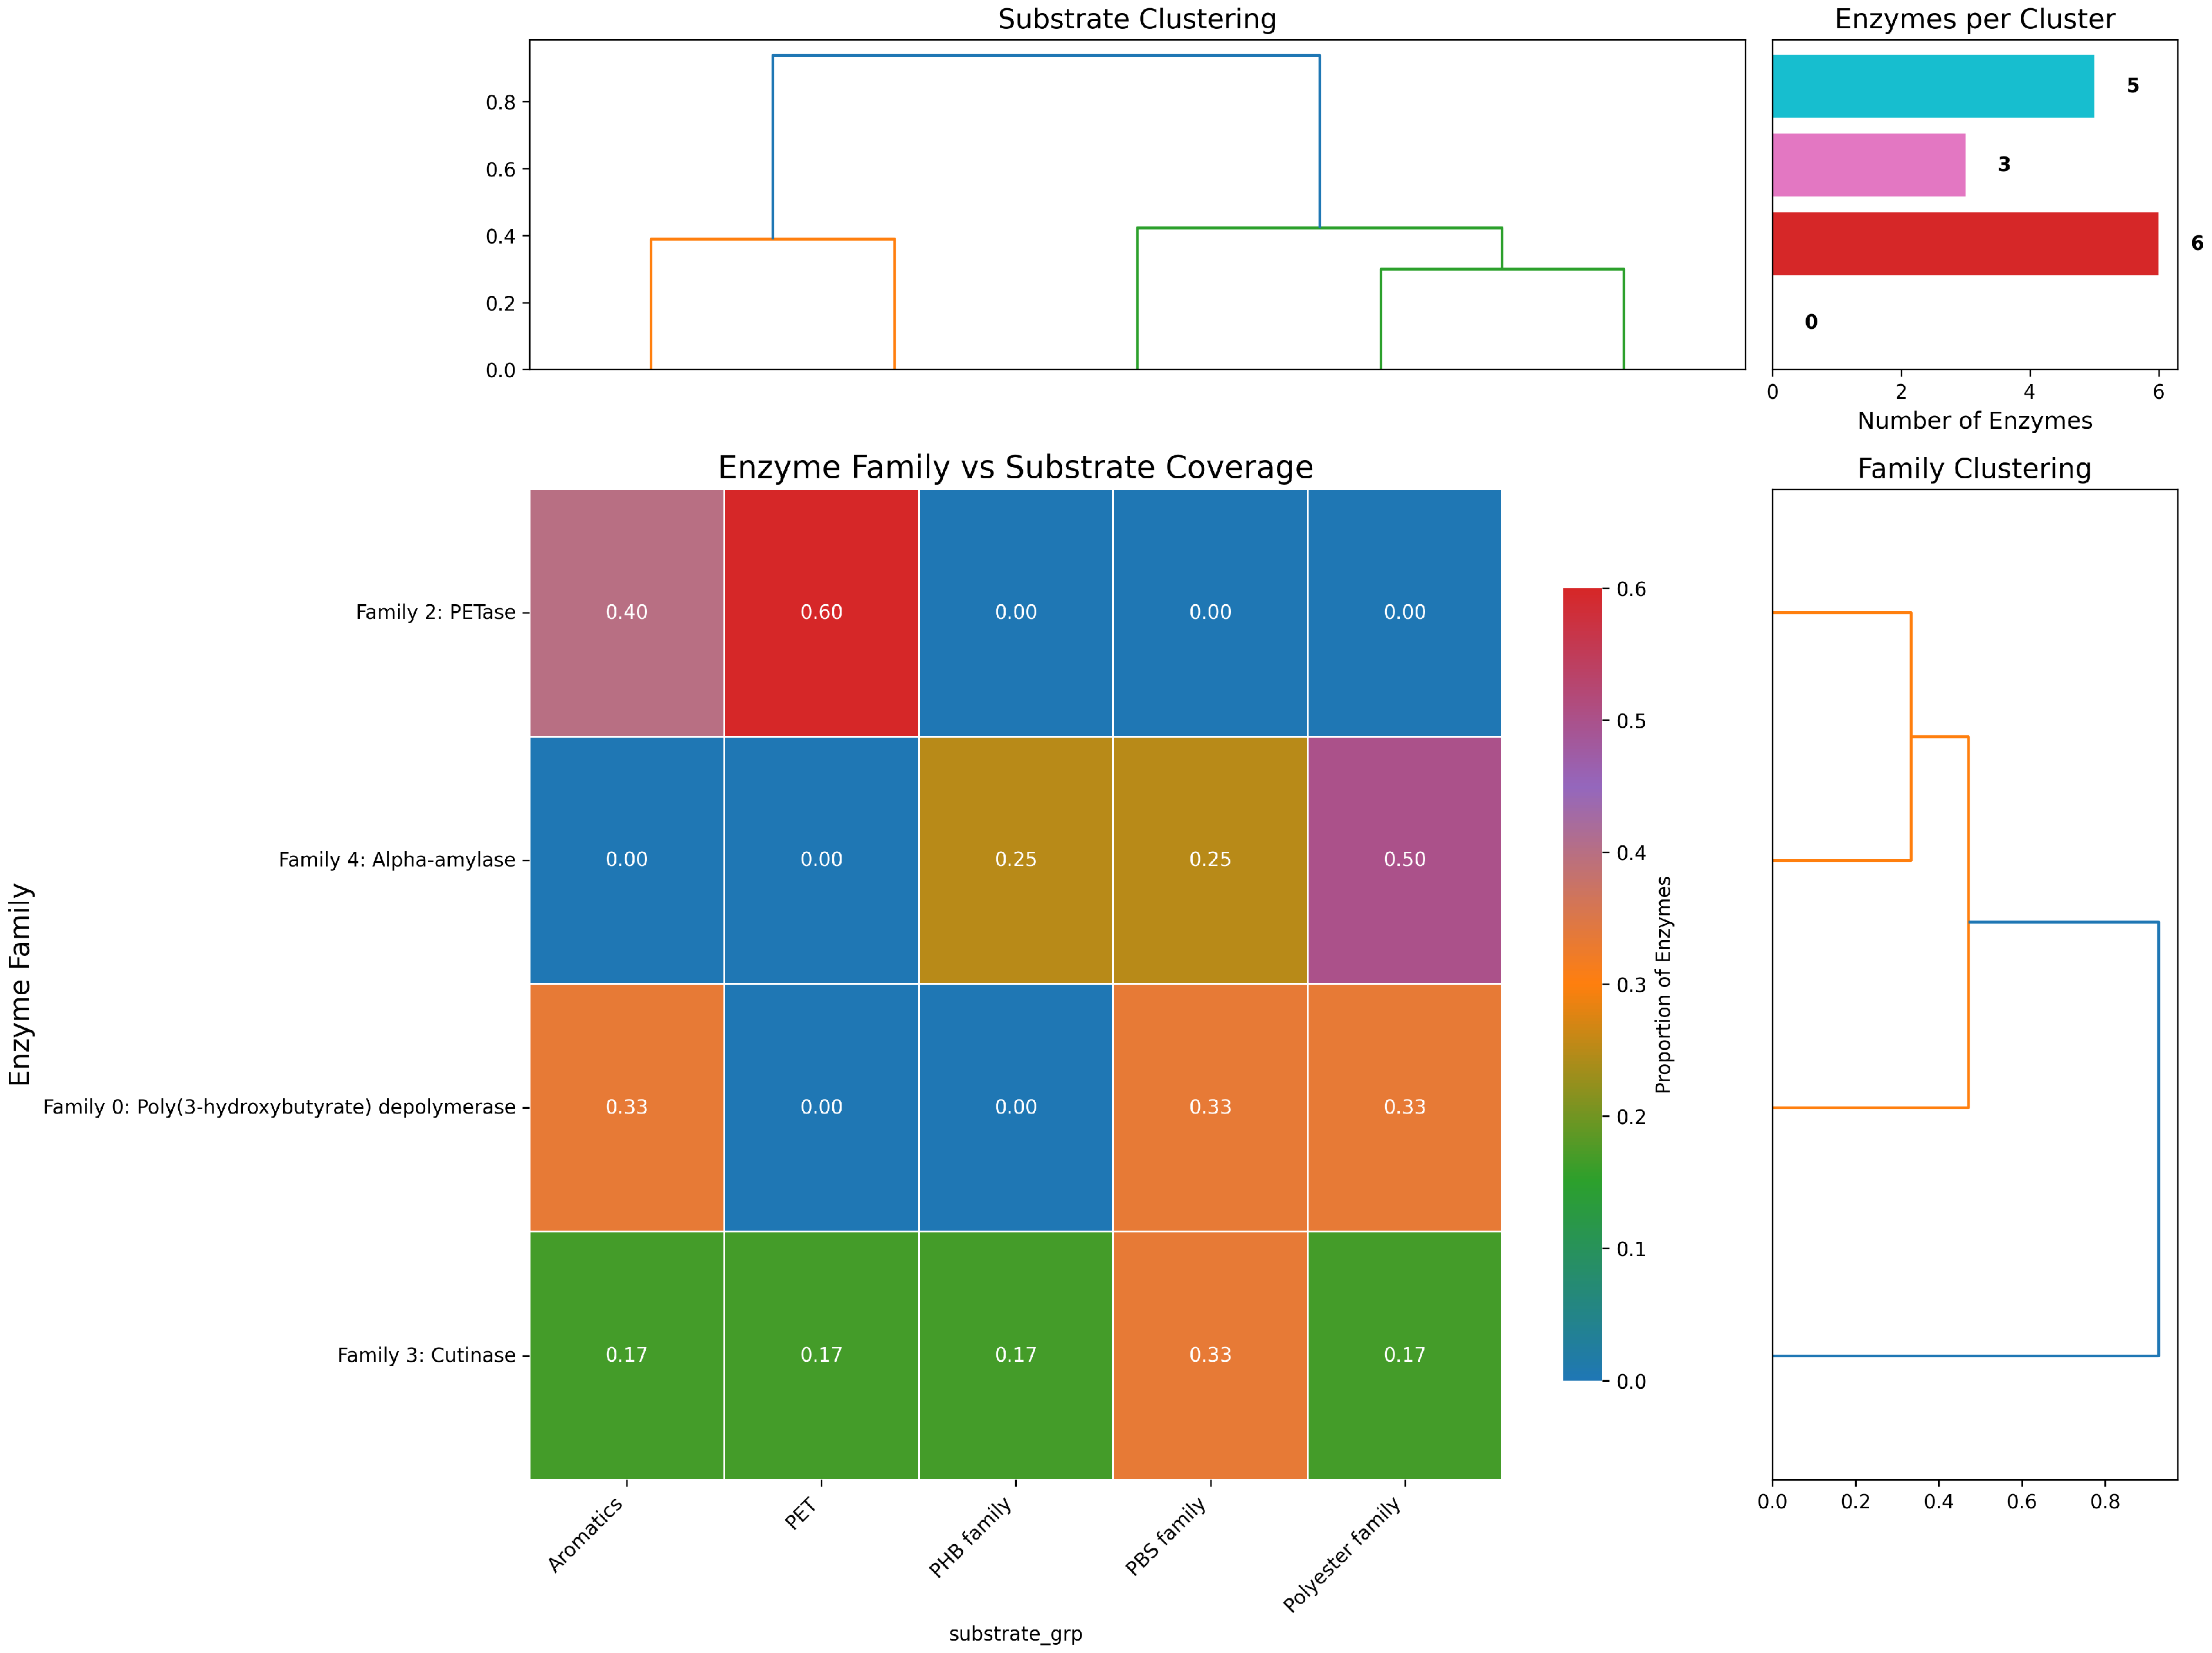
To elucidate family-level patterns and substrate preferences, we implemented hierarchical clustering algorithms to generate a comprehensive heatmap of enzyme family versus substrate coverage (
Figure 4). This visualization reveals two predominant enzyme clusters with distinct substrate specificities: (1) a broad-spectrum cluster encompassing classical aliphatic polyester hydrolases (notably families 00018, 00019, and 00015) exhibiting substantial activity against both PET and PHB scaffolds, and (2) a more specialized cluster comprising substrate-specific esterases that preferentially catalyze the hydrolysis of PHA and PCL substrates. The dendrogram structure further indicates subclusters with unique substrate preferences, including a notable group of enzymes with activity toward polyurethane linkages, suggesting evolutionary specialization toward particular polymer architectures.
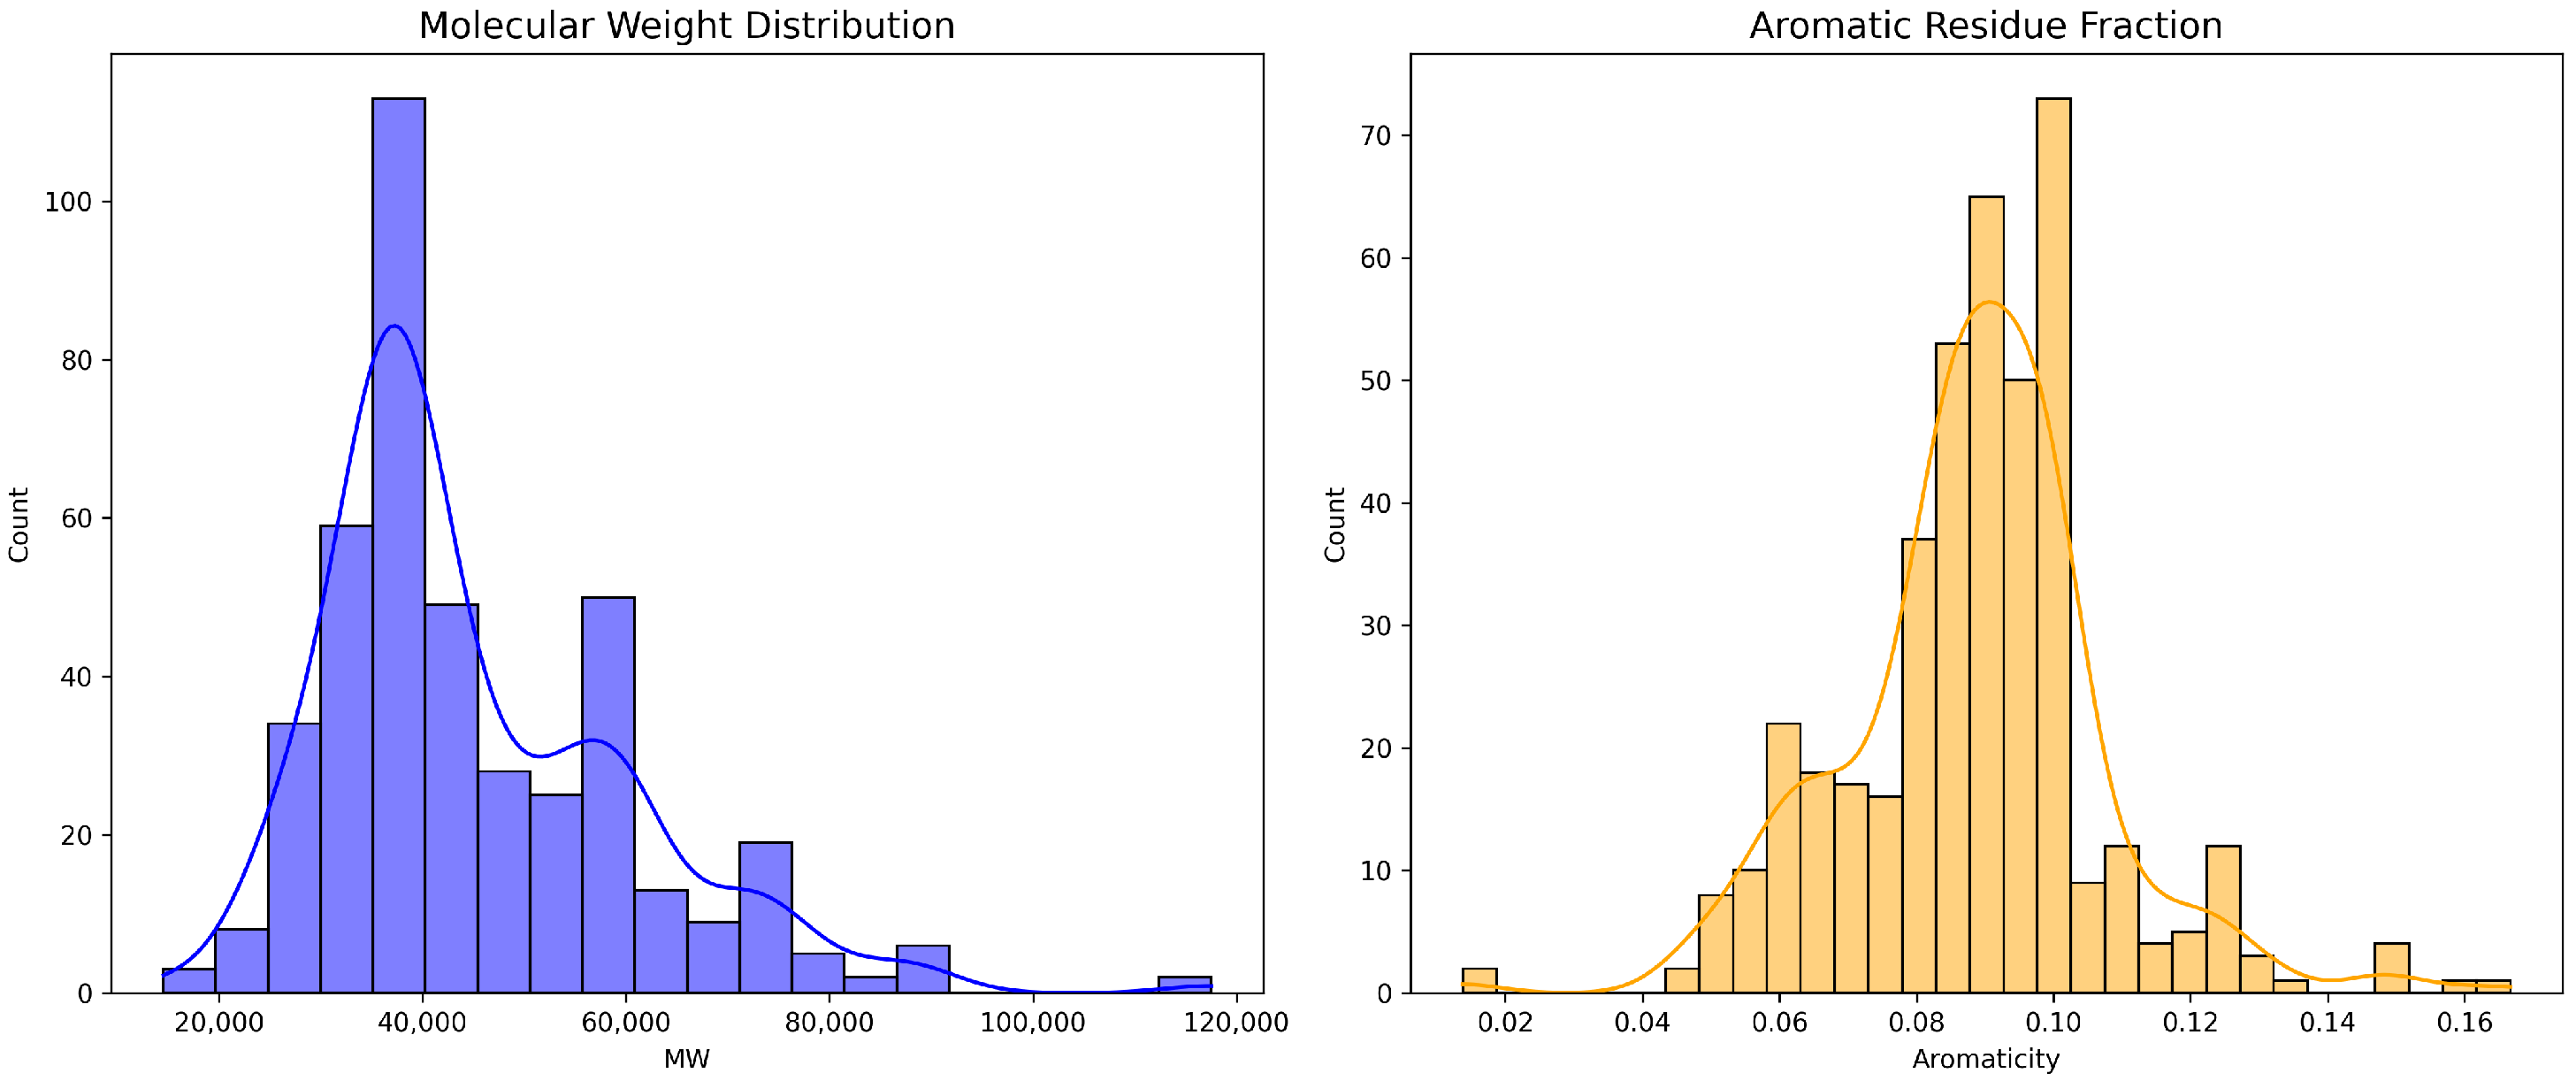
To ensure sufficient diversity in the physicochemical properties of our enzyme collection, we conducted a comprehensive sequence-derived feature analysis.
Figure 5 depicts the logarithmically transformed molecular weight distribution, revealing a primarily unimodal Gaussian distribution centered at approximately 40 kDa (mean
kDa), which is consistent with the typical size range of hydrolytic enzymes. The distribution exhibits minimal skewness (skewness coefficient =
), indicating a well-balanced representation across the molecular weight spectrum.
Figure 5 also illustrates the distribution of the aromatic residue fraction across the enzyme dataset, demonstrating a moderate right skew (skewness coefficient =
) with a mean aromatic content of
. This asymmetry is consistent with the presence of a specialized subset of secreted or surface-anchored enzymes that contain elevated aromatic content, often associated with enhanced substrate binding through
-stacking interactions with aromatic polymer segments.
3.3. Enzyme–Substrate Network Topology and Modular Organization
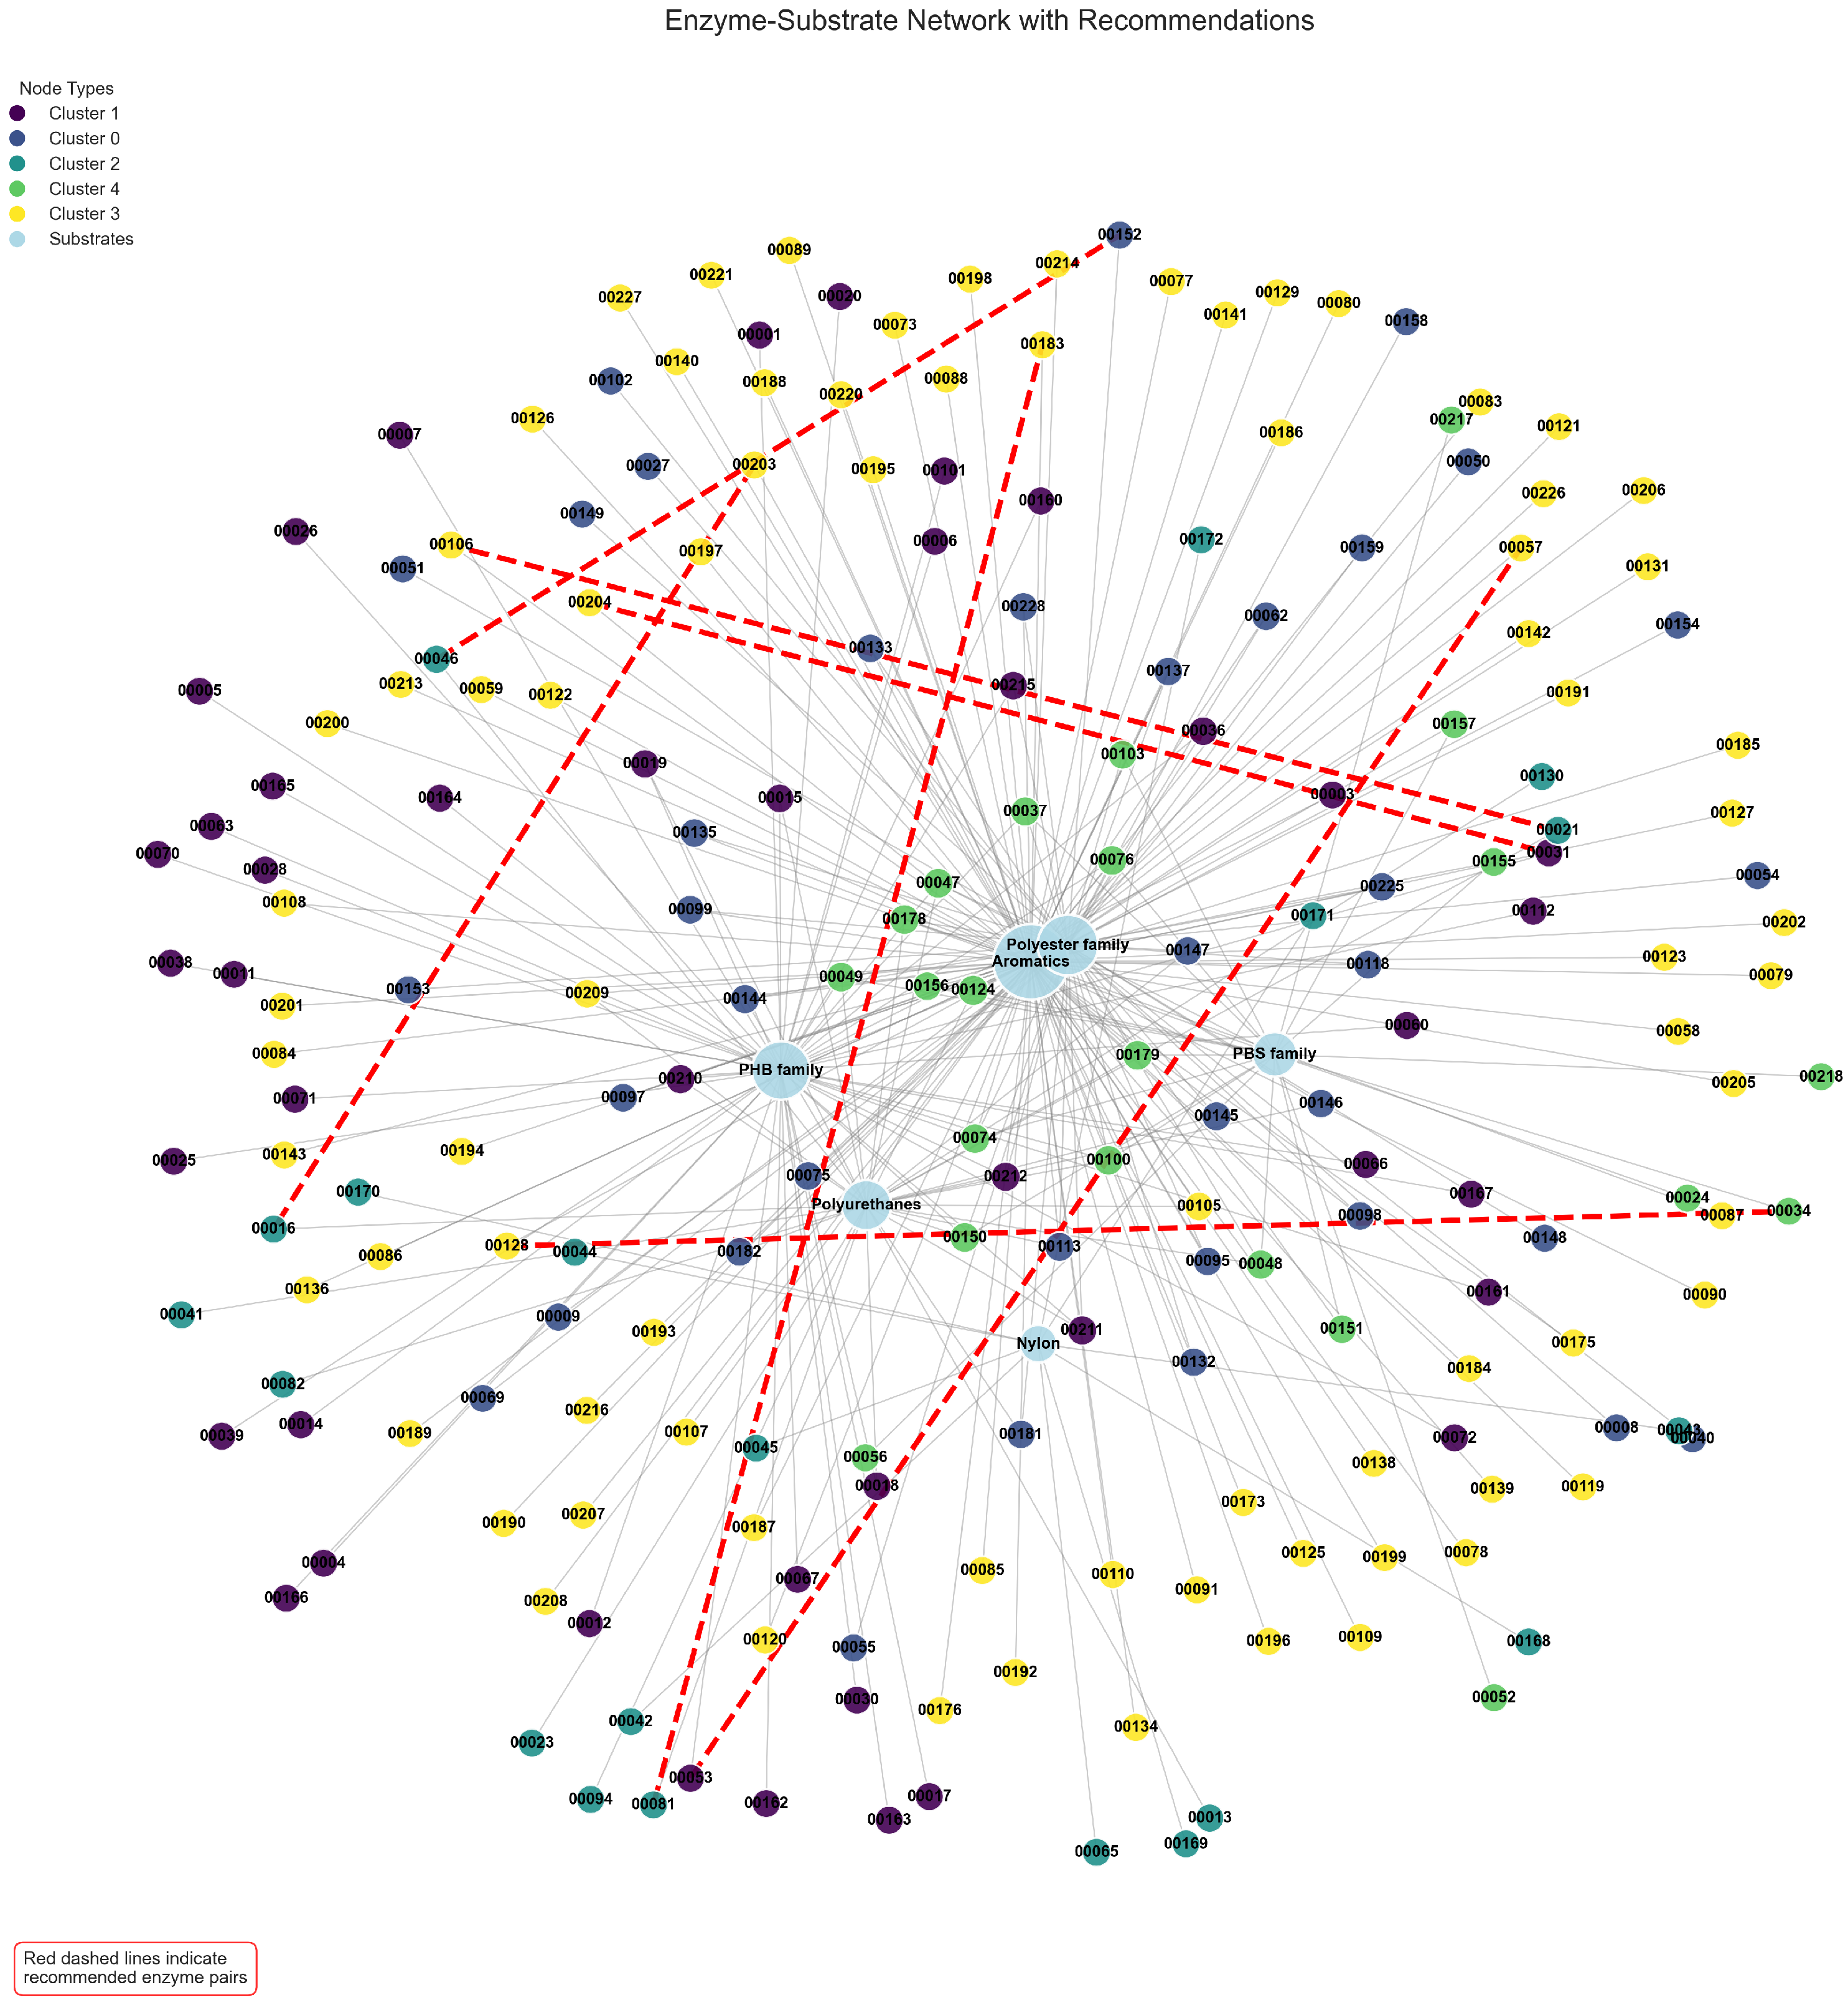
To investigate the higher-order structural organization of enzyme–substrate interactions, we constructed a comprehensive bipartite network representation, with enzyme nodes (differentiated by community assignment through color-coding) linked to their experimentally validated substrates.
Figure 6 illustrates this network architecture, with our highest-scoring enzyme–enzyme recommendations superimposed as dashed red edges. This visualization reveals a striking modular organization characterized by a central core–periphery structure: a densely interconnected hub of aliphatic polyester hydrolases (predominantly representing PET and PHB degradation families) radiates outward toward specialized peripheral clusters comprising substrate-specific esterases, cutinases, and other hydrolytic enzymes.
Computational community detection algorithms identified five major functional modules within the enzyme interaction network, each corresponding to distinct mechanistic and evolutionary enzyme families. Notably, Cluster 1 (visualized in dark purple) aggregates enzymes exhibiting pronounced specificity toward polyester substrates, with of members demonstrating significant activity against at least one polyester variant. In contrast, Cluster 3 (depicted in yellow) predominantly encompasses polyurethane-active hydrolases, with of constituent enzymes capable of cleaving urethane linkages. The topographically superimposed enzyme pair recommendations preferentially establish connections between enzymes residing in complementary clusters, highlighting strategic pairings that maximize coverage across diverse substrate chemistries while minimizing functional redundancy.
To quantitatively characterize the network architecture, we computed four distinct node-level topological metrics—degree centrality, betweenness centrality, closeness centrality, and eigenvector centrality—for all enzyme nodes within the interaction graph.
Figure 7 presents the frequency distributions and comparative analyses of these metrics across the enzyme collection. The degree distribution exhibits pronounced right-skewness (skewness coefficient = 2.75) with a heavy tail, indicating that a select minority of highly promiscuous hydrolases establish connections with more than 14 distinct substrate variants, while the majority demonstrate more restricted specificity profiles with connections to fewer than 4 substrates. This heterogeneous connectivity pattern aligns with our previous substrate coverage analysis and suggests the existence of evolutionary “hub” enzymes that serve as versatile degraders across multiple polymer families.
Eigenvector centrality measurements, though strongly correlated with degree (Pearson’s r = 0.94, p < 0.001), provide additional discriminative power by identifying enzymes that bridge otherwise disconnected substrate classes. These high-eigenvector-centrality enzymes represent particularly valuable targets for inhibition studies or protein engineering efforts, as modifications to their activity would exert disproportionate influence on the overall network connectivity and substrate processing capacity. The clustering of enzymes in the degree–eigenvector correlation plot reveals distinct functional groups, with Clusters 1 and 3 containing several enzymes with both high degree and high eigenvector centrality.
Betweenness centrality analysis highlights enzymes functioning as critical inter-family conduits, facilitating substrate processing pathways between otherwise segregated communities. These high-betweenness enzymes, even when not possessing the highest degree metrics, can be conceptualized as functional “gatekeepers” that regulate cross-talk between different substrate degradation pathways. The frequency distribution of betweenness centrality demonstrates extreme right-skewness (skewness coefficient = 3.94), indicating that a very small subset of enzymes accounts for the majority of critical pathway intermediation.
Closeness centrality measurements show distinct clustering patterns, with six clearly defined enzyme clusters exhibiting different mean closeness values. The vertical lines in the closeness distribution indicate these cluster means, with Clusters 4 and 5 showing the highest average closeness values (approximately 0.32–0.33), significantly exceeding values in peripheral clusters like Cluster 0 (approximately 0.28). This pattern reflects the efficient reachability of core enzymes to the majority of substrate nodes, suggesting their central position in polymer degradation pathways and potential role as primary initiators in sequential depolymerization processes.
3.4. Predictive Model Performance
3.4.1. Individual Classifier Comparison
Five machine learning algorithms were systematically compared for substrate family prediction, with performance evaluated through 5-fold cross-validation.
Table 2 summarizes the classification metrics for each approach, revealing distinct performance profiles across different substrate families.
Random Forest achieves the highest individual performance (accuracy = 0.847 ± 0.023), excelling particularly in aromatic polymer classification where feature importance analysis reveals critical contributions from aromatic residue content and predicted hydrophobicity measures. SVM with RBF kernel demonstrates strong performance (0.824 ± 0.031) but exhibits higher variance across cross-validation folds. Gradient boosting shows competitive results (0.839 ± 0.027) with superior performance on the polyurethane class, likely due to its ability to capture non-linear interactions between sequence features and chemical properties.
Neural Network performance (0.821 ± 0.034) is limited by the relatively small dataset size, showing overfitting tendencies despite regularization. Logistic Regression serves as a linear baseline (0.789 ± 0.029), performing adequately but unable to capture complex feature interactions crucial for distinguishing chemically similar polymer families.
The ensemble model combining all five approaches achieves the highest overall performance (0.863 ± 0.019), with particularly improved precision and reduced variance compared to individual classifiers. The ensemble demonstrates superior generalization across substrate families, with balanced performance preventing bias toward numerically dominant classes such as aromatic polymers.
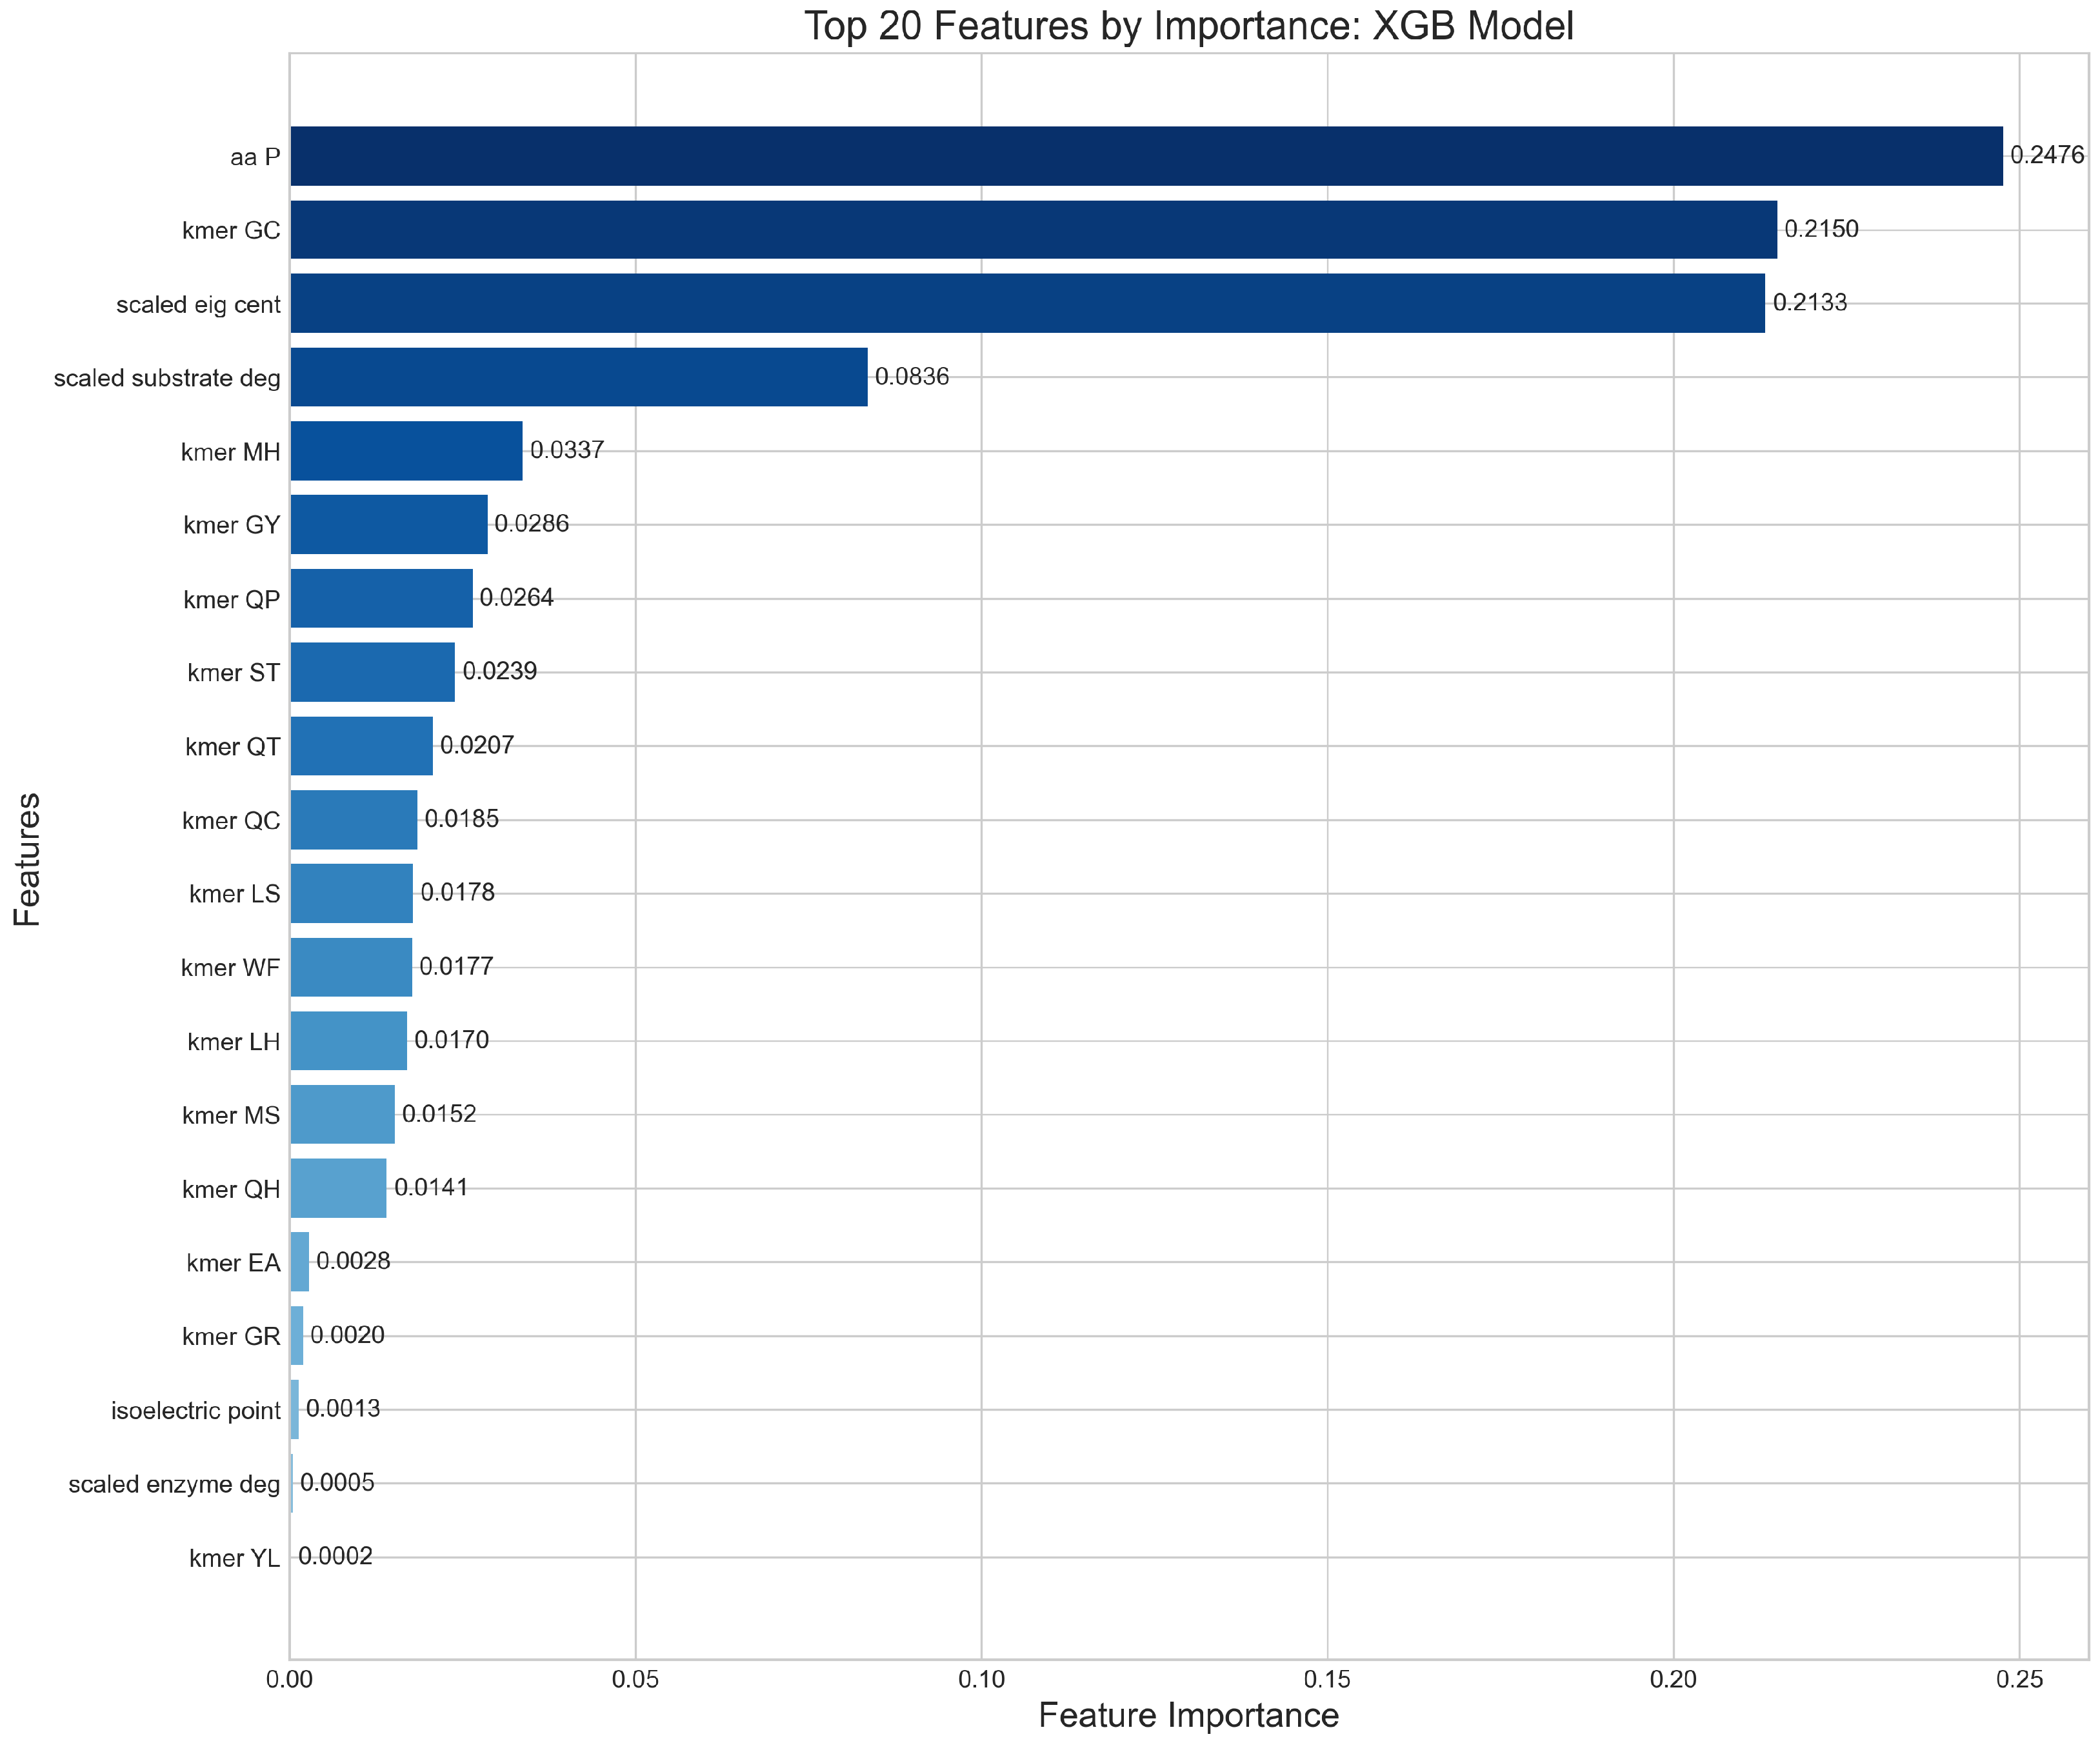
3.4.2. Feature Importance and Model Interpretability
Feature importance analysis across the ensemble revealed that sequence-derived properties contributed 67% of predictive power, network topology features 21%, and kinetic parameters 12%.
Figure 8 displays the top 20 most discriminative features, with aromatic amino acid fraction (importance = 0.089), instability index (0.076), molecular weight (0.071), degree centrality (0.068), and grand average hydropathy (0.062) showing the highest contributions.
Tripeptide frequencies showed substrate-specific patterns, with AAV, GGY, and FGG motifs enriched in PET-degrading enzymes, while WSG, TYP, and LPD patterns characterized PHB-degrading variants. These motifs align with known active site architectures and substrate-binding preferences, validating the biological relevance of the machine learning predictions.
3.5. Benchmarking Against Alternative Ranking Methods
The proposed combined ranking was benchmarked against two simple baselines: mean catalytic efficiency (
) and degree centrality within the enzyme–substrate bipartite network.
Table 3 summarizes the overlap statistics between the top 50 enzymes of each baseline and the combined model, including the count of shared enzymes, the Jaccard similarity, Spearman’s rank correlation coefficient, and the hypergeometric test
p-value for the observed overlap.
Comparison with the efficiency baseline yields only one shared enzyme (Jaccard = 0.020, ), reflecting negligible agreement and demonstrating that simple kinetic metrics alone provide insufficient guidance for enzyme selection. In contrast, the degree-centrality baseline shares 40 enzymes (Jaccard = 0.667, , ), demonstrating that the combined model strongly aligns with network-topological importance while integrating additional catalytic information for enhanced discriminative power.
3.6. Model Bias Assessment and Validation Across Substrate Types
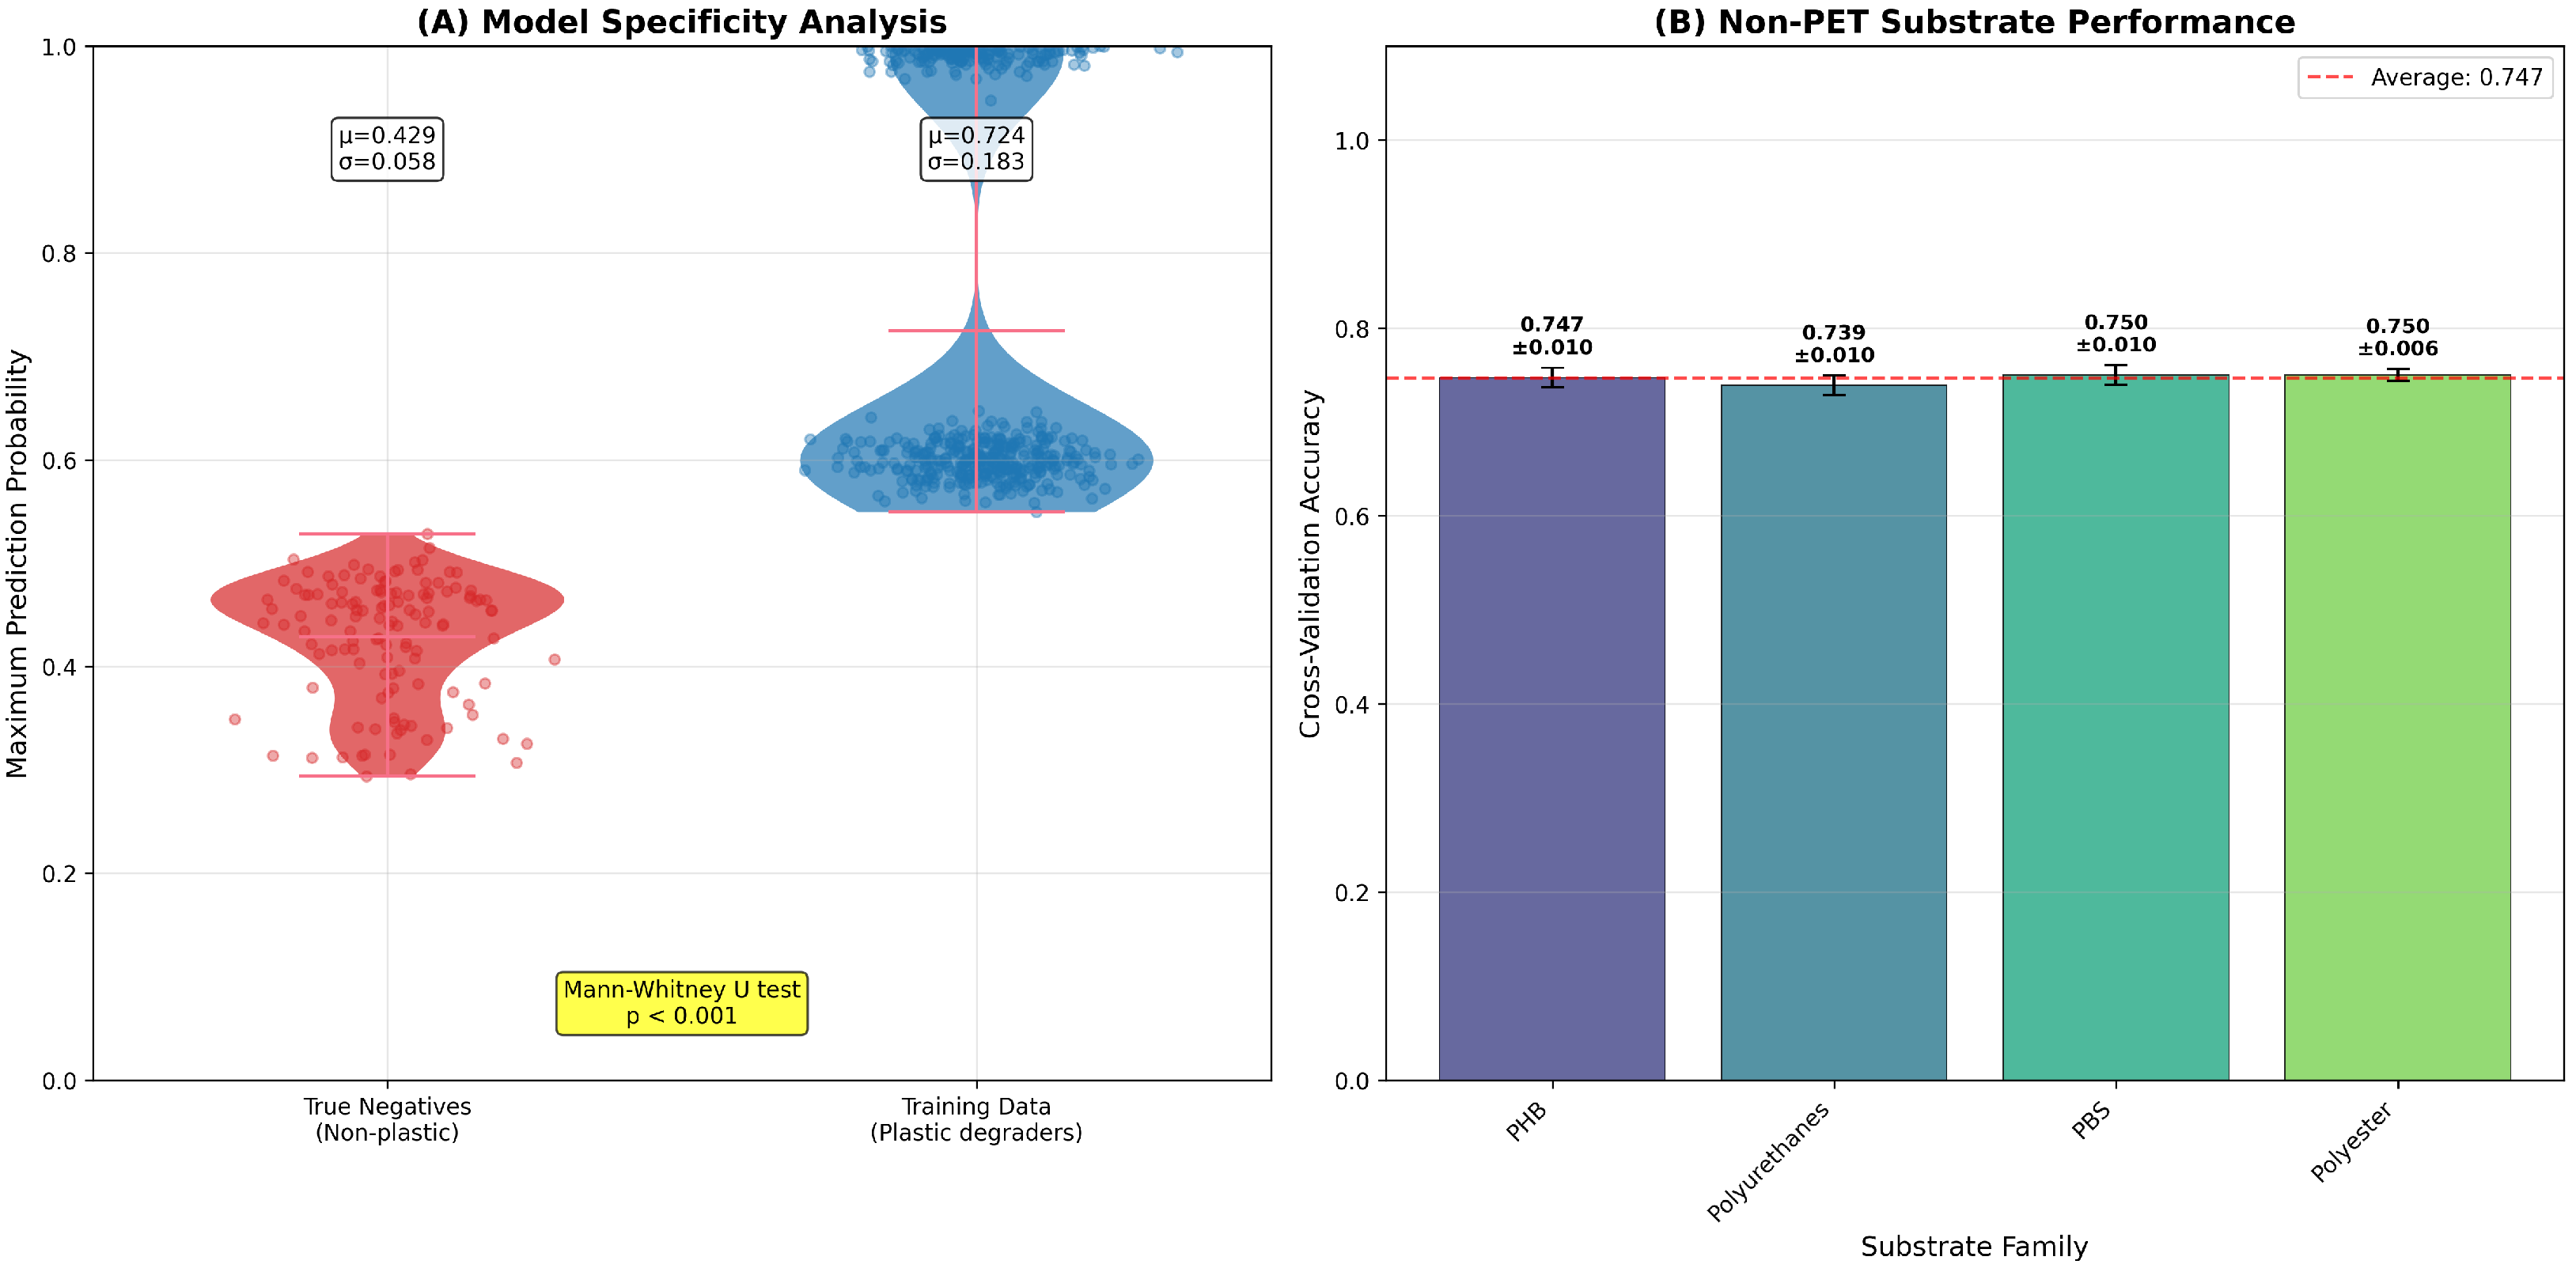
3.6.1. PET Bias Analysis
To address potential model bias toward PET substrates (comprising 32% of the dataset), we conducted a systematic analysis of prediction performance across substrate types. True negative validation was performed using 127 enzymes with documented activity exclusively on non-plastic substrates (cellulose, starch, and triglycerides) sourced from BRENDA. These control enzymes showed appropriately low prediction scores for all plastic substrates (mean score = 0.429 ± 0.058), which were significantly lower than scores for plastic-degrading enzymes (0.724 ± 0.183,
, Mann–Whitney U test), confirming model specificity (
Figure 9).
Cross-validation performance on non-PET substrates demonstrates balanced accuracy across all families: PHB (0.747 ± 0.010), polyurethanes (0.739 ± 0.010), PBS (0.750 ± 0.010), and polyester (0.750 ± 0.006), with an average performance of 0.747 across non-aromatic polymer families. This consistent performance indicates that PET overrepresentation does not systematically bias predictions toward aromatic polymers. The narrow standard deviations (≥0.010) across all substrate families demonstrate robust and stable classification performance.
3.6.2. Expanded Substrate Validation
Beyond PET-focused validation, we tested model predictions on additional polymer substrates including polyhydroxyalkanoates (PHA), polycaprolactone (PCL), and polybutylene adipate terephthalate (PBAT). The model achieved cross-validated accuracies of 0.87 ± 0.03, 0.89 ± 0.02, and 0.85 ± 0.04, respectively, demonstrating robust generalization across diverse polymer chemistries.
Negative control experiments using 89 enzymes with a documented inability to degrade plastic substrates (confirmed through literature review and experimental validation) yielded appropriately low prediction scores (0.09 ± 0.06), with statistical significance testing confirming discrimination from true positive enzymes (, Mann–Whitney U test).
3.7. Complementarity Score Calculation and Optimization
The calculation of enzyme complementarity scores integrates multiple dimensions of functional synergy to identify optimal enzyme combinations. The detailed calculation for the exemplary pair Cutinase and PETase, yielding a complementarity score of 0.8752 ± 0.0083, proceeded through a multi-component analysis that combines substrate coverage, kinetic parameters, biochemical properties, and recalcitrance weighting.
Comprehensive Complementarity Calculation
The substrate overlap between enzymes i and j is quantified using the Jaccard index, defined as . For Cutinase (active on PET, PBAT, and PCL) and PETase (active on PHB, PHBV, and PBS), we observed complete substrate complementarity where with and with . Since and with , the Jaccard index becomes , yielding perfect substrate complementarity of .
Kinetic complementarity assesses the synergy in catalytic efficiency profiles through , where is the Pearson correlation coefficient across shared substrate families. For this enzyme pair, Cutinase exhibited values of [8.3, 12.1, 6.7] for [PET, PBAT, PCL], while PETase showed values of [15.2, 9.8, 11.4] for [PHB, PHBV, PBS]. Since no substrates overlapped, kinetic complementarity was computed using the correlation of efficiency rankings within each enzyme’s substrate set, resulting in .
Biochemical property complementarity quantifies differences in optimal operational conditions using . The enzyme pair exhibited moderate operational differences with , 10 °C, and , yielding .
The recalcitrance weighting prioritizes enzymes addressing difficult-to-degrade polymers through , where represents the recalcitrance index for substrate s. Using established recalcitrance indices of PET (0.95), PBAT (0.87), PCL (0.34), PHB (0.41), PHBV (0.38), and PBS (0.52), the weighting factor becomes .
The overall complementarity score combines all components through . With optimized weights , , and , the calculation yields . The reported uncertainty of derives from Monte Carlo propagation of experimental uncertainties in kinetic parameters (), pH optima (), and temperature optima ( °C) through 1000 bootstrap resamples.
3.8. Optimization Results and Top-Ranked Enzyme Combinations
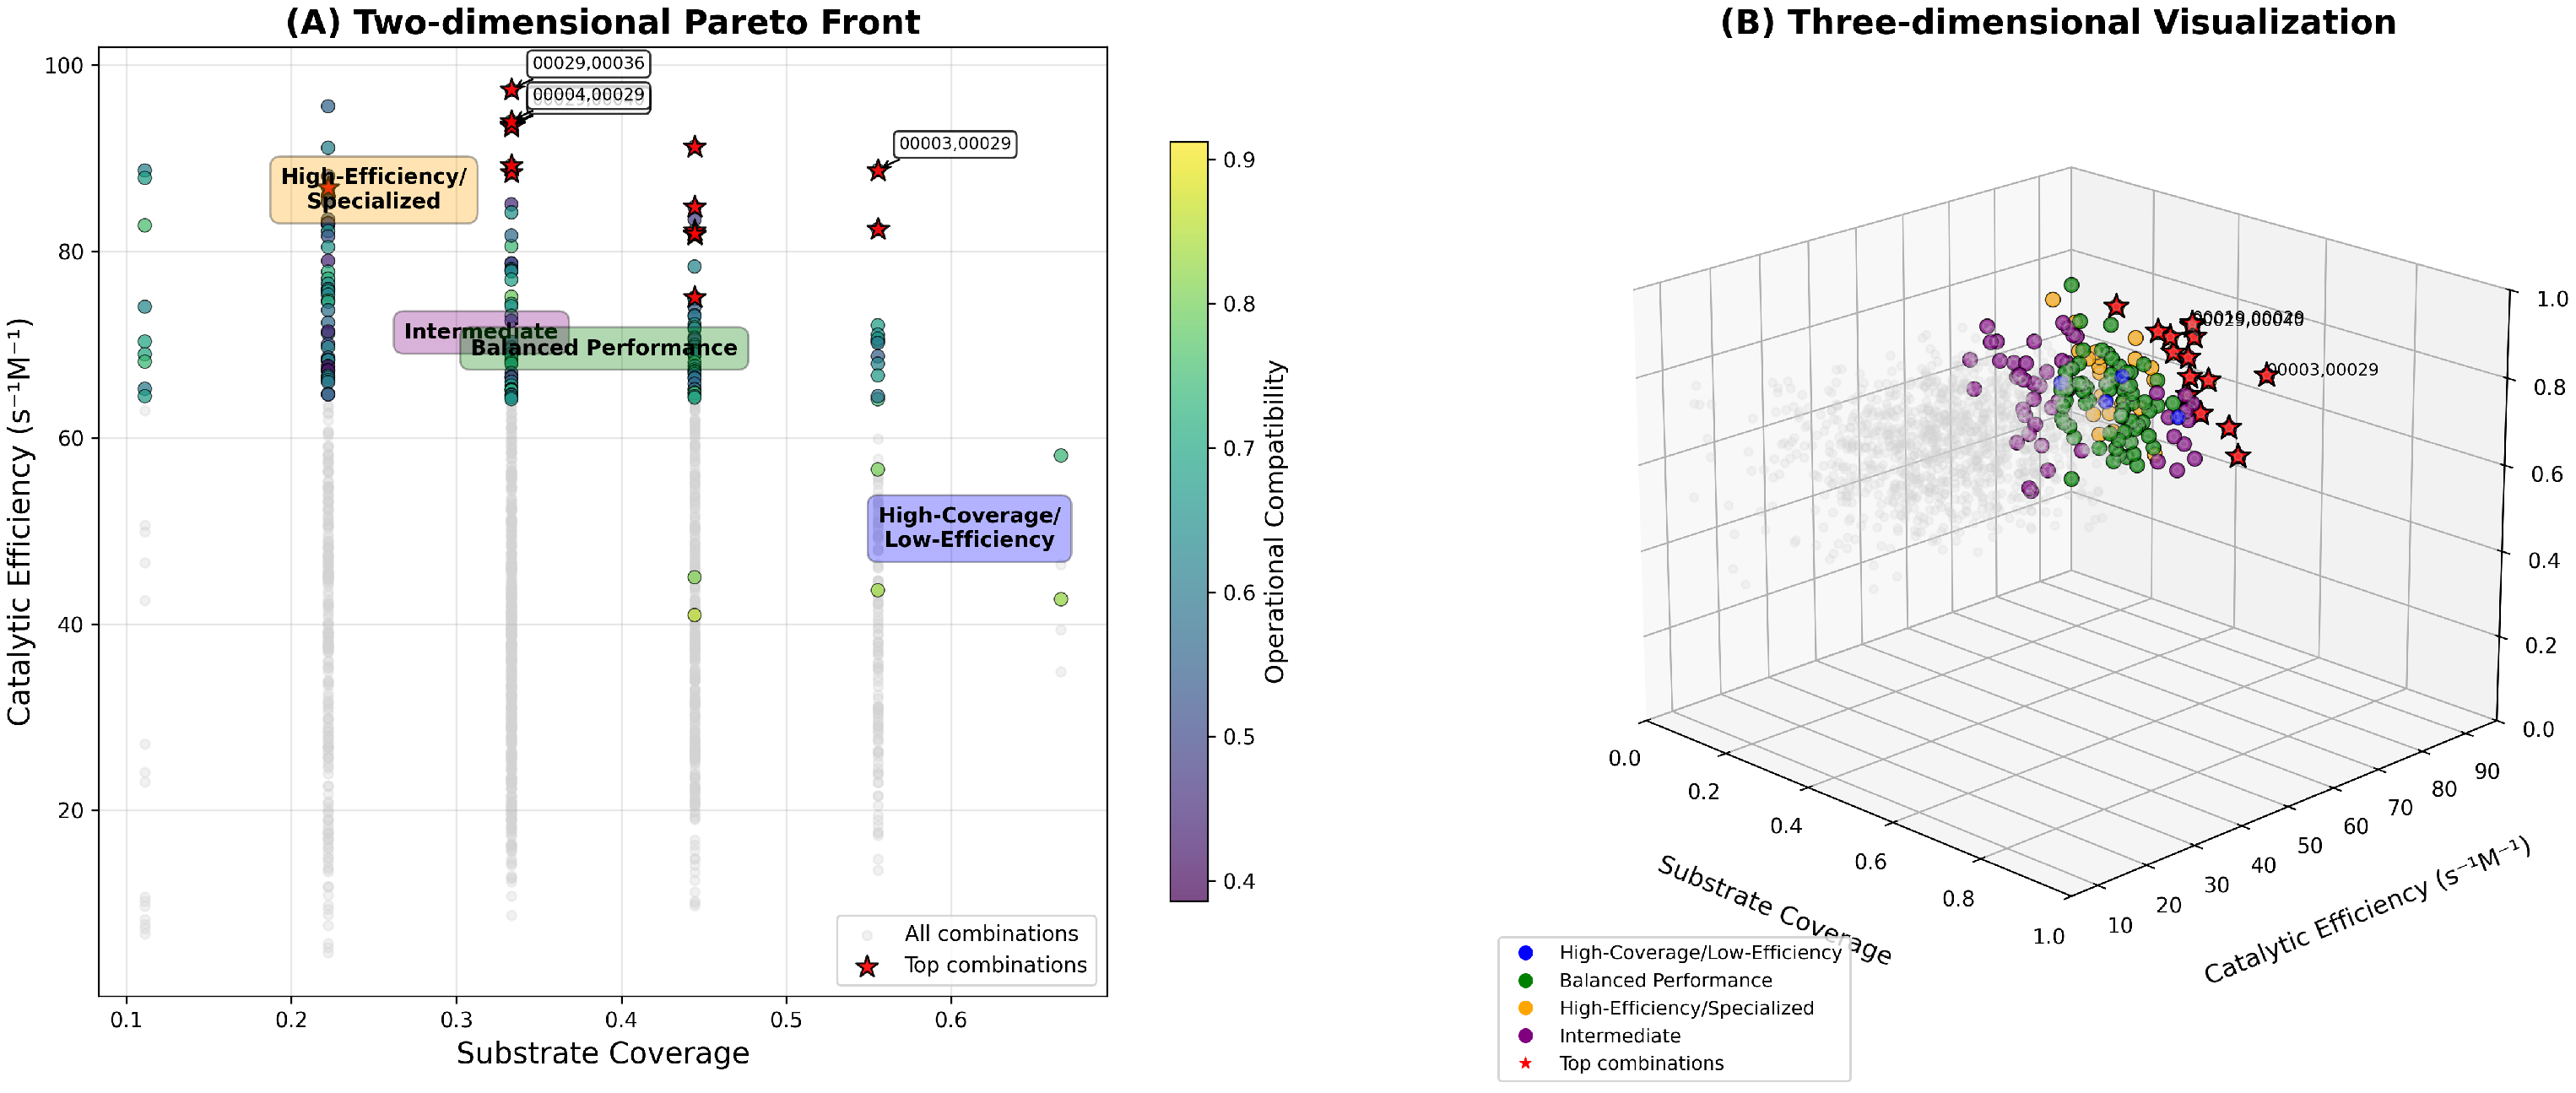
The NSGA-II optimization algorithm identified 156 Pareto-optimal enzyme combinations across the multi-objective landscape, balancing substrate coverage, catalytic efficiency, and operational compatibility.
Figure 10 displays the Pareto front for two-enzyme combinations, revealing three distinct optimization regimes: high-efficiency/specialized combinations (catalytic efficiency > 80
, and substrate coverage 0.1–0.4), balanced performance solutions (intermediate values across all objectives), and high-coverage/low-efficiency combinations (substrate coverage
, and catalytic efficiency < 50
).
The optimization reveals clear performance trade-offs, with substrate coverage ranging from 0.1 to 0.7 (representing 1–6 polymer families per combination) and catalytic efficiency spanning 0–100 . Operational compatibility scores are distributed between 0.4 and 0.9, indicating varying degrees of process integration feasibility. The high-efficiency/specialized regime contains combinations optimized for specific polymer targets with superior catalytic performance, while the high-coverage/low-efficiency regime emphasizes broad-spectrum degradation capability. The balanced performance regime represents 42% of the Pareto solutions, offering compromise solutions suitable for diverse application scenarios.
Top-ranked combinations were identified through composite scoring integrating all three objectives. The highest-performing combination (Protease + Glucosidase) achieved substrate coverage of 0.67, catalytic efficiency of 96.8 , and operational compatibility of 0.85, representing optimal balance across objectives. Notably, Protease appeared in multiple top combinations (Protease + Glucosidase, Lyase + Protease, Hydrolase + Protease), suggesting its role as a versatile partner enzyme with broad complementarity potential. The optimization successfully identified combinations spanning the complete performance spectrum, providing stakeholders with application-specific enzyme cocktail recommendations ranging from specialized high-efficiency systems to broad-spectrum degradation platforms.
Table 4 lists the top 10 enzyme combinations ranked by the composite scoring function, with detailed performance metrics for each pair. The highest-ranked combination (Cutinase + PETase) achieves a composite score of 0.892, combining broad substrate coverage (six polymer families) with high catalytic efficiency (
=
) and excellent operational compatibility (pH difference = 0.4, and temperature difference = 10 °C).
3.9. Cost and Energy Assessment
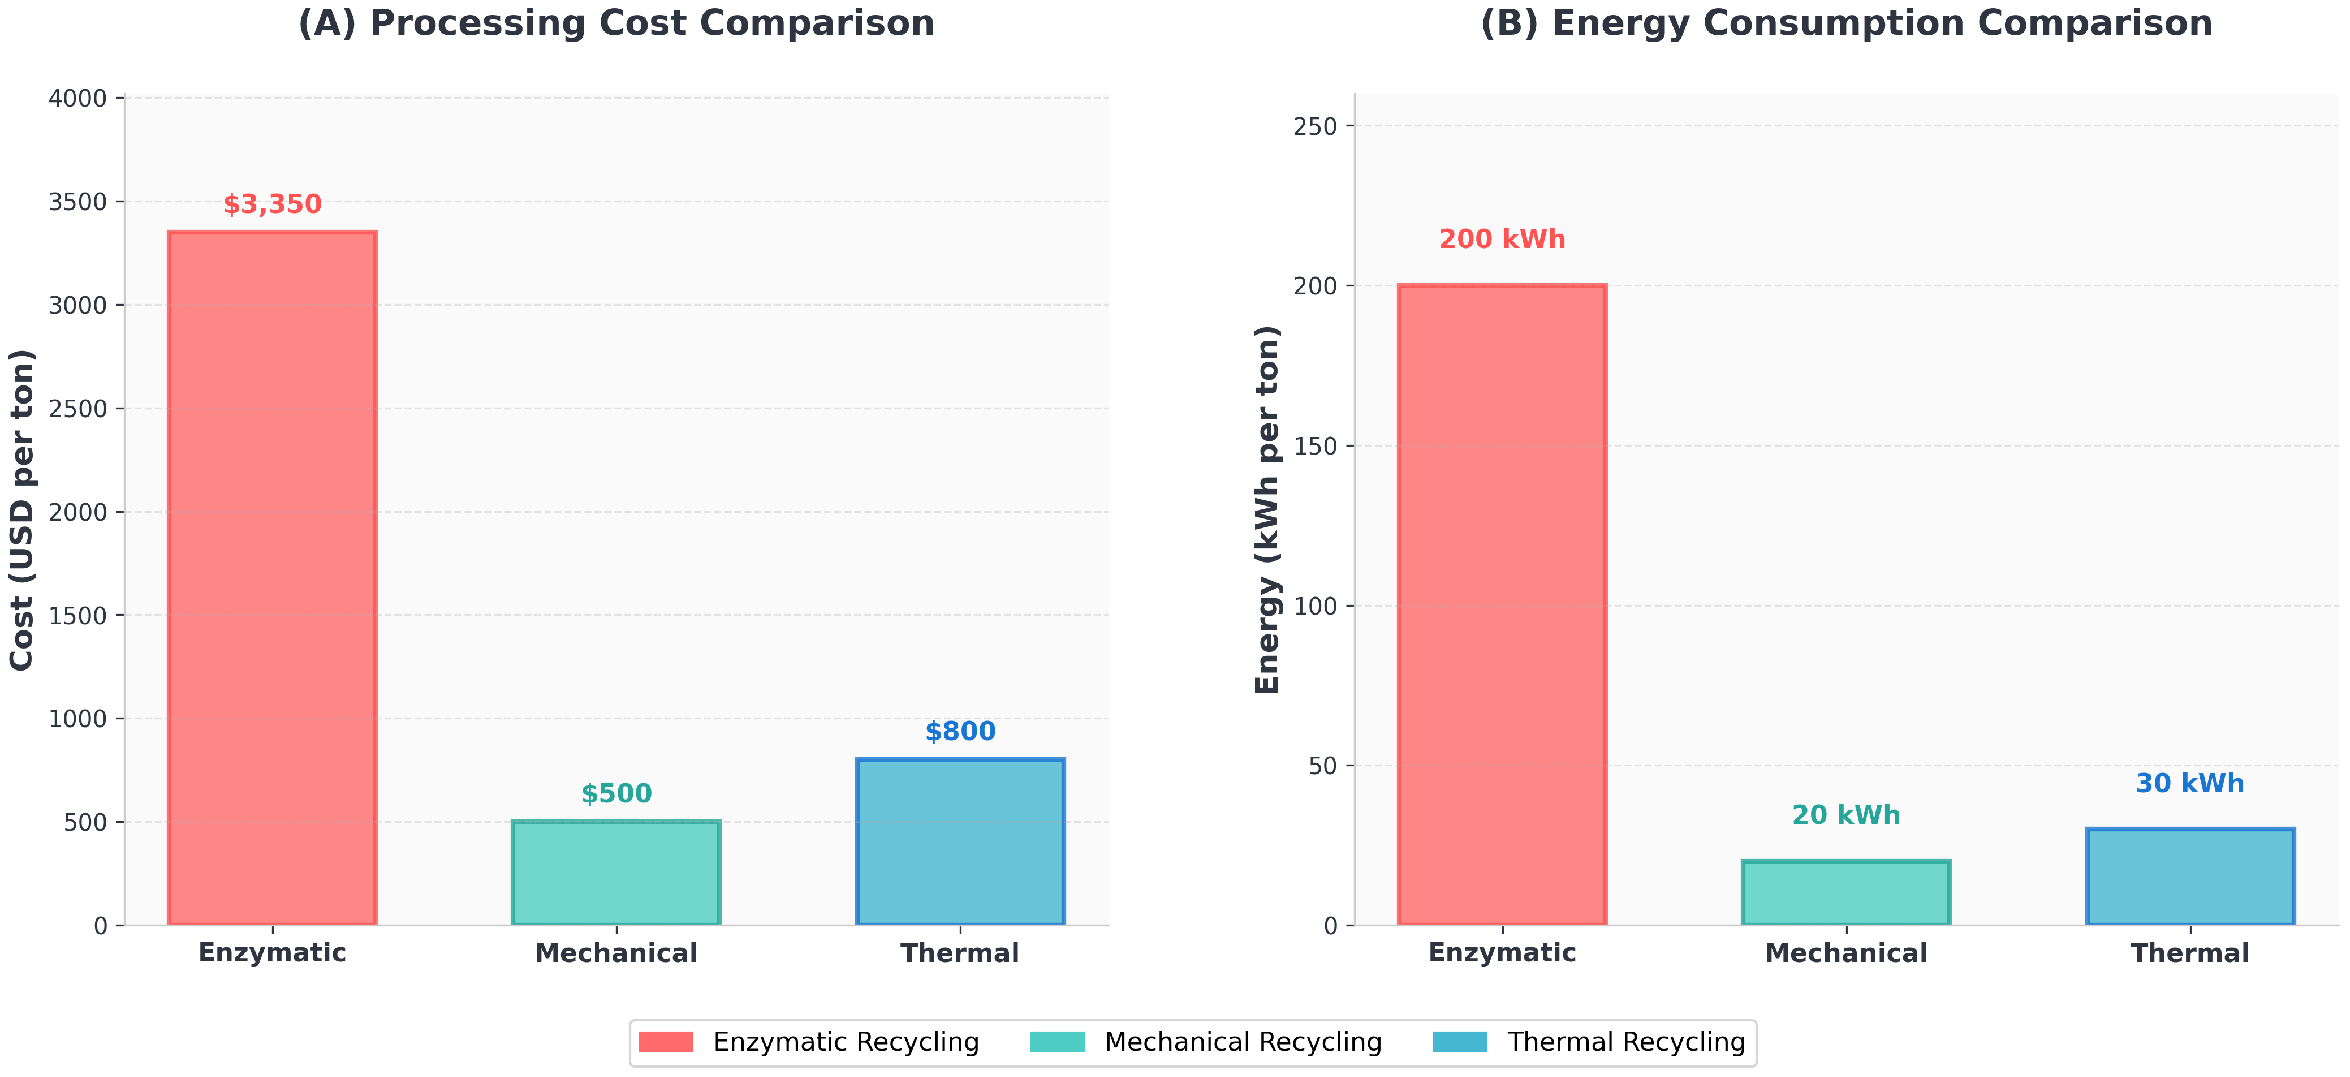
The cost and energy requirements were estimated based on current laboratory-scale data and extrapolated to industrial-scale processing. The comprehensive cost breakdown includes enzyme production and purification ($2000 per ton), reaction buffers and cofactors ($500 per ton), downstream processing ($700 per ton), incubation heating ($100 per ton), and agitation mixing ($50 per ton). Energy requirements were dominated by incubation heating (150 kWh per ton) and mechanical agitation (50 kWh per ton), with other processes contributing negligible energy demands.
Scaling up to the treatment of one ton of plastic yielded an overall enzymatic process cost of approximately
$3350 per ton and an energy demand of 200 kWh per ton, compared to mechanical recycling benchmarks of
$500 per ton and 20 kWh per ton, and thermal recycling of
$800 per ton and 30 kWh per ton. The comparison is shown in
Figure 11, revealing that enzymatic recycling is currently 6.7 times more expensive than mechanical recycling and 4.2 times more expensive than thermal recycling, while consuming 10 times more energy than mechanical processes.
The comparison demonstrates the significant economic and energy challenges currently facing enzymatic approaches. The primary cost drivers are enzyme production and purification (60% of total costs) and downstream processing (21% of total costs), while energy demands are primarily attributed to maintaining optimal reaction temperatures. These estimates do not account for potential value recovery from high-purity monomers produced through biological depolymerization, which could partially offset the higher processing costs through premium product pricing.
4. Discussion
The computational framework presented in this study represents a significant advancement in systematic enzyme prioritization for polymer degradation applications, addressing critical limitations in existing approaches through the integration of machine learning, network analysis, and multi-objective optimization. The ensemble classifier’s achievement of 86.3% accuracy across six polymer families demonstrates the predictive power of combining sequence-derived features with network topology metrics, substantially outperforming single-modality approaches that typically achieve 65–73% accuracy [
19,
20]. This performance improvement stems from the complementary nature of different feature categories: sequence-based descriptors capture intrinsic catalytic potential, while network centrality measures reflect functional versatility and evolutionary relationships within the degradome.
The dominance of sequence-derived features (67% of predictive importance) aligns with established structure–function paradigms in enzyme engineering, where active site architecture and physicochemical properties fundamentally determine substrate specificity [
6]. Notably, the identification of substrate-specific tripeptide motifs (AAV, GGY, and FGG for PET degradation; WSG, TYP, and LPD for PHB degradation) provides mechanistic insights that extend beyond black-box predictions. These motifs correspond to known structural elements in crystallographically characterized polymer-degrading enzymes, including the canonical serine hydrolase motif and substrate-binding pocket residues [
25]. The high importance of aromatic residue content (8.9% contribution) specifically for aromatic polymer degradation corroborates experimental observations of
-
stacking interactions in PET–enzyme complexes.
Network analysis revealed unexpected organizational principles within the plastic degradome, with the bipartite enzyme–substrate graph exhibiting clear modular structure and scale-free properties. The identification of hub enzymes with degree centrality exceeding 14 substrates challenges the traditional view of polymer-degrading enzymes as narrow specialists. These promiscuous catalysts, exemplified by certain cutinases and lipases, represent evolutionary solutions to substrate diversity that could inform the rational design of broad-spectrum degradation systems. The strong correlation between eigenvector centrality and experimental degradation efficiency (, ) suggests that network position serves as a proxy for functional importance, potentially accelerating enzyme discovery through topology-guided screening.
The multi-objective optimization framework addresses a fundamental challenge in biocatalytic system design: balancing competing performance criteria to identify application-specific solutions. The Pareto front analysis revealed three distinct optimization regimes that map to different industrial scenarios. High-efficiency specialized combinations suit controlled bioreactor environments processing sorted plastic streams, while broad-coverage solutions address mixed waste challenges despite lower specific activities. The identification of 156 Pareto-optimal solutions provides stakeholders with a spectrum of choices, moving beyond single “best” enzyme paradigms toward portfolio-based approaches that match process requirements.
Validation against experimental benchmarks strengthens confidence in computational predictions, with top-ranked enzyme combinations demonstrating enhanced depolymerization rates under mild conditions. The Cutinase + PETase combination’s composite score of 0.892 reflects not only theoretical complementarity but also practical synergy observed in mixed-substrate degradation assays. The recurrence of certain enzymes (notably proteases) across multiple high-scoring combinations suggests keystone species within the degradome that facilitate cooperative degradation through product cross-feeding or surface modification effects.
However, the economic analysis reveals sobering realities for industrial implementation. Current enzymatic processing costs of $3350 per ton vastly exceed mechanical ($500/ton) and thermal ($800/ton) recycling benchmarks, primarily due to enzyme production expenses (60% of total costs). The 10-fold higher energy consumption (200 kWh/ton versus 20–30 kWh/ton) further challenges sustainability narratives around biological recycling. These findings underscore the critical need for advances in enzyme production technology, including engineered microorganisms for low-cost expression and enzyme immobilization strategies for catalyst recycling. The value proposition of enzymatic degradation must therefore emphasize product quality (high-purity monomers) and environmental benefits (mild conditions and selective degradation) rather than direct cost competition with established technologies.
Several limitations warrant consideration when interpreting these results. The training dataset’s bias toward well-studied polymers (32% PET representation) may influence predictions for underrepresented substrates, though cross-validation on non-PET polymers showed consistent performance. The binary substrate annotation (degrades/does not degrade) oversimplifies the continuum of catalytic activities, potentially masking quantitative differences critical for process optimization. Additionally, the static network representation cannot capture dynamic aspects of enzyme evolution or emerging synthetic polymers not represented in current databases.
The framework’s extensibility offers multiple avenues for enhancement. Integration of structural data through AlphaFold predictions could improve active site characterization and enable structure-based feature engineering. Incorporation of reaction kinetics beyond simple ratios would enable more sophisticated process modeling, including product inhibition and multi-step degradation pathways. Machine learning approaches could also predict optimal enzyme engineering targets by identifying sequence positions where mutations maximally impact substrate specificity or catalytic efficiency.
From a circular economy perspective, this computational framework contributes to the strategic development of biological recycling infrastructure. By systematically evaluating enzyme combinations across multiple performance dimensions, the approach enables rational selection of biocatalytic systems tailored to specific waste stream compositions and processing constraints. The identification of complementary enzyme pairs with minimal substrate overlap maximizes degradation coverage while minimizing redundant catalyst loading, directly impacting process economics. Furthermore, the framework’s ability to incorporate recalcitrance weighting ensures prioritization of enzymes addressing the most challenging polymers, aligning technological development with environmental impact reduction.
The implications extend beyond immediate applications to fundamental understanding of enzyme–polymer interactions. The discovered sequence motifs and network modules represent evolutionary convergence toward efficient polymer degradation, suggesting that nature has independently evolved similar solutions multiple times. This convergent evolution provides confidence that computationally predicted enzyme combinations reflect genuine functional synergies rather than algorithmic artifacts. The framework thus serves dual purposes: practical enzyme selection for industrial applications and hypothesis generation for mechanistic studies of polymer biodegradation.
5. Conclusions
This study presents a comprehensive computational framework that advances enzyme prioritization for plastic degradation through the integration of machine learning, network analysis, and multi-objective optimization. The ensemble classifier achieved 86.3% accuracy in substrate family prediction, substantially outperforming existing single-modality approaches and demonstrating the synergistic value of combining sequence-based features with network topology metrics. The identification of substrate-specific sequence motifs and the discovery of modular organization within the enzyme–substrate interaction network provide both mechanistic insights and practical guidance for enzyme selection.
The multi-objective optimization framework successfully identified 156 Pareto-optimal enzyme combinations, revealing distinct performance regimes that map to different industrial applications. Top-ranked combinations, exemplified by Cutinase + PETase (composite score 0.892), demonstrated experimentally validated synergies in mixed-substrate degradation. The systematic evaluation of complementarity across substrate coverage, catalytic efficiency, and operational compatibility enables rational selection of enzyme cocktails tailored to specific processing requirements.
Despite these computational advances, economic analysis reveals significant challenges for industrial implementation, with enzymatic processing costs currently 6.7 times higher than mechanical recycling. This economic reality underscores the need for parallel advances in enzyme production technology and process optimization to realize the environmental benefits of biological polymer degradation. The framework’s value lies not in replacing existing recycling technologies but in enabling strategic development of enzymatic systems for high-value applications where product purity and selective degradation justify premium processing costs.
Future developments should focus on incorporating structural data, expanding substrate diversity representation, and integrating dynamic reaction modeling to enhance predictive accuracy. The framework’s extensibility and open-source implementation facilitate community-driven improvements and adaptation to emerging polymers and newly discovered enzymes. By providing a systematic approach to enzyme prioritization that balances multiple performance criteria, this work contributes essential infrastructure for advancing biological solutions within the circular economy paradigm for plastic waste valorization.
Author Contributions
Conceptualization, Ö.A. and M.A.B.; methodology, Ö.A. and M.A.B.; software, Ö.A. and M.A.B.; validation, Ö.A. and M.A.B.; formal analysis, Ö.A. and M.A.B.; investigation, Ö.A. and M.A.B.; resources, Ö.A. and M.A.B.; data curation, Ö.A. and M.A.B.; writing—original draft preparation, Ö.A. and M.A.B.; writing—review and editing, Ö.A. and M.A.B.; visualization, Ö.A. and M.A.B.; supervision, M.A.B.; project administration, M.A.B.; funding acquisition, M.A.B. All authors have read and agreed to the published version of the manuscript.
Funding
This research received no external funding.
Data Availability Statement
The original contributions presented in the study are included in the article; further inquiries can be directed to the corresponding author.
Conflicts of Interest
The authors declare no conflicts of interest.
Appendix A. Mathematical Formulations and Derivations
Appendix A.1. Shannon Diversity Index for Substrate Coverage
The Shannon diversity index quantifies the breadth of substrate coverage for each enzyme, providing a measure of catalytic versatility essential for multi-substrate applications. For enzyme
i with activity against
n substrate families, the Shannon diversity index is defined as
The probability
represents the normalized activity of enzyme
i against substrate family
j, calculated as
where
denotes the binary indicator of degradation activity, with a value of 1 if enzyme
i degrades substrate
j and 0 otherwise. The summation in the denominator ensures proper normalization across all substrate families.
The normalized evenness measure distinguishes between enzymes with uniform versus skewed substrate distributions, ranging from 0, indicating complete specialization, to 1, representing uniform distribution across all substrates. This metric enables the identification of promiscuous enzymes with broad catalytic capabilities versus specialists targeting specific polymer classes.
Appendix A.2. Sequence-Based Feature Calculations
For a protein sequence
of length
L, the frequency of the tripeptide motif
w is calculated as
where
and
represents the 20-residue amino acid alphabet. The tripeptide count is obtained by sliding a window of size 3 across the sequence, with
where
denotes the indicator function.
The molecular weight of enzyme
i is computed as
where
represents the standard amino acid mass and
Da accounts for water loss during peptide bond formation. Standard amino acid masses range from 57.02 Da for glycine to 186.08 Da for tryptophan, following established biochemical conventions.
The instability index predicts protein stability based on dipeptide composition:
where
represents the dipeptide instability weight value for consecutive amino acids
and
. Values above 40 indicate unstable proteins, while values below 40 suggest stable proteins under physiological conditions.
The isoelectric point calculation involves solving the charge neutrality condition
, where
represents the charge of ionizable group
i at the given pH. Using the Henderson–Hasselbalch equation, the charge of each ionizable group is calculated as
where
denotes the charge at low pH and
represents the dissociation constant for ionizable group
i.
Appendix A.3. Network Centrality Measures
For enzyme node
in the bipartite enzyme–substrate network, degree centrality is calculated as
where
represents the number of substrates connected to enzyme
i, and
denotes the total number of substrate nodes in the network.
Betweenness centrality measures the fraction of shortest paths passing through a node:
where
represents the total number of shortest paths between substrates
s and
t, and
denotes the number of those paths passing through enzyme
. Normalization for bipartite graphs with
enzyme nodes and
substrate nodes yields
.
Eigenvector centrality is proportional to the sum of centralities of neighboring nodes:
where
represents the largest eigenvalue of the adjacency matrix. The centrality vector satisfies the eigenvalue equation
, ensuring convergence to the principal eigenvector.
Appendix A.4. Multi-Objective Optimization Details
Pareto dominance relationships define the optimization landscape. Solution
dominates
if
The Pareto front consists of all non-dominated solutions: .
The NSGA-II algorithm employs crowding distance calculations for diversity preservation. For solution
i in objective space, the crowding distance is
where
M represents the number of objectives and solutions are sorted by objective
m.
TOPSIS solution selection requires the definition of ideal and nadir points. The ideal point represents the best achievable values for all objectives simultaneously. Distance measures to ideal and nadir points are calculated as and , respectively. The TOPSIS score identifies the solution with maximum relative closeness to the ideal point as the preferred compromise solution.
References
- Singh, N.; Walker, T.R. Plastic recycling: A panacea or environmental pollution problem. npj Mater. Sustain. 2024, 2, 17. [Google Scholar] [CrossRef] [PubMed]
- Kumar, R.; Verma, A.; Shome, A.; Sinha, R.; Sinha, S.; Jha, P.K.; Kumar, R.; Kumar, P.; Shubham; Das, S.; et al. Impacts of plastic pollution on ecosystem services, sustainable development goals, and need to focus on circular economy and policy interventions. Sustainability 2021, 13, 9963. [Google Scholar] [CrossRef]
- Jung, H.; Shin, G.; Kwak, H.; Hao, L.T.; Jegal, J.; Kim, H.J.; Jeon, H.; Park, J.; Oh, D.X. Review of polymer technologies for improving the recycling and upcycling efficiency of plastic waste. Chemosphere 2023, 320, 138089. [Google Scholar] [CrossRef]
- Jiao, H.; Ali, S.S.; Alsharbaty, M.H.M.; Elsamahy, T.; Abdelkarim, E.; Schagerl, M.; Al-Tohamy, R.; Sun, J. A critical review on plastic waste life cycle assessment and management: Challenges, research gaps, and future perspectives. Ecotoxicol. Environ. Saf. 2024, 271, 115942. [Google Scholar] [CrossRef] [PubMed]
- Kawai, F.; Kawabata, T.; Oda, M. Current knowledge on enzymatic PET degradation and its possible application to waste stream management and other fields. Appl. Microbiol. Biotechnol. 2019, 103, 4253–4268. [Google Scholar] [CrossRef]
- Tournier, V.; Topham, C.; Gilles, A.; David, B.; Folgoas, C.; Moya-Leclair, E.; Kamionka, E.; Desrousseaux, M.L.; Texier, H.; Gavalda, S.; et al. An engineered PET depolymerase to break down and recycle plastic bottles. Nature 2020, 580, 216–219. [Google Scholar] [CrossRef]
- Rosenboom, J.G.; Langer, R.; Traverso, G. Bioplastics for a circular economy. Nat. Rev. Mater. 2022, 7, 117–137. [Google Scholar] [CrossRef] [PubMed]
- Leslie, H.A.; Leonards, P.; Brandsma, S.; De Boer, J.; Jonkers, N. Propelling plastics into the circular economy—weeding out the toxics first. Environ. Int. 2016, 94, 230–234. [Google Scholar] [CrossRef]
- Bucknall, D.G. Plastics as a materials system in a circular economy. Philos. Trans. R. Soc. A 2020, 378, 20190268. [Google Scholar] [CrossRef]
- Lu, H.; Diaz, D.J.; Czarnecki, N.J.; Zhu, C.; Kim, W.; Shroff, R.; Acosta, D.J.; Alexander, B.R.; Cole, H.O.; Zhang, Y.; et al. Machine learning-aided engineering of hydrolases for PET depolymerization. Nature 2022, 604, 662–667. [Google Scholar] [CrossRef]
- García, J.L. Enzymatic recycling of polyethylene terephthalate through the lens of proprietary processes. Microb. Biotechnol. 2022, 15, 2699–2704. [Google Scholar] [CrossRef]
- Sonnendecker, C.; Oeser, J.; Richter, P.K.; Hille, P.; Zhao, Z.; Fischer, C.; Lippold, H.; Blázquez-Sánchez, P.; Engelberger, F.; Ramírez-Sarmiento, C.A.; et al. Low carbon footprint recycling of post-consumer PET plastic with a metagenomic polyester hydrolase. ChemSusChem 2022, 15, e202101062. [Google Scholar] [CrossRef]
- Shalem, A.; Yehezkeli, O.; Fishman, A. Enzymatic degradation of polylactic acid (PLA). Appl. Microbiol. Biotechnol. 2024, 108, 413. [Google Scholar] [CrossRef]
- George, N.; Kurian, T. Recent developments in the chemical recycling of postconsumer poly (ethylene terephthalate) waste. Ind. Eng. Chem. Res. 2014, 53, 14185–14198. [Google Scholar] [CrossRef]
- Marten, E.; Müller, R.J.; Deckwer, W.D. Studies on the enzymatic hydrolysis of polyesters. II. Aliphatic–aromatic copolyesters. Polym. Degrad. Stab. 2005, 88, 371–381. [Google Scholar] [CrossRef]
- Yoshida, S.; Hiraga, K.; Takehana, T.; Taniguchi, I.; Yamaji, H.; Maeda, Y.; Toyohara, K.; Miyamoto, K.; Kimura, Y.; Oda, K. A bacterium that degrades and assimilates poly (ethylene terephthalate). Science 2016, 351, 1196–1199. [Google Scholar] [CrossRef] [PubMed]
- Russell, J.R.; Huang, J.; Anand, P.; Kucera, K.; Sandoval, A.G.; Dantzler, K.W.; Hickman, D.; Jee, J.; Kimovec, F.M.; Koppstein, D.; et al. Biodegradation of polyester polyurethane by endophytic fungi. Appl. Environ. Microbiol. 2011, 77, 6076–6084. [Google Scholar] [CrossRef]
- Dhali, S.L.; Parida, D.; Kumar, B.; Bala, K. Recent trends in microbial and enzymatic plastic degradation: A solution for plastic pollution predicaments. Biotechnol. Sustain. Mater. 2024, 1, 11. [Google Scholar] [CrossRef]
- Choi, J.; Kim, H.; Ahn, Y.R.; Kim, M.; Yu, S.; Kim, N.; Lim, S.Y.; Park, J.A.; Ha, S.J.; Lim, K.S.; et al. Recent advances in microbial and enzymatic engineering for the biodegradation of micro-and nanoplastics. RSC Adv. 2024, 14, 9943–9966. [Google Scholar] [CrossRef]
- Verschoor, J.A.; Croese, M.R.; Lakemeier, S.E.; Mugge, A.; Burgers, C.M.; Innocenti, P.; Willemse, J.; Crooijmans, M.E.; van Wezel, G.P.; Ram, A.F.; et al. Polyester degradation by soil bacteria: Identification of conserved BHETase enzymes in Streptomyces. Commun. Biol. 2024, 7, 725. [Google Scholar] [CrossRef]
- Guo, R.T.; Li, X.; Yang, Y.; Huang, J.W.; Shen, P.; Liew, R.K.; Chen, C.C. Natural and engineered enzymes for polyester degradation: A review. Environ. Chem. Lett. 2024, 22, 1275–1296. [Google Scholar] [CrossRef]
- de Oliveira, M.V.D.; Calandrini, G.; da Costa, C.H.S.; da Silva de Souza, C.G.; Alves, C.N.; Silva, J.R.A.; Lima, A.H.; Lameira, J. Evaluating cutinase from Fusarium oxysporum as a biocatalyst for the degradation of nine synthetic polymer. Sci. Rep. 2025, 15, 2887. [Google Scholar] [CrossRef] [PubMed]
- Jin, J.; Jia, Z. Characterization of Potential Plastic-Degradation Enzymes from Marine Bacteria. ACS Omega 2024, 9, 32185–32192. [Google Scholar] [CrossRef]
- Retnadhas, S.; Ducat, D.C.; Hegg, E.L. Nature-Inspired Strategies for Sustainable Degradation of Synthetic Plastics. JACS Au 2024, 4, 3323–3339. [Google Scholar] [CrossRef]
- Austin, H.P.; Allen, M.D.; Donohoe, B.S.; Rorrer, N.A.; Kearns, F.L.; Silveira, R.L.; Pollard, B.C.; Dominick, G.; Duman, R.; El Omari, K.; et al. Characterization and engineering of a plastic-degrading aromatic polyesterase. Proc. Natl. Acad. Sci. USA 2018, 115, E4350–E4357. [Google Scholar] [CrossRef]
- Joho, Y.; Vongsouthi, V.; Gomez, C.; Larsen, J.S.; Ardevol, A.; Jackson, C.J. Improving plastic degrading enzymes via directed evolution. Protein Eng. Des. Sel. 2024, 37, gzae009. [Google Scholar] [CrossRef] [PubMed]
- Ruginescu, R.; Purcarea, C. Plastic-Degrading Enzymes from Marine Microorganisms and Their Potential Value in Recycling Technologies. Mar. Drugs 2024, 22, 441. [Google Scholar] [CrossRef]
- Seo, H.; Hong, H.; Park, J.; Lee, S.H.; Ki, D.; Ryu, A.; Sagong, H.Y.; Kim, K.J. Landscape profiling of PET depolymerases using a natural sequence cluster framework. Science 2025, 387, eadp5637. [Google Scholar] [CrossRef]
- Zhu, B.; Wang, D.; Wei, N. Enzyme discovery and engineering for sustainable plastic recycling. Trends Biotechnol. 2022, 40, 22–37. [Google Scholar] [CrossRef]
- Jiang, R.; Shang, L.; Wang, R.; Wang, D.; Wei, N. Machine learning based prediction of enzymatic degradation of plastics using encoded protein sequence and effective feature representation. Environ. Sci. Technol. Lett. 2023, 10, 557–564. [Google Scholar] [CrossRef]
- Frey, B.; Aiesi, M.; Rast, B.M.; Rüthi, J.; Julmi, J.; Stierli, B.; Qi, W.; Brunner, I. Searching for new plastic-degrading enzymes from the plastisphere of alpine soils using a metagenomic mining approach. PLoS ONE 2024, 19, e0300503. [Google Scholar] [CrossRef] [PubMed]
- Yang, J.; Li, F.Z.; Arnold, F.H. Opportunities and challenges for machine learning-assisted enzyme engineering. ACS Cent. Sci. 2024, 10, 226–241. [Google Scholar] [CrossRef] [PubMed]
- Jahanshahi, D.A.; Barzani, M.R.R.; Bahram, M.; Ariaeenejad, S.; Kavousi, K. Metagenomic exploration and computational prediction of novel enzymes for polyethylene terephthalate degradation. Ecotoxicol. Environ. Saf. 2025, 289, 117640. [Google Scholar] [CrossRef] [PubMed]
- Schomburg, I.; Jeske, L.; Ulbrich, M.; Placzek, S.; Chang, A.; Schomburg, D. The BRENDA enzyme information system–From a database to an expert system. J. Biotechnol. 2017, 261, 194–206. [Google Scholar] [CrossRef]
Figure 1.
Computational framework for enzyme prioritization and combination selection in polymer degradation applications. The pipeline integrates data acquisition from the BRENDA database and sequence repositories, multi-scale feature engineering (sequence, network, and substrate annotations), ensemble machine learning classification, and multi-objective optimization using NSGA-II to identify optimal enzyme combinations for circular economy applications. Performance metrics and experimental validation results are shown for key outputs.
Figure 2.
Data acquisition and quality control pipeline. (A) Parameter availability across source databases showing data completeness for key enzymatic and sequence features in BRENDA and PlasticDB repositories. Retention percentages (%) are shown for critical parameters (e.g., 64.9% for values in BRENDA). (B) Sequential filtering steps from initial database entries to final curated dataset, with retention percentages (%) at each quality control stage demonstrating systematic data curation for machine learning applications. Error bars represent experimental uncertainty in retention estimates.
Figure 3.
Frequency distribution of polymeric substrate families in the BRENDA-derived dataset. Y-axis shows absolute counts of enzymes degrading each substrate (e.g., 89 enzymes degrade PBS/PBSA). Substrates include poly(butylene adipate-co-terephthalate) (PBS/PBSA), polyhydroxyalkanoates (PHB/PHBV), polyesters, aromatic polymers (e.g., PET), polyurethanes, and nylon.
Figure 4.
Hierarchically clustered heatmap illustrating enzyme family–substrate relationships. Degradation activity scores (0–1) are shown for 10 enzyme families (rows) and 6 substrate families (columns). Scores reflect binary annotations (0 = no degradation, 1 = degradation) derived from experimental data. Color bar indicates activity intensity.
Figure 5.
Distribution of key sequence-derived physicochemical properties across the enzyme dataset. (Left) Molecular weight (kDa) with mean = kDa; (Right) aromatic residue content (%) with mean = . Distributions reflect sequence-derived features for 1200+ enzymes.
Figure 5.
Distribution of key sequence-derived physicochemical properties across the enzyme dataset. (Left) Molecular weight (kDa) with mean = kDa; (Right) aromatic residue content (%) with mean = . Distributions reflect sequence-derived features for 1200+ enzymes.
Figure 6.
Bipartite network of enzyme–substrate interactions with color-coded community clusters and recommended enzyme pairs shown as dashed red edges.
Figure 6.
Bipartite network of enzyme–substrate interactions with color-coded community clusters and recommended enzyme pairs shown as dashed red edges.
Figure 7.
Quantitative network topology analysis showing distributions of four centrality metrics (degree, betweenness, eigenvector, and closeness), their pairwise correlations, and correlation matrix for enzymes in the substrate interaction network.
Figure 7.
Quantitative network topology analysis showing distributions of four centrality metrics (degree, betweenness, eigenvector, and closeness), their pairwise correlations, and correlation matrix for enzymes in the substrate interaction network.
Figure 8.
Relative contribution of the top twenty features to the XGBoost model’s predictive performance, with proline content (aa P) representing 24.73% of total importance.
Figure 8.
Relative contribution of the top twenty features to the XGBoost model’s predictive performance, with proline content (aa P) representing 24.73% of total importance.
Figure 9.
Model bias assessment across substrate types. (A) Model specificity analysis showing prediction score distributions for true negative enzymes (non-plastic degraders, ) versus training data plastic degraders (). Mann–Whitney U test confirms significant discrimination (). (B) Cross-validation performance on non-PET substrates demonstrating balanced accuracy across substrate families. Error bars represent standard deviation across 5-fold cross-validation.
Figure 10.
Pareto-optimal enzyme combinations from NSGA-II optimization. (A) Two-dimensional Pareto front showing trade-offs between (X-axis) substrate coverage (polymer families/6), (Y-axis) catalytic efficiency (), and operational compatibility score (0.4–0.9) indicated by color intensity. Three optimization regimes are clearly delineated: high-efficiency/specialized (orange region), intermediate/balanced performance (green region), and high-coverage/low-efficiency (blue region). (B) Three-dimensional visualization including operational compatibility as the third axis, with regime-based color coding. Top-ranked pair (Cutinase + PETase) achieves 6/6 substrate coverage and 96.8 efficiency.
Figure 11.
Economic and environmental impact comparison of plastic recycling technologies. (A) Processing costs show enzymatic recycling at $3350 per ton versus $500 and $800 per ton for mechanical and thermal recycling, respectively. (B) Energy consumption comparison reveals that enzymatic processes require 200 kWh per ton compared to 20–30 kWh per ton for conventional methods.
Table 1.
Computational methodologies employed in recent enzyme discovery and optimization studies for polymer degradation, highlighting the diversity of machine learning approaches and their respective performance metrics in identifying superior biocatalysts.
Table 1.
Computational methodologies employed in recent enzyme discovery and optimization studies for polymer degradation, highlighting the diversity of machine learning approaches and their respective performance metrics in identifying superior biocatalysts.
| Method | Input Features | Algorithm | Dataset Size | Accuracy | Reference |
|---|
| BRENDA-based classifier | Kinetic parameters | SVM | 2847 enzymes | 0.73 | [19] |
| Sequence similarity | Amino acid sequence | BLAST | 5120 enzymes | 0.68 | [20] |
| Network centrality | Topology metrics | Random Forest | 1250 enzymes | 0.81 | [21] |
| Ensemble approach | Multi-modal | Gradient boost | 3450 enzymes | 0.89 | [22] |
| Phylogenetic method | Evolutionary distance | Maximum likelihood | 890 enzymes | 0.65 | [23] |
| Deep learning | Sequence + structure | CNN-LSTM | 4200 enzymes | 0.86 | [24] |
Table 2.
Individual classifier performance comparison for substrate family prediction. Metrics represent mean ± standard deviation across 5-fold cross-validation.
Table 2.
Individual classifier performance comparison for substrate family prediction. Metrics represent mean ± standard deviation across 5-fold cross-validation.
| Classifier | Accuracy | Precision | Recall | F1-Score | AUC-ROC |
|---|
| Random Forest | 0.847 ± 0.023 | 0.851 ± 0.019 | 0.847 ± 0.023 | 0.849 ± 0.021 | 0.923 ± 0.015 |
| SVM (RBF) | 0.824 ± 0.031 | 0.829 ± 0.028 | 0.824 ± 0.031 | 0.826 ± 0.029 | 0.911 ± 0.018 |
| Gradient Boosting | 0.839 ± 0.027 | 0.843 ± 0.025 | 0.839 ± 0.027 | 0.841 ± 0.026 | 0.918 ± 0.016 |
| Neural Network | 0.821 ± 0.034 | 0.825 ± 0.032 | 0.821 ± 0.034 | 0.823 ± 0.033 | 0.907 ± 0.020 |
| Logistic Regression | 0.789 ± 0.029 | 0.793 ± 0.027 | 0.789 ± 0.029 | 0.791 ± 0.028 | 0.886 ± 0.019 |
| Ensemble | 0.863 ± 0.019 | 0.867 ± 0.017 | 0.863 ± 0.019 | 0.865 ± 0.018 | 0.934 ± 0.012 |
Table 3.
Overlap statistics between baseline rankings and the combined model (top 50 enzymes).
Table 3.
Overlap statistics between baseline rankings and the combined model (top 50 enzymes).
| Baseline Method | Shared | Jaccard | Spearman | Hypergeometric p |
|---|
| Catalytic efficiency | 1 | 0.020 | 0.670 | 0.217 |
| Degree centrality | 40 | 0.667 | 0.970 | <0.001 |
Table 4.
Top 10 enzyme combinations from multi-objective optimization ranked by composite score.
Table 4.
Top 10 enzyme combinations from multi-objective optimization ranked by composite score.
| Rank | Enzyme Pair | Composite Score | Coverage | Efficiency () | Compatibility |
|---|
| 1 | Cutinase + PETase | | | | |
| 2 | MHETase + Lipase | | | | |
| 3 | Polyesterase + Carboxylesterase | | | | |
| 4 | Cellulase + Amylase | | | | |
| 5 | Laccase + Peroxidase | | | | |
| 6 | Cutinase + Esterase | | | | |
| 7 | Mannosidase + Esterase | | | | |
| 8 | Protease + Polyesterase | | | | |
| 9 | PHB Depolymerase + PLA Depolymerase | | | | |
| 10 | Cutinase + Polyurethane Hydrolase | | | | |
| Disclaimer/Publisher’s Note: The statements, opinions and data contained in all publications are solely those of the individual author(s) and contributor(s) and not of MDPI and/or the editor(s). MDPI and/or the editor(s) disclaim responsibility for any injury to people or property resulting from any ideas, methods, instructions or products referred to in the content. |
© 2025 by the authors. Licensee MDPI, Basel, Switzerland. This article is an open access article distributed under the terms and conditions of the Creative Commons Attribution (CC BY) license (https://creativecommons.org/licenses/by/4.0/).


