Article

Study on Seepage Model of Staged-Fractured Horizontal Well in Low Permeability Reservoir

1
Beijing Yadan Petroleum Technology Co., Ltd., Beijing 102200, China
2
College of Petroleum Engineering, Xi’an Shiyou University, Xi’an 710065, China
3
The Key Laboratory of Well Stability and Fluid & Rock Mechanics in Oil and Gas Reservoir of Shaanxi Province, Xi’an Shiyou University, Xi’an 710065, China
4
Petroleum Exploration and Production Research Institute, Sinopec, Beijing 102206, China
*
Author to whom correspondence should be addressed.
Processes 2025, 13(6), 1934; https://doi.org/10.3390/pr13061934 (registering DOI)
Submission received: 14 May 2025 / Revised: 4 June 2025 / Accepted: 11 June 2025 / Published: 18 June 2025
(This article belongs to the Section Energy Systems)

Abstract

:
This study addresses the coupled influence of the threshold pressure gradient and stress sensitivity during the seepage process in low-permeability reservoirs. By integrating Laplace transform, perturbation transform, the image principle, and the superposition principle, a non-steady-state seepage model for segmented-fractured horizontal wells considering both effects is established for the first time. The analytical solution of the point source function including the threshold pressure gradient ( λ ) and stress sensitivity effect (permeability modulus α ) is innovatively derived and extended to closed-boundary reservoirs. The model accuracy is verified by CMG numerical simulation (with an error of only 1.02%). Based on this, the seepage process is divided into four stages: I linear flow (pressure derivative slope of 0.5), II fracture radial flow (slope of 0), III dual radial flow (slope of 0.36), and IV pseudo-radial flow (slope of 0). Sensitivity analysis indicates the following: (1) The threshold pressure gradient significantly increases the seepage resistance in the late stage (the pressure curve shows a significant upward curvature when λ = 0.1 MPa/m); (2) Stress sensitivity dominates the energy dissipation in the middle and late stages (a closed-boundary-like feature is presented when α > 0.1 MPa−1); (3) The half-length of fractures dominates the early flow (a 100 m fracture reduces the pressure drop by 40% compared to a 20 m fracture). This model resolves the accuracy deficiency of traditional single-effect models and provides theoretical support for the development effect evaluation and well test interpretation of fractured horizontal wells in low-permeability reservoirs.

1. Introduction

A large number of experimental studies have shown that low-permeability reservoirs have the effect of starting pressure gradient and reservoir stress sensitivity [1]. Bear et al. [2] and Feng Wenguang et al. [3] describe the nonlinear change of reservoir seepage caused by starting pressure gradient through the segmentation function, including linear approximation, power index function approximation, quadratic function approximation, etc. [4,5]. The stress-sensitive representation model is usually based on the fitting of relevant theoretical formulas and experimental results. From the expression of the relationship between permeability and effective stress, it can be divided into power model, exponential model, binomial model, and logarithmic model [6]. Many domestic and foreign scholars have established the seepage model of staged-fractured horizontal well in low-permeability reservoir on the basis of starting the pressure gradient or stress-sensitive characterization model. CHENG et al. [7] established vertical well seepage models in homogeneous and dual medium reservoirs considering the starting pressure gradient. GUO J [8] established a mathematical model of unsteady seepage flow in horizontal wells considering the starting pressure gradient of tight gas reservoirs. Since then, many scholars have established unsteady seepage flow models of vertical wells, horizontal wells and fractured horizontal wells considering starting pressure gradient [9,10,11,12,13]. Pedrosa and Petrobras [14] proposed the concept of permeability modulus on the basis of stress-sensitive experiments, established the expression of permeability and pressure drop, and based on this, established the transient pressure prediction model of vertical wells considering stress sensitivity. Since then, scholars have done a lot of research on stress-sensitive reservoirs, and found that in low-permeability reservoirs, not considering the influence of stress sensitivity will bring great errors. Qu Zhanqing et al. [15] conducted experimental analysis on the start-up pressure gradient and stress sensitivity effect of tight oil reservoirs, and concluded that the stress sensitivity effect can cause changes in the start-up pressure gradient, suggesting that the stress sensitivity factor in tight oil reservoirs cannot be ignored. Wang Jing [16] et al. comprehensively considered the two factors of start-up pressure gradient and stress sensitivity effect, established a mathematical model of oil–water two-phase flow, and verified it using reservoir seepage numerical simulation software. They believed that both factors would lead to a decrease in the recovery rate of tight oil reservoirs. Liu Botao [17] et al. combined multiple factors such as the start-up pressure gradient, stress sensitivity, and finite conductivity of fractures in tight oil reservoirs, and then derived and solved the seepage model of fractured horizontal wells in dual-porosity media reservoirs. GUO [18] et al. conducted numerical simulation research on the productivity of segmented-fractured horizontal wells in low-permeability oil reservoirs based on the dual-porosity and dual-permeability model, and analyzed the influence of reservoir properties and fracture parameters on productivity. Larsen et al. [19], Raghavan et al. [20], Chen et al. [21], Ozkan et al. [22], Yao Jun et al. [23], Su Yuliang et al. [24], and Ren Zongxiao [25,26] et al. established a stress-sensitive source function by means of Laplace transform and superposition principle, which did not consider the influence of starting pressure gradient. Considering the stress sensitivity of natural fractures, Li Zhong et al. established the seepage model of volumetric fractured horizontal wells without considering the influence of starting pressure gradient.
When studying the seepage model of low-permeability reservoir, most scholars usually only consider the starting pressure gradient or stress sensitivity effect [27,28,29,30,31,32], which leads to low calculation accuracy. Therefore, based on the previous studies, the seepage model of staged-fractured horizontal wells in low-permeability reservoir is established by using the concept of source function, which considers the influence of starting pressure gradient and stress sensitivity. Further, compared with the single-effect model, the coupled solution in the article will have a smaller prediction error in the later flow.

2. Source Function of Low-Permeability Reservoir

2.1. Physical Model Description and Assumptions

There is a point source in an infinite homogeneous low-permeability reservoir of equal thickness (Figure 1), and a point source with constant production exists at the origin of coordinates when t = 0; the pressure drop generated by the point source at any point in the formation is studied.
Assumed condition:
  • The pressure distribution in the initial state of low-permeability reservoir is uniform, considering the starting pressure gradient and stress sensitivity effect;
  • Reservoir rocks and fluids are slightly compressible, and the compressibility coefficient is constant;
  • The effects of formation temperature changes and gravity factors are ignored.
According to the above physical description and assumed conditions, if the cumulative output liquid quantity is q ˜ when t = 0, and the instantaneous outflow point source flow rate is q(t), then the relationship between the them can be expressed as follows:
0 t q t d t = q ˜
Considering the stress-sensitive effect of the reservoir, the permeability expression [14] becomes
K = K i f e α p i p
It is known from the continuity condition that the flow of fluid near the point source into the point source is the same as that of the flow out of the point source. In combination with Equation (2), the inflow and outflow relationship at the point source can be expressed as
lim ε 0 4 π K r 2 μ p d r λ r D = ε = q ˜ δ t

2.2. Seepage Mathematical Model

Fluid motion equation [33] for low-permeability reservoir considering starting pressure gradient can be expressed as
v = K μ Δ p r λ
The unsteady continuity equation of low-permeability reservoir is
ρ ϕ t + d i v ρ v = 0
This equation characterizes the dynamic response mechanism of permeability to effective stress by introducing the stress sensitivity coefficient.
The state equation of elastic fluid is
ρ = ρ 0 1 + C L p p 0
The state equation of elastic porous media is
ϕ = ϕ 0 + C f p p 0
The continuity Equation (5) is rewritten in spherical coordinates, taking into account the starting pressure, as follows:
K μ 1 r 2 r r 2 Δ p r λ = ϕ C t Δ p t
Assuming that the initial pressure is equal in all parts of the reservoir, then
Δ p r , t = 0 = 0
The outer boundary condition is (infinite formation)
Δ p r , t = 0
The inner boundary conditions are shown in Equation (3).
Substituting Equation (2) into Equation (8) can obtain the following:
e α Δ p K i f μ 1 r 2 r r 2 Δ p r λ = ϕ C t Δ p t
Since Equation (5) is a strongly nonlinear partial differential equation, the perturbation transformation order is introduced:
Δ p = l n ( 1 α η ) α
This dimensionless number characterizes the intensity of the coupling effect between the fracture interference effect and the wellbore storage effect.
From the perturbation transformation, we can obtain the following:
Δ p r = 1 1 α η η r Δ p t = 1 1 α η η t
Write η and 1 1 α η as a power series,
η = η 0 + α η 1 + α 2 η 2 + α 3 η 3 + 1 1 α η = 1 + α η + α 2 η 2 + α 3 η 3 +
Because the value of permeability modulus α is small, the 0-order perturbation solution can fully meet the reservoir engineering calculation requirements. By substituting Equations (13) and (14) into Equation (11), the linear seepage differential equation of low-permeability reservoir considering stress sensitivity and starting pressure gradient can be obtained:
2 η o r 2 + 2 r η o r 2 λ r = ϕ μ C t K i f η o t
Define dimensionless variables as follows:
r D = r L         t D = K i f t ϕ μ C t L 2         η D = 2 π K i f h η q μ         λ D = 2 π K i f h L q μ λ
The dimensionless treatment of Equation (15) gives the following:
2 η D 0 r D 2 + 2 r D η D 0 r D 2 λ D L r D = η D 0 t D
Laplace transform is applied to Equation (17) to obtain the mathematical model of point source in Laplace space:
d 2 η ¯ D 0 ( r , s ) d r D 2 + 2 r D d η ¯ D 0 ( r , s ) d r D 2 λ D L r D s s η ¯ D 0 ( r , s ) = 0
To solve Equation (18), first construct a particular solution of Equation (18):
η ¯ D 0 * r , s = 2 λ D L s 2 r D 1 e r D s
The second order homogeneous equation corresponding to Equation (18) is given as follows:
d 2 η ¯ D 0 ( r , s ) d r D 2 + 2 r D d η ¯ D 0 ( r , s ) d r D s η ¯ D 0 ( r , s ) = 0
The general solution of Equation (20) is
η ¯ D 0 r , s = A r D e r D s + B r D e r D s
Therefore, the solution of Equation (18) can be expressed as
η ¯ D 0 r , s = A r D e r D s + B r D e r D s 2 λ D L s 2 r D 1 + e r D s
Laplace transform is applied to the outer boundary conditions of Equation (10) to obtain the following:
η ¯ 0 r D , t D = 0
Substitute Equation (23) into Equation (22) to obtain A = 0
Substitute A = 0 into Equation (22) to obtain
η ¯ D 0 r , s = B r D e r D s 2 λ D L s 2 r D e r D s 2 λ D L s 2 r D
Substituting the inner boundary condition Equation (3) into Equation (24) simplifies to
B = s 2 + 16 λ D π L 4 4 π L 3 s 2
Then Equation (24) can be written as follows:
η ¯ D 0 r , s = s 2 + 16 λ D π L 4 4 π r D L 3 s 2 2 λ D L s 2 r D e r D s 2 λ D L s 2 r D
If the point source strength is not unit 1, then
η ¯ D 0 r , s = q ˜ V ϕ c t s 2 + 16 λ D π L 4 4 π r D L 3 s 2 2 λ D L s 2 r D e r D s 2 λ D L s 2 r D
Equation (27) is the instantaneous point source function, with the result that the solution of the continuous point source function is
η ¯ D 0 r , s = q ˜ ¯ L 2 μ s k i f 1 4 π L 3 + 2 λ D L s 2 e r D s r D 2 λ D L s 2 r D
r D = x D x w D 2 y D y w D 2 z D z w D 2
The uniform initial pressure condition is expressed as Δ p r , t = 0 = 0 after Laplace transformation, L Δ p t = 0 = 0 s η ¯ D 0 η D 0 r , 0 = 0 . This property directly leads to the vanishing of the homogeneous initial term, which is the basis for the derivation of Equation (18).
The condition of an infinitely large outer boundary Δ p r , t = 0 is strictly expressed in the Laplace space as Equation (23) η ¯ 0 r D , t D = 0 , which forces the coefficient A of the exponentially growing term in the general solution to be zero.
The inner boundary point source condition: the δ t function in Equation (3) becomes a constant term after Laplace transformation, which reflects the basis for the derivation of the instantaneous mass conservation Equation (25).

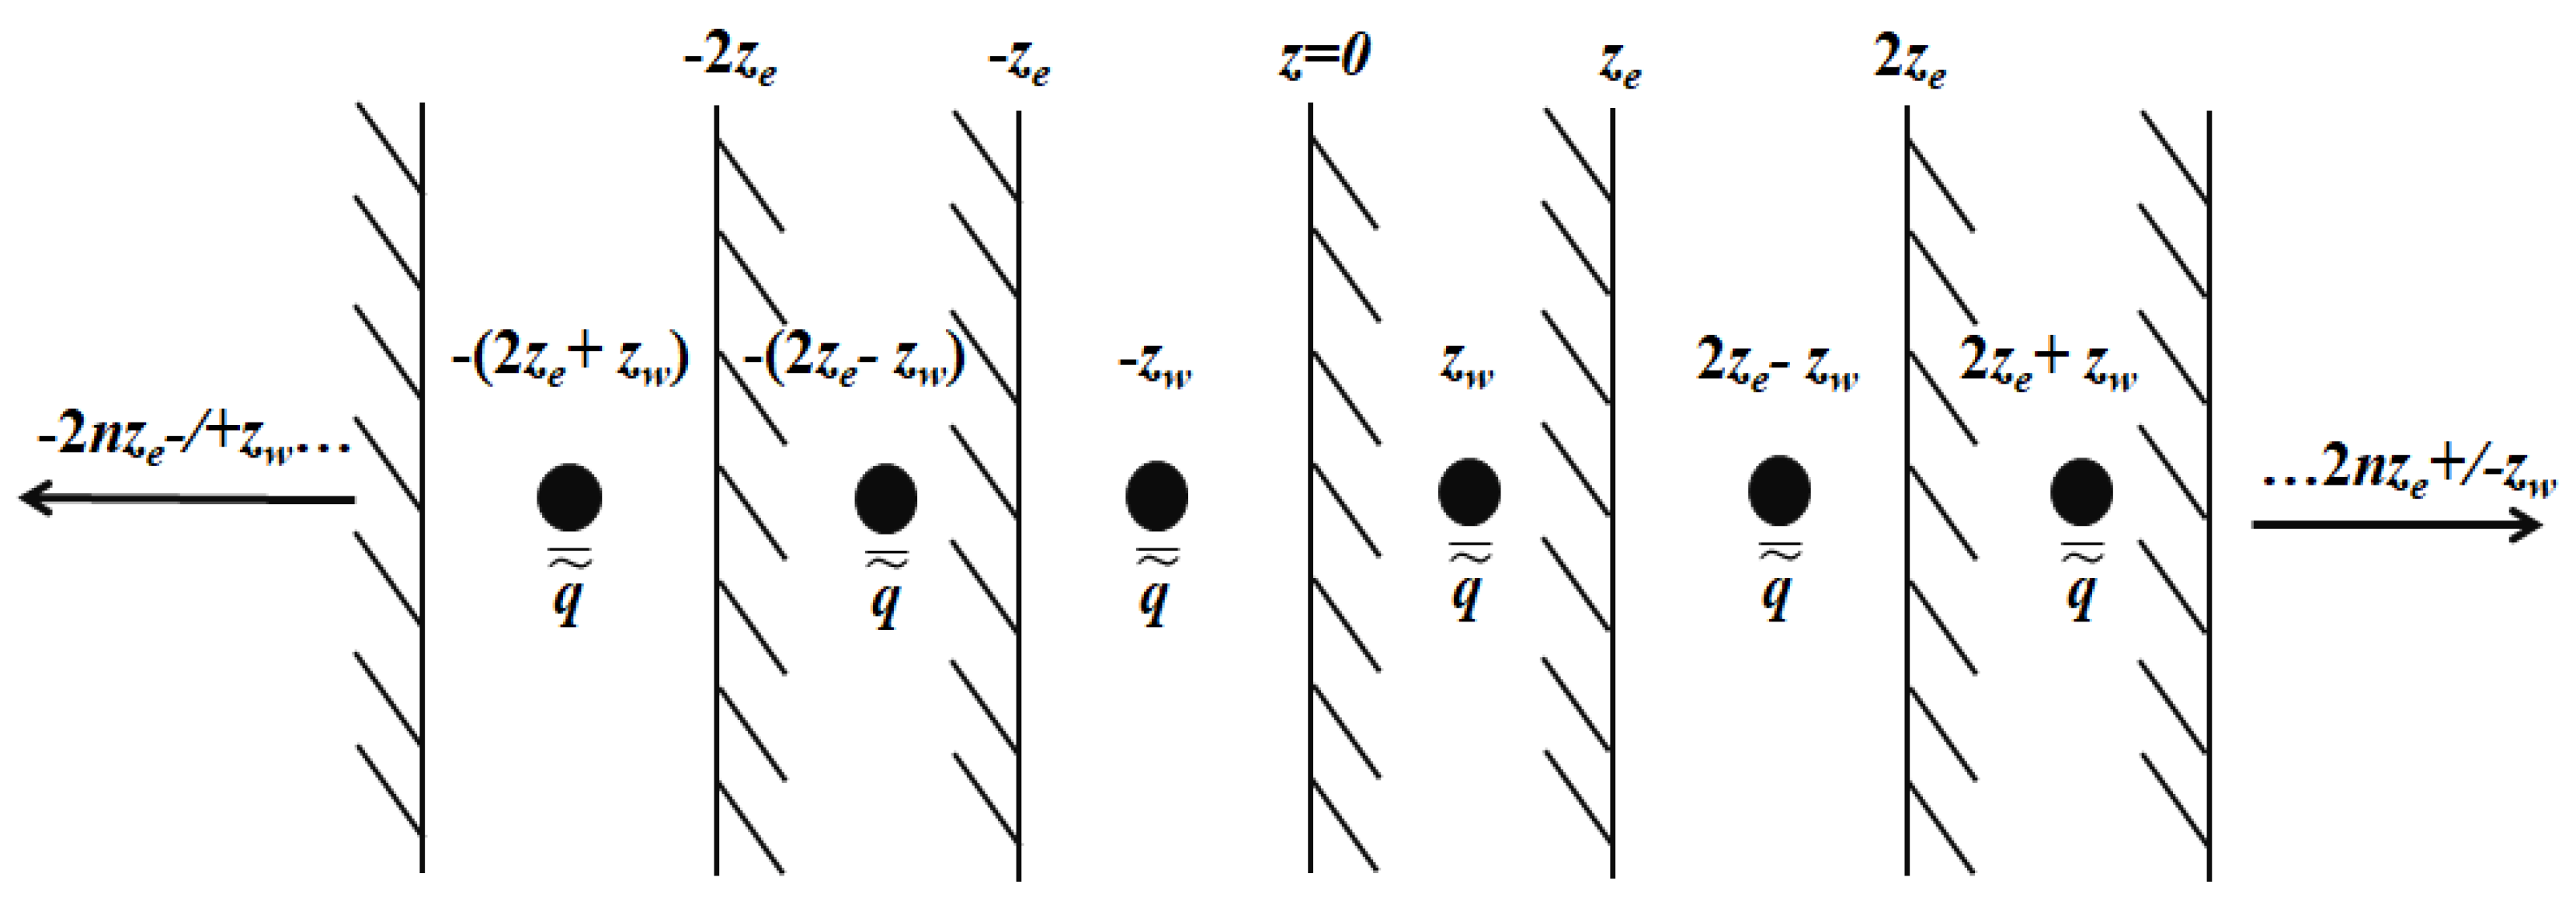
2.3. Basic Solution of Closed-Boundary Point Source Function

Rewrite Equation (28) so that
η ¯ d r , s = q ˜ L 2 μ s k i f 1 4 π L 3 + 2 λ D L s 2 e r D s r D
η ¯ λ r , s = q ˜ L 2 μ s k i f 2 λ D L s 2 r D
Then Equation (28) can be reduced to
η ¯ D 0 ( r , s ) = η ¯ d ( r , s ) + η ¯ λ ( r , s )
The mirror principle is used to consider the influence of reservoir boundaries. The mirror principle diagram of the top and bottom closed boundaries is shown in Figure 2:
After mirror mapping, the position of the point source is
z w D = 2 n z D e z D w 2 n z D e + z D w < n <
Applying superposition principle to Equations (30) and (31), respectively, the following is obtained:
η ¯ d r , s = q ˜ ¯ L 2 μ s K i f 1 4 π L 3 + 2 λ D L s 2 n = n = e s x D x w D 2 + y D y w D 2 + z D + z D w 2 n z D e 2 x D x w D 2 + y D y w D 2 + z D + z D w 2 n z D e 2 + e s x D x w D 2 + y D y w D 2 + z D z D w 2 n z D e 2 x D x w D 2 + y D y w D 2 + z D z D w 2 n z D e 2
η ¯ λ r , s = q ˜ L 2 μ s k i f 2 λ D L s 2 n = n = 1 x D x w D 2 + y D y w D 2 + z D + z D w 2 n z D e 2 + 1 x D x w D 2 + y D y w D 2 + z D z D w 2 n z D e 2
Poisson’s summation formula simplifies Equation (34) to
η ¯ d r , s = 2 q ˜ ¯ μ L 2 K i f s z D e 1 4 π L 3 + 2 λ D L s 2 K 0 r D s + 2 n = 0 K 0 r D s + n π z D e 2 cos n π z D z D e cos n π z w D z D e
Finally, the point source solution of a closed, radially infinite low-permeability reservoir in Laplace space can be obtained:
η ¯ D 0 r , s = 2 q ˜ ¯ μ L 2 K i f s z D e 1 4 π L 3 + 2 λ D L s 2 K 0 r D s + 2 n = 0 K 0 r D s + n π z D e 2 cos n π z D z D e cos n π z w D z D e 2 λ D L s 2 n = n = 1 x D x w D 2 + y D y w D 2 + z D + z D w 2 n z D e 2 + 1 x D x w D 2 + y D y w D 2 + z D z D w 2 n z D e 2
On the right side of Equation (37), z is integrated on the interval 0 ~ ze, and then x is integrated on the interval (XW − lf) ~ (XW + lf). The calculation formula of unsteady pressure surface source function of vertically fractured well is as follows:
η ¯ 0 = 2 q ˜ ¯ μ z e L 2 s K i f z D e 1 4 π L 3 + 2 G D L s 2 x w D l D f x w D + l D f K 0 x w D σ 2 + y D y w D 2 s f s d σ 2 G D L s 2 x w D l D f x w D + l D f n = n = 1 x D x w D 2 + y D y w D 2 + z D + z D w 2 n z D e 2 + 1 x D x w D 2 + y D y w D 2 + z D z D w 2 n z D e 2 d σ

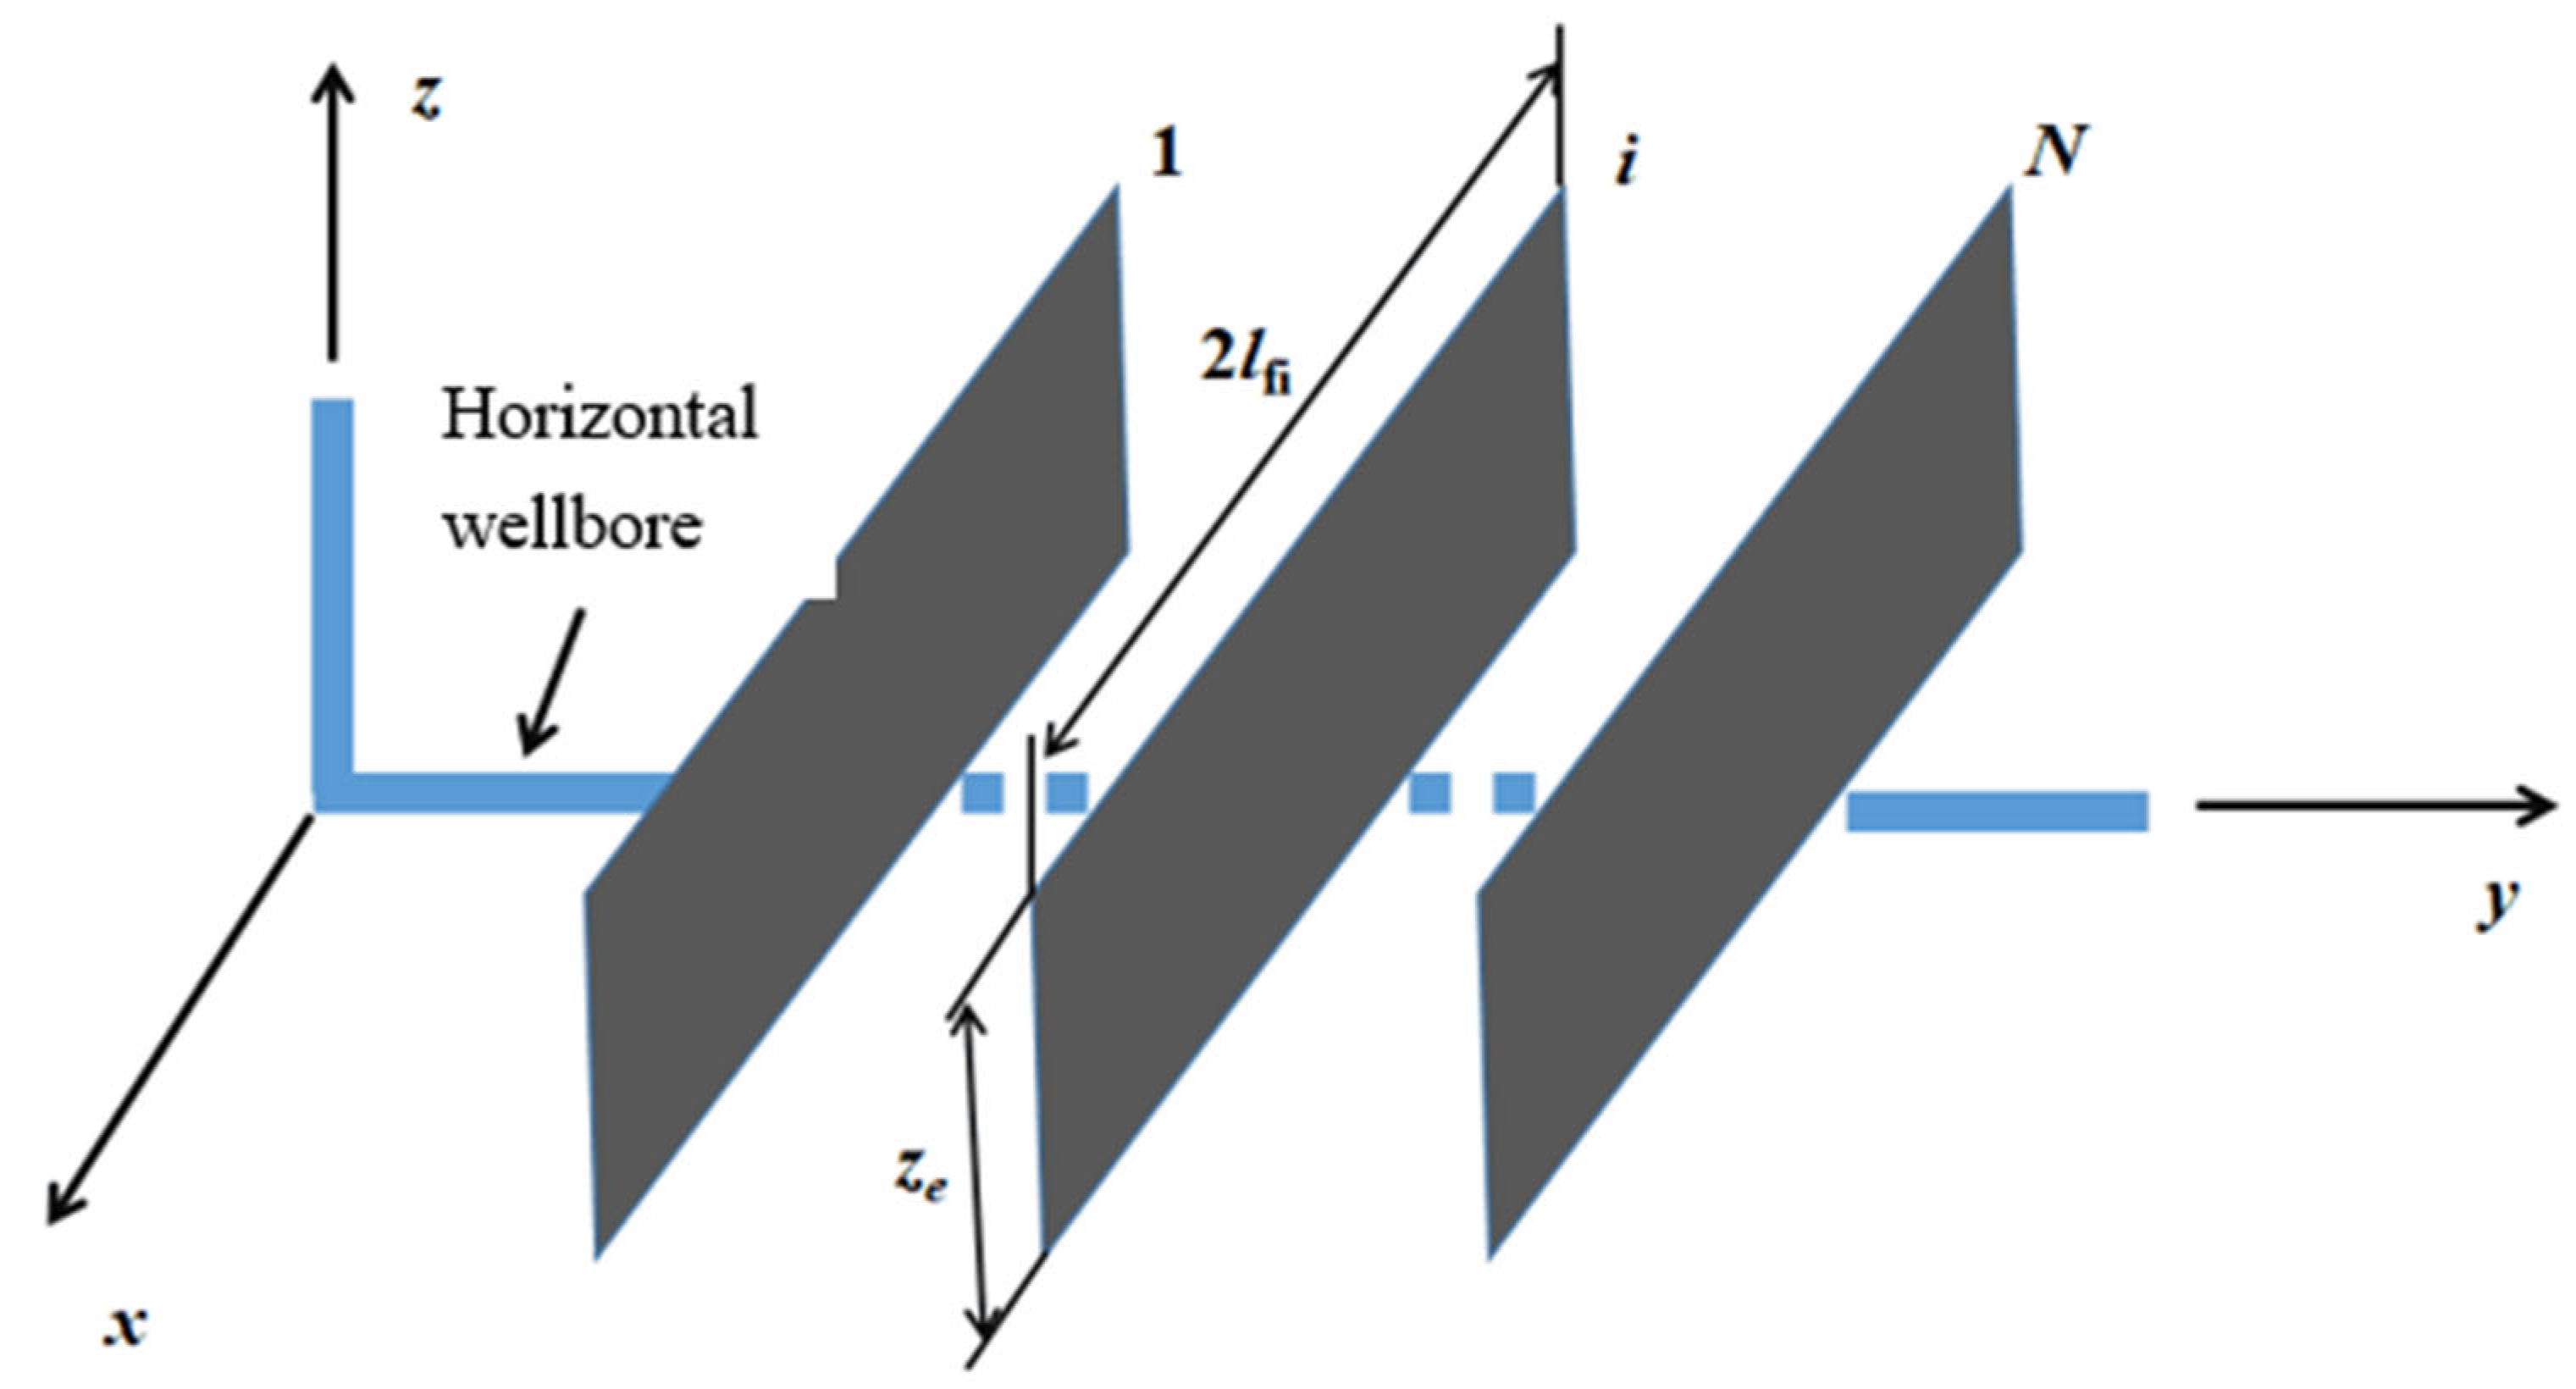
3. Seepage Model of Staged-Fractured Horizontal Well in Low-Permeability Reservoir

The low-permeability reservoir has a closed top and bottom and an infinite radial boundary, and there is a staged-fractured horizontal well. Horizontal well contains N fractures, all of which penetrate the formation completely. The fracture half-length is lf1, lf2,lfi (i = 1 ~ N), assuming that no other positions in the de-frac section of the horizontal well are perforated. The diagram of staged-fractured horizontal wells is shown in Figure 3:
Considering the mutual interference between cracks, the dimensionless pressure degradation of any crack obtained from the superposition principle can be expressed as
η ¯ D 0 i = j = 1 N q ¯ D f j η ¯ D 0 i , j i = 1 , 2 , 3 , , N
Assuming that the seepage resistance of the crack is ignored,
η ¯ D 0 i = η ¯ w D
The sum of the output of each fracture is 1:
i = 1 N q ¯ D f i = 1
The form of the matrix vector Equation of the combined lines (39)–(41) is obtained as follows:
A - I T I 0 q η ¯ w D + λ = O 1 / s
where
A = η D 01 , 1 η D 01 , 2 η D 01 , N η D 02 , 1 η D 02 , 2 η D 02 , N η D 0 N , 1 η D 0 N , 2 η D 0 N , N
I = 1 1 1 1 × N
q = q ¯ D f 1 q ¯ D f 2 q ¯ D f 3 q ¯ D f N         λ = λ D o 1 , 1 λ D o 1 , 2 λ D o 1 , N λ D o 2 , 1 λ D o 2 , 2 λ D o 2 , N λ D o N , 1 λ D o N , 2 λ D o N , N         O = 0 0 0 N × 1
Equation (42) contains N + 1 unknowns, which is q ¯ D f j (j = 1, 2, …, N) and η ¯ w D . The number of equations is also N + 1, which is equal to the number of unknowns. Firstly, the solution of the unknown quantity in the Laplace space is obtained, and then the solution of the real space is transformed into the solution η ¯ w D in the real space by Stehfest numerical inversion method, and then the solution is dimensionalized into η w :
η w = η w D μ Q 2 π k h
The effect of stress sensitivity can be considered by Equation (18):
p w = l n 1 α η w α

4. Verification of Model Results and Division of Seepage Stages

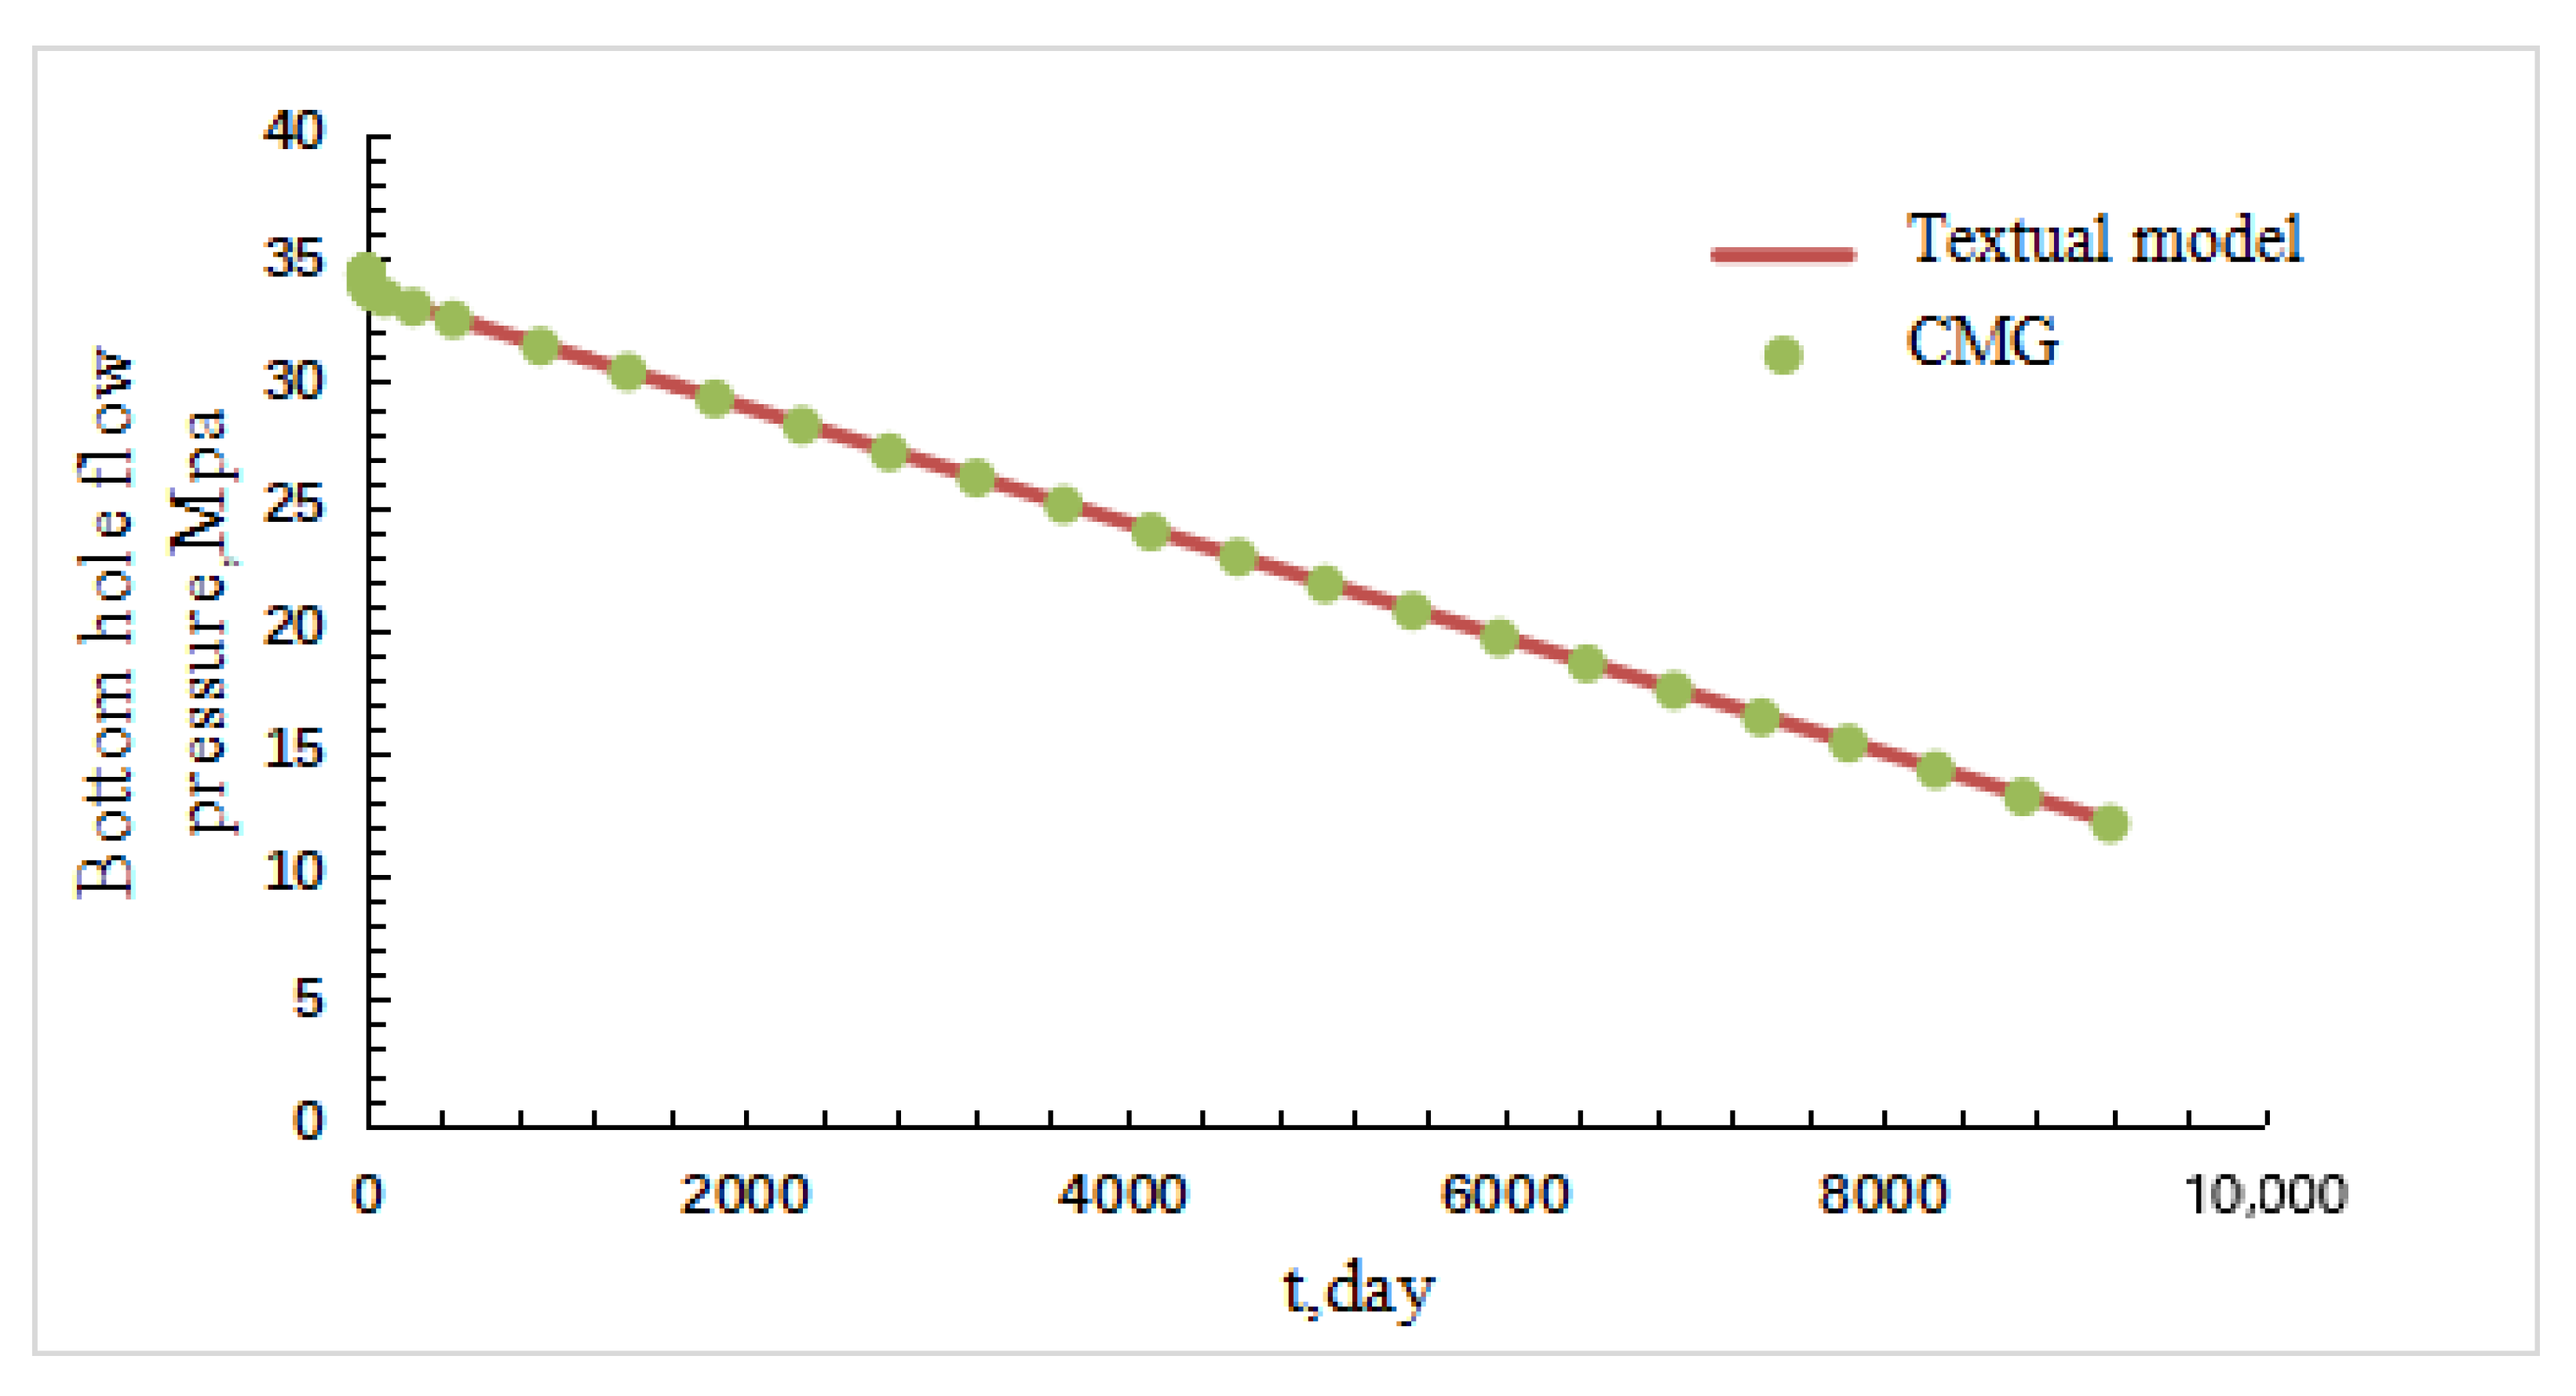
4.1. Verification of Model Results

In order to verify the correctness of the model, the calculated results of the model established in this paper are compared with those of the commercial numerical simulation software CMG (version 2019.10). It is assumed that the low-permeability reservoir contains a horizontal well with three fractures and artificial fractures penetrate the entire reservoir vertically. The production mode of the well is fixed, and the temperature is constant during the production process. Other basic reservoir data are shown in Table 1.
As can be seen from Figure 4, the calculated results of the model established in this paper are in good agreement with those calculated by CMG numerical simulation software (Absolute value error is 1.02%), which verifies the accuracy of the seepage flow model of the staged-fractured horizontal well in low-permeability reservoir established in this paper. Further, the CMG benchmark inherently validates the failure of traditional single-effect models.

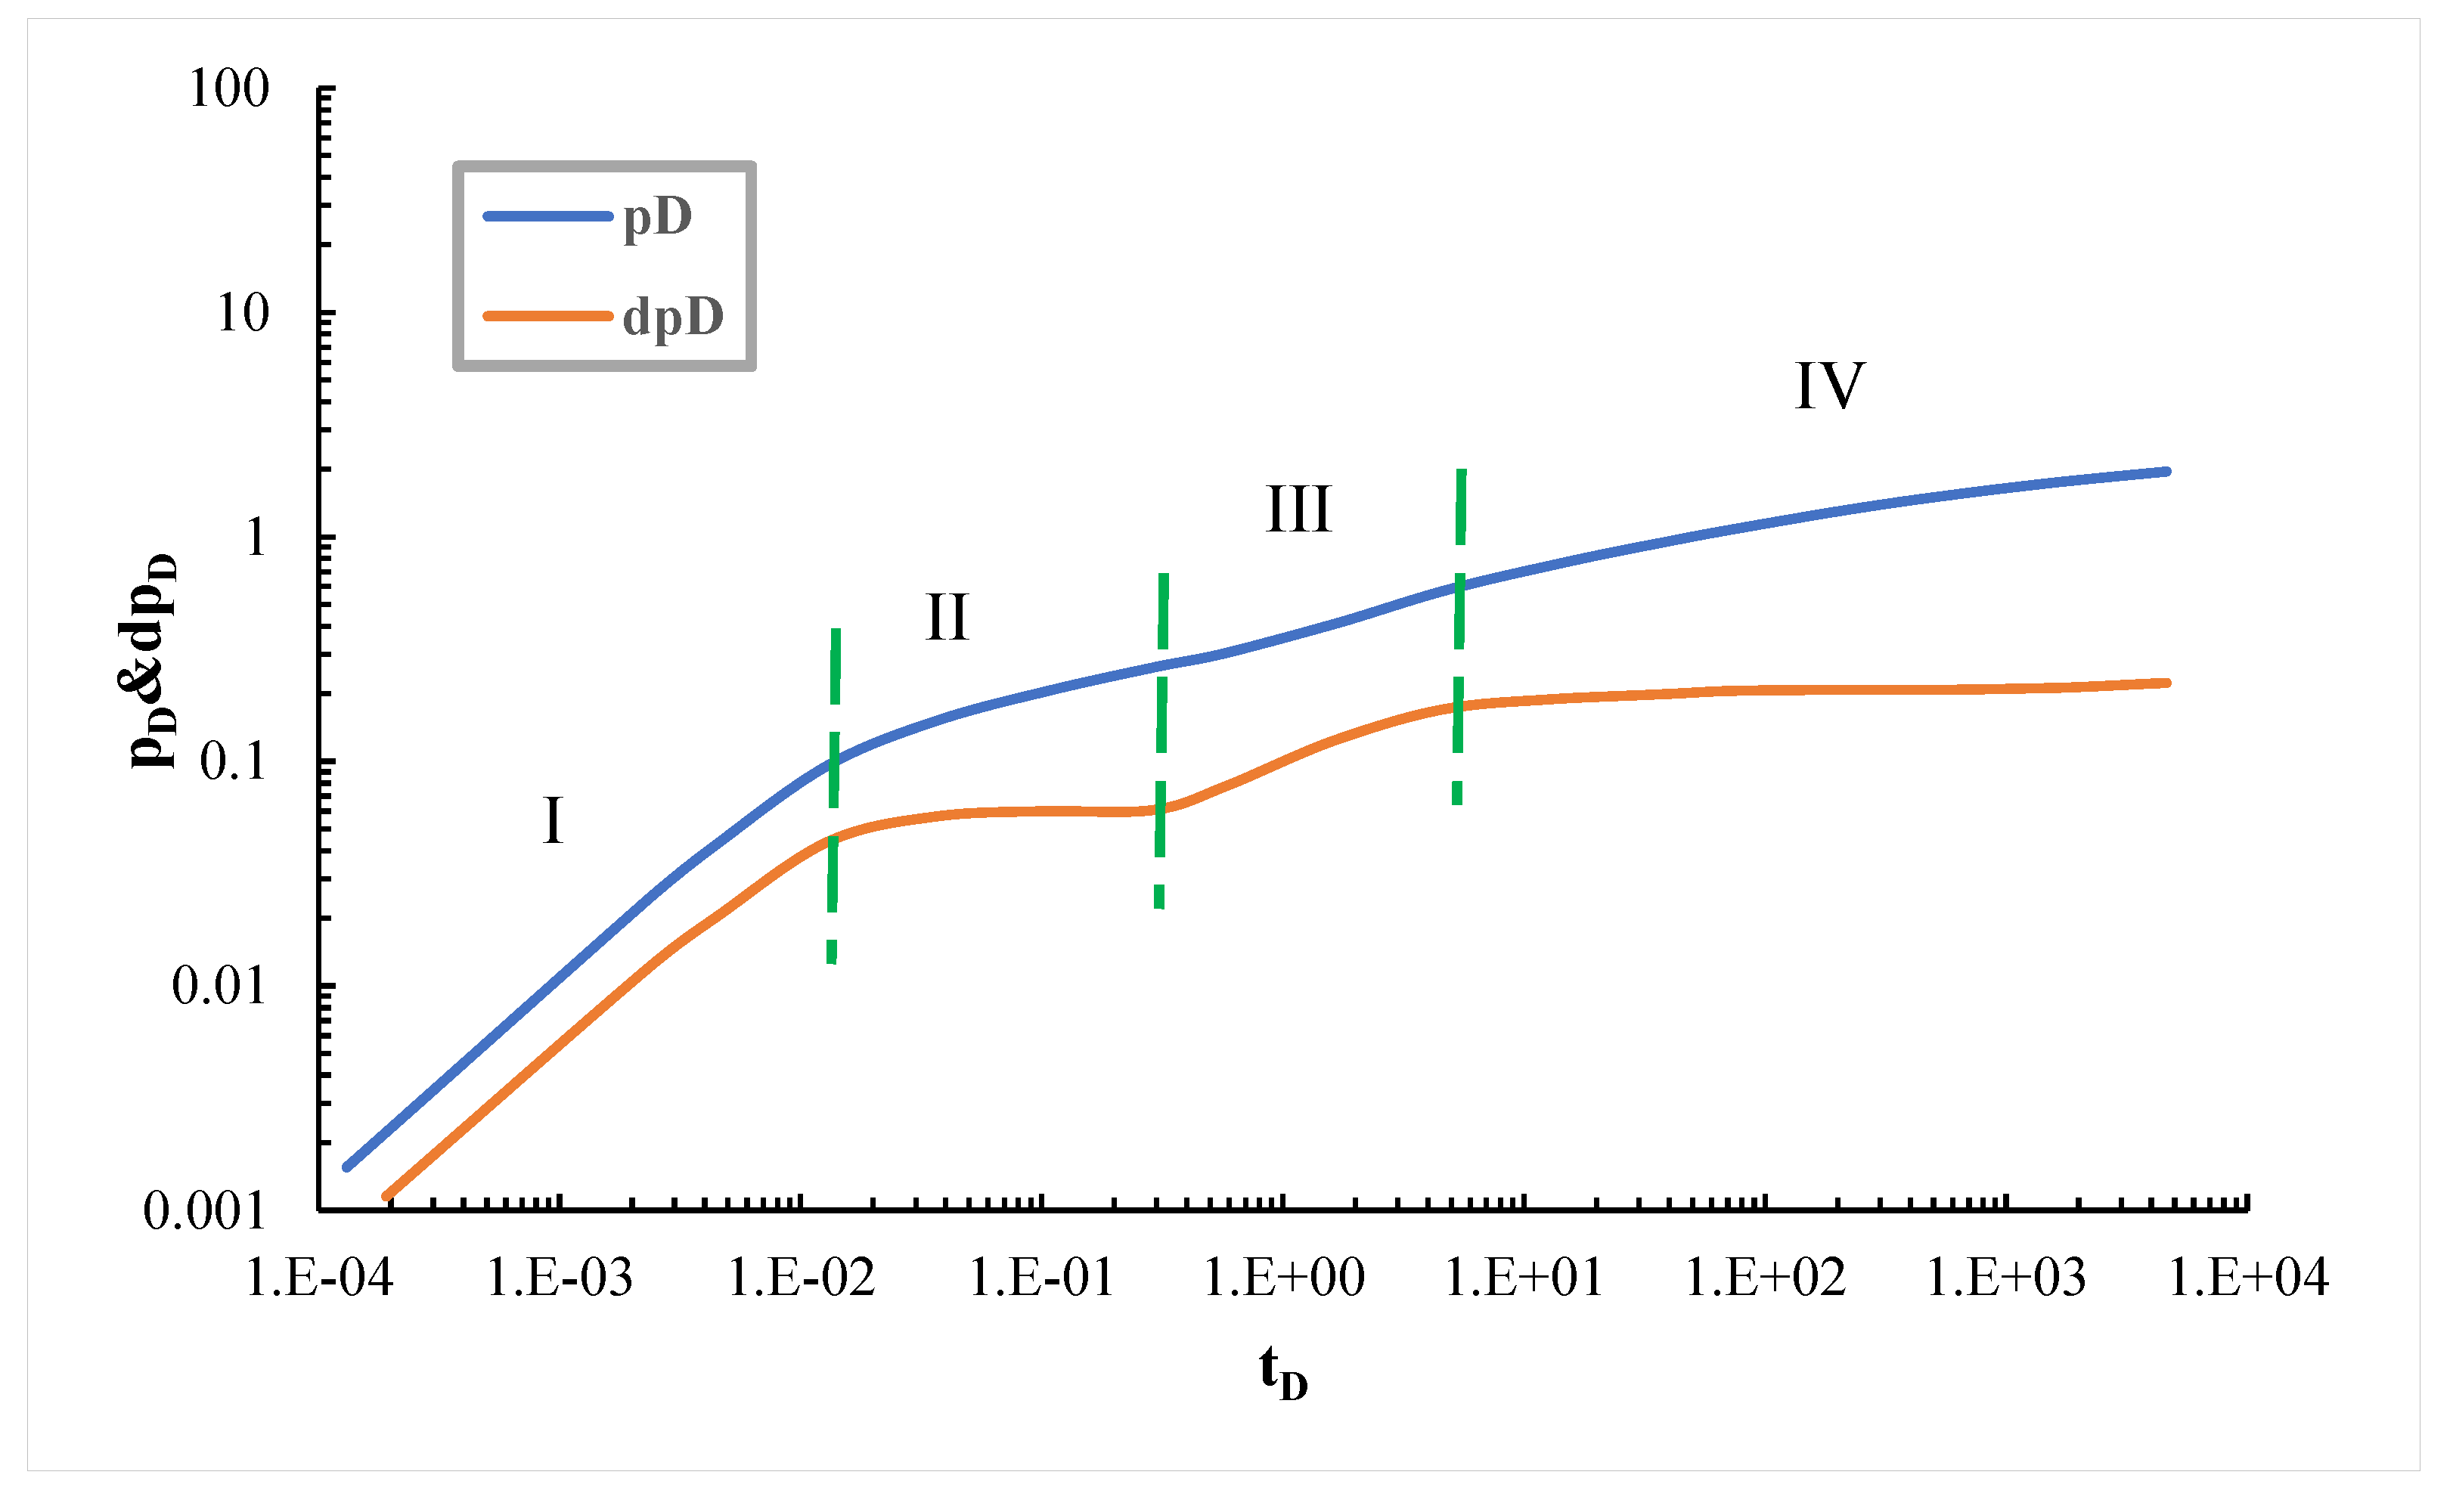
4.2. Division of Seepage Stages of Staged-Fractured Horizontal Wells

In order to further study the flow law of staged-fractured horizontal wells, dimensionless pressure and pressure drop derivatives of staged-fractured horizontal wells were plotted in the double-logarithmic coordinate system, as shown in Figure 5.
As can be seen from Figure 5, staged-fractured horizontal wells in low-permeability reservoirs can be roughly divided into four seepage stages: Stage I is a linear flow stage, in which reservoir fluids flow linearly into fractures and the pressure derivative is a straight line with a slope of 0.5. Stage II is the first radial flow stage, which occurs after the linear flow stage. At this stage, there is no mutual interference between fractures, so the typical curve of pressure test shows an approximate horizontal straight line segment with a slope of 0. Stage III is a double radial flow stage. In this process, the homogeneous reservoir is in a dynamic equilibrium state, the fractures have interfered with each other, and the pressure begins to propagate to the reservoir boundary. The slope of the pressure derivative test curve is close to 0.36. Stage IV is the stage of quasi-radial flow in the reservoir. The formation fluid flows from the vicinity of the fracture in all directions to the fracture system, and the pressure further spreads to a larger area of the reservoir. Therefore, the slope of the corresponding pressure derivative curve is about 0. The establishment of the chart is conducive to understanding the seepage law of low-permeability reservoir.

5. Analysis of Pressure Calculation Results of Staged-Fractured Horizontal Wells

The previous verification has confirmed the basic reliability of the model. This section will further explore the analysis of pressure calculation results for segmented-fractured horizontal wells.

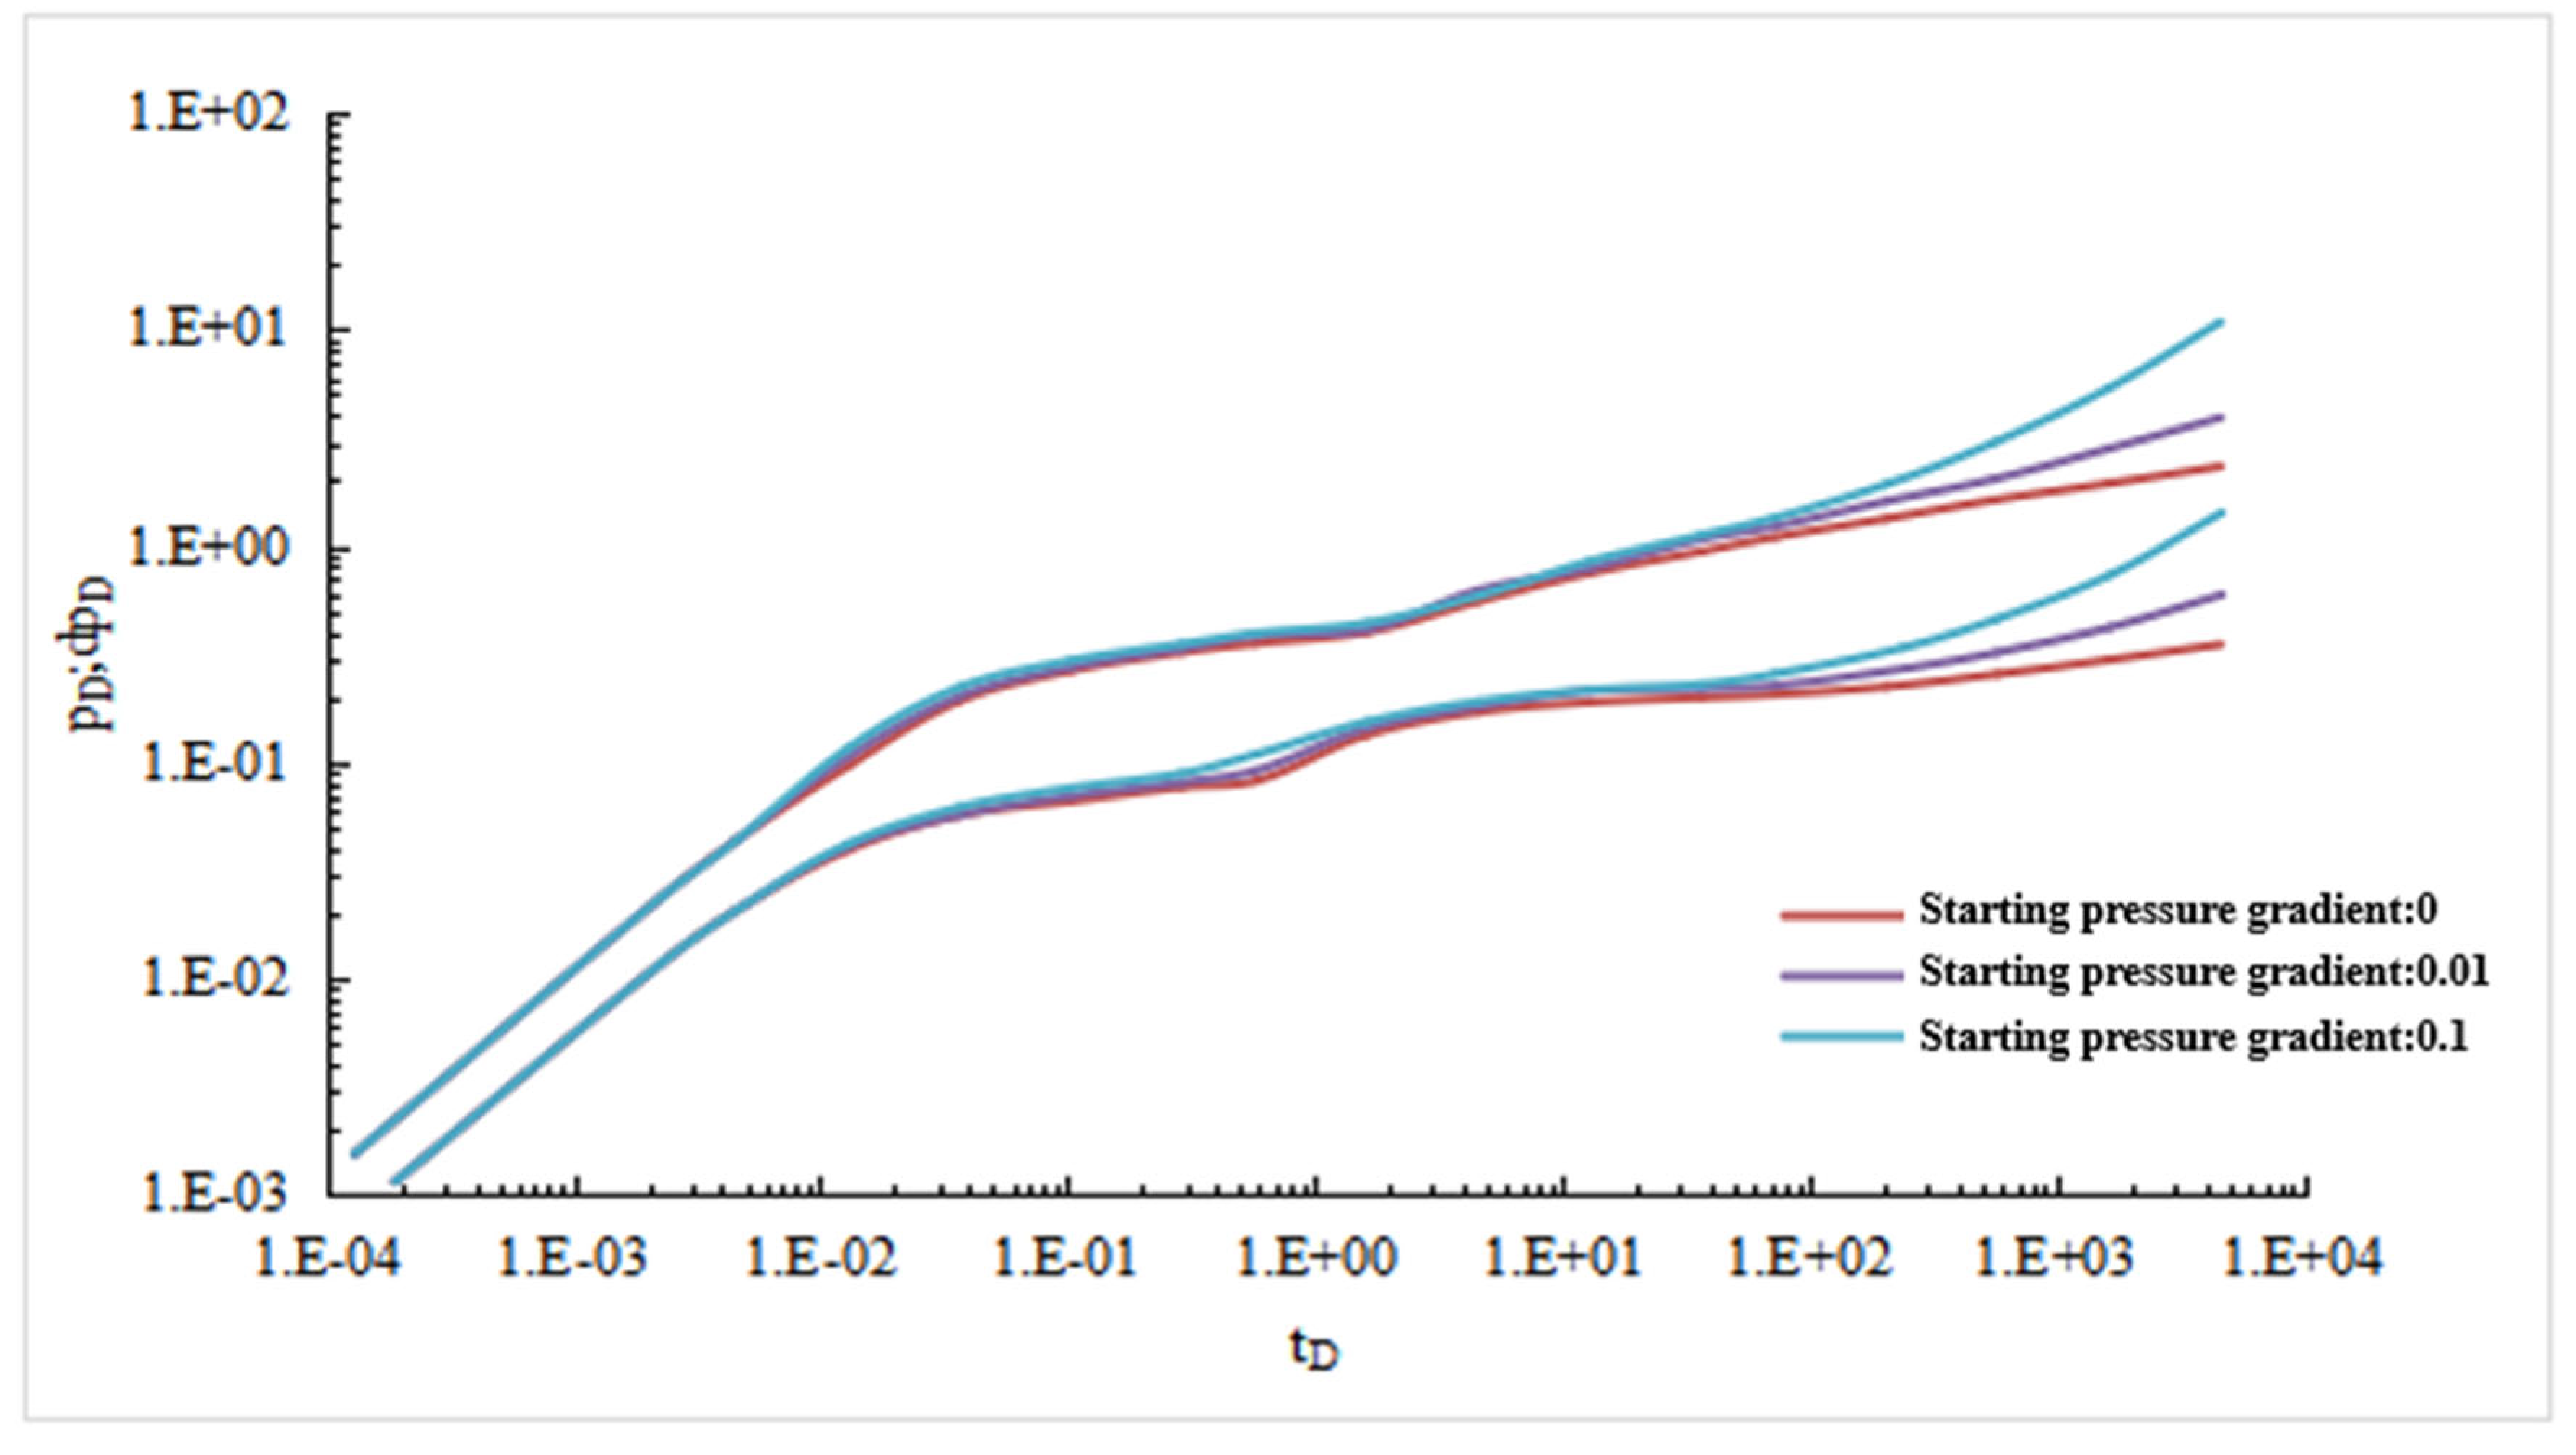
5.1. Starting Pressure Gradient Sensitivity Analysis

Other parameters are shown in Table 1. When starting pressure gradients are 0 MPa/m, 0.01 Mpa/m, and 0.1 Mpa/m, respectively, dimensionless bottom-hole pressure and pressure drop derivative curves are shown in Figure 6.
As can be seen from Figure 6, the starting pressure gradient mainly affects the later stage of the dimensionless pressure drop test curve. The presence of starting pressure gradient in low-permeability reservoir increases the flow resistance of fluid. The higher the starting pressure gradient is, the greater the upwarped degree of well test curve will be.

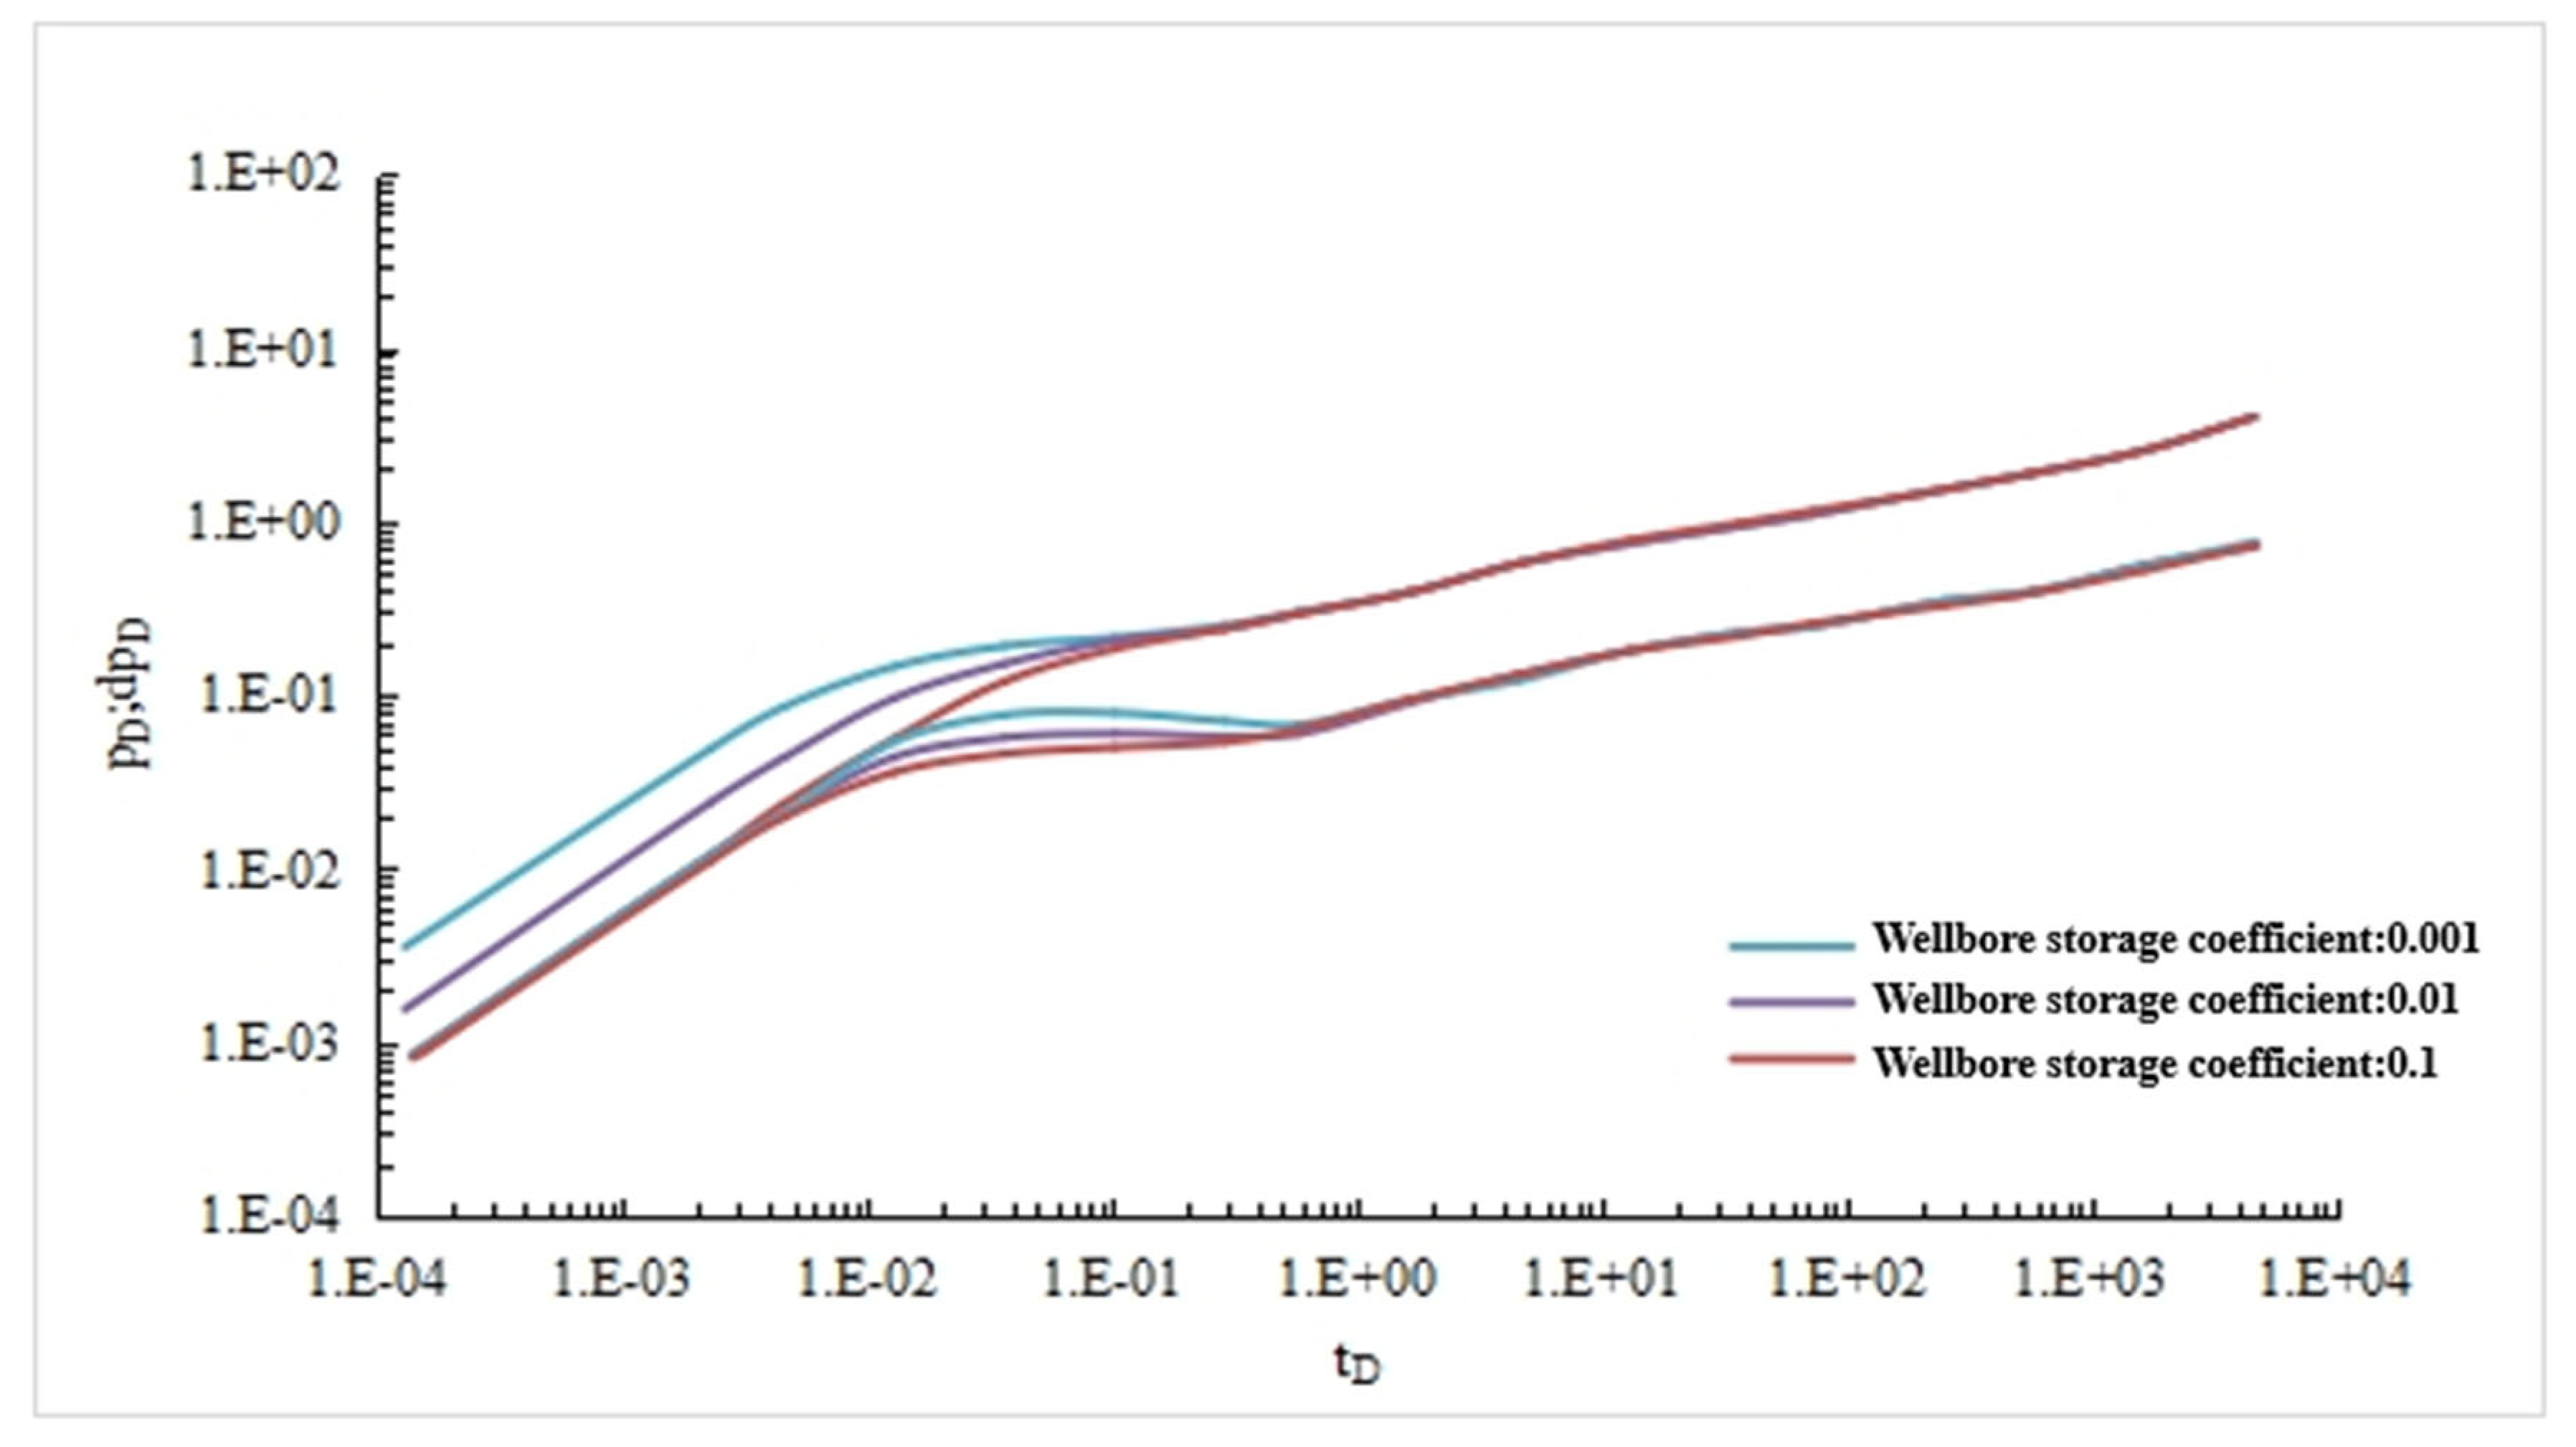
5.2. Sensitivity Analysis of Wellbore Storage Coefficient

Other parameters are shown in Table 1. When wellbore storage coefficients are 0.001, 0.01, and 0.1, respectively, dimensionless bottom-hole pressure drop and pressure drop derivative curves are shown in Figure 7.
As can be seen from Figure 7, wellbore storage coefficient has a great influence on the early flow law of staged-fractured horizontal wells in low-permeability reservoir, but has little influence on other seepage stages. With the increase of wellbore storage coefficient, the early dimensionless pressure drop and pressure drop derivative curves decrease and shift to the right. The reservoir coefficient of wellbore has little influence on the flow regularity of fractured horizontal wells in the later period.

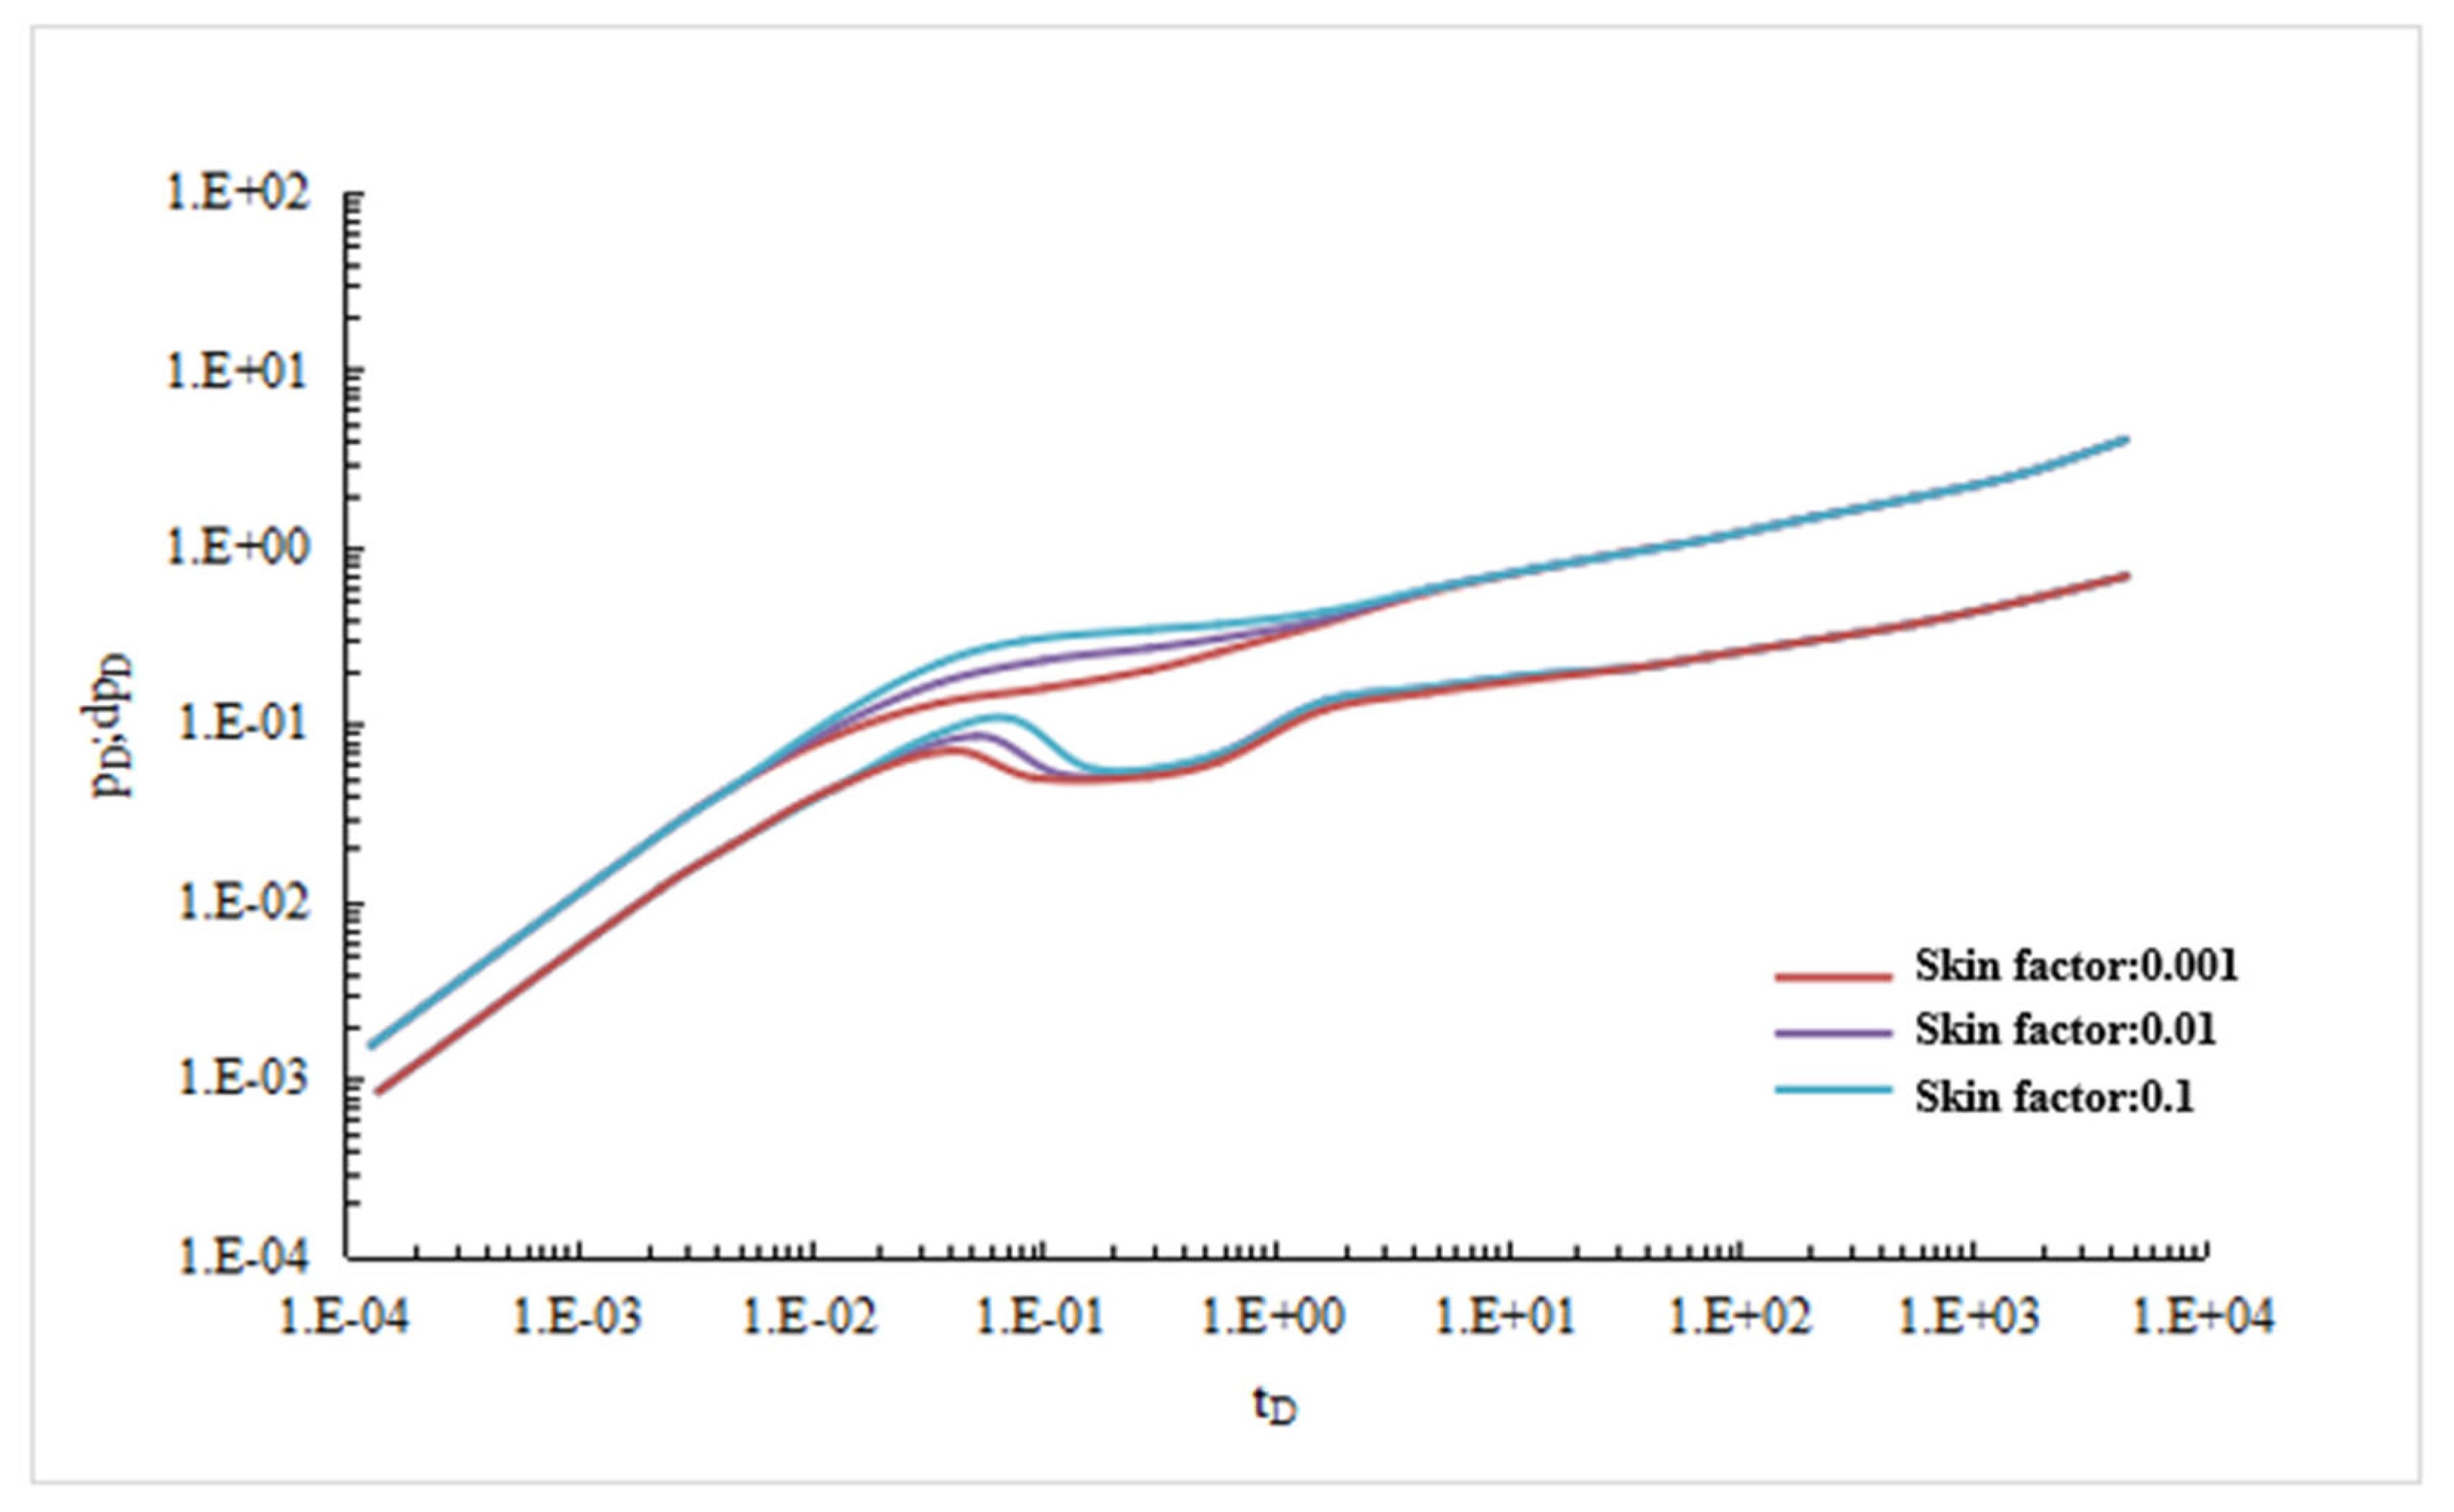
5.3. Sensitivity Analysis of Skin Coefficient

Other parameters are shown in Table 1. When skin coefficients are 0.001, 0.01, and 0.1, respectively, dimensionless bottom-hole pressure drop and pressure drop derivative curves are shown in Figure 8:
It can be seen from Figure 8 that the skin coefficient has a great influence on the radial flow of fractured horizontal wells, but has little influence on other seepage stages. The larger the skin factor is, the overall upward shift of the dimensionless well test curve indicates that the oil well is more polluted.

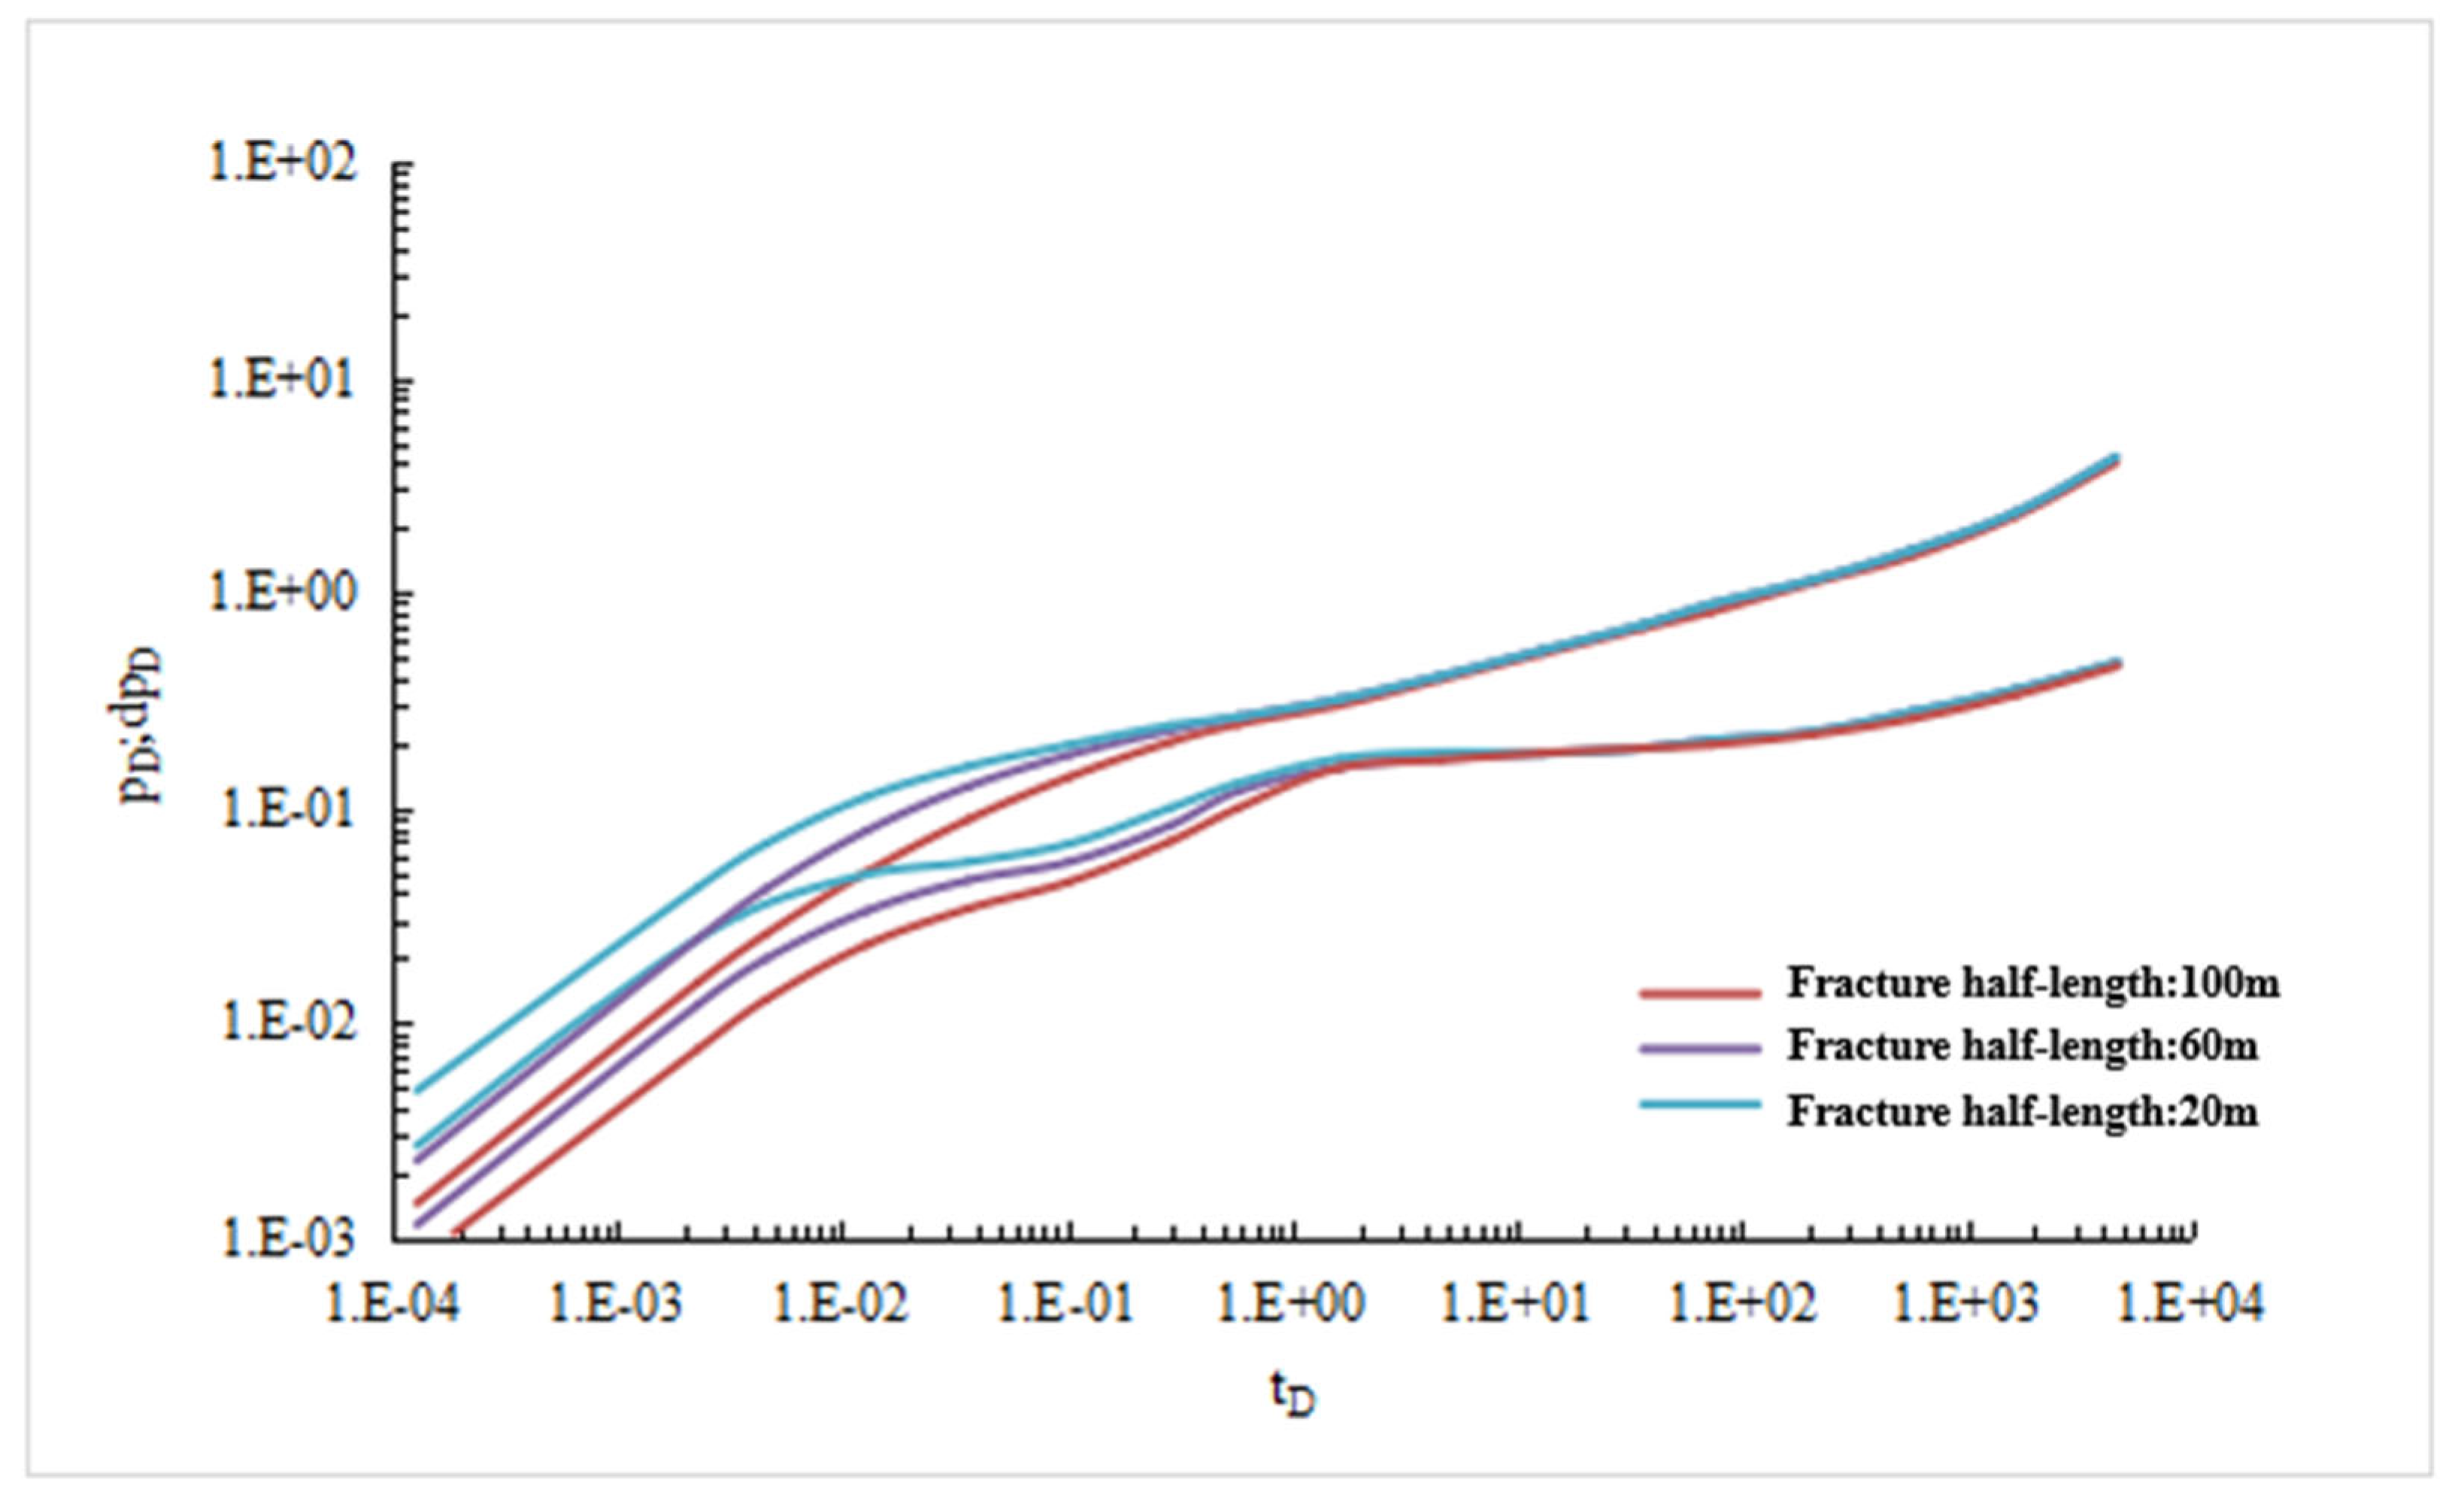
5.4. Sensitivity Analysis of Crack Length

Other parameters are shown in Table 1. When fracture half-length is 20 m, 60 m, 100 m in sequence, dimensionless bottom-hole pressure drop and pressure drop derivative curve are shown in Figure 9:
It can be seen from Figure 9 that the fracture half-length has a great influence on the linear flow and the first radial flow, but has little influence on other seepage stages. When the fracture half-length increases, the dimensionless pressure drop curve decreases. The reason is that the longer the fracture length, the larger the outflow area of the well, the smaller the pressure loss of the fluid flowing into the wellbore.

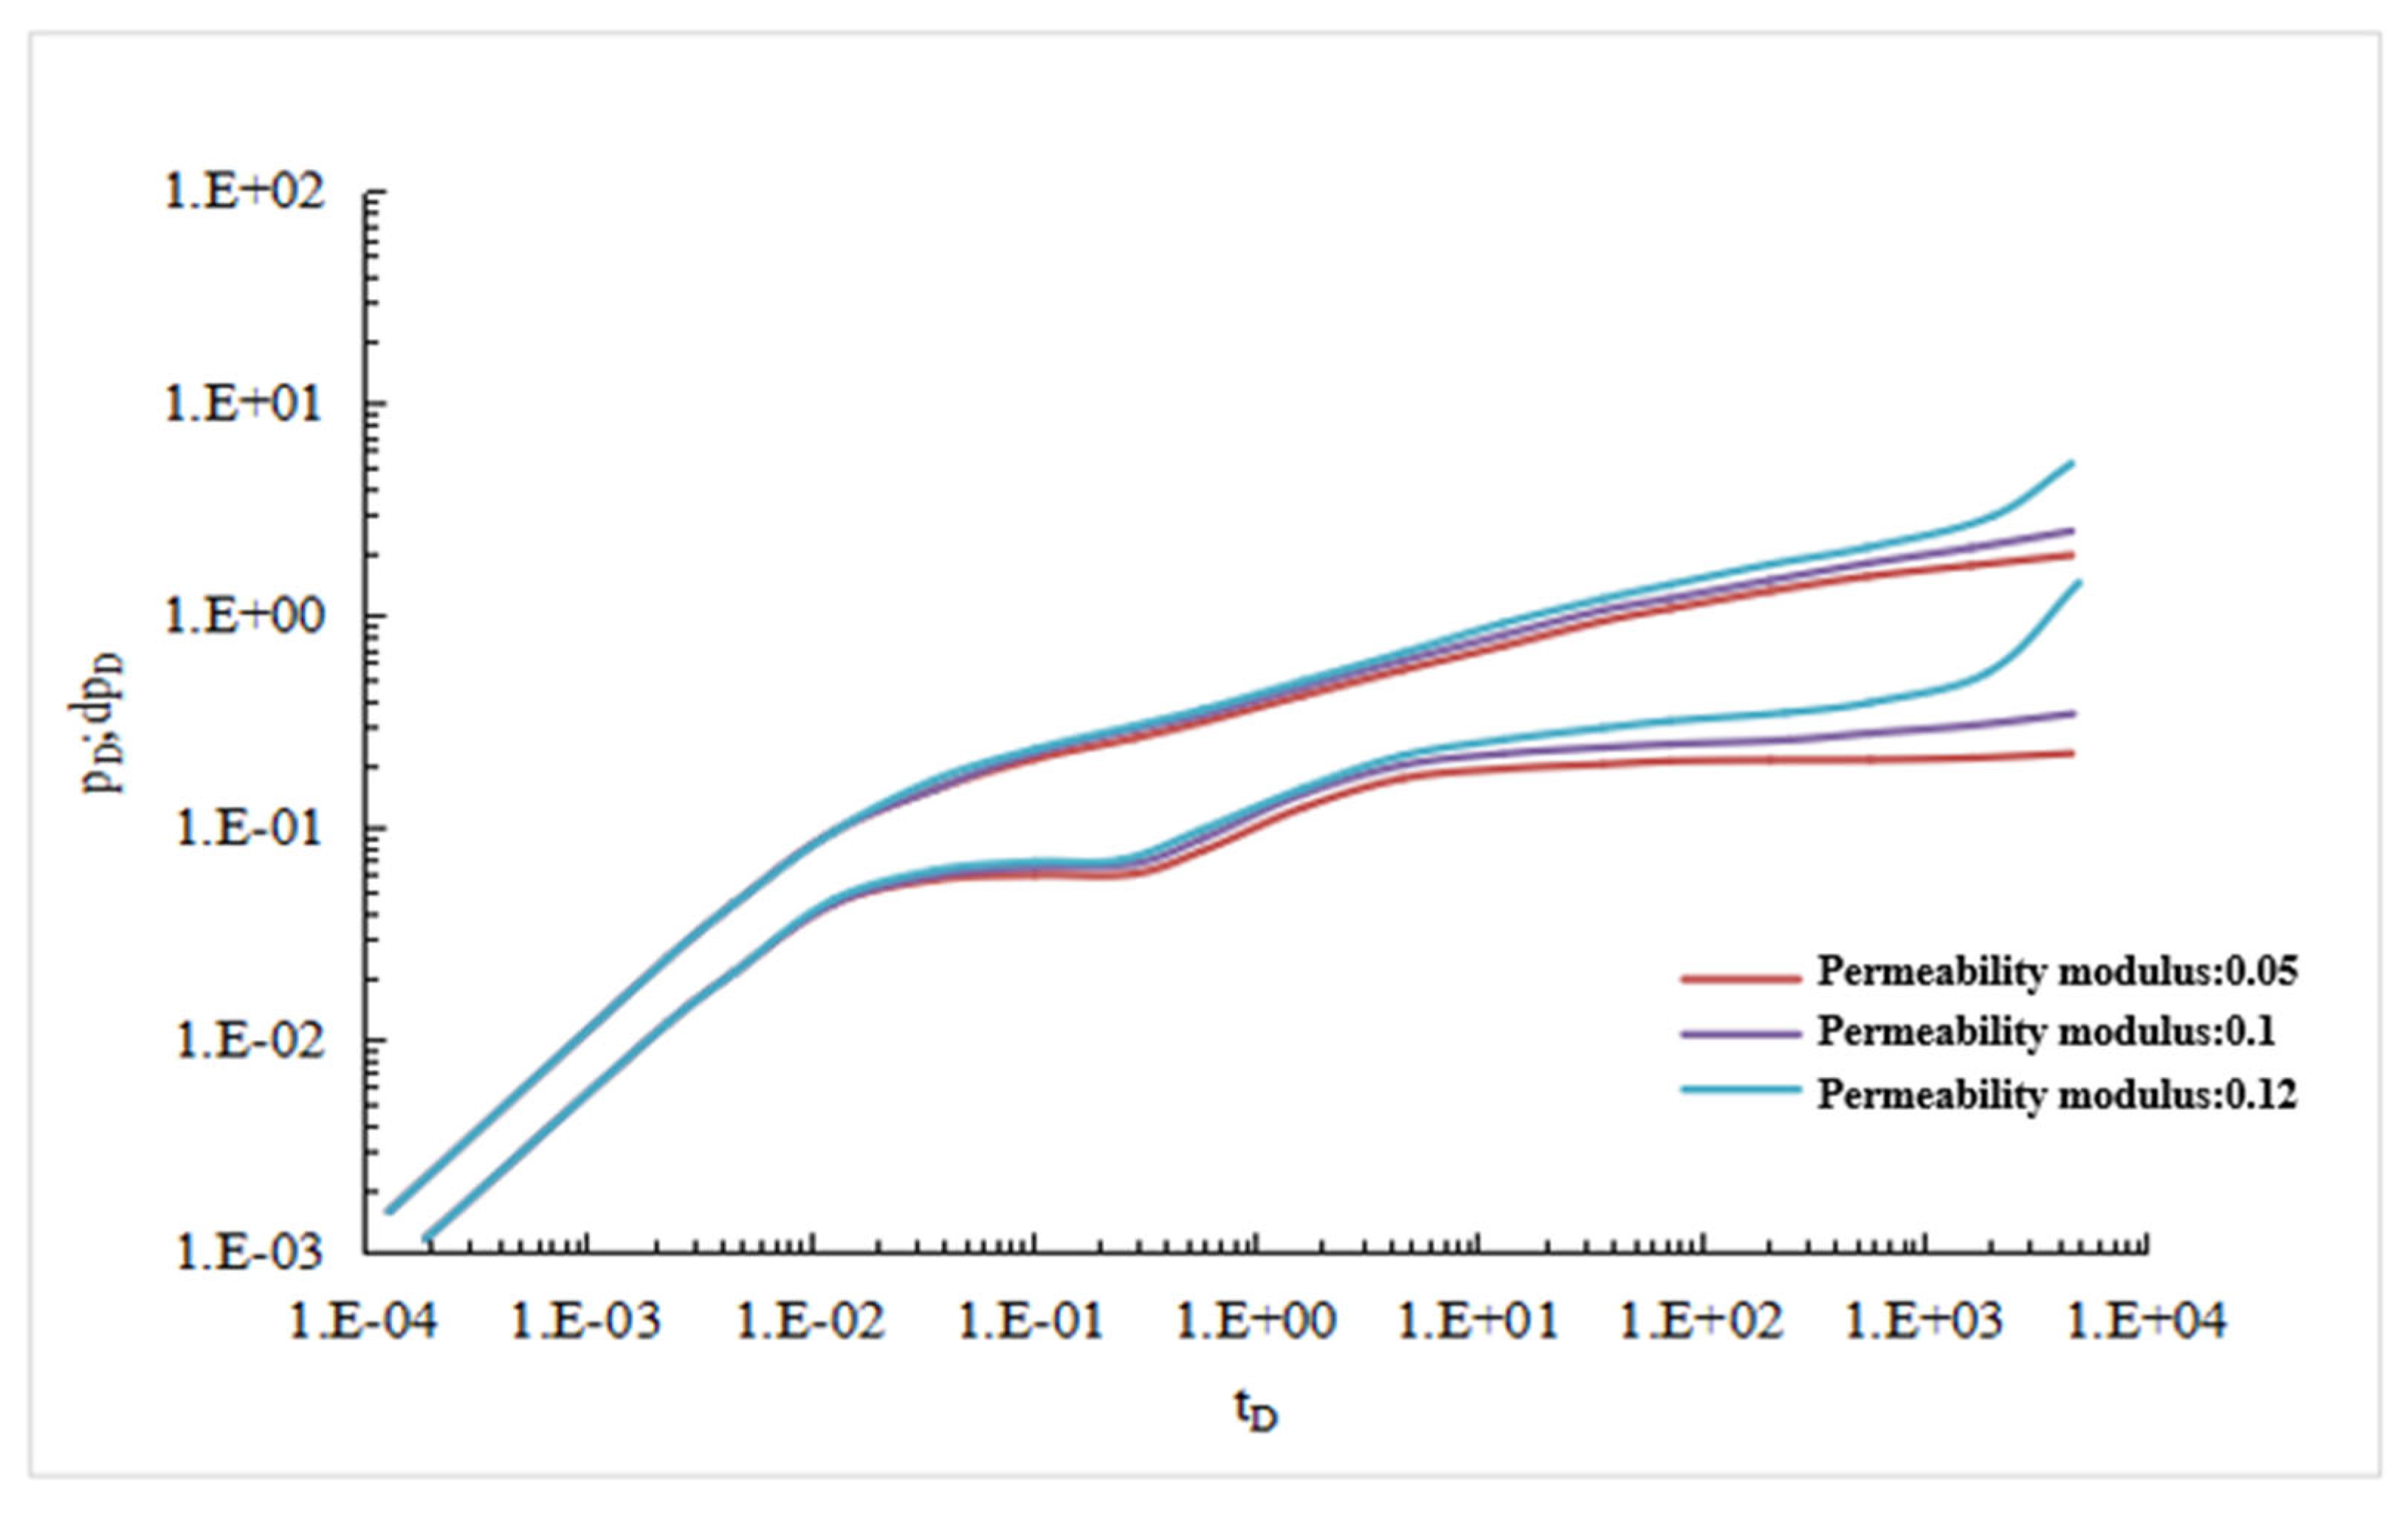
5.5. Permeability Modulus Sensitivity Analysis

Other parameters are shown in Table 1. When permeability modulus is 0.05 Mpa−1, 0.1 Mpa−1, 0.12 Mpa−1, dimensionless bottom-hole pressure drop and pressure drop derivative curves are shown in Figure 10.
As can be seen from Figure 10, the change of permeability modulus has almost no effect on formation linear flow, but has a greater impact on the middle and late stages of seepage. With the increase of permeability modulus, the dimensionless pressure drop test curve gradually warps up, showing the characteristics of closed-boundary influence, indicating that tight reservoirs require more energy consumption.
The results of the above sensitivity analysis are summarized in Table 2.

6. Conclusions

(1)
A novel dual-effect seepage model was established for staged-fractured horizontal wells in low-permeability reservoirs through Laplace transforms, perturbation methods, and superposition principles, simultaneously incorporating starting pressure gradient ( λ ) and stress sensitivity ( α ).
(2)
Four distinct flow stages were identified: Stage I—Linear flow (pressure derivative slope = 0.5); Stage II—Initial radial flow (slope ≈ 0); Stage III—Dual radial flow (slope ≈ 0.36); Stage IV—Quasi-radial flow (slope ≈ 0).
(3)
Parameter dominance analysis: The starting pressure gradient has a great influence on the flow law of staged-fractured horizontal wells in the late production stage, but has little influence on other seepage stages. With the increase of starting pressure gradient, the pressure drop curve gradually warps up, indicating that the seepage resistance is increasing. The stress-sensitive effect has little influence on the seepage law of staged-fractured horizontal wells in low-permeability reservoir in the initial stage of development, but has a greater influence on the development law in the later stage of production.
(4)
Theoretical and practical contributions: Provides a validated framework for well test interpretation (CMG-verified error: 1.02%); enables accurate production evaluation by resolving coupled nonlinear effects ignored in prior models.

Author Contributions

Conceptualization, J.S. and Z.R.; methodology, Z.Q.; software, X.W.; validation, Z.R., X.W. and J.C.; formal analysis, X.W.; writing—original draft preparation, J.C.; writing—review and editing, X.L.; visualization, M.W.; supervision, Z.Q.; project administration, J.S. and Z.R.; funding acquisition, Z.Q. and Z.R. All authors have read and agreed to the published version of the manuscript.

Funding

This work is funded by National Natural Science Foundation of China (Grant No. 51804258, 52274007), Natural Science Basic Research Program of Shaanxi Province (Grant 2023-JC-YB-414), The Shaanxi Provincial Education Department (Program no. 22JS029) and The Youth Innovation Team of Shaanxi Universities Scientific Research.

Data Availability Statement

All data in this study are confidential and will not be publicly disclosed.

Conflicts of Interest

Author Jian Song was employed by the company Beijing Yadan Petroleum Technology Co., Ltd. The remaining authors declare that the research was conducted in the absence of any commercial or financial relationships that could be construed as a potential conflict of interest.

Abbreviations

Kpermeability, 10−3 μm2
εpoint source radius
μoil viscosity, Pa·s
rreservoir radius, m
ρfluid density, kg/m3
ϕ porosity, decimal
vfluid velocity, m/s
CLcompressibility of fluid, MPa−1
Ctoverall compressibility, MPa−1
Subscript “m”matrix system
Subscript “f”fracture system
ηperturbation transform conversion parameter
kifinitial permeability of natural fracture, 10−3 μm2
αpermeability modulus, MPa−1
λ, Gstarting pressure gradient, MPa/m
Δ p the difference from the initial formation pressure, MPa
pithe difference in initial formation pressure, MPa
q ˜ instantaneous output of point source, m3/s
q ¯ D f j dimensionless production of crack j
η ¯ D 0 i , j the dimensionless pressure drop generated by crack j at crack i
η ¯ w D no dimensional pressure degradation at bottom hole
rDthe distance from any point in the formation to a point source
K0zeroth-order Bessel functions of the second kind of imaginary argument
lffracture half-length, m

References

  1. Tu, X. Research on Productivity Evaluation of Horizontal Well in Low Permeability Reservoir. Master’s Thesis, Southwest Petroleum University, Chengdu, China, 2017. [Google Scholar]
  2. Bear, J.; Zaslavasky Dirmay, S. Physical principle of water percolation and seepage. J. Hydrol. 1970, 12, 63. [Google Scholar] [CrossRef]
  3. Feng, W.; Ge, J. Unsteady Darcy low velocity seepage in single medium and double medium. Pet. Explor. Dev. 1985, 12, 56–62. [Google Scholar]
  4. Ruan, M.; He, Q. Identification method of critical point and critical parameter of low permeability non-Darcy seepage. J. Xi’an Shiyou Inst. (Nat. Sci. Ed.) 1999, 14, 16–17. [Google Scholar]
  5. Yao, Y.; Ge, J.; Li, X. Study on oil-water two-phase seepage in low permeability reservoir. J. Xi’an Shiyou Inst. (Nat. Sci. Ed.) 2005, 29, 52–56. [Google Scholar]
  6. Xiao, W.; Li, T.; Li, M.; Zhao, J.; Zheng, L.; Li, L. Stress sensitivity evaluation of tight reservoir. Pet. Explor. Dev. 2016, 43, 107–114. [Google Scholar] [CrossRef]
  7. Cheng, L.; Ren, S.L.; Lian, P.Q. Well test analysis on low velocity and non-Darcy flow in dual-porosity reservior with dynamic boundary. Chin. J. Comput. Mech. 2022, 28, 879–883. [Google Scholar]
  8. Guo, J.; Zhang, L.; Wang, H.; Feng, G. Pressure transient analysis for multi-stage fractured horizontal wells in shale gas reserviors. Transp. Porous Media 2012, 93, 635–653. [Google Scholar] [CrossRef]
  9. Liu, J.; Liu, X.; Hu, Y. Study on nonlinear seepage law of low permeability rock. J. Rock Mech. Eng. 2003, 22, 556–561. [Google Scholar]
  10. Jiang, R.; Tao, L.; Zhang, N.; Zhang, X. Oil-water two-phase productivity analysis of low permeability heterogeneous horizontal Wells. J. China Univ. Min. Technol. 2008, 37, 384–388. [Google Scholar]
  11. Guo, Y.; Lu, D.; Zeng, Q.; Zeng, Y. There is a mathematical model of starting pressure gradient seepage. J. China Univ. Sci. Technol. 2005, 4, 492–498. [Google Scholar]
  12. Cheng, S.; Gan, Q.; Cheng, Z.; Mei, Q. Nonlinear seepage pressure analysis of low permeability reservoir. Oil Gas Well Test. 2005, 14, 1–4. [Google Scholar]
  13. Liu, Y. A vertical fracture well test model is considered for starting pressure gradient low permeability dual media reservoir. Oil Gas Well Test. 2010, 5, 5–9. [Google Scholar]
  14. Pedrosa, O.A. Pressure Transient Response in Stress-Sensitive Formations. In Proceedings of the SPE California Regional Meeting, Oakland, CA, USA, 2–4 April 1986. [Google Scholar] [CrossRef]
  15. Qu, Z.; Qu, H.; Tian, X.; Cui, Q.; Wen, Q. Variable starting pressure gradient test study considering pressure sensitive effect. Oil Drill. Technol. 2012, 40, 78–82. [Google Scholar]
  16. Wang, J.; Liu, H.; Liu, R.; Xu, J. Numerical simulation of low-and ultra-low-permeability reservoirs considering start-up pressure and stress sensitivity. J. Rock Mech. Eng. 2013, 32, 3317–3327. [Google Scholar]
  17. Liu, B.; Li, Q.; Zhang, F.; Wang, X.; Li, G.; Lu, C.; Yue, H.; Wang, Z. Analysis of unstable productivity of multistage fractured horizontal fractured Wells in tight reservoirs. Oil Gas Geol. 2014, 35, 138–142. [Google Scholar]
  18. Guo, C.; Wang, J.; Wei, M.; He, X.; Bai, B. Multi-Stage Fractured Horizontal Well Numerical Simulation and Application in Tight Shale Reservoirs. In Proceedings of the SPE 176714 Russian Petroleum Technology Conference, Moscow, Russia, 26–28 October 2015. [Google Scholar]
  19. Larsen, L.; Hegre, T.M. Pressure Transient Analysis of Multifractured Horizontal Wells. In Proceedings of the SPE Annual Technical Conference and Exhibition, New Orleans, LA, USA, 25–28 September 1994. [Google Scholar] [CrossRef]
  20. Raghavan, R.S.; Chen, C.-C.; Agarwal, B. An Analysis of Horizontal Wells Intercepted by Multiple Fractures. SPE J. 1997, 2, 235–245. [Google Scholar] [CrossRef]
  21. Chen, C.-C.; Raghavan, R. A Multiply-Fractured Horizontal Well in a Rectangular Drainage Region. SPE J. 1997, 2, 455–465. [Google Scholar] [CrossRef]
  22. Ozkan, E.; Brown, M.; Raghavan, R.; Kazemi, H. Comparison of Fractured Horizontal-Well Performance in Conventional and Unconventional Reservoirs. In Proceedings of the SPE Western Regional Meeting, San Jose, CA, USA, 24–26 March 2009. [Google Scholar] [CrossRef]
  23. Yao, J.; Liu, P.Y.; Wu, M.L. Well Test Analysis of Fractured Horizontal Wells in Fractured Reservoirs. J. China Univ. Pet. (Ed. Nat. Sci.) 2013, 37, 107–113+119. [Google Scholar]
  24. Su, Y.; Wang, W.; Zhou, S.; Li, X.; Mu, L.; Lu, M.; Sheng, G. Three-linear flow model and fracture placement strategy for volumetric fracturing horizontal wells. Oil Gas Geol. 2014, 35, 435–440. [Google Scholar]
  25. Ren, Z.; Li, X.; Jiang, H.; Yuan, S.; Xia, Y.; Zhu, M. Three-dimensional Unsteady Seepage Model of Segmented Fractured Horizontal Wells in Low Permeability Reservoirs Considering Stress Sensitivity. Sci. Online 2023, 18, 10–16+32. [Google Scholar]
  26. Ren, Z.; Wang, X.; Cui, S.; Yang, X.; Yang, Q.; Bi, G. Semi-analytical seepage model of volumetric fracturing horizontal wells in tight oil reservoirs. Fault-Block Oil Gas Field 2018, 25, 488–492. [Google Scholar]
  27. Teng, W.; Jiang, R.; Teng, L.; Qiao, X.; Jiang, Y.; He, J.; Gao, Y. Production performance analysis of multiple fractured horizontal wells with finite-conductivity fractures in shale gas reservoirs. J. Nat. Gas Sci. Eng. 2016, 36, 747–759. [Google Scholar] [CrossRef]
  28. Feng, Q.; Wei, Q.; Yang, S.; Du, Q.; Liao, M.; Wang, G. The influence of starting pressure and dynamic boundary on the interpretation of unstable well testing in tight gas reservoirs is studied. Unconv. Oil Gas 2016, 3, 71–78. [Google Scholar]
  29. Zou, Y. Study on Productivity of Fractured Horizontal Wells in Tight Reservoirs. Master’s Thesis, Southwest Petroleum University, Chengdu, China, 2017. [Google Scholar]
  30. Liu, B. Steady state production prediction model of fractured horizontal well in heterogeneous reservoir. Liaoning Chem. Ind. 2017, 46, 351–353. [Google Scholar]
  31. Cao, L.; Lu, L.; Li, X.; Wang, H.; He, W.; Deng, Y.; Xu, B.; Jiang, L. A Composite Transient Model for Multi-Fractured Horizontal Well in Tight Gas Reservoirs Based on Multi-Factor Effect. In Proceedings of the Spe Kingdom of Saudi Arabia Technical Symposium & Exhibition, Dammam, Saudi Arabia, 23–26 April 2018. [Google Scholar]
  32. Jiang, R.; Ni, Q.; Zhang, C.; Zhang, F.; Gao, Y.; Lin, J. Study on variable starting pressure gradient seepage model and numerical simulation of heavy oil reservoirs based on stress sensitivity. Oil Gas Geol. Recovery 2021, 28, 54–62. [Google Scholar]
  33. Liu, J.; Di, W.; Zhang, X.; Song, K.; Zhu, W.; Dong, L.; Li, Y. Analysis of productivity and inversion parameters of low permeability reservoir with heterogeneous permeability configuration. J. Northeast Pet. Univ. 2016, 40, 108–113. [Google Scholar]
Figure 1. Point source diagram.
Processes 13 01934 g001
Figure 2. Schematic diagram of the mirror principle of the top-bottom closed-boundary reservoir.
Processes 13 01934 g002
Figure 3. Schematic diagram of staged-fractured horizontal wells.
Processes 13 01934 g003
Figure 4. Model correctness verification.
Processes 13 01934 g004
Figure 5. Division of different seepage stages of staged-fractured horizontal wells.
Processes 13 01934 g005
Figure 6. Sensitivity analysis of starting pressure gradient.
Processes 13 01934 g006
Figure 7. Sensitivity analysis of wellbore reservoir coefficient.
Processes 13 01934 g007
Figure 8. Sensitivity analysis of skin factor.
Processes 13 01934 g008
Figure 9. Sensitivity analysis of crack length.
Processes 13 01934 g009
Figure 10. Permeability modulus sensitivity analysis.
Processes 13 01934 g010
Table 1. Basic parameter setting table of homogeneous reservoir.
Parameter TypeValueUnit
reservoir length × width × thickness1090 × 1090 × 10m
X-direction permeability2.0mD
Y-direction permeability0.02mD
Z-direction permeability0.1mD
Porosity0.2%
Fracture half-length 150m
Fracture half-length 2, 370m
Fracture height10m
Fracture width0.0027m
Initial reservoir pressure34.5MPa
Compressibility of rock0.000435MPa−1
Coefficient of wellbore storage0.1dimensionless
Skin factor0.1dimensionless
Starting pressure gradient0.01MPa/m
Permeability modulus0.005MPa−1
Well yield30m3/d
Table 2. Table of sensitivity analysis results.
Parameter TypeImpact StageDirection of InfluenceTypical Feature Correlation
Starting Pressure GradientAdvanced stage (Stage IV)Significantly increase pressure dropThe end of the pressure derivative curve is upwardly curved.
Wellbore Storage CoefficientExtremely early stageRaise the initial pressure gradientThe initial section of the pressure derivative curve is steep.
Skin CoefficientRadial flow stageThe distribution pattern of perturbation pressureThe platform section of the pressure derivative curve is elevated.
Crack LengthEarly stage (I–II)Shorten the duration of the linear flowThe pressure drop curve has shifted downward as a whole.
Permeability ModulusMiddle and advanced stages (III–IV)Accelerate pressure decayThe slope of the double radial flow deviates from the theoretical value of 0.36.
Disclaimer/Publisher’s Note: The statements, opinions and data contained in all publications are solely those of the individual author(s) and contributor(s) and not of MDPI and/or the editor(s). MDPI and/or the editor(s) disclaim responsibility for any injury to people or property resulting from any ideas, methods, instructions or products referred to in the content.

