Article

Optimal Process Control for Rotor Speed Recovery and Secondary Frequency Drop Mitigation in Wind Turbine Frequency Regulation

1
Department of Public Courses, Inner Mongolia Technical College of Construction, Hohhot 010070, China
2
College of Energy and Power Engineering, Inner Mongolia University of Technology, Hohhot 010051, China
*
Author to whom correspondence should be addressed.
Processes 2025, 13(6), 1932; https://doi.org/10.3390/pr13061932
Submission received: 19 May 2025 / Revised: 9 June 2025 / Accepted: 13 June 2025 / Published: 18 June 2025
(This article belongs to the Section Process Control and Monitoring)

Abstract

:
Driven by the demand for low-carbon and sustainable development, power systems are increasingly transitioning toward higher proportions of renewable energy and power-electronic interfaces, leading to a growing requirement for wind turbines to provide inertia support and frequency regulation (FR). Wind turbine kinetic energy-based FR inherently involves a trade-off between rotor speed recovery and grid stability: aggressive acceleration exacerbates the secondary frequency drop (SFD), while suppressing SFD prolongs rotor speed recovery. This study aims to resolve this dynamic coupling conflict and optimize the rotor speed recovery process by employing a segmented rotor speed recovery strategy. Firstly, a detailed wind farm-integrated frequency response model is developed. Leveraging its identified speed recovery dynamics, a five-dimensional rotor speed recovery evaluation framework is established. Subsequently, guided by this evaluation framework, a segmented rotor speed recovery control strategy is designed. Finally, three validation scenarios—a single wind turbine, 10% wind power penetration, and 30% wind power penetration—are constructed to evaluate the proposed strategy. Comparative analysis demonstrates that the proposed segmented rotor speed recovery strategy reduces aerodynamic power recovery time by 28.5% and power disturbance by 47.3% in an operational scenario with 30% wind power penetration, effectively achieving synergistic coordination of recovery acceleration and SFD suppression.

1. Introduction

Propelled by global environmental protection and low-carbon sustainable development initiatives, the installed capacity of renewable energy (RE) is on an exponential growth trajectory. China’s projected RE installed capacity is expected to reach 5.8 TW (including 2.24 TW of wind power) by 2050 [1]. However, the increasing penetration of power-electronics-dominated RE sources is reducing the presence of traditional synchronous generators (SGs) in power systems, resulting in depleted system rotational inertia and compromised frequency regulation capabilities, critically challenging system security and stability [2,3]. Enhancing the dynamic frequency support of wind turbine clusters is critical to maintaining the stability of grids with high renewable penetration.
Power reserve provides the operational basis for inertial response and frequency regulation in wind turbine generator (WTG) clusters. Current research focuses on two primary sources: additional energy storage systems (ESS) or wind turbine shaft kinetic energy. The ESS-supported frequency regulation (FR) framework [4] employs coordinated operation between an energy storage plant and a wind farm; refs. [5,6] integrates ESS in parallel with a wind turbine DC bus via a DC-DC converter; ref. [7] and substitutes a DC bus capacitor with lithium-ion supercapacitors for topological simplification. This ESS-supported scheme enables fast power response and FR on a minute-to-hour timescale. Since the ESS power control is typically decoupled from the wind turbine power control, the ESS can be considered a standalone FR source. The kinetic energy-based FR framework [8] adopts rotor overspeed deloading to amplify kinetic energy reserves and [9,10] implements pitch-reserve deloading by releasing reserved pitch angles during FR events to boost aerodynamic power input. This kinetic energy-based scheme enables fast power response and second timescale frequency support but incurs reduced wind farm generation efficiency due to sustained deloading operations, resulting in quantifiable economic losses. As wind turbine capacities increase, larger rotor diameters exhibit greater kinetic energy, thereby enabling extended-duration frequency regulation operations.
The complete kinetic energy-based FR process consists of two distinct phases: the kinetic energy release phase and the rotor speed recovery phase. The control strategies during the kinetic energy release phase fall into two categories: grid-following (GFL) strategies and grid-forming (GFM) strategies. The GFL strategy integrates proportional-derivative (PD) grid frequency control into the wind turbine power control outer loop to realize frequency regulation [11]. This method uses a proportional component to emulate primary frequency regulation (PFR) droop characteristics, while using the derivative component to provide synthetic inertia. However, this architecture inherently relies on grid voltage measurements by a phase-locked loop (PLL), resulting in degraded FR performance under weak grid conditions [12]. Frequency self-synchronization is a typical feature of GFM strategies. The study in [13] introduces a virtual synchronous generator (VSG) strategy, in which the power outer-loop control is constructed using the swing equations of an SG, enabling wind turbines to emulate the power dynamics of an SG in inertial response and PFR. Compared with the GFL strategy, the GFM strategy provides enhanced stability in weak grids and improved frequency support capability.
In PFR control, the PFR power in [14] is solely determined by the frequency deviation. At the end of the kinetic energy release phase, the discrepancy between the elevated PFR power and the reduced aerodynamic power leads to significant wind turbine power curtailment, resulting in severe secondary frequency drop (SFD) phenomena in the grid [15] incorporates the wind turbine aerodynamic power curtailment into the PFR power, effectively mitigating the SFD at the end of the kinetic energy discharge phase.
The rotor speed recovery process refers to the acceleration of the wind turbine rotor speed from post-kinetic energy-release states back to the maximum power point tracking (MPPT) optimal speed under current wind conditions, achieved through the generator-side power deloading control. As demonstrated in [16], the SFD during rotor speed recovery is directly governed by the generator deloading characteristics, which are determined by the power-speed control function PWTG(ω).
Conventional MPPT-based rotor speed recovery strategies in [17] induce severe SFD magnitudes, thereby directly degrading grid frequency stability as experimentally validated. To limit the SFD, the study in [18] implemented a power-constrained MPPT function that strategically limits power deloading during the initial rotor speed recovery phase. Both control strategies generate stepwise power transients during the initial rotor speed recovery phase, resulting from discontinuous operating points switching in the power-speed control function.
To mitigate grid frequency disturbances induced by power-step transients, the study in [19] implements a flexible power deloading scheme, transitioning to an MPPT-based rotor speed recovery strategy upon reaching a predetermined rotor speed threshold. Further research on flexible power deloading strategies includes studies utilizing the exponential function [20], upward-opening semicircular function [21], time-decaying adaptive deloading function [22], and Logistic function [23] for deloading command generation. The above five strategies ensure smooth power variation in wind turbines through continuous deloading operation, with SFD suppression effects demonstrated.
The rotor speed recovery process exhibits interdependent constraints between the recovery rate and magnitude of the SFD perturbation. Existing research on speed recovery strategies primarily focuses on suppressing the SFD induced during this process, with inadequate holistic analysis of the recovery dynamics. This study proposes a segmented speed recovery strategy to achieve coordinated optimization between recovery rate and SFD perturbations, thereby enhancing the kinetic energy-based FR capability of wind turbines. The rotor speed recovery initiation state in this study is defined by the end state of the kinetic energy discharge phase that is governed by both the VSG control strategy and PFR strategy with aerodynamic power reduction compensation. The main contributions of this study are summarized below.
(1) For the rotor speed recovery process, this paper proposes a five-dimensional performance evaluation framework capable of holistically quantifying grid frequency disturbances and recovery rate dynamics. This framework enables quantitative evaluation of existing speed recovery strategies while providing directional guidance for optimization design in speed recovery control strategies.
(2) Leveraging stage-specific dynamic characteristics during rotor speed recovery, this study proposes a segmented control strategy. Through the stage-specific configuration of power references, the methodology achieves an optimal balance between grid disturbance mitigation and recovery rate acceleration.
The rest of this study is organized as follows. Section 2 develops a wind farm-integrated grid frequency response model. Section 3 details the speed recovery evaluation framework and segmented control strategy designs. Section 4 validates the proposed strategy and conducts a framework-based comparison. Section 5 concludes this study.

2. Models and Characteristics of the System Frequency Response

The system frequency response is fundamentally a transient process of dynamic redistribution of power between the source and load under the active power imbalance, contingent on each frequency characteristic. In conventional power systems, the frequency response of SGs and loads dictates the system frequency response (SFR). However, as the installed capacity of wind power and its share in power generation increase, the frequency response characteristics of wind power will alter the SFR.

2.1. Conventional System Frequency Response Model

The frequency response model of synchronous generators is typically derived using rotor dynamic equations.
P m P e = ω 0 ( J d ω dt + D ω ) .
Here, Pm is the mechanical power, Pe is the electromagnetic power, ω0 is the rotor speed, J is the moment of inertia, D is the damping coefficient, and Δω is the speed variation.
The power system contains a certain number of SGs. Given the parameter disparities among the various units, interactions between them are inevitable, resulting in a complex overall frequency response model of the system. To simplify this issue, the analysis should focus on the steady-state component of each unit’s frequency response within the primary frequency control timeframe—that is, the common frequency characteristics [24].
ω ( s ) = P d i = 1 n G SG , i ( s ) .
Here, ΔPd is the disturbance power and GSG,i(s) is the transfer function from the frequency to the power of the i-th synchronous unit. GSG,i(s) based on (1), taking into account the speed governor [25], can be written as follows:
G SG , i ( s ) = ω 0 ( J i s + D i ) + 1 K PFR , i ( 1 T g s + 1 ) .
Here, the subscript i denotes the parameters of the i-th SG unit. KPFR is the PFR droop coefficient, and Tg is the equivalent time constant of the governor system. Equation (3) is derived under the following assumptions:
Constant generator terminal voltage: This decouples the frequency dynamics from excitation system transients (e.g., automatic voltage regulator (AVR) and power system stabilizer (PSS)), thereby isolating the power-frequency response.
The linearized governor-turbine model excludes nonlinear effects such as governor dead bands, actuator saturation limits, and valve rate constraints in steam turbines.
Equation (3) is a general frequency response model for SGs. Given the similarity in the model structure, it is possible to combine them in order to obtain the overall frequency response of multiple SGs.
J eq = J i       D eq = D i       1 / K PFReq = ( 1 / K PFR , i ) .
Here, the subscript eq indicates the equivalent parameter subsequent to the polymerization of the SGs.
Motor-dominated loads exhibit frequency regulation characteristics. Within the primary frequency control time frame, the steady-state frequency characteristics of loads can be considered exclusively, while their dynamic response to the rate of change in frequency (RoCoF) can be neglected to reduce the order of its frequency response model.
P L = 1 K L f .
Here, ΔPL is the load regulation power, KL is the load droop coefficient, and Δf is the Grid frequency change.

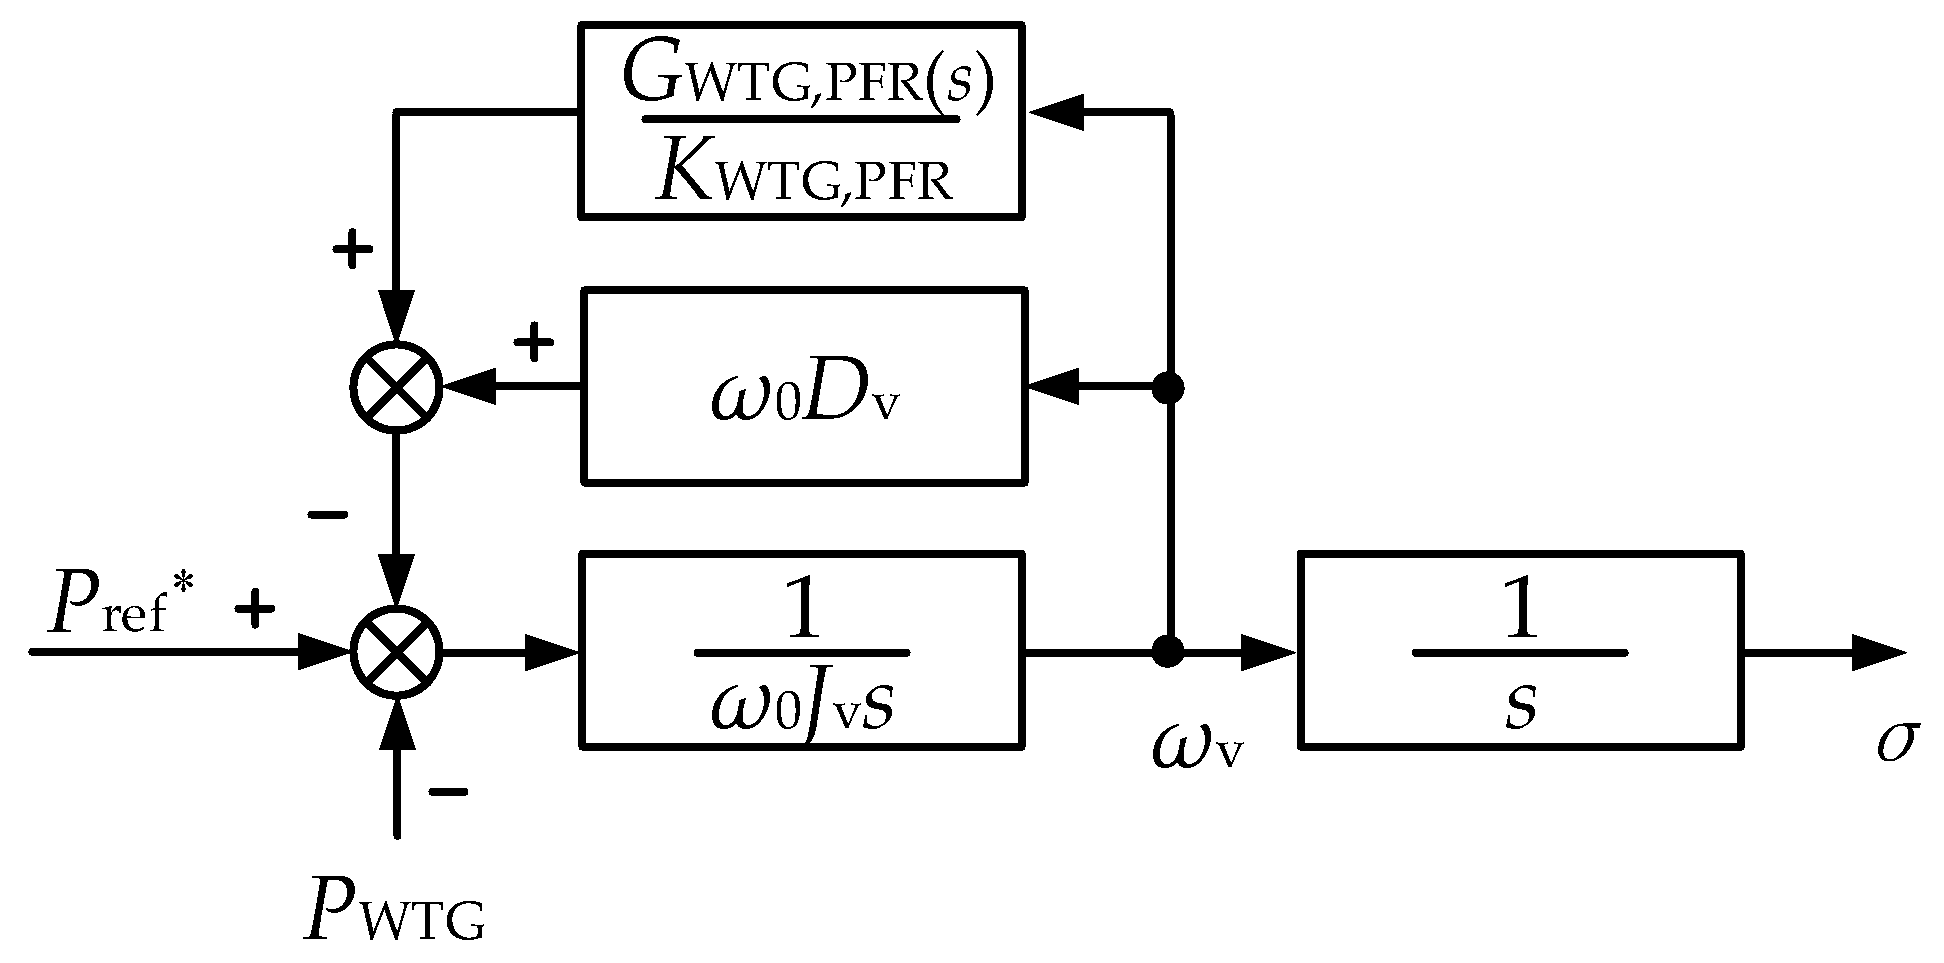
2.2. Windfarm Frequency Response Models

The frequency support provided by WTGs essentially utilizes the reserve kinetic energy of wind turbines to supply additional power for frequency regulation. This process involves two previously defined phases with opposite rotor kinetic energy flow directions: the kinetic energy discharge phase and the rotor speed recovery phase. The term “frequency regulation” as employed in this paper, specifically pertains to scenarios involving grid frequency dip.
During the kinetic energy discharge phase, the frequency response of wind turbines differs from that of SGs. Wind turbines are connected to the grid either via or governed by power-electronic converters, and their frequency response is dictated by power control strategies. This structure facilitates flexible and controllable frequency regulation, but also introduces increased complexity imposed by wind turbine aerodynamics.
The present study utilizes a fitted form of wind turbine aerodynamic model that is consistent with the model outlined in [26].
P A = 1 2 ρ π R 2 C p ( λ , β ) v 3                   C p ( λ , β ) = 0.22 ( 116 λ i 0.4 β 5 ) e 12.5 λ i 1 λ i = 1 λ + 0.08 β 0.035 β 3 + 1     λ = ω r R v                                                     .
Here, PA denotes the aerodynamic power of the wind turbine, ρ is the air density, R represents the rotor radius, Cp (λ, β) is the power coefficient function (dependent on the tip-speed ratio λ and pitch angle β), v is the wind speed, and ωr is the rotor speed.
Assuming negligible wind speed variations within the seconds-level timeframe of the primary frequency control, Equation (5) reduces to a univariate function characterizing the relationship between aerodynamic power and rotor speed via variable freezing.
P A = f v = v 0 ( ω r ) .
In the context of power control, the GFM strategy is a representative approach to enable wind turbines to support grid frequency. This method embeds the power control model of the SG into the outer-loop power control of wind turbines, thereby emulating the output characteristics of the SG. The active power control architecture is illustrated in Figure 1.
According to the GFM strategy, the transfer function from frequency to power of the WTGs GWTG(s) is analogous to the structure of SGs in Equation (3):
G WTG , i ( s ) = J v , i s + D v , i + 1 K WTG , PFR G WTG , PFR ( s ) .
Here, the subscript i denotes the parameters of the i-th WTG. The Jv, Dv, KWTG,PFR, and GWTG,PFR(s) represent the virtual inertia, virtual damping, virtual droop coefficient, and equivalent transfer function of frequency regulation control, respectively.
A comparison of the frequency responses between WTGs in Equation (8) and SGs in Equation (3) reveals that, while their inertia and damping coefficients exhibit similarities, their PFR mechanisms diverge. This discrepancy can be attributed to two primary factors:
(1)
Rapid Power Response: The PFR power output of WTGs is unaffected by the turbine-governor inertia (in contrast to SGs), enabling near-instantaneous power injection during frequency deviations.
(2)
Aerodynamic Coupling: Increased active power output reduces the WTG rotor speed (governed by the turbine shaft dynamics in Equation (9)), thereby decreasing aerodynamic power (PA) and limiting sustained frequency regulation.
P A P WTG = ω r J WTG d ω r dt .
Here, PWTG denotes the output power of the WTG, and JWTG represents the moment of inertia of the wind turbine shaft system. The damping of the shaft system is neglected.
For the WTG primary frequency regulation transfer function in Equation (8), the distinct transfer function GWTG,PFR(s) generates different frequency responses. Two representative PFR schemes for grid-connected WTG primary frequency regulation control are as follows:
(1)
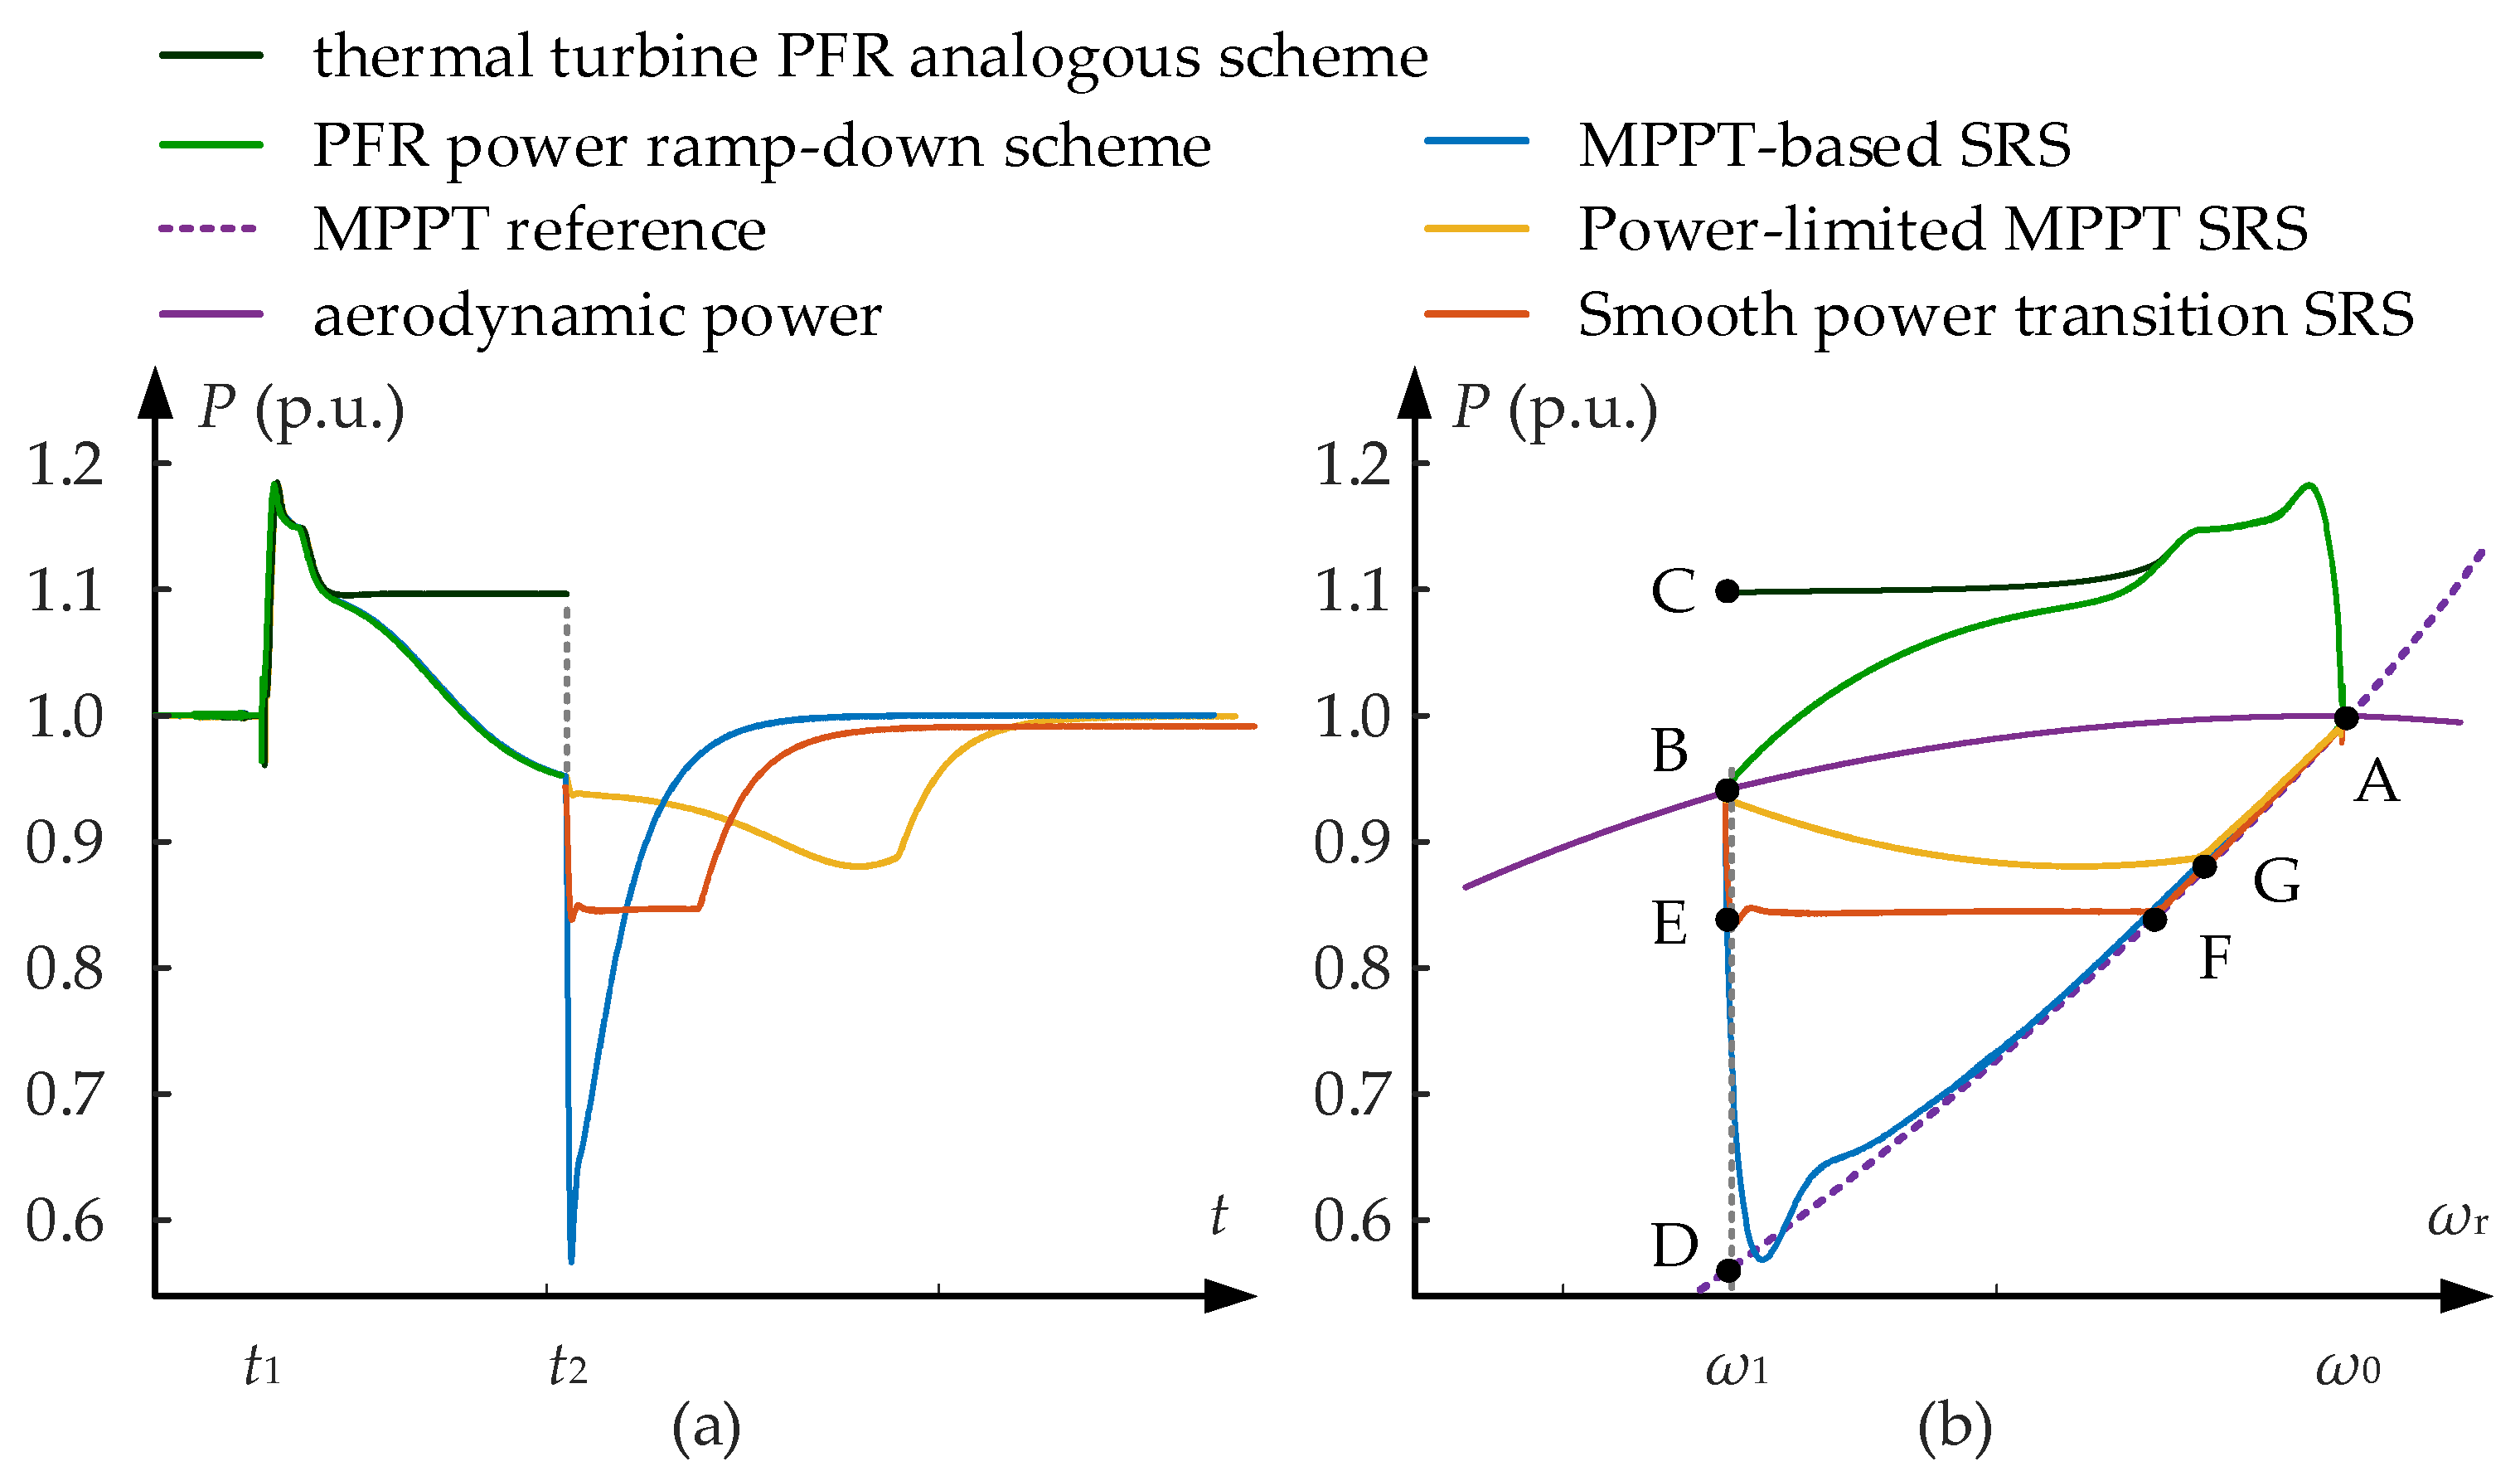
Thermal turbine PFR analogous scheme (excluding hysteresis compensation).
G WTG , PFR ( s ) = 1 .
The output power and wind turbine operating status in this method are shown in Figure 2a,b. While this method achieves higher frequency regulation power, the significant power derating at the end of RFR introduces a grid power disturbance, potentially causing a secondary frequency dip.
(2)
PFR power ramp-down scheme [27]. Considering the aerodynamic power reduction caused by rotor speed decline, the PFR power should progressively decrease with ωr. Due to the constraints of the transfer function in linear time-invariant (LTI) systems, ωr cannot be directly integrated into GWTG,PFR(s). A first-order high-pass filter block is implemented to emulate specific PFR power reduction dynamics associated with ωr.
G WTG , PFR ( s ) = T 1 s T 1 s + 1 .
The output power characteristics versus wind turbine operating states are illustrated in Figure 2a,b, where the frequency regulation power profile aligns with the physical model simulations in Section 4. The method reduces the magnitude of power derating at the end of frequency regulation, achieving a balance between high-frequency support capacity and post-event power reduction, thereby effectively mitigating the risk of the SFD.
During the rotor speed recovery phase, the wind turbine transitions into a power-fluctuating source that no longer responds to grid frequency deviations but still affects the grid frequency through its active power variations. The design of the power-speed control function PWTG(ω)is critical to balance rotor kinetic energy recovery and grid frequency stability. The rotor speed recovery process corresponds to the trajectory from post-kinetic-energy-release operating points B or C back to the steady-state operating point A in Figure 2b.
A comparison of three types of speed recovery control schemes in existing studies is shown in Table 1 and Figure 2.
Existing methods do not holistically address the trade-off between rotor speed recovery rapidity and SFD restriction. This study prioritizes the speed recovery function as the focus, proposes the evaluation framework for rotor speed recovery performance in Section 3.2, and designs the optimized rotor speed recovery function in Section 3.3.

2.3. System Frequency Response Characteristics

By integrating the frequency response models of SGs in Equations (3) and (4), loads in Equation (5), and WTGs in Equations (8) and (11), a system-level frequency response model of the power system is established. Under a 10% step-load disturbance, the dynamic frequency responses are simulated over wind power penetration levels ranging from 0% to 50% in 10% increments, as shown in Figure 3.
As shown in Figure 3, the faster frequency response dynamics of WTGs relative to SGs result in a progressive improvement in both RoCoF suppression and frequency nadir elevation during frequency regulation with increasing wind penetration levels. During the rotor speed recovery phase, increased wind power penetration levels induce greater active power curtailment, consequently exacerbating SFD magnitudes.

3. Segmented Wind Turbine Speed Recovery Strategy

SFD poses a critical challenge to system frequency restoration during wind turbine speed recovery, exacerbating frequency deviations and threatening grid security. As shown in [19], rotor speed recovery exhibits an inherent trade-off between SFD magnitude and recovery rate. This interdependence requires holistic optimization beyond isolated SFD mitigation. In this chapter, a multidimensional rotor speed recovery evaluation framework is proposed and a corresponding segmented recovery strategy is developed.

3.1. Mechanism of SFD During Wind Turbine Speed Recovery

The transition in wind turbine operation from frequency regulation to rotor speed recovery leads to power derating, which, in turn, triggers the SFD.
Following the deactivation of WTGs from frequency regulation, the SFR model transitions to the SG-dominated regime, where SGs provide the sole inertial and primary frequency regulation contributions. In this section, the SFR caused by WTGs’ power derating ΔPWTGs is the primary focus. Consequently, it is assumed that when WTGs exit frequency regulation mode, the PFR of SGs has reached a steady state, i.e., the ΔPWTGs-induced SFR is a zero-state response. The SFR parameter definitions and dynamic model during the WTG rotor speed recovery phase are detailed in Figure 4.
Figure 4a illustrates the post-disturbance sequence: load disturbance onset at t1, and the WTGs exiting frequency control at t2. Post-t2, the SFD severity can be quantified by RoCoF2,max (max RoCoF) and Δfgrid2,max (relative max frequency deviation). Figure 4b illustrates the post-t2 parameters: ΔPWTGs (WTGs’ power derating at t2), ΔPerr (system power imbalance), Δω2 (SGs’ rotor speed deviation relative to t2 speed), and Δfgrid2 (system frequency deviation relative to t2 frequency).
The RoCoF2,max is determined by the maximum system power imbalance, as indicated by (10)
RoCoF 2 = P err 2 π ω 0 J eq .  
The transfer function GPerr(s) from ΔPWTGs(s) to ΔPerr(s) is derived based on the mathematical model in Figure 4b. This transfer function quantifies the impact of wind power derating on system power imbalance, thereby enabling the calculation of the RoCoF2,max.
G Perr ( s ) = 1 1 + 1 J eq s ( D e q + ( 1 ω 0 K eq ( 1 T g s + 1 ) + 1 ω 0 K L ) ) .
Similarly, the transfer function Gfgrid2(s) from ΔPWTGs(s) to Δfgrid2(s) is derived via the dynamics in Figure 4b. This transfer function quantifies the impact of wind power derating on system frequency, thereby enabling the calculation of the Δfgrid2,max.
G fgrid 2 ( s ) = 1 ω 0 ( J eq s + D e q ) + 1 K eq ( 1 T g s + 1 ) + 1 K L ) .
The input disturbance ΔPWTGs(s) emulates WTGs power derating dynamics during the rotor speed recovery phase through a step power signal ΔPWTGs cascaded with a first-order lag filter.
Δ P WTGs ( s ) = Δ P WTGs s ( 1 T WTG s + 1 ) .
Here, TWTG denotes the inertial time constant governing WTGs’ power derating. As TWTG approaches zero, the power perturbation ΔPWTGs(s) approximates a step disturbance. Conversely, for large TWTG values, ΔPWTGs(s) mimics a linear disturbance during the initial phase (tTWTG).
The magnitude of wind power derating ΔPWTGs is set to 0.03 p.u. (30% wind penetration with 10% WTG derating) of the system load power. Under the input disturbance defined in Equation (15), the power imbalance ΔPerr(s) and frequency deviation Δfgrid2(s) are calculated using Equations (13) and (14). The time-domain responses are shown in Figure 5, obtained through inverse Laplace transformation.
As demonstrated in Figure 5, the transient characteristics of ΔPerr(t) and Δfgrid2(t) exhibit distinct variations across different TWTG values. As shown in Figure 5a, a decrease in TWTG values results in the maximum system power deviation ΔPerr approaching the disturbance power amplitude. Conversely, an increase in TWTG progressively reduces the maximum power deviation, as well as the maximum rate of frequency change RoCoF2,max by Equation (12). As shown in Figure 5b, the Δfgrid2,max decreases with increasing TWTG values, eventually reaching a plateau once TWTG exceeds a critical threshold.
Consequently, under conditions of equivalent ΔPWTGs disturbances, a moderate reduction in the power ramp rate has been shown to mitigate SFD severity and enhance SFR.

3.2. Evaluation Framework for Rotor Speed Recovery Performance

The rotor speed recovery process exhibits a dynamic interplay between the recovery rate and the power disturbance magnitude imposed on the power system. Higher power derating accelerates rotor speed recovery at the expense of inducing SFD, while moderate derating reduces SFD severity but prolongs recovery duration. This delayed recovery creates wind power deficits requiring compensation from frequency-regulating SGs, which adversely affects grid frequency recovery.
The evaluation of rotor speed recovery should be guided by superior SFR characteristics. A comprehensive assessment framework can effectively direct the optimization design of speed recovery control strategies. This section proposes five multidimensional evaluation metrics specifically designed for the rotor speed recovery process, with the metrics corresponding to different recovery phases as depicted in Figure 6.
In Figure 6, P0 denotes the initial aerodynamic power, ΔPA denotes the maximum aerodynamic power drop of the wind turbine, t3 denotes the instant when 90% of ΔPA is recovered, and t4 denotes the instant when rotor speed recovery is completed. The evaluation metrics are described in detail below.
(1) Maximum Power Deviation, negative (MPD-): The MPD- metric characterizes the RoCof2,max during rotor speed recovery, serving as an SFD severity indicator, with derivations in Section 3.1.
(2) Maximum Frequency Deviation, negative (MFD-): The MFD metric characterizes the Δf2,max during rotor speed recovery, serving as an SFD severity indicator, with derivations in Section 3.1.
Power derating predominantly occurs during the initial stage of the rotor speed recovery phase. Consequently, the MAPD and MFD metrics are quantified within this interval.
(3) Aerodynamic Power Recovery Time (APRT): The APRT metric characterizes the rate of aerodynamic power recovery. The completion of aerodynamic power recovery is the critical factor for WTG power recovery. The APRT is calculated as
t APRT = t 3 t 2 .
Aerodynamic power recovery of wind turbines occurs primarily during the mid-stage of the rotor speed recovery phase, and the APRT metric is quantified within this specific phase.
(4) Power Transient Intensity, 2nd order (PTI-2): The PTI-2 metric is calculated as the variance of the second-order difference of the power sequence during rotor speed recovery. This metric quantifies the smoothness of the WTG power variation during the recovery process. A lower PTI-2 value indicates smoother power transitions, thereby reducing grid frequency disturbances. The TPI-2 is calculated as
Var ( 2 P WTG ) = 1 ( n 2 ) 1 j = 1 n 2 ( 2 P WTG ( j ) 2 P WTG ¯ ) .
Here, n denotes the number of elements in the power sequence, and Δ2PWTG(j) denotes the second-order power difference sequence, which is calculated as
2 P WTG ( j ) = P WTG ( j + 1 ) P WTG ( j )   ( j = 1 , 2 , , n 2 ) .
Here, ΔPWTG(j) denotes the first-order power difference sequence, which is calculated as
P WTG ( j ) = P WTG ( j + 1 ) P WTG ( j ) ( j = 1 , 2 , , n 1 ) .
Here, PWTG(j) denotes the power sequence.
(5) Transient Dynamic Energy Dissipation Loss (TDEDL): The TDEDL metric is calculated by integrating the difference between the initial power and the actual power. This metric holistically reflects the depth of power derating and the dynamics of aerodynamic power recovery, quantifying the efficiency of rotor speed recovery. The TDEDL is calculated as
W TDPDL = t 2 t 4 ( P W 0 P WTG ) dt .
The PTI-2 and TDEDL metrics are designed for and quantified throughout the entire rotor speed recovery phase.

3.3. Design Principles of Segmented Rotor Speed Recovery

Rotor speed recovery is achieved by controlling the power of the WTG. The segmented rotor speed recovery strategy proposed in this section is based on the following principles:
(1) Based on the conclusions from Section 3.1, controlling the rate of power derating of the WTG during the initial rotor speed recovery phase modulates the balance between the SFD severity and aerodynamic power recovery rate.
(2) Based on the aerodynamic characteristics mathematically defined in Equations (5) and (6), the aerodynamic power exhibits reduced sensitivity to rotor speed variations near the MPPT operating region. Therefore, during rotor speed recovery toward the MPPT reference value, aerodynamic power recovery precedes rotor speed recovery. As the aerodynamic power nears recovery, priority is given to recovering the active power output of the WTG, thereby expediting the transition to nominal operating conditions.
(3) During the last stage of the rotor speed recovery phase, when the wind turbine power approaches the MPPT level, the relatively small difference between aerodynamic power and electrical power is utilized to ensure the smooth completion of speed recovery.
(4) Third-order Bézier curves are employed to ensure smooth interphase transitions during the rotor speed recovery process, eliminating abrupt power variations.
Building upon the aforementioned principles, the three-stage power control curve PWTG (ω) for rotor speed recovery has been designed, with its trajectory designated as B-K-R-M-A in Figure 7.
In the diagram, Point A(ω0,P0) represents the steady-state operating point, Point B(ω1,P1) denotes the initial operating point of rotor speed recovery, and Point H(ω2,P2) corresponds to the operating point at 90% aerodynamic power recovery. Line segment BK corresponds to the first recovery stage (aerodynamic power recovery stage). With a designated slope of k1(k1 < 0), indicating power derating, BK lies on straight line L1; the Bézier curve KRM corresponds to the second recovery stage (WTG power recovery stage); the line segment MA corresponds to the third recovery stage (final rotor speed recovery stage). With a designated slope k2(k2 > 0), indicating power increasing), MA lies on straight line L2.
The design flow of PWTG(ω) is illustrated in Figure 8.
Initialization: Determine point A(ω0,P0) based on steady-state operating conditions, point B(ω1,P1) according to operating conditions at the exit of WTG kinetic energy release, and calculate point H(ω2,P2) using Equations (5) and (6).
Step 1: Determine the power derating slope k1, and establish linear equation L1.
L 1 :   P = k 1 ( ω ω 1 ) + P 1 .
Determine the increasing power slope k2 (k2 > kHA), and establish linear equation L2
L 2 :   P = k 2 ( ω ω 0 ) + P 0 .
Calculate the intersection points I and J between line L3 (ω = ω2) and lines L1/L2.
I ( ω I , P I ) = ( ω 2 , k 1 ( ω 2 ω 1 ) + P 1 ) .
J ( ω J , P J ) = ( ω 2 , k 2 ( ω 2 ω 0 ) + P 0 ) .
Step 2: Design Bézier curve KRM. Design the scaling parameters k3, and k4 to determine the endpoints of the Bézier curve.
k 3 = BK BI ,   k 4 = AM AJ .
The coordinates of points K(ωK,PK) and M(ωM,PM) can be calculated as follows:
K ( ω K , P K ) = ( ( 1 k 3 ) ω B + k 3 ω I   ,   ( 1 k 3 ) P B + k 3 P I ) .
M ( ω M , P M ) = ( ( 1 k 4 ) ω A + k 4 ω J   ,   ( 1 k 4 ) P A + k 4 P J ) .
Given δ as the Bézier curve control parameter, the coordinates of the control points N(ωN,PN) and O(ωO,PO) are determined by
N ( ω N , P N ) = ( ω K + δ 1 + k 1 2 ,     P K + δ k 1 1 + k 1 2 ) .
O ( ω O , P O ) = ( ω M δ 1 + k 2 2 ,     P M δ k 2 1 + k 2 2 ) .
With x as the parameter variable, the parametric equations for the cubic Bézier curve defined by control points K, N, O, and M are
ω ( x ) = ( 1 x ) 3 ω K + 3 ( 1 x ) 2 x ω N + 3 ( 1 x ) x 2 ω O + x 3 ω M P ( x ) = ( 1 x ) 3 P K + 3 ( 1 x ) 2 x P N + 3 ( 1 x ) x 2 P O + x 3 P M ( x [ 0   ,   1 ] ) .
Step 3: Output the final power control curve BKRMA using the PWTG(ω) function. This control curve can also be stored in a lookup table for real-time controller implementation.

3.4. WTG Coordinated Control Strategy with Segmented Rotor Speed Recovery

Power control constitutes the core of the WTG control strategy, as illustrated in Figure 9. During normal operation and frequency regulation, the MPPT control strategy provides the active power reference. When the WTG power is less than the aerodynamic power (PWTG < PAP), kinetic energy release ends and the power control logic switches to the segmented rotor speed recovery strategy. When the WTG power exceeds the aerodynamic power (PWTG > PAP), the power control logic reverts to the MPPT control strategy to restore normal operation.

4. Case Studies

An operational scenario integrating a wind farm into the IEEE 9-bus power system was developed to validate and compare the proposed segmented wind turbine speed recovery strategy. Section 4.1 details the dynamic operational waveforms of an individual wind turbine during grid frequency regulation and speed recovery processes. Section 4.2 and Section 4.3 benchmark the proposed strategy against the conventional MPPT-based SRS, Power-limited MPPT SRS and Smooth power transition SRS under distinct wind power penetration scenarios (10% vs. 30%) with quantified performance metrics in Section 3.2.
The grid system topology and parameters for this operational scenario are illustrated in Figure 10 and Table 2.

4.1. Grid Frequency Dip Operational Scenario

The grid frequency is configured to replicate an actual fault-recorded waveform. Detailed operating waveforms of an individual DFIG implementing the segmented speed recovery strategy are presented in Figure 11a–k.
The grid frequency fgrid in Figure 11a drops at 14.2 s, reaching a minimum of 49.85 Hz. Prior to the disturbance, the wind turbine maintained steady-state operation at rated conditions, with its phase voltage in Figure 11b stabilized at 780 V. During 14.2–36.6 s, the wind turbine releases kinetic energy to provide frequency regulation. From 36.3 and 109 s, the rotor speed recovers through the segmented strategy, achieving full operational recovery beyond 109 s.
During the kinetic energy release phase (14.2–36.6 s), the stator current Is in Figure 11c increases to 4.5 kA (23.8% increase), which elevates the stator power Ps in Figure 11f from 4.2 MW to 5.2 MW. This overload operation causes the rotor speed ωr in Figure 11i to decrease from 187 rad/s to 155 rad/s, shifting the wind turbine from super-synchronous to sub-synchronous operation. The slip variation induces frequency changes in the rotor excitation current Ir in Figure 11d while reducing the slip power transfer, resulting in a 500 A decrease in the grid-side converter current IGSC in Figure 11e and a 0.9 MW decrease in the converter power PGSC in Figure 11g. The wind turbine output power PWTG in Figure 11h increases to 5.8 MW (16% increase). At 36.6 s, PWTG equals the aerodynamic power PA in Figure 11h, which serves as the termination criterion for frequency regulation. The virtual power angle σVSG in Figure 11j and virtual excitation emf EVSG in Figure 11k of the stator-power-controlled VSG basically determine these dynamic power characteristics.
During the rotor speed recovery phase (36.3–109 s), the wind turbine power PWTG follows the predefined reference value according to the segmented recovery strategy:
Stage I (36.3–59 s): Controlled derating of wind turbine power PWTG at 0.017 MW/s facilitates rotor speed recovery from 155 rad/s to 174 rad/s. Electromagnetic parameters (Is, Ir, IGSC, PGSC) show inverse dynamic patterns relative to frequency regulation mode, confirming energy conversion reversal during recovery.
Stage II (59–66.6 s): At 59 s, the aerodynamic power PA in Figure 11h recovers 90% of its power reduction during the kinetic energy discharge phase (restored to 4.96 MW). The wind turbine power PWTG is rapidly increased to 4.8 MW, reaching 96% of its normal operating level.
Stage III (59–109 s): A smaller power deloading is applied to gradually restore the rotor speed to its final value.
Throughout the rotor speed recovery period, the wind turbine power PWTG varies continuously without step disturbances.

4.2. 10% Wind Power Penetration Scenario

The power system depicted in Figure 10 comprises a wind farm with twenty 5-MW wind turbines. The total system load of 950 MW is supplied by 100 MW from the wind farm (rated power) and 856 MW from three SGs (71.3% of their 1200 MW total rated capacity). At t = 15 s, a 50 MW step-load increase (5.3% of total load) occurs, with corresponding system frequency and power responses shown in Figure 12a–c. Four wind turbine rotor speed recovery strategies—Method I (Met-I, MPPT-based SRS), Method II (Met-II, Power-limited MPPT SRS), Method III (Met-III, Smooth power transition SRS), and Method IV (Met-IV, proposed segmented SRS)—are comparatively validated under identical frequency regulation controllers, with their dynamic responses quantified in these figures.
As shown in Figure 12, rotor speed recovery commences at 43 s. Met-I and Met-II implement stepwise power curtailment strategies, resulting in abrupt power reductions of wind farm output PWTGs in Figure 12c. This power deficit is compensated by SGs (PSGs in Figure 12b) through governor response.
The 38.7 MW power curtailment in Met-I (6.8 times the 5.7 MW step in Met-II) induces stronger grid disturbances, producing a 0.08 Hz grid frequency drop in Figure 12a versus the 0.02 Hz deviation observed in Met-II. This method enables faster rotor speed recovery with a trade-off of increased SFD magnitude.
Met-III and Met-IV utilize continuous power curtailment strategies, which induce significantly smaller grid disturbances compared to Met-I and Met-II. These approaches effectively mitigate SFDs but demonstrate slower rotor speed recovery. The segmented SRS in Met-IV achieves faster wind power recovery than Met-III through optimized staged power adjustments.
The performance of the four SRSs was evaluated using the metrics established in Section 3.2. During the rotor speed recovery process shown in Figure 12, intermediate process variables including power deviation (ΔPerr), frequency deviation (Δfgrid), aerodynamic power (PA), WTG power output (PWTGs), and energy dissipation losses (ED) were quantified calculated and separately presented in Figure 13a–e.
The rotor speed recovery performance metrics (MPD, MFD, APRT, PTI-2, and TDEDL) for Met-I to Met-IV are presented in Figure 14, with evaluations separately derived from the dynamic response curves in Figure 13a–e.
As demonstrated in Figure 14, the proposed segmented SRS (Met-IV) exhibits enhanced power smoothing capability while maintaining optimal coordination between SFD suppression and aerodynamic recovery acceleration, thereby fulfilling the predefined multi-objective operational requirements.

4.3. 30% Wind Power Penetration Scenario

The wind farm integrates sixty 5-MW wind turbines (total installed capacity: 300 MW) in this scenario. The total system load of 950 MW is supplied by 300 MW from the wind farm and 652 MW from three SGs (54.3% of their 1200 MW total rated capacity). Met-I to Met-IV SRSs are comparatively adopted under identical frequency regulation controllers. At t = 15 s, a 50 MW step-load increase (5.3% of total load) occurs, with corresponding system frequency and power responses shown in Figure 15a–c. The rotor speed recovery performance metrics (MPD, MFD, APRT, PTI-2, and TDEDL) for Met-I to Met-IV are presented in Figure 16.
The dynamic characteristics of grid frequency fgrid in Figure 15a, SGs power PSGs in Figure 15b, and WTGs power PWTGs in Figure 15c show close similarity to the corresponding waveforms in Figure 12. The rotor-speed recovery performance metrics in Figure 16 for Met-I to Met-IV SRSs also exhibit data consistency with Figure 14. These results demonstrate the superior dynamic performance of the proposed segmented SRS in the 30% wind power penetration scenario.
Compared with the advanced SRS strategy (Smooth power transition SRS, Met-III) in existing studies, the proposed segmented rotor SRS (Met-IV), based on the data from Figure 16, shortens aerodynamic power recovery time by 28.5% and reduces power disturbance by 47.3%.
The comparative analysis under 10% versus 30% wind power penetration scenarios demonstrates that the fast frequency response from wind turbines elevates the post-disturbance frequency nadir from 49.87 Hz to 49.90 Hz (Δf = +0.03 Hz). The reduced frequency deviation lowers the frequency regulation power, thereby extending the frequency regulation exit time from t = 43 s to t = 48.7 s (ΔT = +5.7 s) under wind turbine kinetic energy capacity constraints.
Furthermore, increased wind power penetration aggravates the SFD during rotor speed recovery, manifested by a nadir frequency decline from 49.85 Hz (10% penetration) to 49.71 Hz (30% penetration) under Met-I conditions. Consequently, the proposed segmented SRS demonstrates enhanced effectiveness in safeguarding grid security during rotor speed recovery under high wind power penetration scenarios.

5. Conclusions

This study aims to enhance speed recovery performance during rotor kinetic energy-based frequency regulation operations, proposing a segmented control strategy that controllably regulates grid frequency disturbances and adaptively modulates recovery rates. The main findings of this study are summarized below.
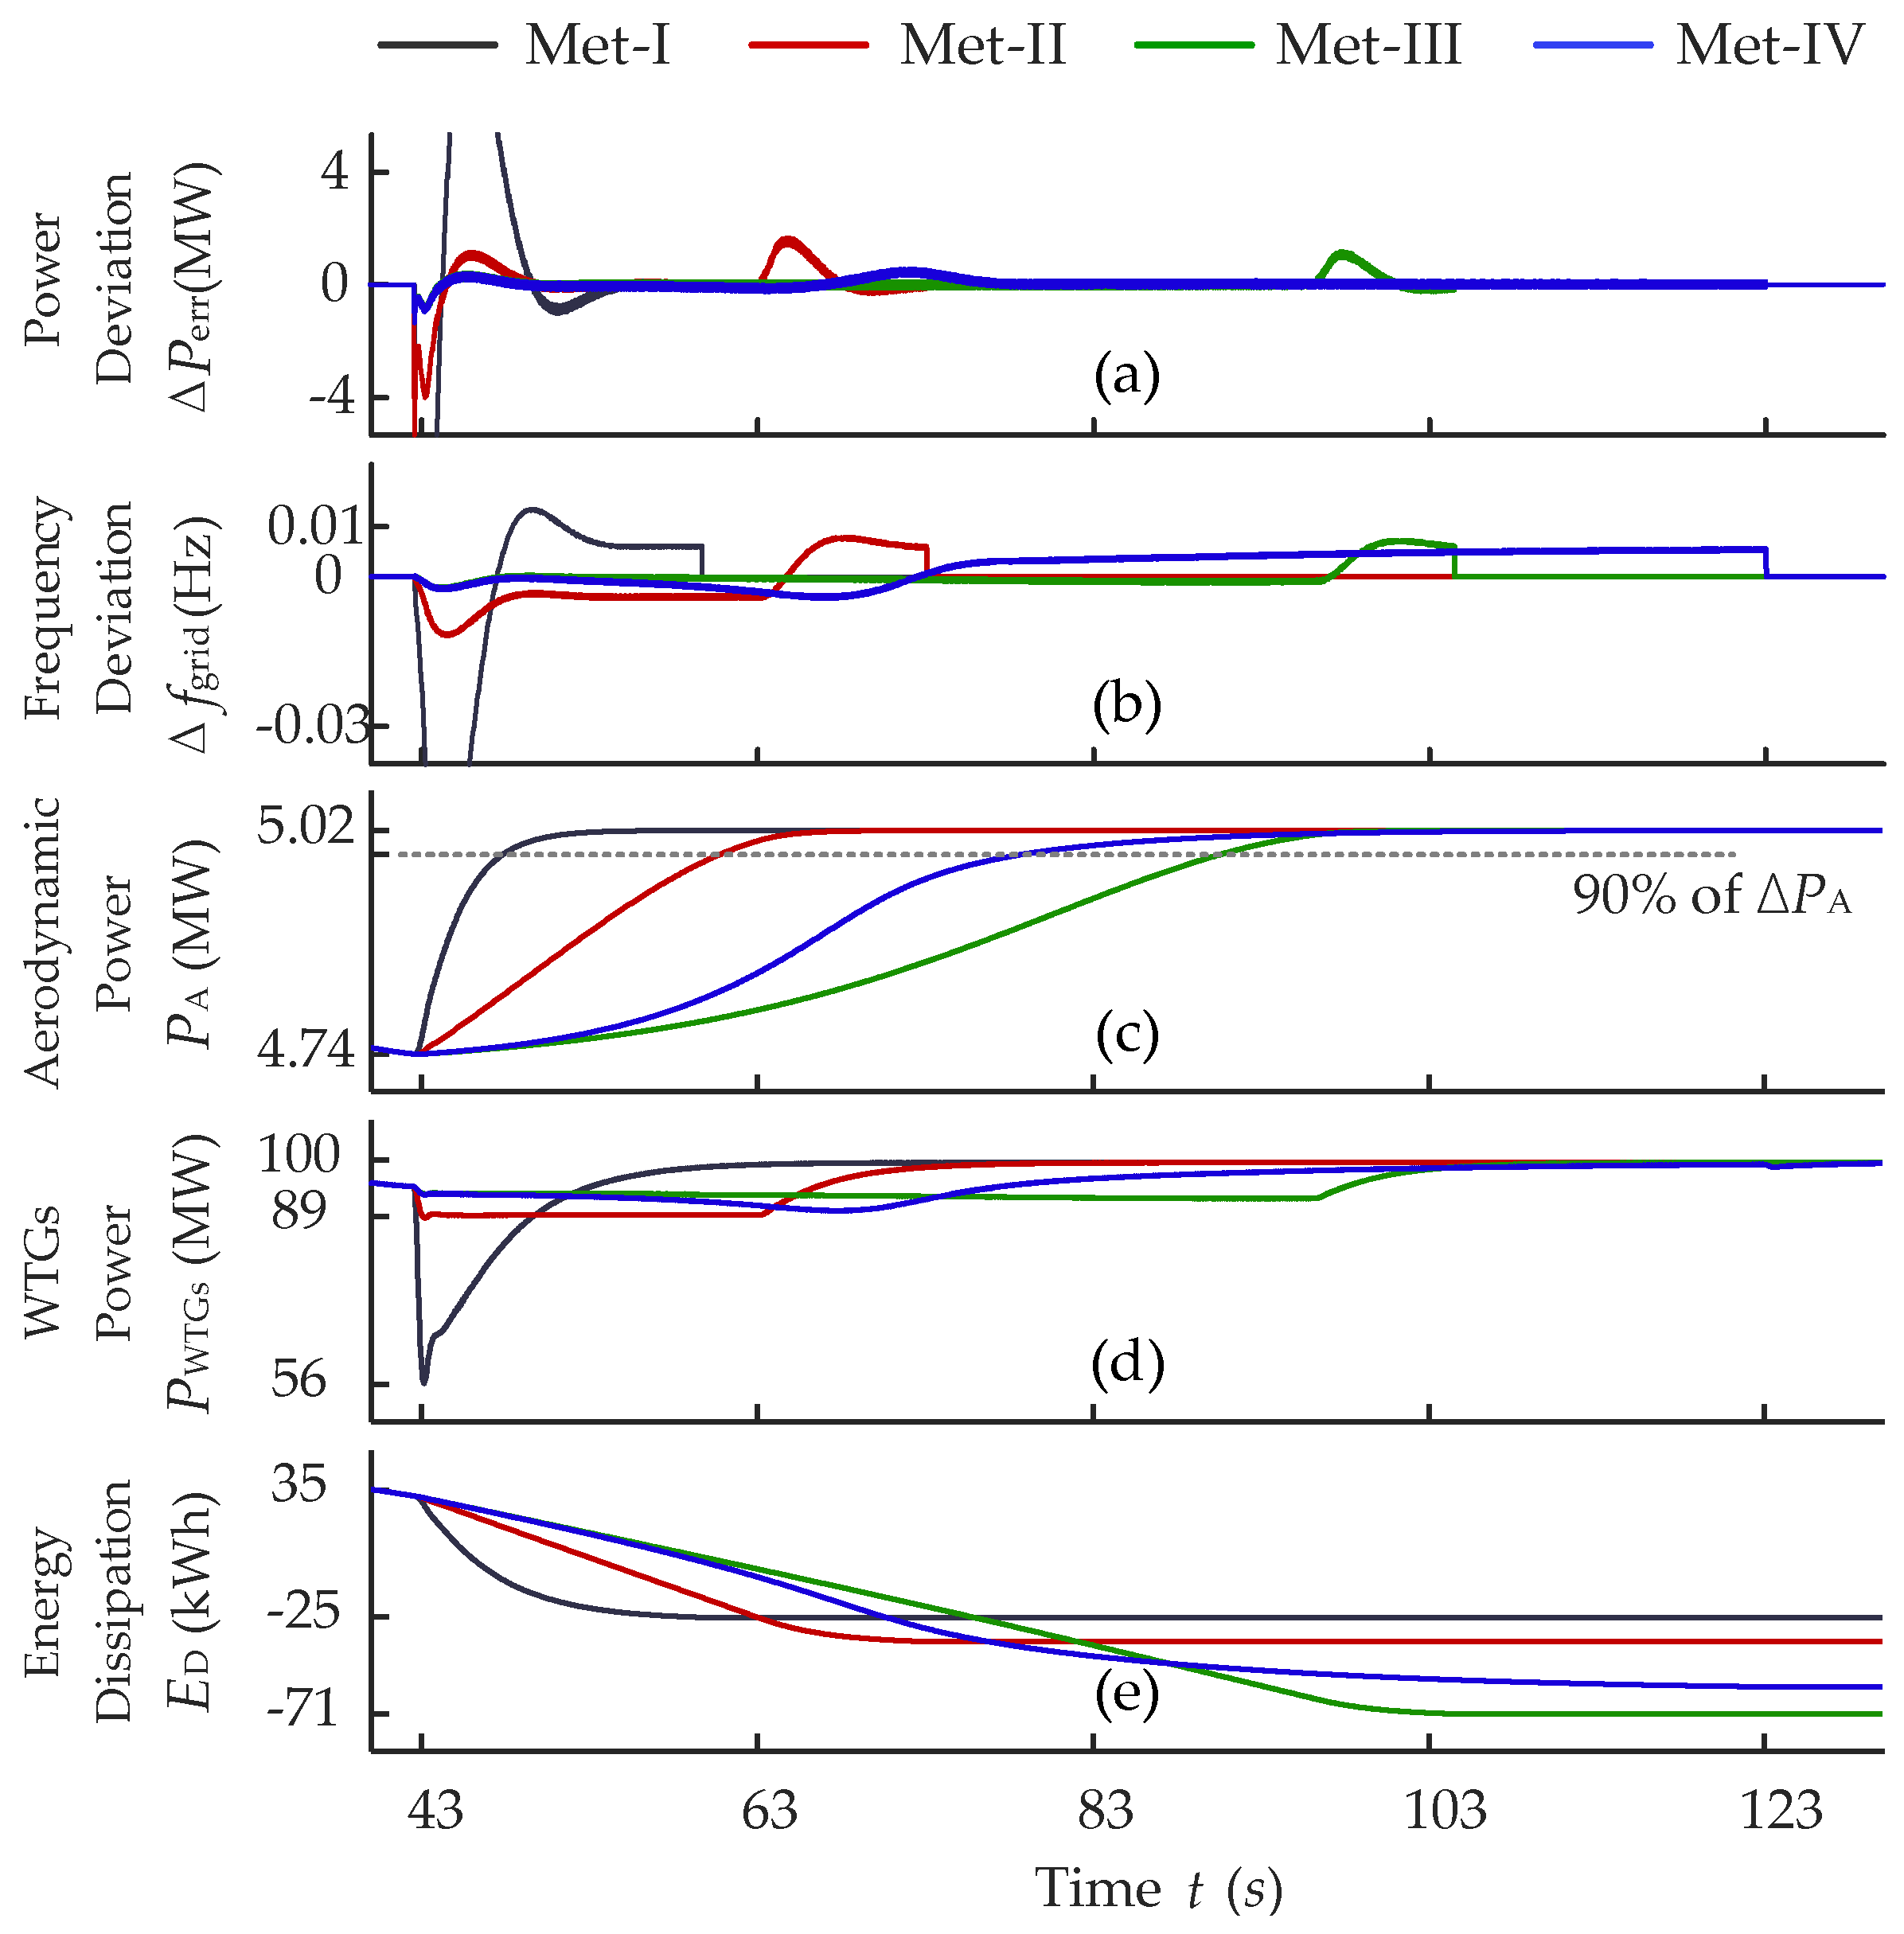
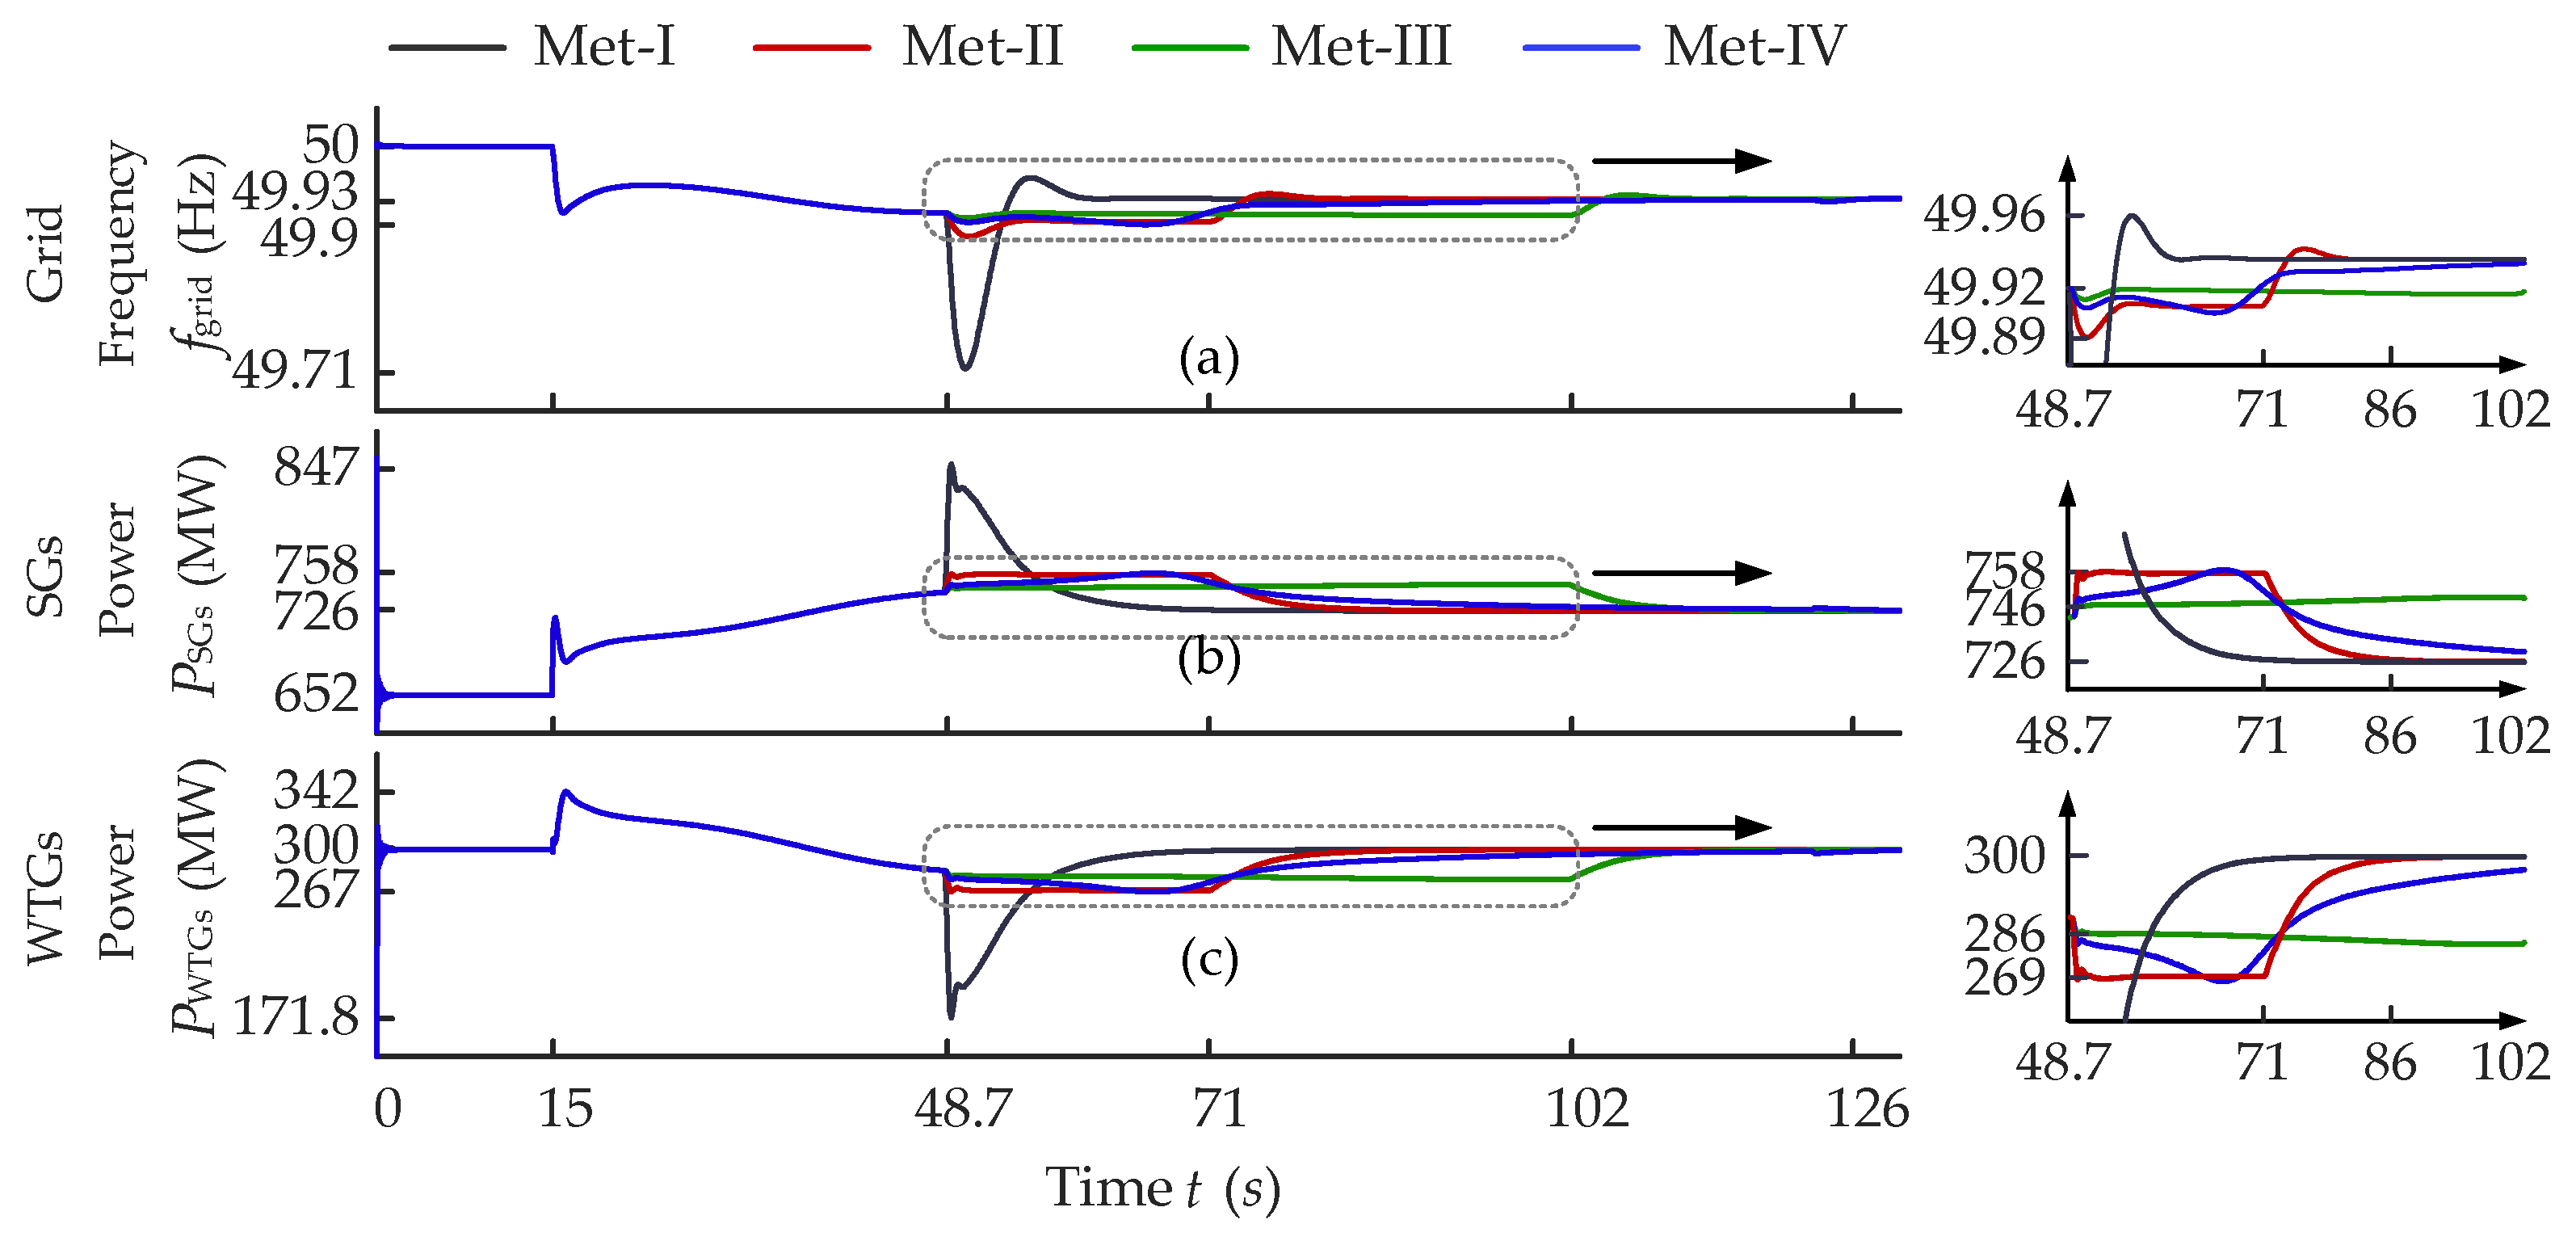
  • The segmented speed recovery control strategy innovatively utilizes aerodynamic power recovery status and WTG power recovery status, dividing the process into three sequential stages: aerodynamic power recovery stage, WTG power recovery stage, and final speed recovery stage. The proposed strategy employs stage-specific power control functions with differentiated objectives to achieve synergistic optimization of grid disturbance suppression and recovery rate acceleration, holistically improving the speed recovery process performance. Simulation results show that the proposed segmented SRS reduces aerodynamic power recovery time by 28.5% and minimizes power disturbance by 47.3% in a scenario with 30% wind power penetration.
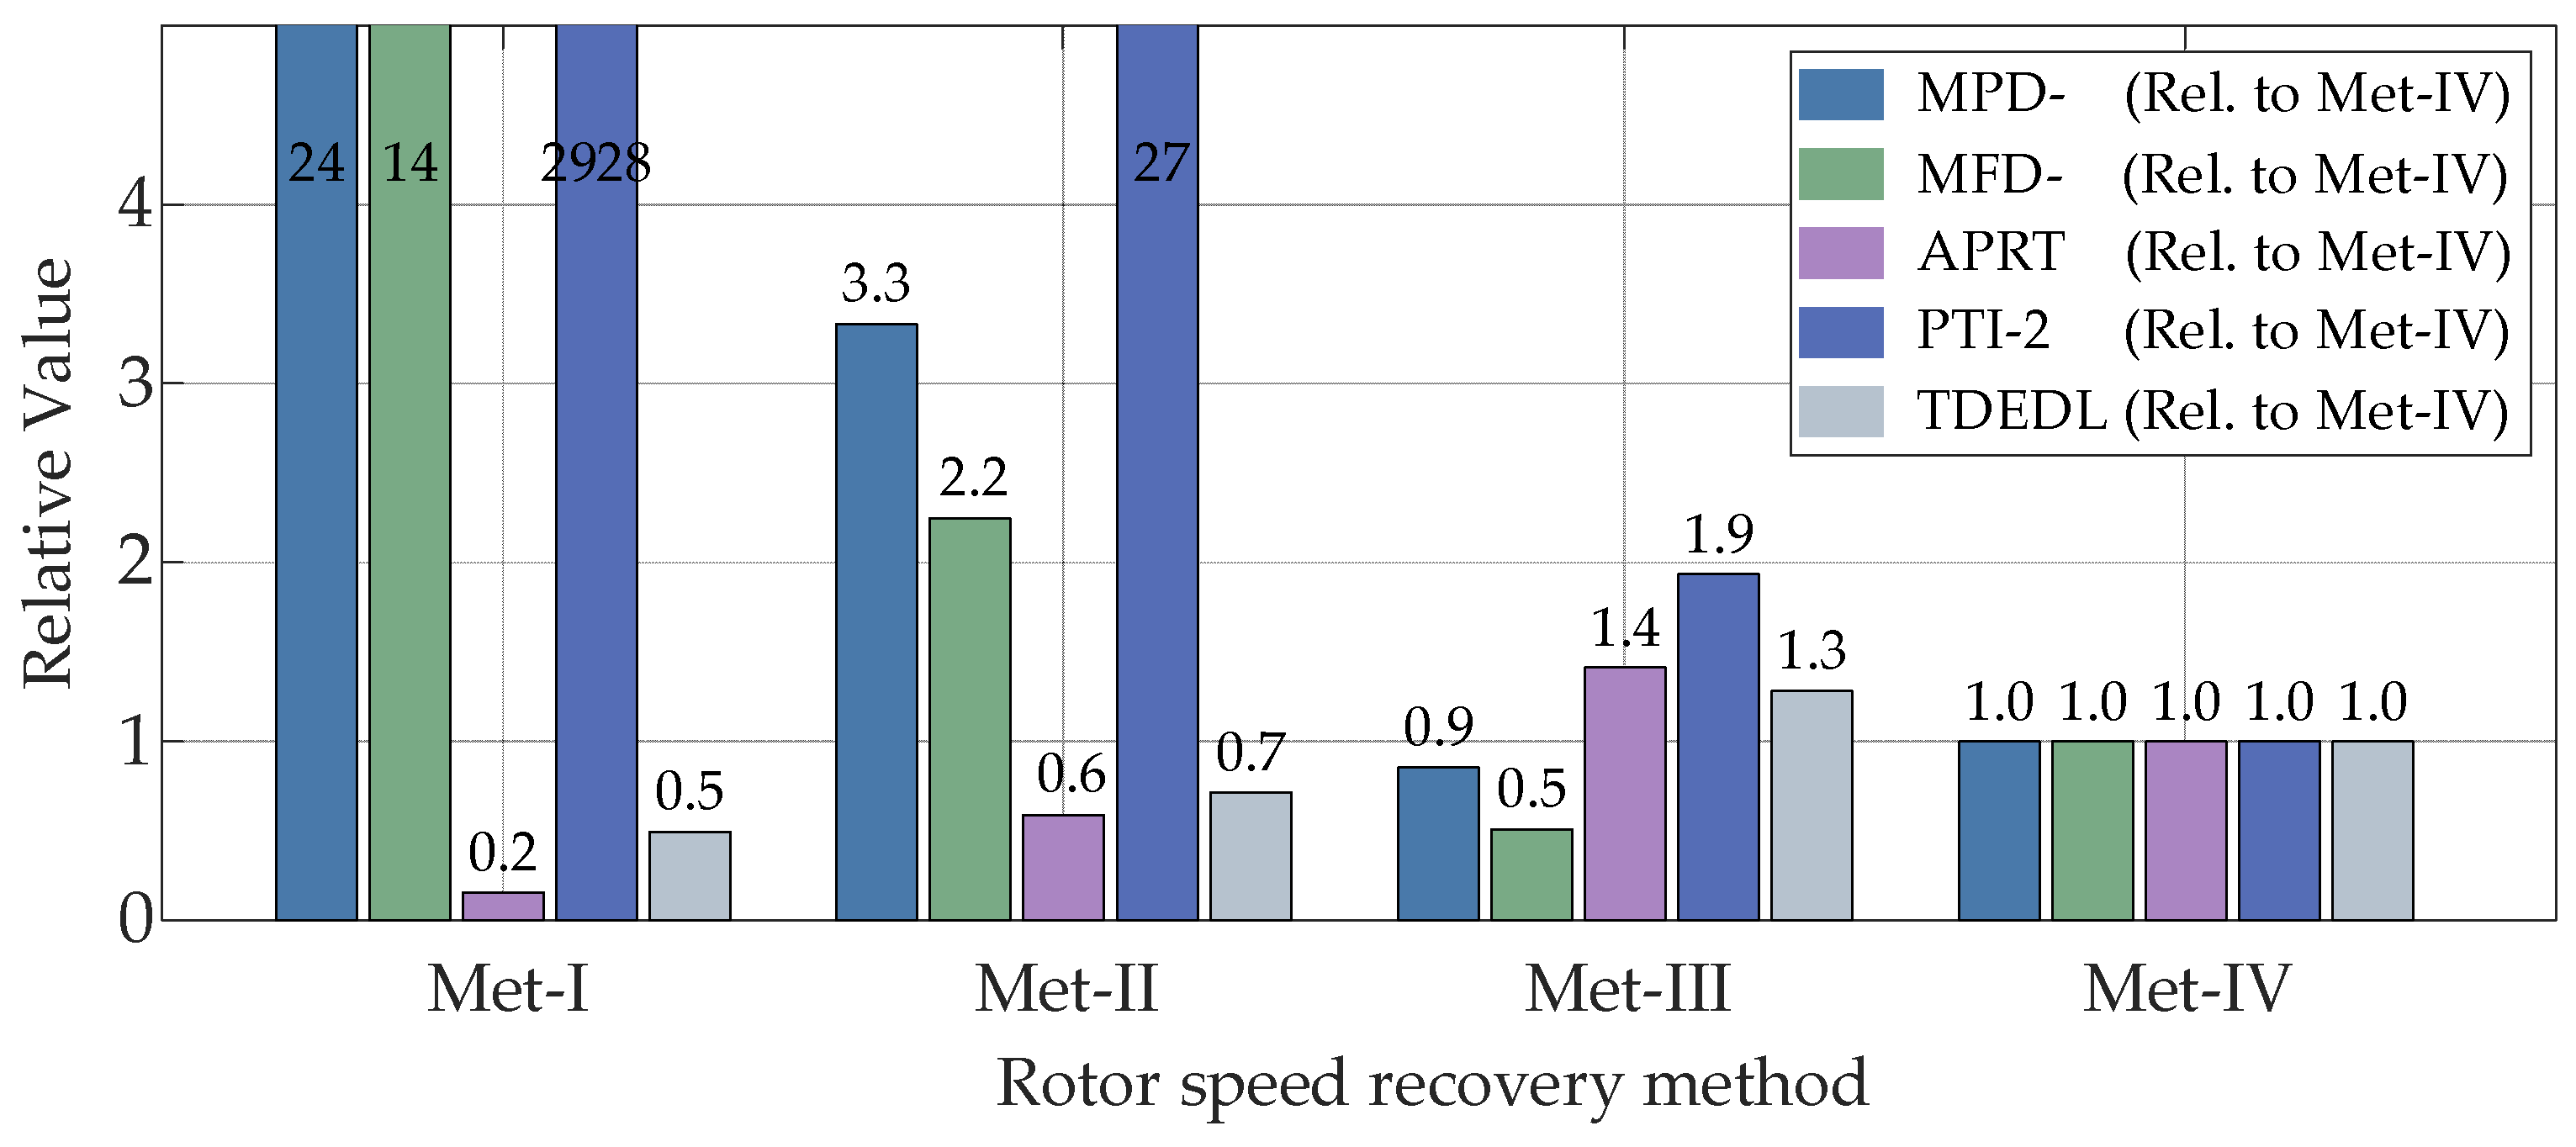
  • The speed recovery evaluation framework employs a five-dimensional system, encompassing maximum power deviation, aerodynamic power recovery duration, and power transient intensity, among other critical parameters, to quantify the recovery process performance. Under 10% and 30% wind power penetration level scenarios, the comparative evaluation of speed recovery strategies based on the proposed framework definitively validates the performance superiority of the segmented control strategy.
  • The design of the segmented rotor speed recovery strategy in this study is based on the assumption that wind speed variations can be neglected over a time scale of seconds. However, in practical scenarios, fluctuations in wind speed during the rotor speed recovery process may affect the performance of the proposed strategy. Improving the adaptability of the strategy to wind speed variations will be an important direction for future research.

Author Contributions

Conceptualization, Z.H.; methodology, Z.Z.; software, L.Y.; validation, Z.Z.; formal analysis, L.Y.; investigation, L.Y.; resources, Y.R.; data curation, L.Y.; writing—original draft preparation, L.Y.; writing—review and editing, Y.R.; visualization, L.Y.; supervision, Z.H.; project administration, Z.H.; funding acquisition, Z.H. All authors have read and agreed to the published version of the manuscript.

Funding

This research was funded by the Science and Technology Project of China Huaneng Corporation Ltd., grant number HNKJ24-H117; Natural Science Foundation of Inner Mongolia, grant number 2024QN05045; First-Class Disciplines Research Excellence Program of Inner Mongolia Autonomous Region, grant number YLXKZX-NGD-006; Doctoral Program of Inner Mongolia University of Technology, grant number BS2024019.

Data Availability Statement

The data presented in this study are available on request from the corresponding author. The data are not publicly available due to privacy.

Conflicts of Interest

The funding sponsors had no role in the design of the study; in the collection, analyses, or interpretation of data; in the writing of the manuscript, and in the decision to publish the results.

Abbreviations

The following abbreviations are used in this manuscript:
SRSSpeed Recovery Strategy
FRFrequency regulation
PFRPrimary frequency regulation
SFRSystem frequency response
SFDSecondary frequency drop
WTGWind turbine generator
SGSynchronous generator
GMLGrid-following
GFMGrid-forming
VSGVirtual synchronous generator
ESSEnergy storage system
MPPTMaximum power point tracking
MPD-Maximum power deviation, negative
MFD-Maximum frequency deviation, negative
APRTAerodynamic power recovery time
PTI-2Power transient intensity, 2nd order
TDEDLTransient dynamic energy dissipation loss

References

  1. Zhuo, Z.; Du, E.; Zhang, N.; Nielsen, C.P.; Lu, X.; Xiao, J.; Wu, J.; Kang, C. Cost Increase in the Electricity Supply to Achieve Carbon Neutrality in China. Nat. Commun. 2022, 13, 3172. [Google Scholar] [CrossRef]
  2. Badesa, L.; Teng, F.; Strbac, G. Conditions for Regional Frequency Stability in Power System Scheduling—Part I: Theory. IEEE Trans. Power Syst. 2021, 36, 5558–5566. [Google Scholar] [CrossRef]
  3. Wang, Z.; Liu, J.; Guo, L.; Li, X.; Liu, Y.; Wang, C. Towards wind farm droop-inertia feasible region assessment: A state space transformation approach considering power system dynamics. Sustain. Energy Technol. Assess. 2024, 71, 103961. [Google Scholar] [CrossRef]
  4. Lin, C.; Wu, Y. Coordinated Frequency Control Strategy for VSC-HVDC-Connected Wind Farm and Battery Energy Storage System. IEEE Trans. Ind. Appl. 2023, 59, 5314–5328. [Google Scholar] [CrossRef]
  5. Hu, Z.; Ren, Y.; Meng, Q.; Yun, P.; Fang, C.; Pan, Y. Improvement of Frequency Support for a DFIG Using a Virtual Synchronous Generator Strategy at Large Power Angles. Energies 2023, 16, 914. [Google Scholar] [CrossRef]
  6. Tafizare, E.; Rahimi, M. Grid-Following and Grid-Forming Control Modes of the Rotor and Grid Sides Converters for Seamless and Universal Operation of the Hybrid DFIG-Wind/Battery Energy Storage System in Grid-Connected and Stand-Alone Conditions. J. Energy Storage 2024, 104, 114623. [Google Scholar] [CrossRef]
  7. Zhu, J.; Hu, J.; Hung, W.; Wang, C.; Zhang, X.; Bu, S.; Li, Q.; Urdal, H.; Booth, C. Synthetic Inertia Control Strategy for Doubly Fed Induction Generator Wind Turbine Generators Using Lithium-Ion Supercapacitors. IEEE Trans. Energy Convers. 2018, 33, 773–783. [Google Scholar] [CrossRef]
  8. Wang, S.; Tomsovic, K. A Novel Active Power Control Framework for Wind Turbine Generators to Improve Frequency Re-sponse. IEEE Trans. Power Syst. 2018, 33, 6579–6589. [Google Scholar] [CrossRef]
  9. Zhao, X.; Lin, Z.; Fu, B.; Gong, S. Research on Frequency Control Method for Micro-Grid with a Hybrid Approach of FFR-OPPT and Pitch Angle of Wind Turbine. Int. J. Electr. Power Energy Syst. 2020, 127, 106670. [Google Scholar] [CrossRef]
  10. Ouyang, J.; Pang, M.; Li, M.; Zheng, D.; Tang, T.; Wang, W. Frequency control method based on the dynamic deloading of DFIGs for power systems with high-proportion wind energy. Int. J. Electr. Power Energy Syst. 2021, 128, 106764. [Google Scholar] [CrossRef]
  11. Ma, R.; Yuan, S.; Li, X.; Guan, S.; Yan, X.; Jia, J. Primary Frequency Regulation Strategy Based on Rotor Kinetic Energy of Double-Fed Induction Generator and Supercapacitor. Energies 2024, 17, 331. [Google Scholar] [CrossRef]
  12. Zhao, H.; Zong, Q.; Zhou, H.; Yao, W.; Sun, K.; Zhou, Y.; Wen, J. Frequency-Voltage Active Support Strategy for Hybrid Wind Farms Based on Grid-Following and Grid-Forming Hierarchical Subgroup Control. CSEE J. Power Energy Syst. 2025, 11, 1–13. [Google Scholar]
  13. Gao, X.; Wang, Z.; Ding, L.; Bao, W.; Wang, Z.; Hao, Q. A novel virtual synchronous generator control scheme of DFIG-based wind turbine generators based on the rotor current-induced electromotive force. Int. J. Electr. Power Energy Syst. 2024, 156, 109688. [Google Scholar] [CrossRef]
  14. Kheshti, M.; Ding, L.; Bao, W.; Yin, M.; Wu, Q.; Terzija, V. Toward Intelligent Inertial Frequency Participation of Wind Farms for the Grid Frequency Control. IEEE Trans. Ind. Inform. 2020, 16, 6772–6786. [Google Scholar] [CrossRef]
  15. Chung, Y.-K.; Wu, Y.-K. Novel Frequency Control Strategy by Wind Turbines Considering Wind Speed Fluctuations and Optimized Power Point Tracking. IEEE Trans. Ind. Appl. 2024, 60, 8191–8202. [Google Scholar] [CrossRef]
  16. Zhang, Z.; Kou, P.; Zhang, Y.; Liang, D. Coordinated Predictive Control of Offshore DC Collection Grid and Wind Turbines for Frequency Response: A Scheme Without Secondary Frequency Drop. IEEE Trans. Sustain. Energy 2023, 14, 1488–1503. [Google Scholar] [CrossRef]
  17. Kheshti, M.; Lin, S.; Zhao, X.; Ding, L.; Yin, M.; Terzija, V. Gaussian Distribution-Based Inertial Control of Wind Turbine Gen-erators for Fast Frequency Response in Low Inertia Systems. IEEE Trans. Sustain. Energy 2022, 13, 1641–1653. [Google Scholar] [CrossRef]
  18. Hu, Z.; Gao, B.; Xu, Z.; Jiang, S. Optimized Temporary Frequency Support for Wind Power Plants Con-sidering Expanded Operational Region of Wind Turbines. CSEE J. Power Energy Syst. 2025, 11, 1–14. [Google Scholar]
  19. Sun, M.; Sun, Y.; Chen, L.; Zou, Z.; Min, Y.; Liu, R.; Xu, F.; Wu, Y. Novel Temporary Frequency Support Control Strategy of Wind Turbine Generator Considering Coordination with Synchronous Generator. IEEE Trans. Sustain. Energy 2022, 13, 1011–1020. [Google Scholar] [CrossRef]
  20. Duan, J.; Zhang, Y.; Li, Z.; Tao, J.; Wang, J. Fast Frequency Response Strategy for Wind-Storage Systems Based on Improved Torque Limit Control under Energy Perspective. J. Energy Storage 2025, 111, 115406. [Google Scholar] [CrossRef]
  21. Zhou, Y.; Zhu, D.; Zou, X.; He, C.; Hu, J.; Kang, Y. Adaptive Temporary Frequency Support for DFIG-Based Wind Turbines. IEEE Trans. Energy Convers. 2023, 38, 1937–1949. [Google Scholar] [CrossRef]
  22. Yang, D.; Jin, Z.; Zheng, T.; Jin, E. An Adaptive Droop Control Strategy with Smooth Rotor Speed Recovery Capability for Type III Wind Turbine Generators. Int. J. Electr. Power Energy Syst. 2022, 135, 107532. [Google Scholar] [CrossRef]
  23. Tao Yukun, Y.F. Flexible Frequency Response Strategy for Wind Turbines Considering Secondary Frequency Drop and Ro-tational Speed Recovery. Autom. Electr. Power Syst. 2023, 48, 60–68. [Google Scholar]
  24. Gao, H.; Xin, H.; Huang, L.; Li, Z.; Huang, W.; Wu, C.; Ju, P. Common-Mode Frequency in Converter-Integrated Power Systems: Definition, Analysis, and Quantitative Evaluation. IEEE Trans. Power Syst. 2022, 37, 4846–4860. [Google Scholar] [CrossRef]
  25. Shi, Q.; Li, F.; Cui, H. Analytical Method to Aggregate Multi-Machine SFR Model with Applications in Power System Dynamic Studies. IEEE Trans. Power Syst. 2018, 33, 6355–6367. [Google Scholar] [CrossRef]
  26. Tang, Y.; Yang, P.; Yang, Y.; Zhao, Z.; Lai, L.L. Fuzzy Adaptive Frequency Support Control Strategy for Wind Turbines With Improved Rotor Speed Recovery. IEEE Trans. Sustain. Energy 2024, 15, 1351–1364. [Google Scholar] [CrossRef]
  27. Yang, D.; Yan, G.-G.; Zheng, T.; Zhang, X.; Hua, L. Fast Frequency Response of a DFIG Based on Variable Power Point Tracking Control. IEEE Trans. Ind. Appl. 2022, 58, 5127–5135. [Google Scholar] [CrossRef]
Figure 1. Active power control architecture for the GFM strategy.
Processes 13 01932 g001
Figure 2. Operational states for kinetic-based wind turbine generator frequency regulation: (a) Dynamic power response of the WTG; (b) Control trajectory of the WTG power output.
Processes 13 01932 g002
Figure 3. SFR under varying wind power penetration levels (10% step-load disturbance).
Processes 13 01932 g003
Figure 4. (a) SFR parameter definitions and (b) SFR dynamic model during the WTG rotor speed recovery phase.
Processes 13 01932 g004
Figure 5. Time-domain responses of (a) system power imbalance (ΔPerr) and (b) relative frequency deviation (Δfgrid2) under varying WTGs derating inertial time constants TWTGPWTGs = 0.03 p.u. load power).
Processes 13 01932 g005
Figure 6. Schematic diagram of the rotor speed recovery process and corresponding evaluation metrics.
Processes 13 01932 g006
Figure 7. Segmented rotor speed recovery principles.
Processes 13 01932 g007
Figure 8. Segmented rotor speed recovery strategy design flow.
Processes 13 01932 g008
Figure 9. WTG coordinated power control strategy.
Processes 13 01932 g009
Figure 10. Power system topology in the operational scenario.
Processes 13 01932 g010
Figure 11. Detailed operational waveforms of an individual wind turbine: (a) Grid frequency; (b) DFIG voltage; (c) DFIG stator current; (d) DFIG rotor current; (e) GSC current; (f) DFIG stator power; (g) GSC power; (h) DFIG unit and aerodynamic power; (i) Rotor speed; (j) VSG power angle; (k) VSG excitation voltage.
Processes 13 01932 g011
Figure 12. System frequency and power responses to a 50 MW load step increase under 10% wind power penetration: (a) Grid frequency; (b) SGs active power; (c) WTGs active power.
Processes 13 01932 g012
Figure 13. Transient responses of intermediate variables during rotor speed recovery (Met-I–IV): (a) Power deviation; (b) Frequency deviation; (c) Aerodynamic power; (d) WTGs active power; (e) Energy dissipation.
Processes 13 01932 g013
Figure 14. Rotor speed recovery performance metrics under 10% wind power penetration (all values normalized to Met-IV baseline).
Processes 13 01932 g014
Figure 15. System frequency and power responses to a 50 MW load step increase under 30% wind power penetration: (a) Grid frequency; (b) SGs active power; (c) WTGs active power.
Processes 13 01932 g015
Figure 16. Rotor speed recovery performance metrics under 30% wind power penetration (all values normalized to Met-IV baseline).
Processes 13 01932 g016
Table 1. Comparison of three types of speed recovery strategies (primary frequency control based on Equation (11)).
Speed Recovery Strategy (SRS)Trajectory in Figure 2bCharacteristic
MPPT-based
SRS [17]
B→D→AFast rotor speed recovery; large power disturbances; high power ramp rate; high SFD induction risk
Power-limited MPPT SRS [18]B→E→F→AModerate rotor speed recovery; moderate power disturbances; high power ramp rate; moderate SFD risk
Smooth power
transition SRS [19]
B→G→ASlow rotor speed recovery; mild power disturbances; low power ramp rate; low SFD risk
Table 2. Key Parameters of the power system.
Parameter and DesignationValue
System-rated frequency fgrid50 Hz
SG G1/G2/G3 rated power400 MW
Load L1/L2/L3 rated power300/300/350 MW
Load disturbance Ld power50 MW
SG G1/G2/G3 speed regulation droop coefficient0.03
Time constant of the governor system5 s
Wind farm-rated power100/300 MW (in 4.2/4.3)
DFIG-rated voltage UWTG950 V (line-to-line)
DFIG-rated power PWTG5 MW
Number of pole pairs np2
Rated rotor speed ωr188 rad/s
DFIG stator-to-rotor turns ratio0.33
Wind turbine inertia time constant HWTG5.2 s
Speed recovery control parameters k1~k2 (p.u.), k3~k4, δ−0.75, 0.67, 0.3, 0.7, 8
Disclaimer/Publisher’s Note: The statements, opinions and data contained in all publications are solely those of the individual author(s) and contributor(s) and not of MDPI and/or the editor(s). MDPI and/or the editor(s) disclaim responsibility for any injury to people or property resulting from any ideas, methods, instructions or products referred to in the content.

