Article

Multifractal Characterization of Full-Scale Pore Structure in Middle-High-Rank Coal Reservoirs: Implications for Permeability Modeling in Western Guizhou–Eastern Yunnan Basin

1
Scientific Research and Development Platform of Technology of Disaster Prevention in Deep Coal Mines, Anhui University of Science and Technology, Huainan 232000, China
2
State Key Laboratory of Safe Mining of Deep Coal and Environmental Protection, Ltd., Huainan 232000, China
3
Shandong Institute of Geophysical and Geochemical Exploration, Jinan 250013, China
4
Key Laboratory of Coalbed Methane Resources & Reservoir Formation Process, Ministry of Education, China University of Mining and Technology, Xuzhou 221116, China
5
Jiangsu Key Laboratory of Coal-based Greenhouse Gas Control and Utilization, China University of Mining & Technology, Xuzhou 221008, China
6
Department of Mechanical, Materials and Manufacturing Engineering, Faculty of Engineering, University of Nottingham, Nottingham NG7 2RD, UK
*
Author to whom correspondence should be addressed.
Processes 2025, 13(6), 1927; https://doi.org/10.3390/pr13061927
Submission received: 3 May 2025 / Revised: 10 June 2025 / Accepted: 15 June 2025 / Published: 18 June 2025

Abstract

This study presents a comprehensive multifractal characterization of full-scale pore structures in middle- to high-rank coal reservoirs from the Western Guizhou–Eastern Yunnan Basin and establishes a permeability prediction model integrating fractal heterogeneity and pore throat parameters. Eight coal samples were analyzed using mercury intrusion porosimetry (MIP), low-pressure gas adsorption (N2/CO2), and multifractal theory to quantify multiscale pore heterogeneity and its implications for fluid transport. Results reveal weak correlations (R2 < 0.39) between conventional petrophysical parameters (ash yield, volatile matter, porosity) and permeability, underscoring the inadequacy of bulk properties in predicting flow behavior. Full-scale pore characterization identified distinct pore architecture regimes: Laochang block coals exhibit microporous dominance (0.45–0.55 nm) with CO2 adsorption capacities 78% higher than Tucheng samples, while Tucheng coals display enhanced seepage pore development (100–5000 nm), yielding 2.5× greater stage pore volumes. Multifractal analysis demonstrated significant heterogeneity (Δα = 0.98–1.82), with Laochang samples showing superior pore uniformity (D1 = 0.86 vs. 0.82) but inferior connectivity (D2 = 0.69 vs. 0.71). A novel permeability model was developed through multivariate regression, integrating the heterogeneity index (Δα) and effective pore throat diameter (D10), achieving exceptional predictive accuracy. The strong negative correlation between Δα and permeability (R = −0.93) highlights how pore complexity governs flow resistance, while D10’s positive influence (R = 0.72) emphasizes throat size control on fluid migration. This work provides a paradigm shift in coal reservoir evaluation, demonstrating that multiscale fractal heterogeneity, rather than conventional bulk properties, dictates permeability in anisotropic coal systems. The model offers critical insights for optimizing hydraulic fracturing and enhanced coalbed methane recovery in structurally heterogeneous basins.

1. Introduction

Although the efficient development of unconventional oil and gas resources can solve the energy shortage situation, it faces various challenges such as low permeability [1,2,3]. Accurate permeability prediction in coalbed methane (CBM) reservoirs remains a pivotal challenge due to the inherent structural complexity of coal pore systems, particularly in middle- to high-rank coals undergoing thermal maturation [4,5,6,7]. Traditional permeability models relying on conventional petrophysical parameters—such as porosity, ash yield, and vitrinite reflectance—often fail to account for the multiscale heterogeneity of pore throat networks, leading to significant discrepancies in fluid flow predictions [8,9]. The Western Guizhou–Eastern Yunnan Basin, a key CBM exploration target in South China, exemplifies this challenge, where middle- to high-rank coals exhibit pronounced permeability anisotropies unresolved by existing empirical correlations [10,11,12].
Previous studies in this basin have emphasized maceral composition and gas adsorption capacity but largely overlooked the hierarchical connectivity of adsorption, seepage, and fracture systems [13]. While mercury intrusion porosimetry (MIP) and low-pressure gas adsorption (LPGA) techniques are routinely employed for pore characterization, their isolated application across discrete pore size ranges—microscale (<2 nm) via CO2 adsorption, mesoscale (2–50 nm) via N2 adsorption, and macroscale (>50 nm) via MIP—limits holistic understanding of fluid transport mechanisms [14,15]. This methodological fragmentation obscures critical interactions between pore geometry, connectivity, and fractal heterogeneity, which collectively govern permeability in thermally altered coal systems [16,17,18].
Multifractal (and fractal) theory has become a powerful tool for quantifying pore-space heterogeneity in coal. For example, Li et al. applied fractal characterization to high-rank coal reservoirs [19], and Zhang et al. performed multifractal analysis on combined N2 and CO2 adsorption data from middle- and high-rank coal samples [20]. Zhang et al. showed that micropores (<2 nm diameter) in coal exhibit clear multifractal scaling, and that the overall heterogeneity of these micropores is higher in high-rank coals than in middle-rank coals. Such studies reveal that coal pore systems are intrinsically self-similar and heterogeneous, and that multifractal parameters (e.g., spectrum width, dimension ratios) can capture key aspects of this complexity. Other researchers have extended multifractal analysis to NMR and fluid flow measurements. Sun et al. combined the multifractal analysis of low-field NMR T2 spectra with a neural network model to predict coal pore structure parameters, effectively linking fractal descriptors to NMR pore size signatures [21]. Zhang et al. applied similar methods to coal-bearing sedimentary rocks (shale, mudstone, sandstone) from the Tiefa Basin, using NMR and SEM imaging to investigate how lithology and mineralogy affect multifractal pore attributes [22]. These studies collectively highlight that multifractal parameters can be related to petrophysical properties and flow capacity in coal systems.
Fractal theory has emerged as a robust framework for quantifying pore structure complexity, yet its application to middle-high-rank coals faces two unresolved limitations [23,24]. First, monofractal models dominate the existing literature, inadequately capturing the multifractal coexistence of adsorption-dominated micropores and seepage-active meso-macropores [25]. Second, current fractal–permeability relationships derive primarily from low-rank coals or synthetic analogs, neglecting the structural reorganization induced by high thermal maturity in natural reservoirs [26]. Recent advancements in shale gas research highlight the predictive power of multifractal metrics for permeability modeling [8], while parallel studies on Chinese coals reveal rank-dependent pore transformations—yet a unified framework bridging full-scale fractal heterogeneity to permeability in middle-high-rank coals remains absent [27,28,29].
While these prior works have advanced our understanding of coal pore fractality, they generally rely on a single measurement technique or a limited pore size range. In contrast, the present study integrates full-scale pore characterization with multifractal modeling. We combine MIP to capture macropores, LP-N2GA for mesopores, and lLP-CO2GA for micropores, thereby covering the entire pore spectrum in each sample. Multifractal analysis is then applied to the combined pore size distribution, yielding a continuous spectrum of fractal dimensions. Crucially, we correlate these multifractal descriptors with laboratory-measured permeability, fitting a regression model that achieves R2 = 0.91. The high R2 and empirical fit demonstrate the strength of this approach. This methodological integration—bridging multiscale pore data, multifractal theory, and permeability modeling—is novel and provides a more robust framework for CBM forecasting.
Importantly, our coal samples come from the Western Guizhou–Eastern Yunnan Basin (Late Permian Formation), a region of exceptional geological complexity. This area lies on the western margin of the South China Plate and experienced extensive tectonic deformation; depositional facies vary from marine to terrestrial across the basin. The target coal seam is interbedded with fine-grained clastics and volcanic layers, yielding a highly heterogeneous coal matrix. The multifractal pore characteristics of coals in this basin have not been previously studied, and regional permeability models have not been established. The present work thus provides the first multifractal–permeability framework for these Western Guizhou–Eastern Yunnan coals.
In summary, this study employs an integrated experimental and analytical approach combining MIP, LPGA (N2/CO2), and multifractal theory to characterize the pore systems of eight coal samples spanning a maturity gradient (Ro,max = 1.40–3.36%) from the Western Guizhou–Eastern Yunnan Basin. Three hypotheses guide the investigation: (1) permeability in middle-high-rank coals is controlled not by bulk porosity but by the multifractal spectrum of pore throat distributions; (2) high-rank coals exhibit permeability suppression due to micropore proliferation and amplified structural heterogeneity, counteracting their enhanced adsorption capacity; (3) a predictive permeability model can be established by coupling the effective throat size (D10) and multifractal heterogeneity index (Δα), transcending conventional petrophysical predictors. This study is the first to characterize the full-scale pore structure of middle-high-rank coal in this basin using multifractal analysis. These advancements redefine permeability prediction paradigms for anisotropic coal reservoirs, providing critical insights for optimizing hydraulic fracturing and enhancing CBM recovery in structurally complex basins.

2. Materials and Methods

2.1. Sample Collection and Preparation

Representative coal samples were collected from the Laochang block in Yunnan Province (samples L1–L4) and the Tucheng block in Guizhou Province (samples T1–T4). Samples L1, L2, L3, and L4 were collected from the coalmine faces of the Dagang, Sijiaodi, Muler, and Danshuo mines, respectively, in the Laochang block. Samples T1, T2, T3, and T4 were taken from the coalmine faces of the Songhe Coal Mine, Songhe West Coal Mine, Shangzhichang Coal Mine, and Yanbo Coal Mine, respectively, in the Tucheng block of Guizhou Province.
These two blocks belong to the same tectonic unit and are characterized by coal seams with a continuous distribution of different coal ranks.
For permeability testing, the samples were processed into cylindrical cores with dimensions of 2.5 cm in diameter and 5 cm in length. Residual fragments generated during sample preparation were used for other types of analyses (Figure 1).
Vitrinite reflectance (Ro) and maceral composition were determined on polished sections using a Leitz MPV3 photometric microscope equipped with an MPS 60 photographic system manufactured by Leitz, Stuttgart city, Germany. Additionally, proximate analyses were performed to determine the moisture, ash, and volatile matter contents of the samples. Elemental analyses were conducted to quantify the carbon, hydrogen, oxygen, and nitrogen contents. Coal petrology was used to identify and quantify the proportions of vitrinite, liptinite, and inertinite macerals.
Gas permeability was measured using a pulse decay permeameter (PDP-200, Core Temco Products Co., Ltd., Houston, TX, USA) based on the transient gas pulse attenuation method [30], with pure nitrogen as the testing gas. The pressure difference across the two ends of the sample was maintained at 1.38 × 10⁻³ MPa during testing.

2.2. Full-Scale Pore Structure Characterization

The complex pore structures of coal reservoirs necessitate the use of multiple complementary techniques to fully characterize pore size distributions across a broad range of scales. To achieve this, three distinct methods—MIP, LP-N2GA, and LP-CO2GA—were applied to adjacent sub-samples derived from the same core tailings. Each technique targets a specific pore size window, minimizing method-specific bias and avoiding repeated use of the same physical specimen. Each full-scale core was first drilled to obtain a 2.5 cm × 5 cm cylinder. The remaining core tailings were then thoroughly mixed, crushed, and sieved into three representative batches (A, B, C) with identical maceral composition and proximate properties. Batch A served for MIP, B for LP-N2GA, and C for LP-CO2GA. Pre-test analyses confirmed ≤5% variation among batches in ash yield.
Mercury intrusion porosimetry (MIP) was employed to characterize the pores and fractures of the coal samples. This method involves the gradual injection of liquid mercury into evacuated pore spaces under increasing external pressure. Smaller pores are intruded at higher pressures, establishing a direct relationship between applied pressure and pore throat diameter. The cumulative volume of intruded mercury corresponds to the total pore and fracture volume. The relationship between capillary pressure (Pc) and pore radius (Rc) can be described by the Washburn equation [31]:
R c = 2 σ cos θ P c
where Pc is the capillary pressure (MPa), Rc is the pore radius (mm), σ is the surface tension between the two phases (J/m2), and θ is the contact angle (°). In the MIP experiments, σ and θ were taken as 0.48 J/m2 and 140°, respectively.
MIP measurements were conducted at the Jiangsu Geological and Mineral Resources Institute. Dried tailings from batch A (diameter 10 mm, length 10 mm) were subjected to mercury intrusion using a fully automated porosimetry system over a pressure range of 0–40,000 psi, corresponding to a pore diameter range of approximately 3.5 nm to 0.2 mm according to Equation (1).
Batch B was ground to 250–350 µm and degassed at 150 °C for 12 h. Nitrogen adsorption isotherms at 77 K were obtained over p/p0 = 0.001~0.995. The BET model provided total surface area, and the BJH/DFT methods yielded mesopore (2–50 nm) and upper micropore (2–5 nm) distributions [32,33]. LP-N2GA preserves delicate pore walls by avoiding the high pressures used in MIP.
Batch C (150–200 µm) was degassed identically, and then measured at 273 K with CO2 over p/p0 = 3 × 10⁻⁵~0.0289. DFT analysis resolved ultramicropores (<2 nm) that cannot be accessed by N2 adsorption due to diffusion limitations [34,35].
Finally, the three datasets were seamlessly stitched: CO2 data for 0.3–1.5 nm, N2 data for 1.5–50 nm, and MIP data for 50–200,000 nm. In the narrow overlap regions (1.5–2 nm and 50–100 nm), we applied minimal smoothing after directly comparing adjacent curves. This eliminates edge artifacts, reduces high-pressure and diffusion biases and validates continuity, yielding a single, high-fidelity pore size distribution that no single method can provide.

2.3. Multifractal Parameter Calculations

As this study focuses on the spatial distribution characteristics of pore structures influencing reservoir permeability, both single-fractal features (based on MIP data) and multifractal features (based on integrated pore characterization) were evaluated.

2.3.1. Single-Fractal Analysis Based on MIP

Fractal geometry, first proposed by Mandelbrot [36], provides a powerful tool for describing complex systems lacking characteristic scales. Coal pores exhibit fractal characteristics, and mercury intrusion data have been widely used to identify boundaries between different pore types [37,38]. Based on the Washburn equation and the fractal sponge model, the surface fractal dimension (Dm) was calculated as follows:
log d V p / d p D m 4 log p
where Vp is the cumulative intruded volume at pressure Pc, and Dm is the surface fractal dimension derived from the slope of the log–log plot. A higher Dm indicates greater heterogeneity of the pore structure.

2.3.2. Multifractal Analysis

Compared to single-fractal analysis, multifractal analysis provides a hierarchical view of reservoir structures by evaluating the scaling behaviors of different regions [25]. The method for determining the multifractal singularity spectrum (αf(α)) and the generalized dimension spectrum (qD(q)) is described below.
First, the total pore size range L was divided into subintervals Li of equal length ε. The pore volume probability density function Pi(ε) for each interval was defined as
P i ( ε ) = N i ( ε ) N t = N i ( ε ) i = 1 N ( ε ) N i ( ε ) ε α i
where Ni is the pore volume within the i-th interval, and Nt is the total pore volume. The number of intervals (ε) with the same probability follows the scaling relation
N α ε ε f ( α )
where f(α) is the multifractal spectrum. For a multifractal object, f(α) exhibits a convex curve, whereas for a monofractal object, α is constant [39]. The singularity strength α(q) and spectrum f(α) were calculated as
α ( q ) i = 1 N ( ε ) μ i ( q , ε ) lg [ P i ( ε ) ] lg ( ε )
f [ α ( q ) ] i = 1 N ( ε ) μ i ( q , ε ) lg [ μ i ( q , ε ) ] lg ( ε )
where μi(q,ε) is the following normalized probability measure:
μ i ( q , ε ) = P i q ( ε ) i = 1 N ( ε ) P i q ( ε )
The partition function χ(q,ε) and the generalized dimension Dq were computed by
χ q , ε = i N i P i q ( ε ) ε ( q 1 ) D q
D q = 1 q 1 lim ε 0 lg i = 1 N ( ε ) P i q ( ε ) lg ε = τ ( q ) q 1
τ ( q ) = ( q 1 ) D q = lim ε 0 lg i = 1 N ( ε ) P i q ( ε ) lg ε
where τ(q) is the mass exponent. When q < 0, Dq characterizes regions of higher pore density; when q > 0, it characterizes regions of lower pore density. Specifically, D0, D1, and D2 represent the capacity, information, and correlation dimensions, respectively.
The width of the singularity spectrum, Δα, was used to quantify pore structure heterogeneity:
Δ α = α max α min
where αmax and αmin are the maximum and minimum singularity strengths, respectively [20].

3. Results and Discussion

3.1. Conventional Petrophysical Properties and Permeability of Reservoirs

To elucidate the fundamental characteristics of coal reservoirs in the Western Guizhou–Eastern Yunnan Basin, we conducted a comprehensive analysis of eight coal samples chosen to span different structural locations (Laochang vs. Tucheng blocks) and a range of thermal maturities (Ro,max = 1.40–3.36%). Table 1 summarizes the results of proximate analysis, elemental composition, maceral group identification, porosity, and permeability measurements.
The coal samples exhibit significant variations in basic petrophysical properties. Moisture content (Mad) ranges from 1.00% to 1.93%, while ash yield (Ad) varies from 5.3% to 18.23%. Volatile matter on a dry ash-free basis (Vdaf) spans 8.02% to 34.47%, reflecting the diversity of coalification stages. The vitrinite reflectance (Ro,max), an indicator of coal maturity, varies from 1.40% to 3.36%, samples L1–L4 originate from the Laochang block (Dagang, Sijiaodi, Muler, Danshuo mines), characterized by higher tectonic strain and vitrinite reflectance (Ro,max = 2.95–3.36%), while T1–T4 derive from the Tucheng block (Songhe, Songhe West, Shangzhichang, Yanbo mines) with lower strain and Ro,max = 1.40–1.71%, confirming the middle- to high-rank status of the studied coals.
Permeability values show a relatively narrow range (0.42–0.81 mD) with limited correlation to the measured petrophysical parameters. Figure 2 illustrates these relationships by plotting permeability against key conventional parameters (ash yield, volatile matter, vitrinite reflectance, and porosity), revealing weak correlations across all pairs.
A weak negative correlation is observed between ash yield and permeability (Figure 2a), with a linear regression equation of y = 0.84 − 0.02x (R2 = 0.39). Although higher mineral matter content tends to reduce flow capacity, the scatter suggests that ash yield is not the sole determinant of permeability.
The correlation between Vdaf and permeability is minimal (y = 0.67 − 0.004x, R2 = 0.07), indicating that the influence of volatile matter on flow pathways is limited in these coal samples (Figure 2b).
A negligible correlation is observed (y = 0.56 + 0.016x, R2 = 0.01), suggesting that increased maturity (i.e., higher Ro,max) may have a positive but weak impact on permeability, potentially due to the thermal degradation and compaction of pore structures by inertinite and colloidal filling in micropores.
The linear relationship between porosity and permeability is also weak (y = 0.54 + 0.02x, R2 = 0.01). Notably, the sample with the highest porosity (L3: 4.01%) does not correspond to the highest permeability (0.72 mD), and conversely, the sample with the lowest porosity (T3: 1.33%) exhibits one of the highest permeability values (0.76 mD). This counterintuitive behavior underscores the inadequacy of total pore volume as a predictor of permeability in such various coal systems.
Collectively, these findings indicate that conventional petrophysical parameters alone cannot satisfactorily explain the variability in permeability across coal samples. The weak correlations suggest that permeability is not solely controlled by bulk porosity or compositional factors but may instead be governed by the internal pore structure and connectivity characteristics at multiple scales.
Therefore, a more detailed analysis of the full-scale pore structure is warranted. In the following sections, we adopt advanced characterization techniques and multifractal theory to explore the influence of complex pore architecture on fluid flow behavior, aiming to establish a more reliable permeability prediction model for coal reservoirs in this basin.

3.2. Characteristics of Pore Distribution

The pore structures of coal reservoir samples were characterized using mercury intrusion porosimetry (MIP), low-pressure nitrogen gas adsorption (LP-N2GA), and low-pressure carbon dioxide gas adsorption (LP-CO2GA). These complementary techniques provide a multiscale view of pore size distribution ranging from micropores to macropores.
The MIP results reveal distinct hysteresis loops that provide insights into the pore morphology and connectivity. Figure 3 presents mercury injection curves for representative samples from both blocks, providing insights into pore morphology. In Figure 3a, T2 and T3 samples from the Tucheng block exhibit pronounced wide hysteresis loops, indicating a dominance of open pores. In contrast, T1 and T4 samples show smaller differences between mercury intrusion and extrusion, implying the prevalence of semi-closed pores. Notably, T4 demonstrates a slightly larger hysteresis loop in the high-pressure range (10–100 MPa), suggesting the presence of ink-bottle-type pores with narrow necks and wide bodies. In the Laochang block (Figure 3b), most samples display parallel hysteresis loops, which suggests fewer ink-bottle pores and a predominance of open, well-connected pore networks.
Figure 4 depicts pore size distributions from mercury injection experiments, highlighting differences between Laochang (abundant 3–10 nm mesopores) and Tucheng samples (dominant 100–5000 nm pores). The pore size distribution derived from MIP (Figure 4) focuses on pores smaller than 50,000 nm, as the initial stage data can be distorted due to surface roughness and microcracks introduced during sample preparation. The results show that Laochang samples have significantly higher cumulative pore volumes in the 3–10 nm range, indicating abundant small mesopores. In contrast, the Tucheng samples are more developed in the 100–5000 nm range, indicating larger meso- to macropores and microfractures. With increasing coal rank, a transition from a tri-modal (Figure 4a) to a bi-modal distribution (Figure 4b) is observed, reflecting the gradual reduction in meso- and macropores. In addition, the overall pore connectivity tends to decline with increasing coalification.
The nitrogen adsorption/desorption isotherms (Figure 5 and Figure 6) provide further evidence of pore type and connectivity. Both Tucheng and Laochang samples exhibit pronounced hysteresis loops in the relative pressure range of 0.45 to 0.995, consistent with open pore networks. According to the IUPAC classification, these loops are categorized as H3-type, which are typically associated with slit-shaped pores formed by plate-like or rod-like particles. At lower relative pressures (p/p0 < 0.4), the loops narrow and close, indicating the presence of semi-open pores such as end-capped cylindrical, wedge-shaped, or funnel-shaped pores.
Figure 7 displays BJH pore volume distributions from nitrogen adsorption experiments, identifying three distinct peaks at ~4 nm, 30 nm, and 150 nm that reflect multiscale pore systems formed by vitrinite devolatilization, mineral interfaces, and tectonic microfractures: The ~4 nm peak falls within the upper micropore to lower mesopore range and is primarily attributed to vitrinite devolatilization during coalification. As gaseous components are expelled from organic matter, small, elongated pores form along the cleaved layers of vitrinite. The ~30 nm peak reflects mesopores associated with inertinite-rich domains, inter-mineral boundaries, and organo–mineral interfaces. These pores may also form through shrinkage during coal diagenesis or by the disconnection of smaller pore clusters. The ~150 nm peak is indicative of incipient macroporosity, often interpreted as tectonic microfractures or mechanically enlarged pores that developed under structural compression and shearing. These larger pores are especially prevalent in Laochang samples, which experienced stronger tectonic overprint. Together, the presence of these peaks reveals a hierarchically organized and evolution-controlled pore system, underscoring the need for multifractal analysis to assess structural complexity across scales. The total pore volume measured by LP-N2GA for Tucheng samples ranges from 0.00183 to 0.00507 cm3·g−1 (average 0.00279 cm3·g−1), while Laochang samples range from 0.00147 to 0.00582 cm3·g−1 (average 0.00286 cm3·g−1), suggesting comparable mesopore development in both blocks.
The LP-CO2GA technique was used to characterize micropores (<1.5 nm), with the adsorption isotherms presented in Figure 8. The Tucheng samples show a narrow adsorption capacity range from 11.56 to 12.40 cm3·g−1, with an average of 11.95 cm3·g−1. In contrast, the Laochang samples exhibit a wider and higher adsorption range (17.90 to 24.11 cm3·g−1; average: 21.30 cm3·g−1), indicating enhanced microporosity and adsorption capability with increasing coal rank.
The DFT-derived pore size distribution curves from LP-CO2GA (Figure 9) exhibit bimodal patterns for both blocks. The dominant peak lies between 0.45 and 0.55 nm, which represents the most favorable pore size range for methane adsorption. A secondary peak appears between 0.80 and 0.85 nm. Notably, the Laochang samples demonstrate higher peak intensities, indicating more well-developed micropores than the Tucheng samples. This finding is consistent with the CO2 adsorption results in Figure 8 and further supports the conclusion that higher-rank coals possess more developed micropore structures conducive to gas adsorption.

3.3. Full-Scale Pore Size Distribution and Fractal Spectrum Characteristics

Using any of the three aforementioned methods independently to characterize pore structures has inherent limitations. By combining datasets from different techniques, the resulting full-scale pore-size distribution can effectively mitigate individual shortcomings and enhance the accuracy of pore characterization results. Accordingly, the optimal pore size ranges from each technique were selected and stitched together: the LP-CO2GA data from 0.3 to 1.5 nm, the LP-N2GA data from 3.5 to 25 nm, and the MIP data from 25 to 50,000 nm. Figure 10 and Figure 11 present stitched full-scale pore size distributions for Tucheng and Laochang blocks, revealing multimodal patterns dominated by 0.45–0.55 nm micropores (LP-CO2GA) and significant meso-macropore development in Tucheng (MIP).
The combined pore size distributions exhibit a clear multimodal pattern in both blocks. The primary peak is observed within the 0.45–0.55 nm range, accompanied by a secondary peak around 0.80–0.85 nm, both identified from LP-CO2GA data. Beyond this range, the increase in cumulative pore volume is relatively modest. In particular, the Tucheng block displays more developed pores in the 100–5000 nm range (Figure 10), with a stage pore volume of 0.003–0.005 cm3/g and an average of 0.00385 cm3/g, which is 2.5 times greater than the average in the Laochang block (Figure 11). For both blocks, the apparent rise in pore volume beyond 10,000 nm is likely attributed to in situ fractures or artificial cracks introduced during sample preparation, and thus carries limited geological significance.
The sponge fractal model based on MIP data is useful in distinguishing between adsorption pores and seepage pores. Figure 12 shows the double-logarithmic relationship between volume increment and injection pressure (MIP data) used to derive fractal dimensions for adsorption/seepage pore systems. The slope transition at lgP = 1.3 (73.7 nm) demarcates these domains.
The results show that the lg(dv/dp) − lgP relationship features two distinct stages, with lgP = 1.3 serving as the boundary, corresponding to a critical pore diameter of 73.7 nm. When lgP < 1.3, a significant linear relationship is observed. The Tucheng block shows slope values A1 ranging from –1.31 to –1.18, yielding fractal dimensions D1 between 2.69 and 2.82, with an average of 2.77. For the Laochang block, slopes vary from –1.58 to –1.18, corresponding to D1 values between 2.42 and 2.82, and an average of 2.60. In natural systems, the fractal dimension of pore structures is generally below 3, and the closer the value is to 3, the more complex the pore network. Therefore, the higher average D1 in the Tucheng block suggests more pronounced heterogeneity and structural complexity compared to the Laochang block. When lgP > 1.3 (i.e., pores < 73.7 nm), the calculated fractal dimensions D2 exceed 3 for both blocks, indicating that the pore structures in this range no longer follow a fractal pattern, or that the MIP-based sponge model is no longer applicable. These results are consistent with previous studies, supporting the feasibility of dividing the pore systems into adsorption and seepage domains based on this approach.
The boundary between seepage pores and fractures is typically between 600 and 700 nm; thus, a value of 650 nm was adopted in this study. Based on this, the pores in both the Tucheng and Laochang blocks were classified into adsorption pore systems, seepage pore systems, and fracture systems. The Laochang block exhibits poorly developed seepage pores, with stage pore volumes significantly lower than those in its adsorption and fracture systems. In contrast, the Tucheng block displays well-developed seepage pores, suggesting higher permeability potential.
Table 2 lists multifractal parameters quantifying pore heterogeneity, while Figure 13 visualizes multifractal characteristics (dimension scaling, quality functions, singularity spectra) that confirm hierarchical pore complexity.
As shown in Figure 13a, the generalized fractal dimension Dq decreases monotonically with increasing q, exhibiting an anti-S-shaped trend. For q < 0, Dq declines rapidly with increasing q, while for q > 0, the decline becomes more gradual. Figure 13b illustrates the nonlinear increase in τ(q) with q, with a steeper slope for q < 0 than for q > 0. The multifractal spectrum in Figure 13c shows a typical upward convex parabolic shape. On the left side of the peak, f(α) increases with α; on the right, f(α) decreases with α. These curves collectively confirm the multifractal nature of the pore size distributions.
The information dimension D1 reflects the uniformity of the pore size distribution, with higher values indicating greater uniformity. D1 values for all samples range from 0.761 to 0.904, with an average of 0.821 for the Tucheng block and 0.863 for the Laochang block, suggesting a more homogeneous pore size distribution in the latter. The correlation dimension D2, which represents pore connectivity, ranges from 0.611 to 0.685. Among these, sample T1 in the Tucheng block shows the poorest connectivity, while sample L2 in the Laochang block exhibits the best.
The width of the Dq spectrum (D10D10) indicates the complexity of the pore structure. For the Tucheng block, this value ranges from 1.007 to 1.568, with an average of 1.322; for the Laochang block, the range is 0.756 to 1.553, with an average of 1.184. Both sample T1 and L4 exceed a value of 1.5, suggesting highly heterogeneous and complex pore structures. Another indicator of multifractal behavior is the singularity width Δα, which ranges from 0.983 to 1.823, with an average of 1.484, reinforcing the conclusion that all samples display heterogeneous pore size distributions.
While our results were derived from a specific basin, the multifractal analysis framework is applicable to other reservoirs, where pore-scale heterogeneity and fluid redistribution under changing stress conditions are equally critical. Its application to sandstone has been validated in our prior studies [23,40], and this work extends the methodology to dynamically evolving coal systems.

3.4. Development of Permeability Prediction Model

To elucidate the primary factors affecting coal reservoir permeability, Table 3 summarizes Pearson correlations between 18 petrophysical/geochemical parameters, identifying Δα (heterogeneity) and D10 (pore throat size) as key permeability controls. Figure 14 visualizes these correlations as a heatmap, confirming strong negative (Δα) and positive (D10) links to permeability. Among these, the heterogeneity index Δα (R = −0.93, p < 0.01) and the pore throat parameter D10 (R = 0.72, p < 0.05) exhibited the strongest correlations with permeability, suggesting their pivotal roles in controlling fluid migration within the pore network.
Δα quantifies the heterogeneity of pore structure derived from multifractal analysis, where higher values indicate greater irregularity and complexity in pore geometry. D10 represents the pore throat diameter at the 10th percentile of the cumulative pore size distribution, serving as a measure of effective flow pathways. Key insights from the correlation analysis include the following: strong negative correlation between Δα and permeability (R = −0.93), which suggests that increased pore structure heterogeneity significantly hampers fluid flow, likely due to the increased tortuosity and reduced connectivity of flow paths; moderate positive correlation between D10 and permeability (R = 0.72), as larger pore throats enhance the ease of fluid transport, thereby improving permeability; and high multicollinearity between Δα and D−10 (R = 0.98), which due to this redundancy, D−10 was excluded from the subsequent regression analysis to ensure model robustness.
Due to logistical constraints, the current dataset includes eight full-scale coal core samples. We acknowledge that this limited sample size may affect the statistical robustness of the results, and additional sampling in future work will help confirm our findings.
In porous media flow, permeability k is fundamentally controlled by two competing factors: the tortuosity τ of the flow pathways and the capillary resistance Rc imposed by pore throat constriction. We here show how the multifractal heterogeneity index Δα and the 10th-percentile throat diameter D10 map onto these physical quantities, justifying our linear regression form.
Fractal theory relates the complexity of a porous network to its tortuosity. Following Rieu and Sposito, the tortuosity τ can be expressed as
τ = L l D f 1
where L is the macroscopic sample length; , a characteristic pore-scale length, and Df, the fractal dimension of the flow network. In a multifractal framework, the singularity spectrum width Δα = αmaxαmin quantifies deviations from uniform scaling and serves as an effective measure of network irregularity. Empirically, one finds
τ Δ α β
with exponent β ≈ 1 for coal pore systems. Thus, increased Δα directly amplifies pathway tortuosity and reduces permeability.
Capillary entry pressure Pc for a cylindrical throat of radius rrr follows the Washburn equation:
P c = 2 σ cos θ r
where σ is interfacial tension, and θ is the contact angle. In defining r10 = D10/2, the capillary resistance Rc (pressure drop per unit length) scales as
R c 1 r 10 = 2 D 10
Larger D10, therefore, lowers Rc and enhances permeability. Through the combination of these two effects, the hydraulic conductance of the porous medium can be approximated by
k 1 τ R 10 1 Δ α β × D 10
Taking β = 1 and linearizing around the mean values of Δα and D10 yields our empirical form:
k = a b Δ α + c D 10
where coefficients a, b, and c are determined by regression.
To quantify the combined influence of Δα and D10 on permeability, a multivariate linear regression model was developed. The predictors were carefully selected based on statistical significance and low variance inflation factors (VIF < 5), ensuring minimal multicollinearity. The resulting model is
k = 1.27 0.82 Δ α + 0.68 D 10 , R 2 = 0.91
This regression model explains 91% of the variance in permeability, underscoring its predictive strength.
The negative regression coefficient of Δα confirms that greater heterogeneity in the pore structure leads to increased flow resistance and reduced permeability. This finding aligns with theoretical expectations in porous media flow, where complex and irregular pore geometries increase tortuosity and decrease effective connectivity, thus impeding gas transport. For example, sample T1, with a high Δα value of 1.81, exhibited a low permeability of only 0.44 mD, while sample L2, with a more uniform pore structure (Δα = 0.98), displayed a significantly higher permeability of 0.81 mD. These results underscore the critical role of fractal heterogeneity in governing flow behavior.
Conversely, the positive coefficient for D10 indicates that larger pore throat diameters facilitate fluid migration by reducing capillary resistance and enhancing effective flow channels. Notably, sample L2, which had the largest D10 value (0.60), demonstrated largest permeability (0.81 mD), suggesting that pore throat enlargement can partially mitigate the detrimental effects of structural heterogeneity. This result illustrates the potential trade-off between pore uniformity and throat size in controlling overall permeability.
The high coefficient of determination (R2 = 0.91) indicates that the two parameters—Δα and D10—jointly explain 91% of the variability in coal reservoir permeability, highlighting their dominant and complementary roles in controlling fluid transport. These insights provide a robust empirical basis for permeability prediction and reservoir evaluation in CBM development. Furthermore, this modeling approach offers practical implications for reservoir stimulation strategies, suggesting that enhancing pore throat connectivity while minimizing pore structure heterogeneity could significantly improve CBM production efficiency.
The strong controls of Δα and D10 on permeability have direct relevance to coalbed methane (CBM) development. First, Δα and D10 can be deployed as key petrophysical inputs in reservoir simulators to improve the accuracy of CBM production forecasts. Zones characterized by lower Δα and higher D10 should exhibit enhanced gas deliverability, guiding well placement and completion designs. Second, the model (Equation (18)) allows for the rapid, data-driven estimation of permeability from routine fractal analyses of core or image logs—enabling the early identification of “sweet spots” before full-field drilling. Third, hydraulic fracturing or CO2-enhanced drainage strategies can be optimized by targeting intervals with unfavorable Δα–D10 signatures, focusing stimulation efforts where the predicted permeability uplift will be greatest. Finally, coupling this multifractal-based model with production data history matching can refine forecasts of long-term CBM recovery, helping operators to calibrate recovery factors and economic scenarios.
In addition to the tectonic controls on pore architecture, our data demonstrate a clear dependence of multifractal parameters on coal rank (as measured by Ro,max). Across the eight samples, Ro,max is moderately and positively correlated with both the information dimension D1 (R = +0.51) and the correlation dimension D2 (R = +0.49), indicating that higher-rank coals develop a more uniform pore size distribution and improved pore connectivity. Conversely, the multifractal heterogeneity index Δα shows a weak negative correlation with Ro,max (R = −0.27), and the overall spectrum width (D0D2) decreases more strongly (R = −0.49), suggesting that increasing maturity leads to a narrower, more convergent singularity spectrum and hence lower structural complexity. Finally, the 10th-percentile pore throat diameter D10 also increases with Ro,max (R = +0.40), implying that the growth and coalescence of micropores during thermal maturation create larger effective flow channels. Taken together, these trends reveal that as coal rank advances, the pore network becomes simultaneously more homogeneous, better connected, and populated by slightly larger throats—factors that collectively mitigate some of the tortuosity imposed by tectonic deformation and thereby influence permeability.

4. Conclusions

This systematic investigation of middle- to high-rank coal reservoirs in the Western Guizhou–Eastern Yunnan Basin establishes multiscale pore heterogeneity as the dominant control on permeability, challenging conventional petrophysical paradigms. Key findings include the following:
(1)
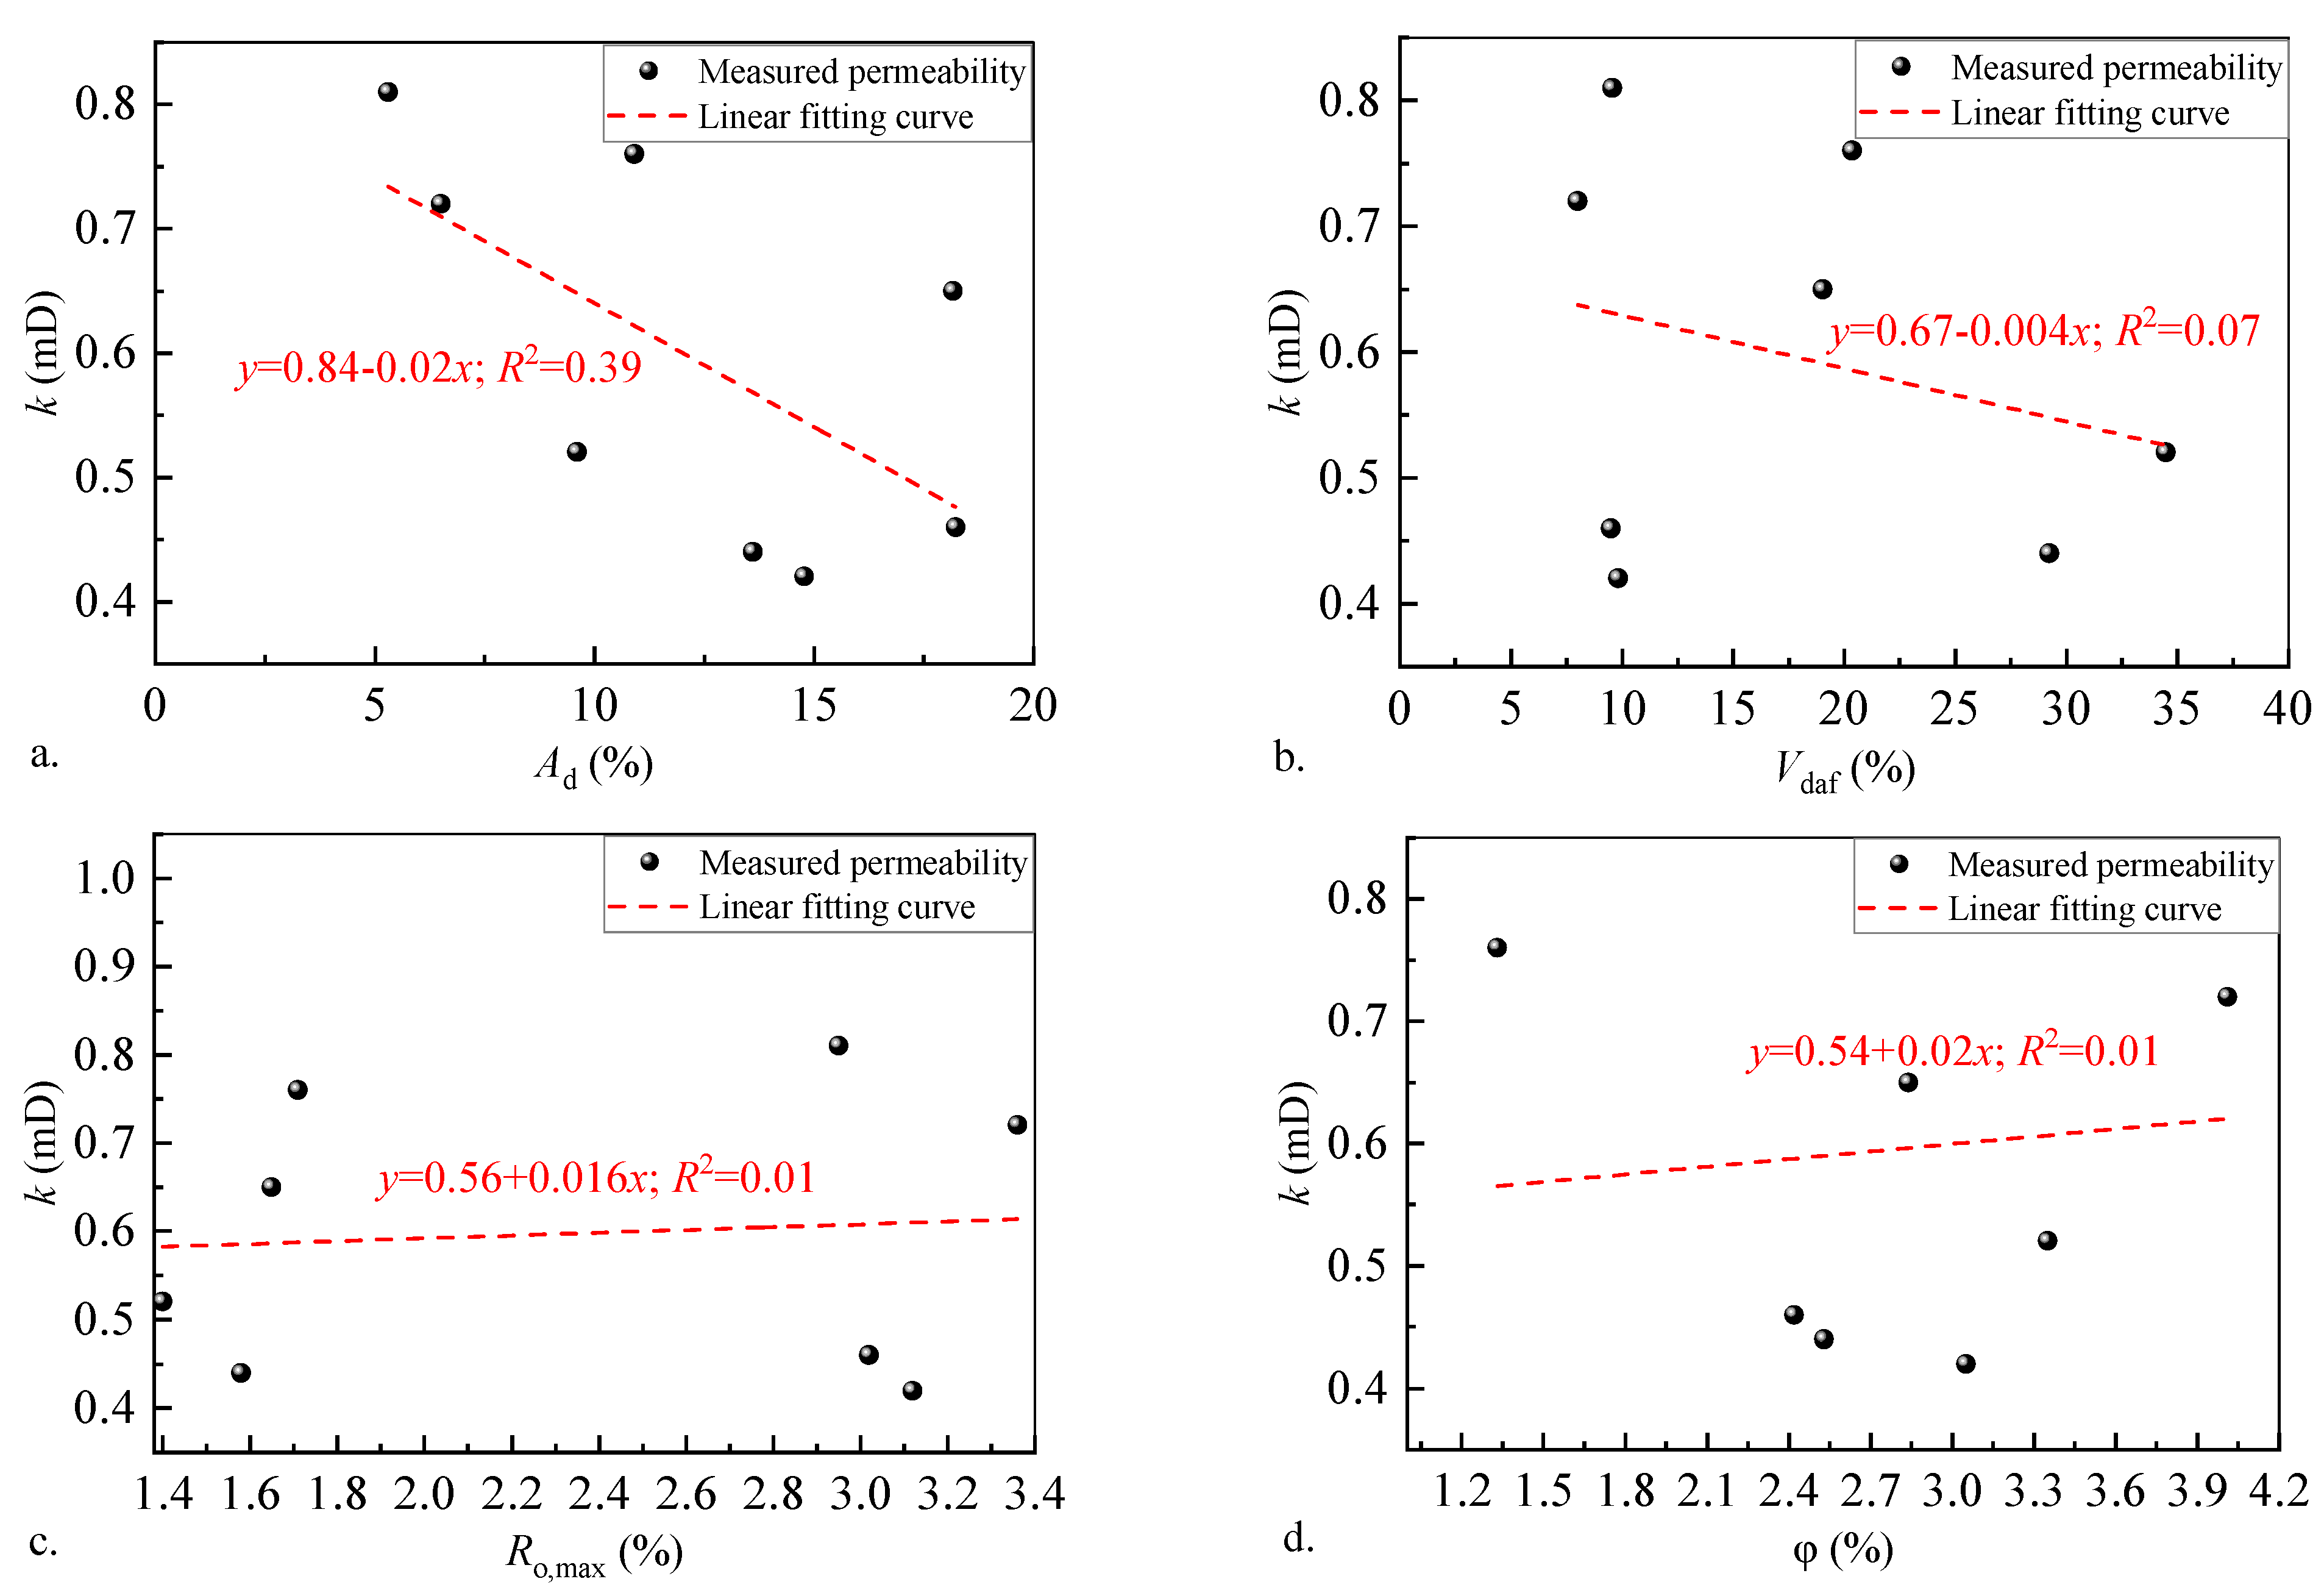
Weak correlations (R2 < 0.39) between ash yield, volatile matter, porosity, and permeability confirm that conventional parameters fail to capture flow dynamics in heterogeneous coals in study area. Counterintuitive permeability–porosity relationships underscore the necessity of pore-scale characterization.
(2)
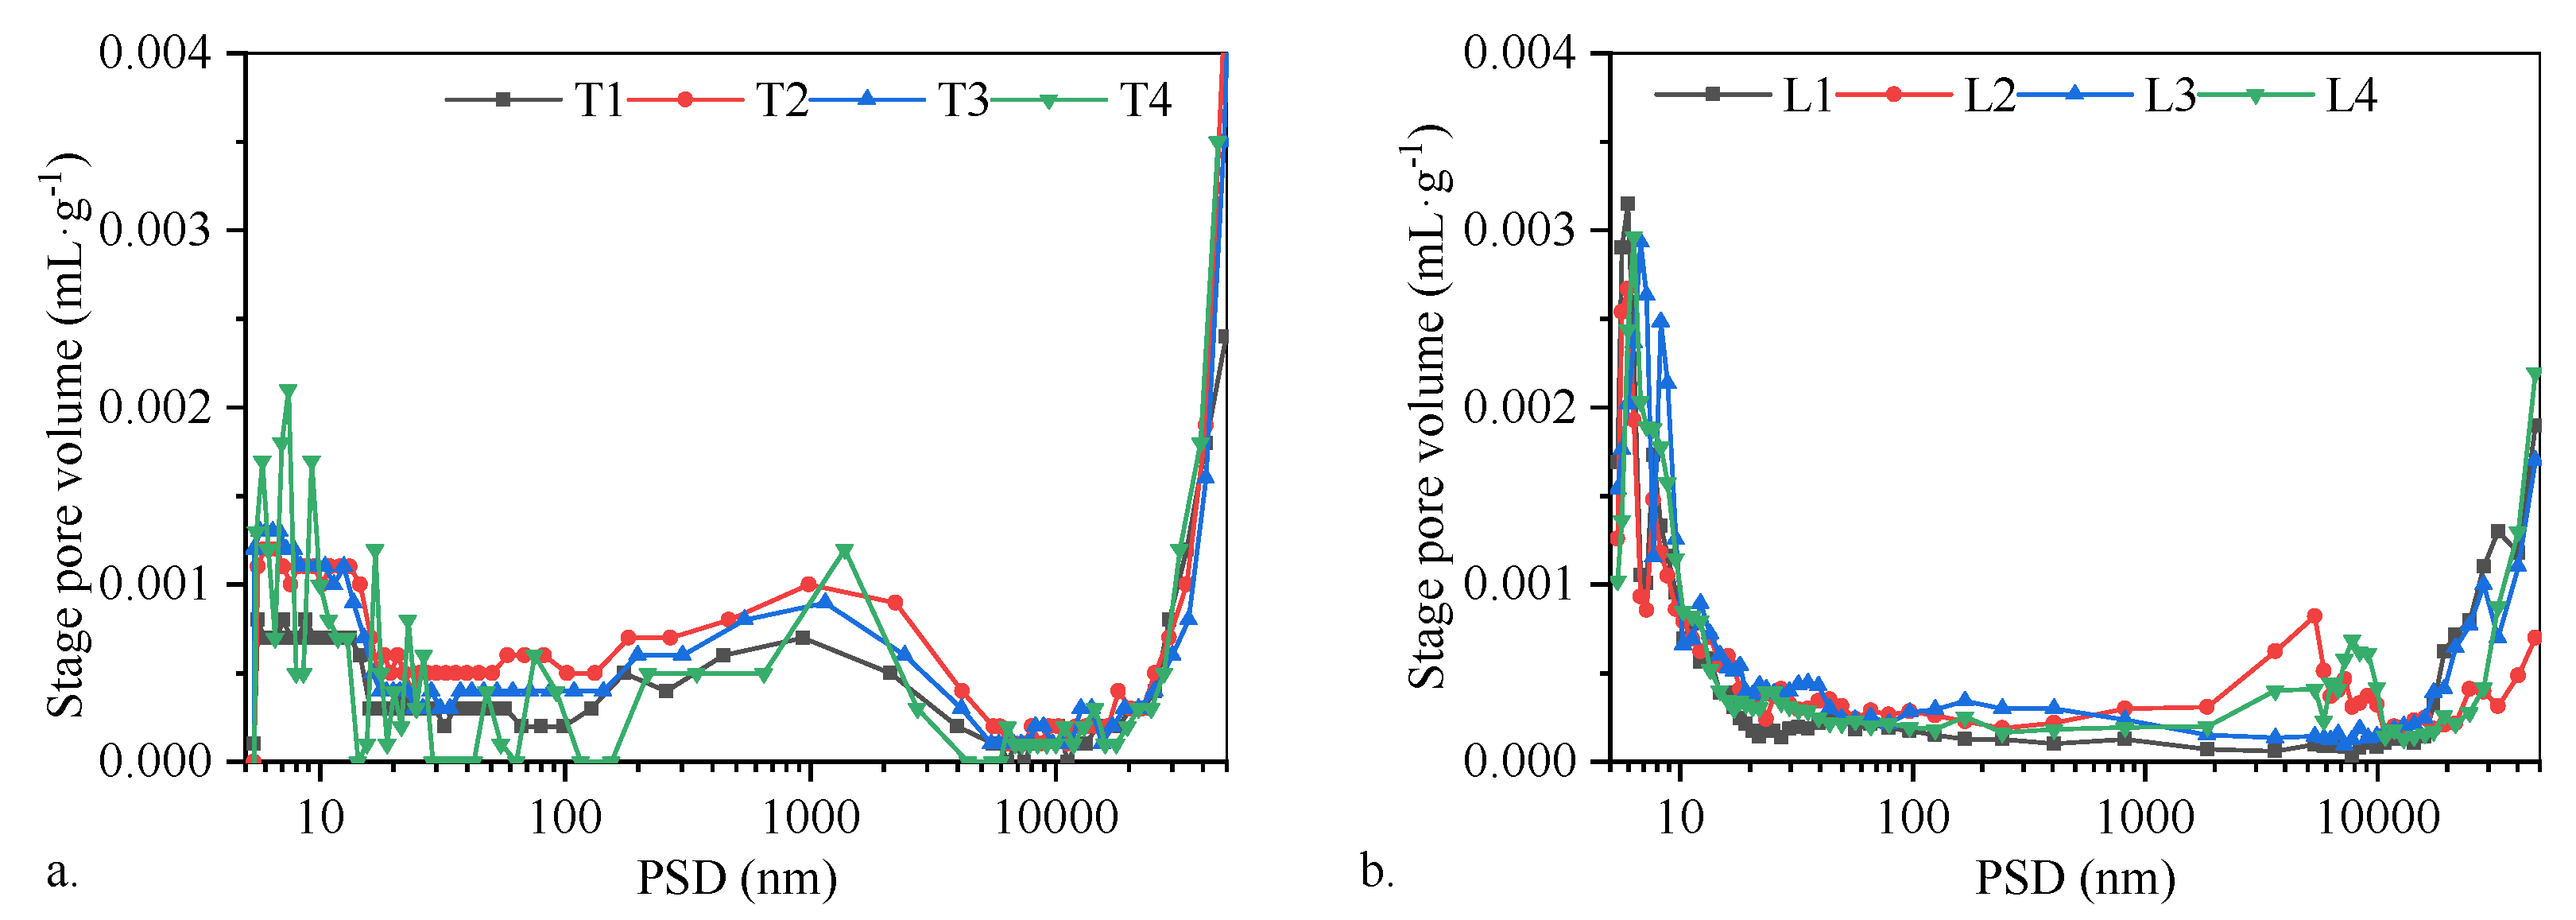
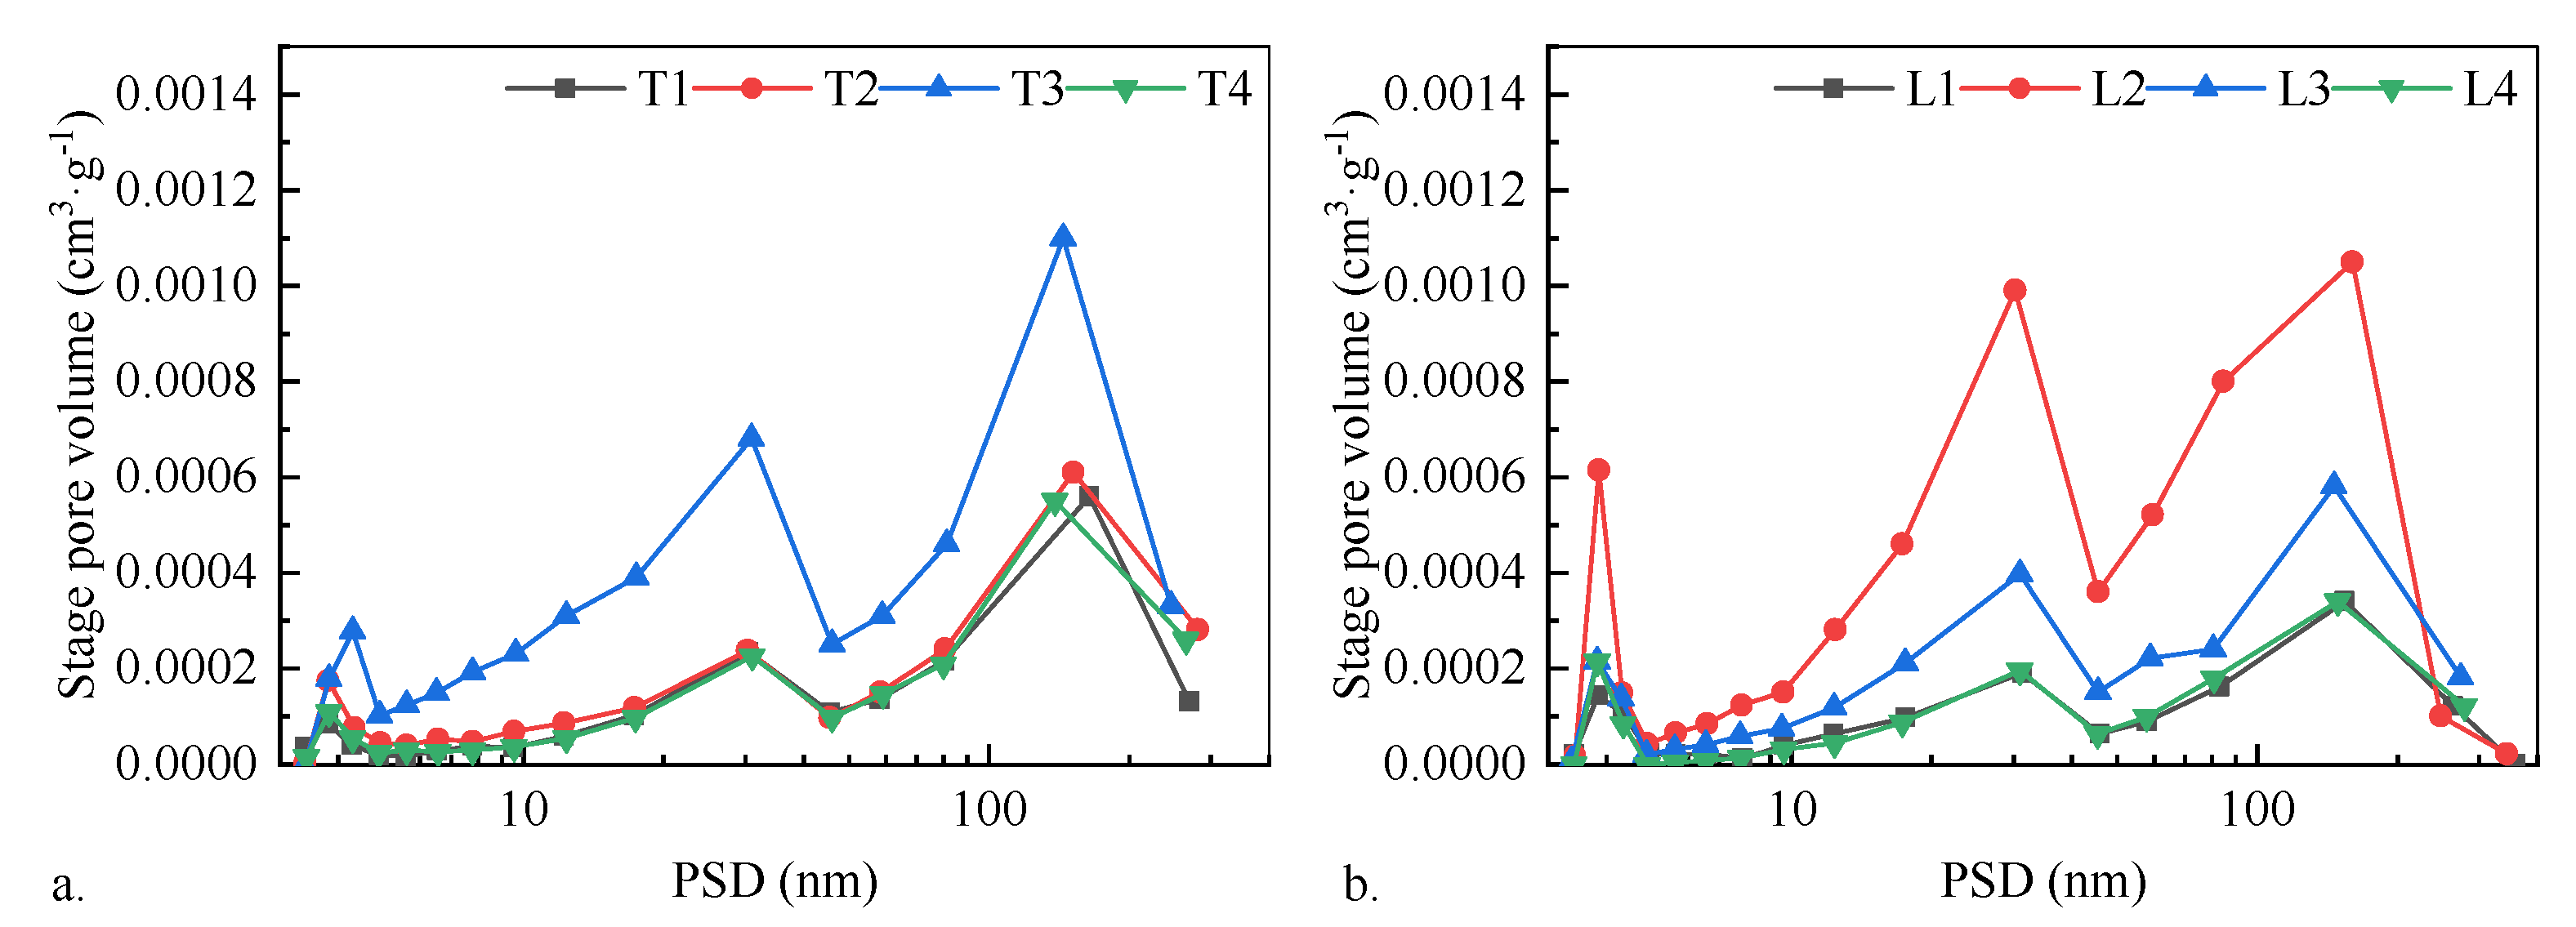
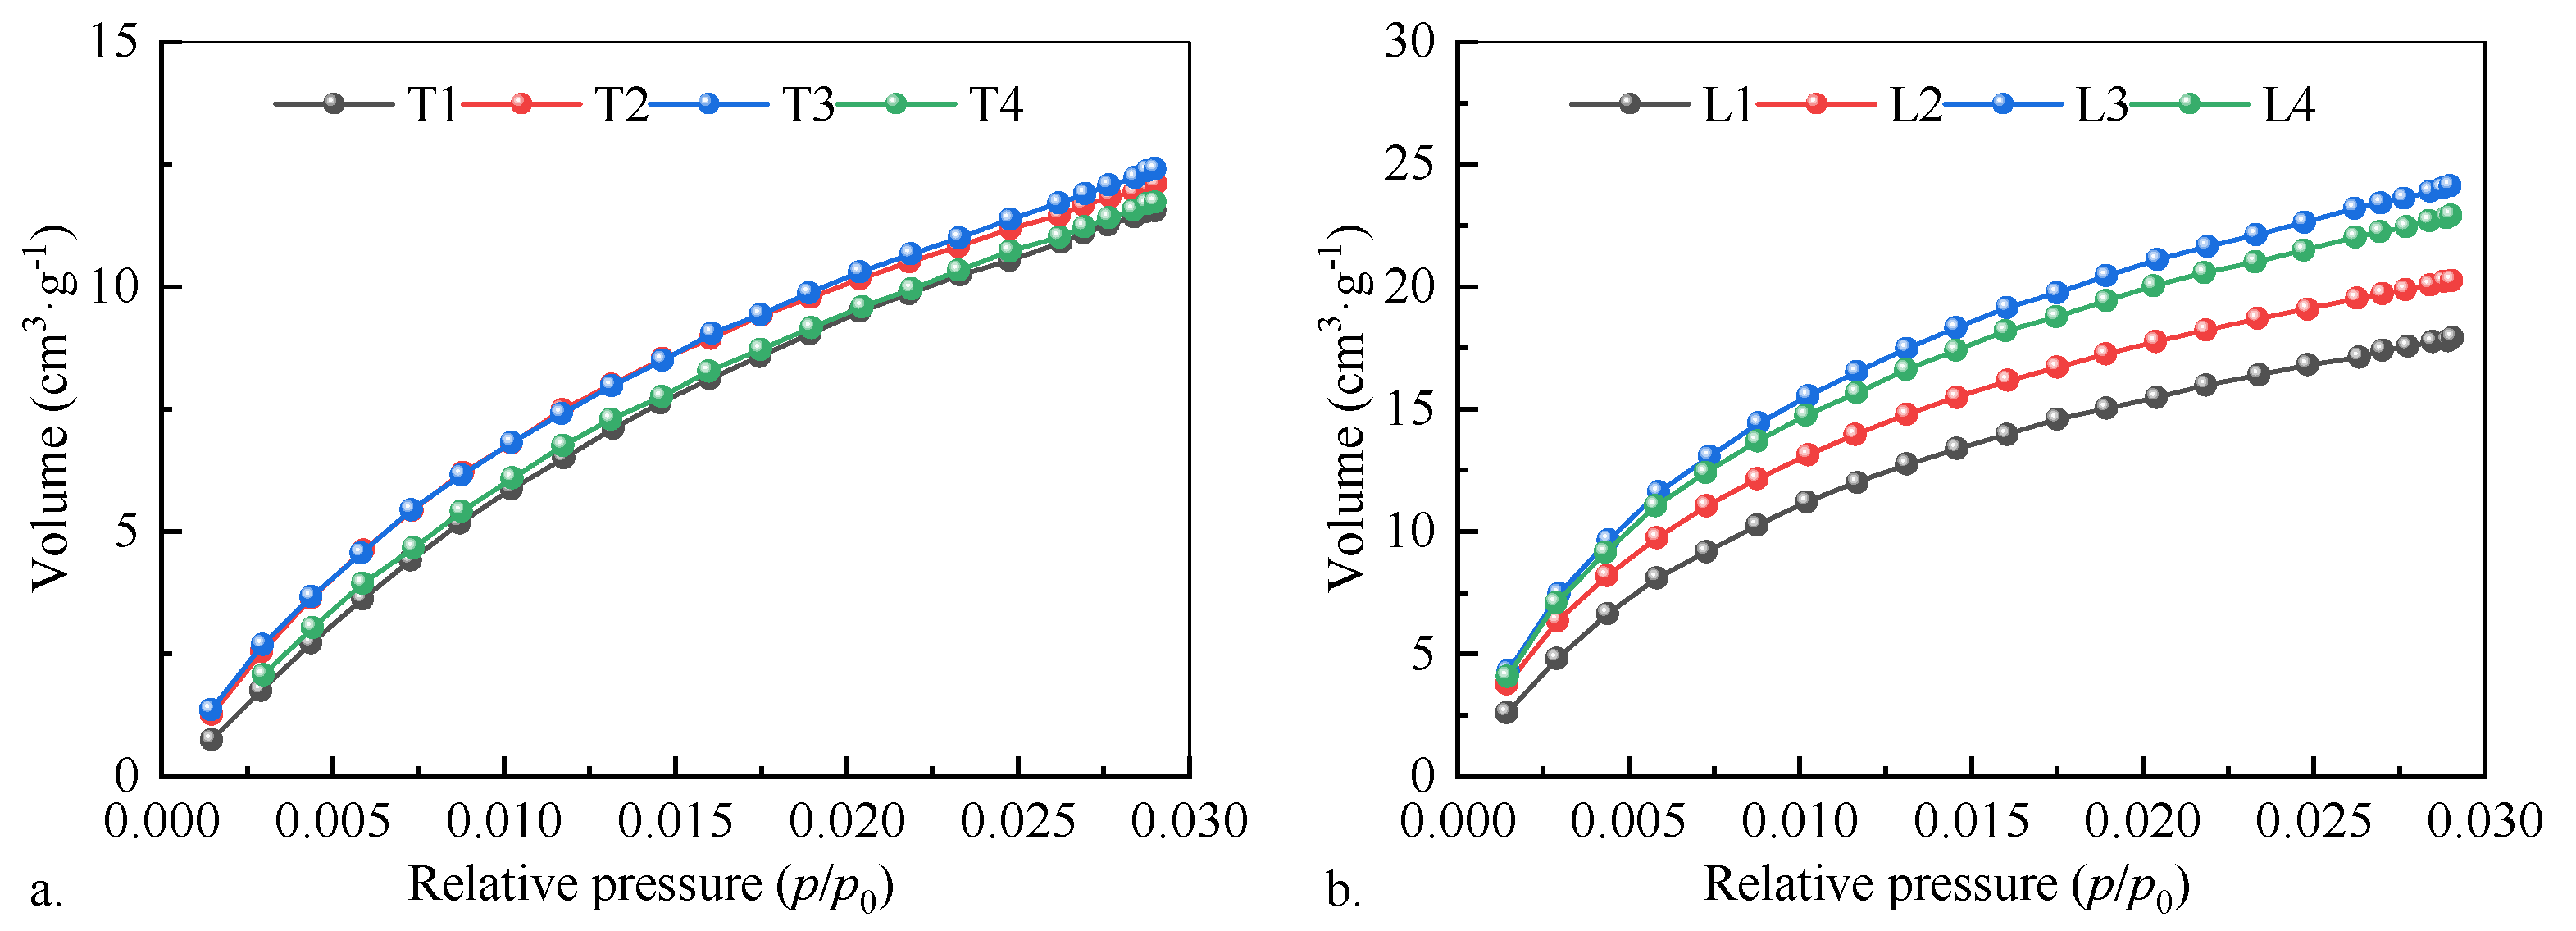
Laochang’s high-rank coals (Ro,max = 2.95–3.36%) exhibit microporous dominance (0.45–0.55 nm; CO2 adsorption = 17.90–24.11 cm3·g−1) and ink-bottle pore reduction (H3-type hysteresis), favoring adsorption but limiting seepage. Tucheng’s mid-rank coals (Ro,max = 1.40–1.71%) feature tri-modal pore distributions with robust seepage networks (100–5000 nm; 0.00385 cm3·g−1 stage volumes), enhancing permeability despite lower maturity.
(3)
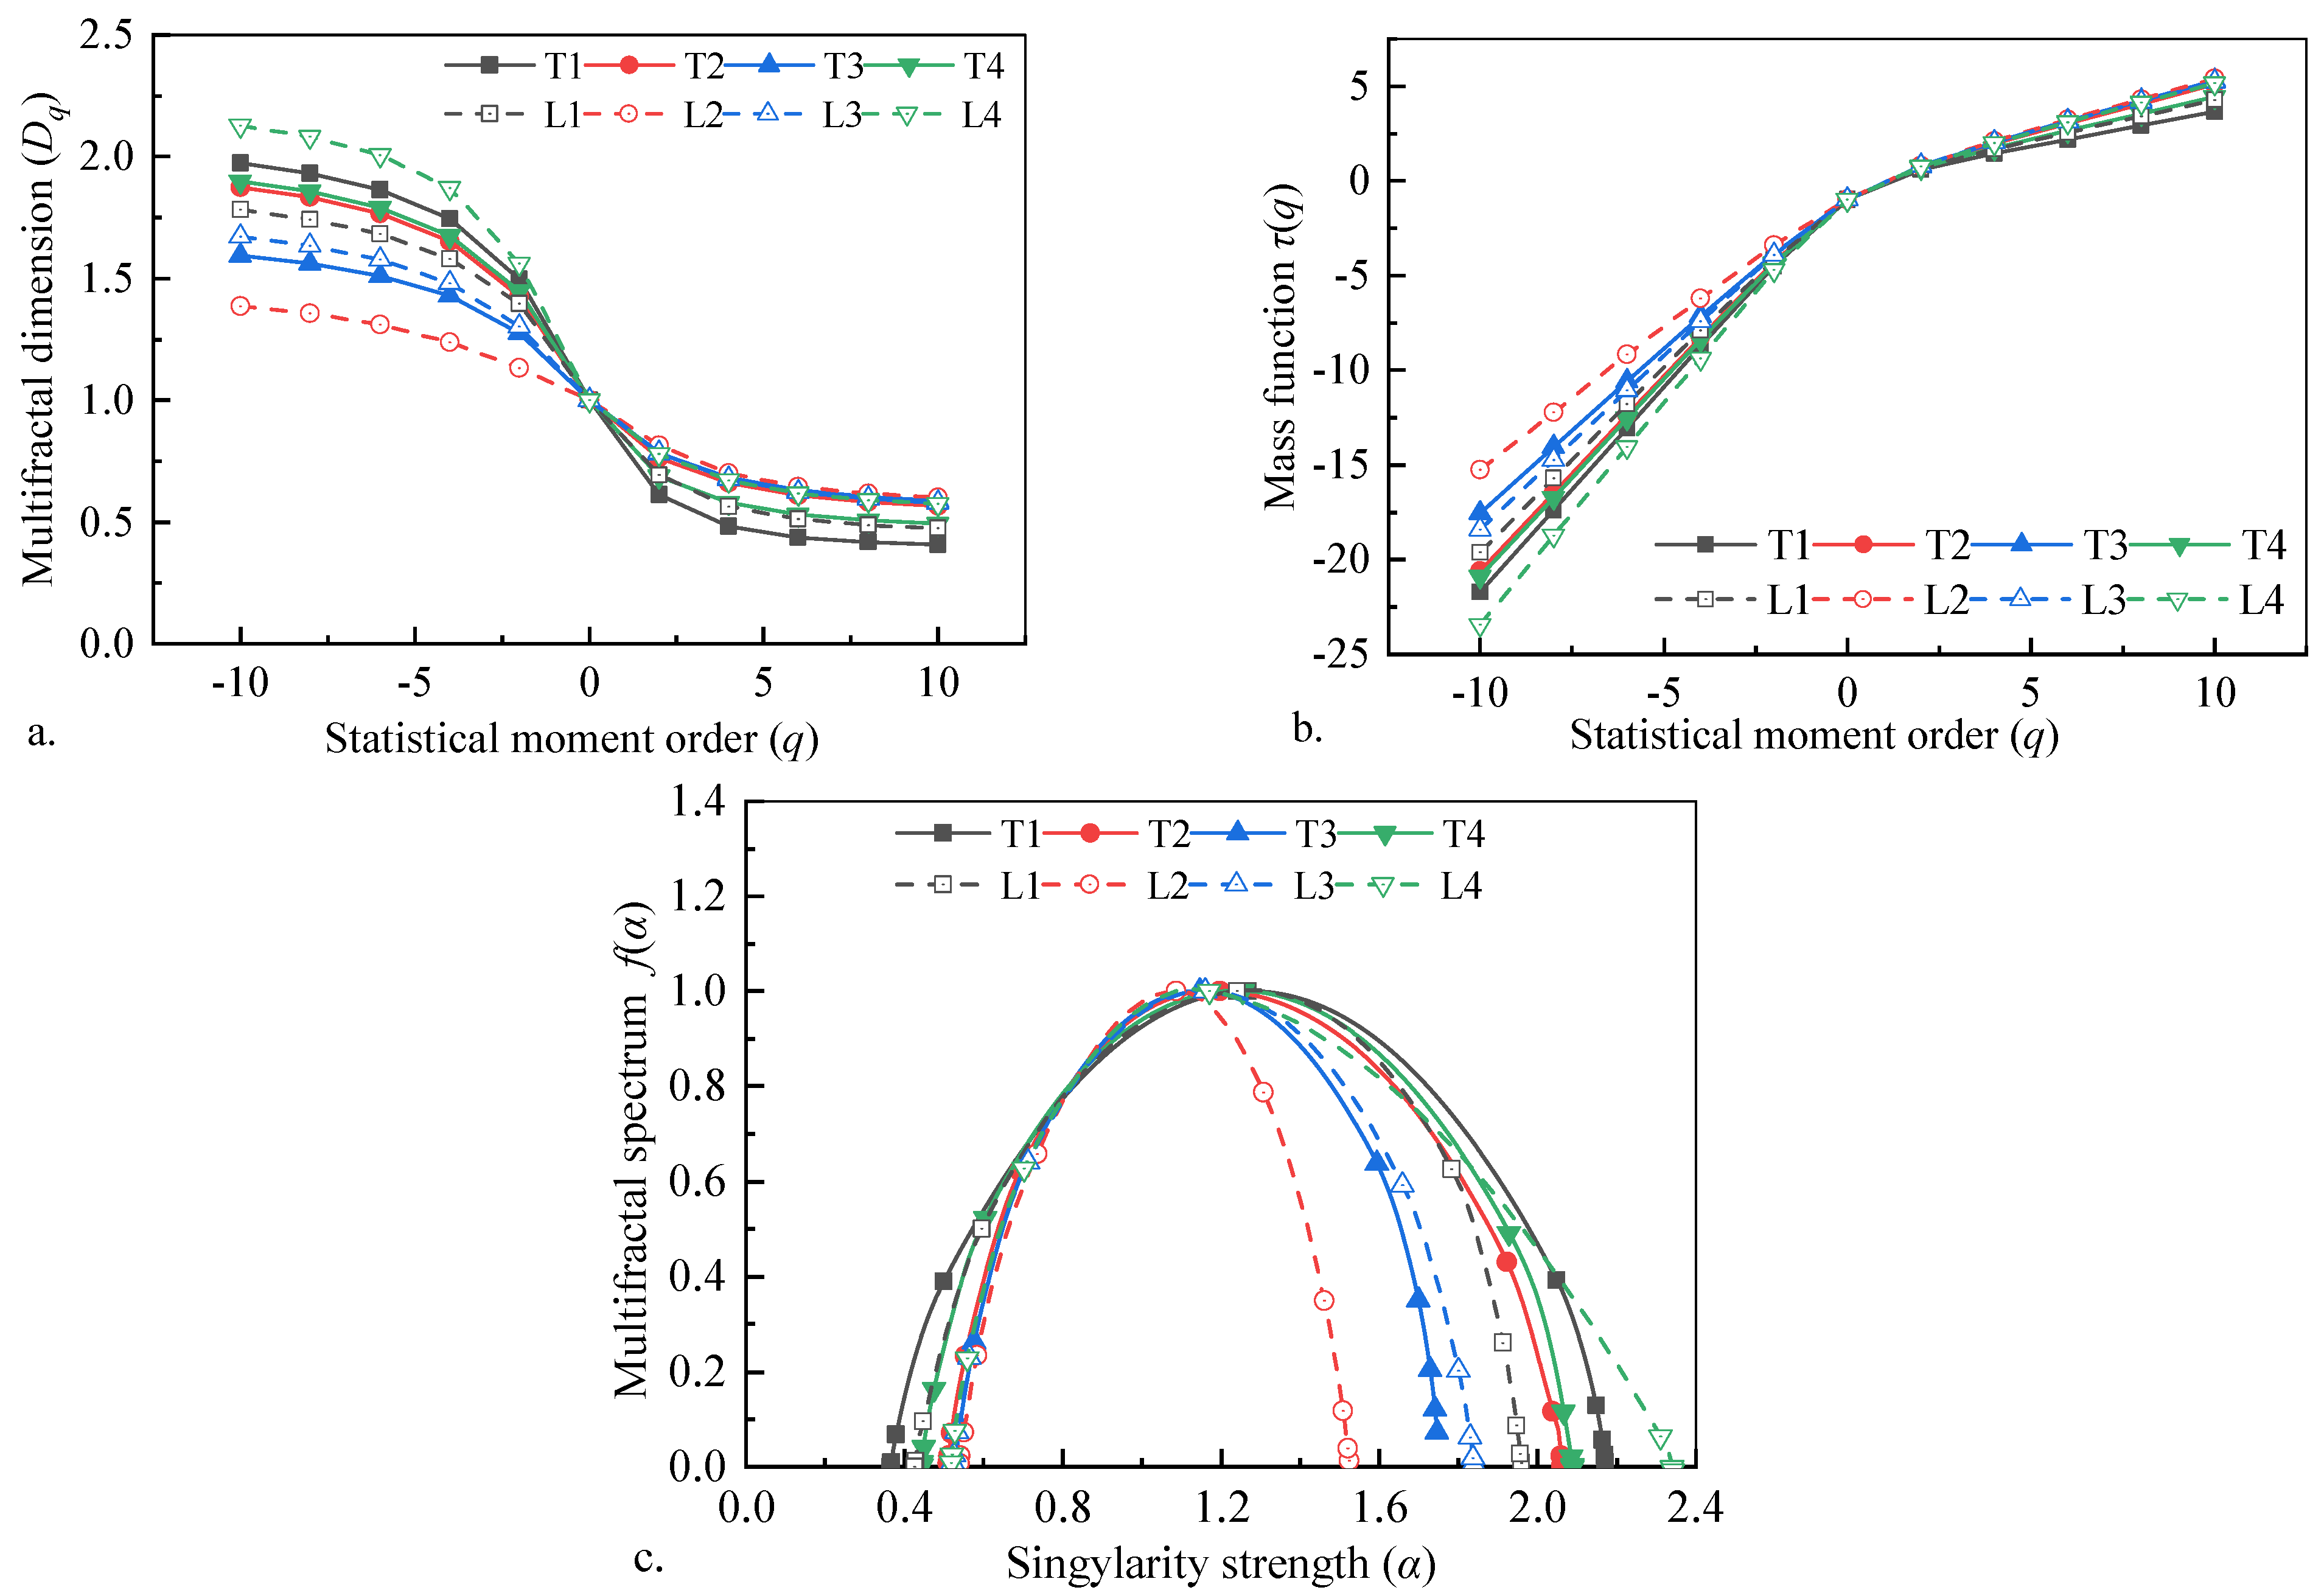
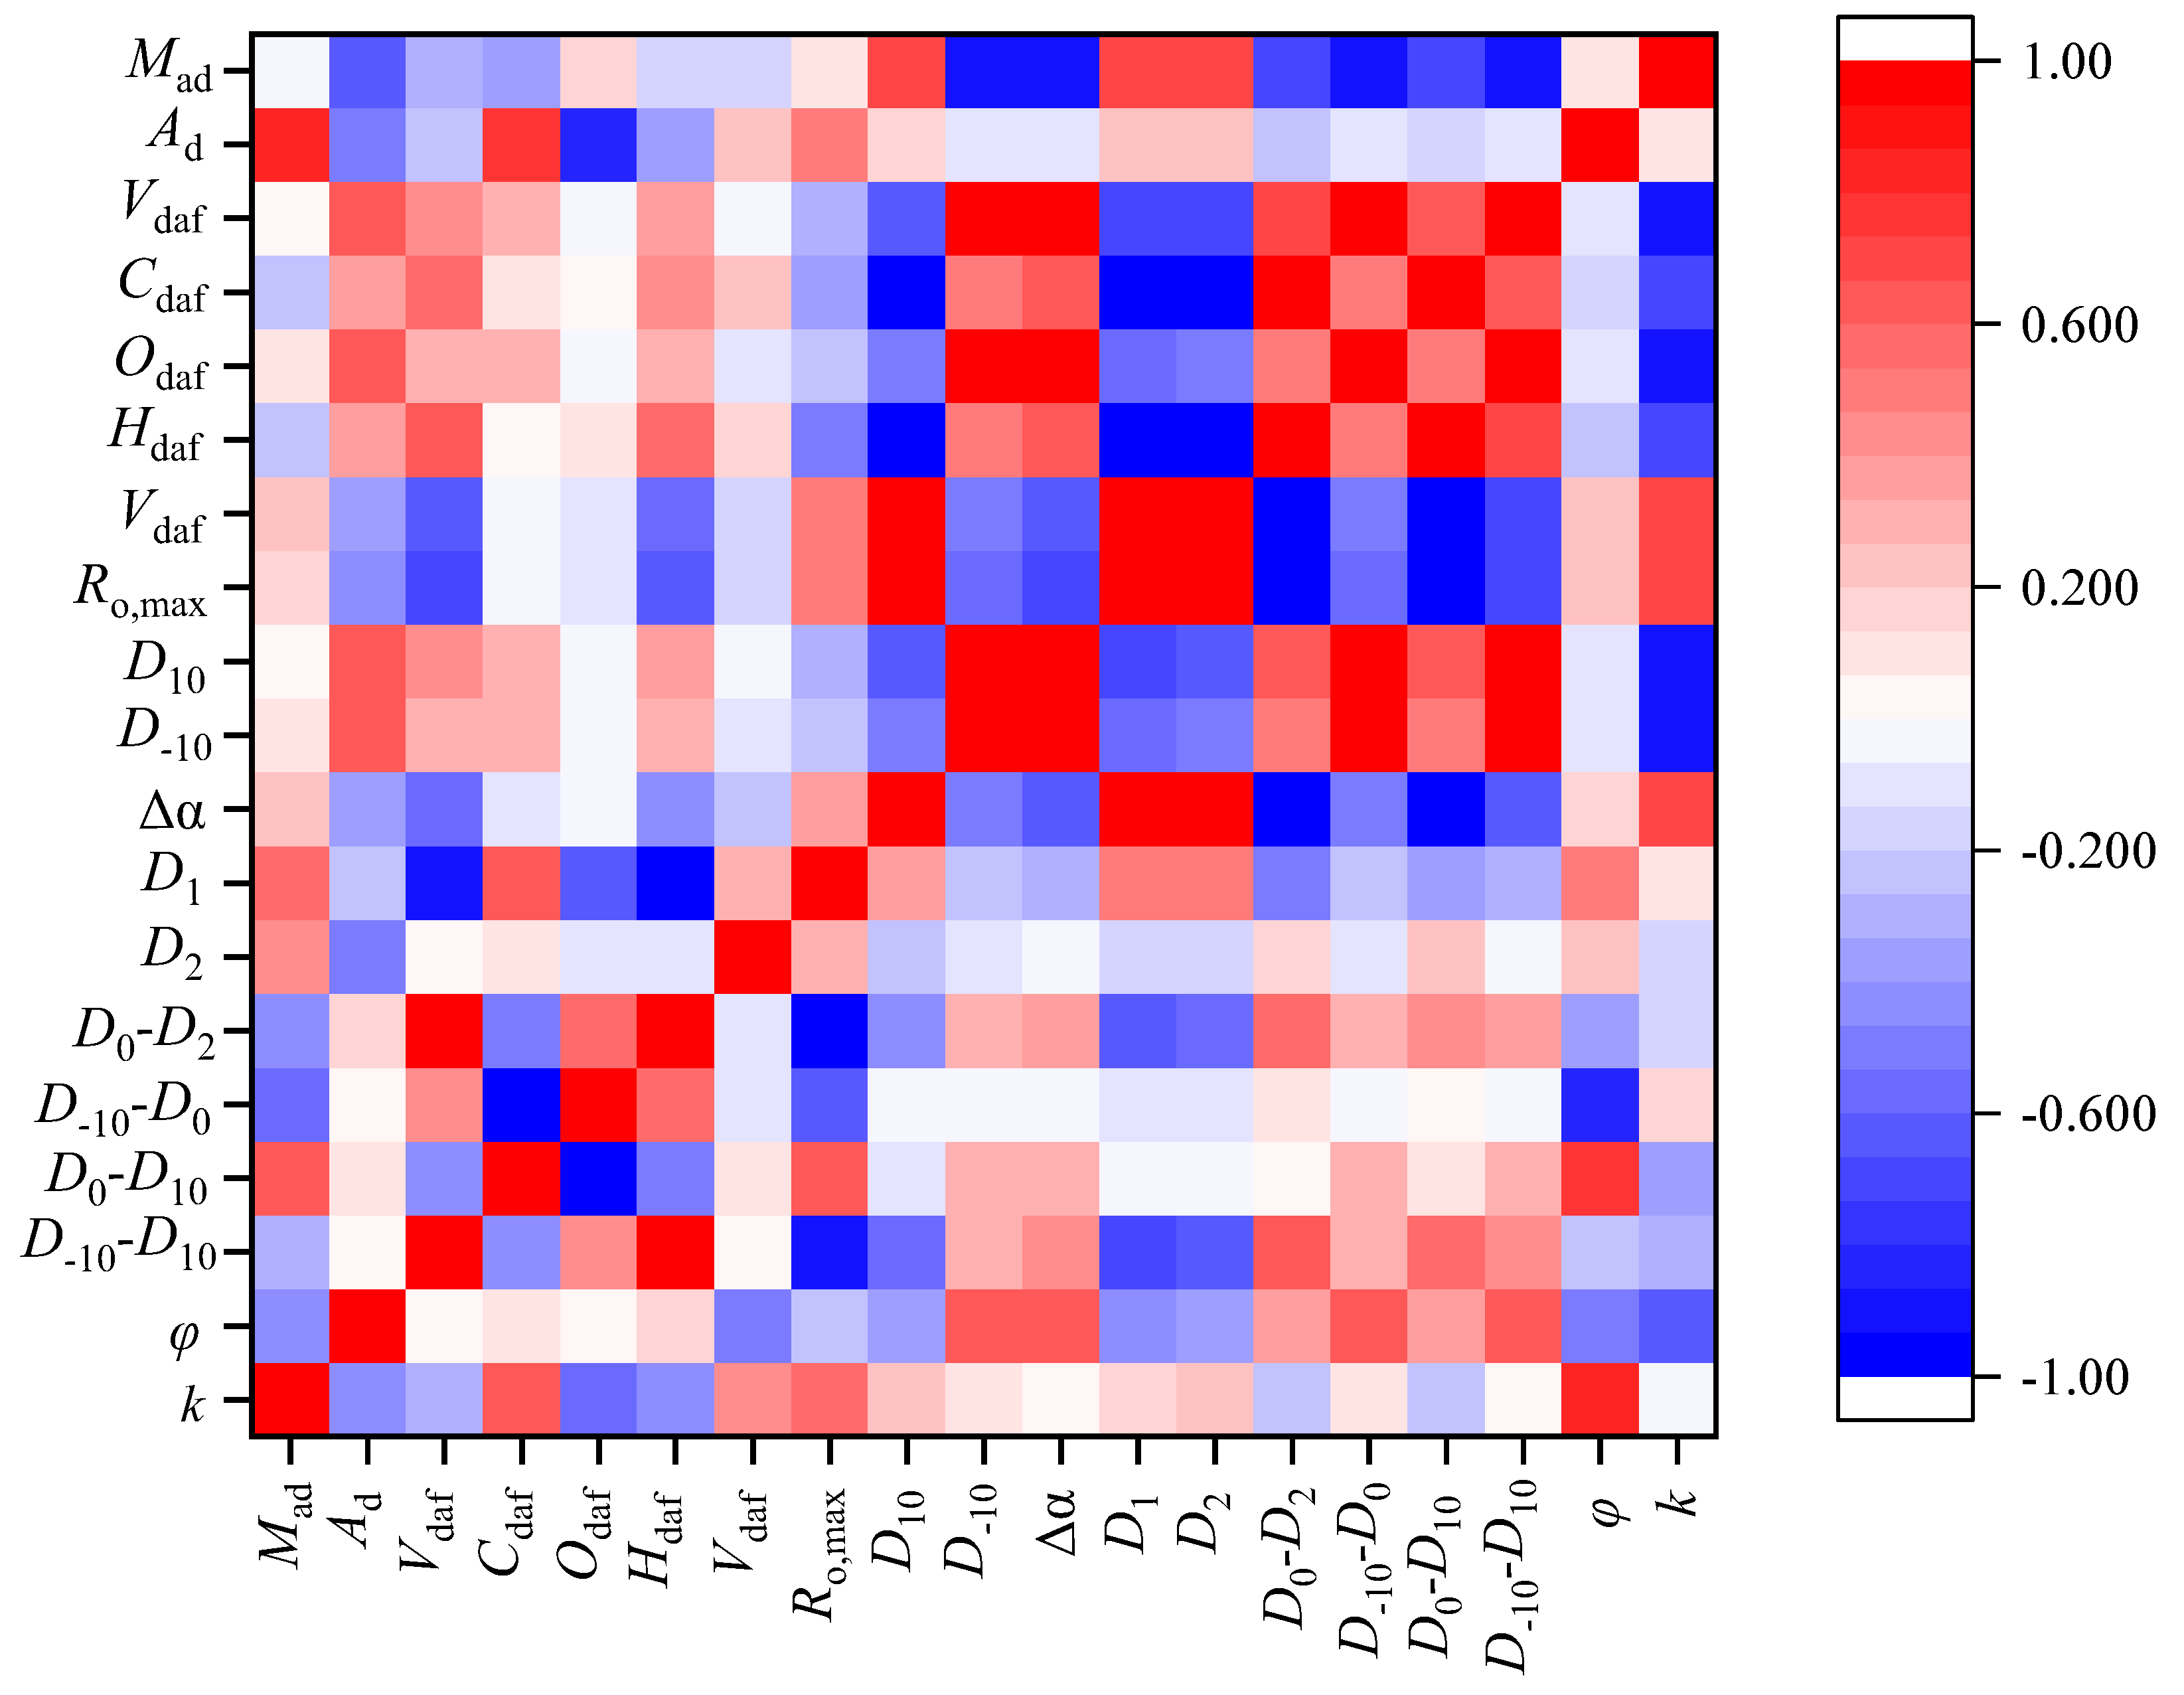
Multifractal spectra (Δα = 0.98−1.82) quantify structural complexity, with Laochang’s uniform pores (D1 = 0.863) contrasting Tucheng’s heterogeneous networks (D1 = 0.821). The singularity width Δα emerged as the prime permeability regulator (R = −0.93), where increased heterogeneity elevates flow tortuosity by 34–68% in high-Δα samples.
(4)
The multifractal-derived permeability model (R2 = 0.91) reconciles pore throat geometry (D10) and structural disorder (Δα), demonstrating the following: Permeability declines 0.82 mD per unit Δα increase due to flow-path occlusion. Throat size enlargement (D10 > 0.58) enhances permeability by 0.68 mD/unit, offsetting heterogeneity effects.

Author Contributions

Conceptualization, F.Q. and Y.Z.; methodology, W.L.; validation, X.D. and Z.Q.; writing—original draft preparation, F.Q.; writing—review and editing, C.W. All authors have read and agreed to the published version of the manuscript.

Funding

This research was funded by the Scientific Research Foundation for High-level Talents of Anhui University of Science and Technology (No. 2023yjrc70), Scientific Research and Development Platform of Technology of Disaster Prevention in Deep Coal Mines, Anhui University of Science and Technology (No. DPDCM2403), and National Natural Science Foundation of China (No. 42402175).

Data Availability Statement

The original contributions presented in this study are included in the article. Further inquiries can be directed to the corresponding author(s).

Conflicts of Interest

Author Fangkai Quan was employed by the company State Key Laboratory of Safe Mining of Deep Coal and Environmental Protection, Ltd. The remaining authors declare that the research was conducted in the absence of any commercial or financial relationships that could be construed as a potential conflict of interest.

References

  1. Li, Q.; Zhao, D.; Yin, J.; Zhou, X.; Li, Y.; Chi, P.; Han, Y.; Ansari, U.; Cheng, Y. Sediment instability caused by gas production from hydrate-bearing sediment in Northern South China Sea by horizontal wellbore: Evolution and mechanism. Nat. Resour. Res. 2023, 32, 1595–1620. [Google Scholar] [CrossRef]
  2. Ma, Z.; Tao, S.; Gao, L.; Cui, Y.; Jing, Q.; Chen, S.; He, W.; Guo, J.; Hai, L. Detailed characterization of microscopic pore structure in low-rank coal: A case study of zhalainuoer coalfield. Nat. Resour. Res. 2024, 33, 2261–2277. [Google Scholar] [CrossRef]
  3. Quan, F.; Wei, C.; Li, R.; Hao, S.; Zhang, J.; Song, Y.; Yan, G. Reservoir Damage in Coalbed Methane Commingled Drainage Wells and its Fatal Impact on Well Recovery. Nat. Resour. Res. 2023, 32, 295–319. [Google Scholar] [CrossRef]
  4. Li, G.; Qin, Y.; Wang, B.; Zhang, M.; Lin, Y.; Song, X.; Mi, W. Fluid seepage mechanism and permeability prediction model of multi-seam interbed coal measures. Fuel 2024, 356, 129556. [Google Scholar] [CrossRef]
  5. Li, Z.; Yu, H.; Bai, Y.; Wang, Y.; Hu, H.; Gao, Y.; Yan, F. Analysis of reservoir permeability evolution and influencing factors during CO2-Enhanced coalbed methane recovery. Energy 2024, 304, 132045. [Google Scholar] [CrossRef]
  6. Tao, S.; Chen, S.; Pan, Z. Current status, challenges, and policy suggestions for coalbed methane industry development in China: A review. Energy Sci. Eng. 2019, 7, 1059–1074. [Google Scholar] [CrossRef]
  7. Kang, J.; Fu, X.; Elsworth, D.; Liang, S. Vertical Heterogeneity of Permeability and Gas Content of Ultra-High-Thickness Coalbed Methane Reservoirs in the Southern Margin of the Junggar Basin and its Influence on Gas Production. J. Nat. Gas Sci. Eng. 2020, 81, 103455. [Google Scholar] [CrossRef]
  8. Zhang, Z.; Gong, F.; Zou, G.; Zhu, G.; Liu, W.; Chen, H. Prediction of anisotropic coalbed methane reservoir brittleness index based on rock physics modelling. Geophys. Prospect. 2025, 73, 1488–1509. [Google Scholar] [CrossRef]
  9. Liu, G.; Tang, R.; Mu, C.; Liu, X.; Zhang, J. Physical Properties of High-Rank Coal Reservoirs and the Impact on Coalbed Methane Production. Processes 2024, 12, 1754. [Google Scholar] [CrossRef]
  10. Yao, P.; Zhang, J.; Lv, D.; Vandeginste, V.; Chang, X.; Zhang, X.; Wang, D.; Han, S.; Liu, Y. Effect of water occurrence in coal reservoirs on the production capacity of coalbed methane by using NMR simulation technology and production capacity simulation. Geoenergy Sci. Eng. 2024, 243, 213353. [Google Scholar] [CrossRef]
  11. Guo, C.; Li, R.; Qin, Y.; Lu, L.; Yi, T.; Chen, Z.; Yuan, H.; Gao, W.; Cheng, X. Evolution path of water produced from coalbed methane wells and its significance in judging productivity: A case study of Zhijin block in western Guizhou Province. Acta Pet. Sin. 2024, 45, 517. [Google Scholar]
  12. Zhang, B.; Wang, G.; Li, W.; Jiao, X. Characteristics and Sources of CBM Well-Produced Water in the Shouyang Block, China. Appl. Sci. 2024, 14, 4218. [Google Scholar] [CrossRef]
  13. Chen, S.; Tao, S.; Tang, D. In situ coal permeability and favorable development methods for coalbed methane (CBM) extraction in China: From real data. Int. J. Coal Geol. 2024, 284, 104472. [Google Scholar] [CrossRef]
  14. Zhou, X.; Hu, B.; He, Q.; Huang, X.; Hou, H. Physical Characteristics of Coal Reservoirs and CBM Favorable Area Prediction in the Huaibei Coalfield, Northern China. ACS Omega 2024, 9, 12158–12174. [Google Scholar] [CrossRef]
  15. Zhao, F.; Han, S.; Sang, S.; Zhou, P.; Mondal, D.; Guo, Z.; Xu, A. Modified Method for Calculating Saturation Gas Content in Deep Coal and the Pore Size Effect of Methane Adsorption on Guizhou Middle- and High-Rank Coals. Nat. Resour. Res. 2023, 32, 1215–1233. [Google Scholar] [CrossRef]
  16. Zhang, Z.; Qin, Y.; You, Z.; Yang, Z. Distribution Characteristics of In Situ Stress Field and Vertical Development Unit Division of CBM in Western Guizhou, China. Nat. Resour. Res. 2021, 30, 3659–3671. [Google Scholar] [CrossRef]
  17. Sun, W.; Zuo, Y.; Wu, Z.; Liu, H.; Xi, S.; Shui, Y.; Wang, J.; Liu, R.; Lin, J. Fractal analysis of pores and the pore structure of the Lower Cambrian Niutitang shale in northern Guizhou province: Investigations using NMR, SEM and image analyses. Mar. Petrol. Geol. 2019, 99, 416–428. [Google Scholar] [CrossRef]
  18. Chen, S.; Tang, D.; Tao, S.; Ji, X.; Xu, H. Fractal analysis of the dynamic variation in pore-fracture systems under the action of stress using a low-field NMR relaxation method: An experimental study of coals from western Guizhou in China. J. Petrol. Sci. Eng. 2019, 173, 617–629. [Google Scholar] [CrossRef]
  19. Li, R.; Hou, X.; Chen, L.; Fang, H.; Zheng, C. Multifractal investigation on multi-scale pore structure heterogeneity of high rank coal reservoirs. Nat. Resour. Res. 2022, 31, 1665–1685. [Google Scholar] [CrossRef]
  20. Zhang, J.; Wei, C.; Chu, X.; Vandeginste, V.; Ju, W. Multifractal analysis in characterizing adsorption pore heterogeneity of middle-and high-rank coal reservoirs. ACS Omega 2020, 5, 19385–19401. [Google Scholar] [CrossRef]
  21. Sun, Y.; Zhai, C.; Zhao, Y.; Xu, J.; Cong, Y.; Zheng, Y.; Tang, W. Multifractal analysis and neural network prediction of pore structures in coal reservoirs based on NMR T2 spectra. Energ. Fuel 2021, 35, 11306–11318. [Google Scholar] [CrossRef]
  22. Zhang, N.; Guo, S.; Wang, S.; Tong, Y.; Li, Z.; Wu, J. Fractal and Multifractal Characteristics on Pore Structure of Coal-Based Sedimentary Rocks Using Nuclear Magnetic Resonance. SPE J. 2024, 29, 2624–2637. [Google Scholar] [CrossRef]
  23. Zhang, J.; Quan, F.; Zhang, H.; Shao, Y.; Han, Y.; Yang, Y.; Chang, X.; Zhang, X. Multi-method characterization of sandstone pore size distribution heterogeneity and its influence on porosity and permeability variation. Front. Earth Sci. 2024, 18, 814–830. [Google Scholar] [CrossRef]
  24. Zhang, J.; Wei, C.; Ju, W.; Yan, G.; Lu, G.; Hou, X.; Kai, Z. Stress sensitivity characterization and heterogeneous variation of the pore-fracture system in middle-high rank coals reservoir based on NMR experiments. Fuel 2019, 238, 331–344. [Google Scholar] [CrossRef]
  25. Qin, L.; Lv, S.; Li, S.; Wang, H.; Liu, P.; Mu, M.; Li, J. Freeze–Thaw Response of Permeability and Absorption Channel Structure and Moisture Distribution in Different Coal Ranks. Nat. Resour. Res. 2025, 34, 1103–1122. [Google Scholar] [CrossRef]
  26. Zhong, B.; Zhu, Y.; Feng, G.; Xiang, J.; Wang, Y. Matrix Compression and Pore Heterogeneity in the Coal-Measure Shale Reservoirs of the Qinshui Basin: A Multifractal Analysis. Fractal Fract. 2024, 8, 580. [Google Scholar] [CrossRef]
  27. Pan, J.; Du, X.; Wang, X.; Hou, Q.; Wang, Z.; Yi, J.; Li, M. Pore and permeability changes in coal induced by true triaxial supercritical carbon dioxide fracturing based on low-field nuclear magnetic resonance. Energy 2024, 286, 129492. [Google Scholar] [CrossRef]
  28. Duan, C.; Fu, X.; Deng, Z.; Kang, J.; Zhang, B.; Lu, J.; Hong, X.; Dai, R.; Li, X. Pore Structure Multifractal Characteristics of Coal Reservoirs in the Central and Eastern Qinshui Basin and Influencing Factors. Processes 2023, 11, 286. [Google Scholar] [CrossRef]
  29. Ni, X.; Liu, Z.; Wei, J. Quantitative Evaluation of the Impacts of Drilling Mud on the Damage Degree to the Permeability of Fractures at Different Scales in Coal Reservoirs. Fuel 2019, 236, 382–393. [Google Scholar] [CrossRef]
  30. Jones, S.C. A technique for faster pulse-decay permeability measurements in tight rocks. SPE Form. Eval. 1997, 12, 19–25. [Google Scholar] [CrossRef]
  31. Washburn, E.W. The dynamics of capillary flow. Phys. Rev. 1921, 17, 273. [Google Scholar] [CrossRef]
  32. Groen, J.C.; Pérez-Ramírez, J. Critical appraisal of mesopore characterization by adsorption analysis. Appl. Catal. A Gen. 2004, 268, 121–125. [Google Scholar] [CrossRef]
  33. Bardestani, R.; Patience, G.S.; Kaliaguine, S. Experimental methods in chemical engineering: Specific surface area and pore size distribution measurements—BET, BJH, and DFT. Can. J. Chem. Eng. 2019, 97, 2781–2791. [Google Scholar] [CrossRef]
  34. Geerlings, P.; De Proft, F.; Langenaeker, W. Conceptual density functional theory. Chem. Rev. 2003, 103, 1793–1874. [Google Scholar] [CrossRef]
  35. Balzer, C.; Cimino, R.T.; Gor, G.Y.; Neimark, A.V.; Reichenauer, G. Deformation of microporous carbons during N2, Ar, and CO2 adsorption: Insight from the density functional theory. Langmuir 2016, 32, 8265–8274. [Google Scholar] [CrossRef]
  36. Mandelbrot, B.B. The Fractal Geometry of Nature; WH freeman: New York, NY, USA, 1982; Volume 1. [Google Scholar]
  37. Lu, G.; Wang, J.; Wei, C.; Song, Y.; Yan, G.; Zhang, J.; Chen, G. Pore fractal model applicability and fractal characteristics of seepage and adsorption pores in middle rank tectonic deformed coals from the Huaibei coal field. J. Petrol. Sci. Eng. 2018, 171, 808–817. [Google Scholar] [CrossRef]
  38. Song, W.; Wang, D.; Yao, J.; Li, Y.; Sun, H.; Yang, Y.; Zhang, L. Multiscale image-based fractal characteristic of shale pore structure with implication to accurate prediction of gas permeability. Fuel 2019, 241, 522–532. [Google Scholar] [CrossRef]
  39. Martínez, F.S.J.; Martín, M.A.; Caniego, F.J.; Tuller, M.; Guber, A.; Pachepsky, Y.; García-Gutiérrez, C. Multifractal analysis of discretized X-ray CT images for the characterization of soil macropore structures. Geoderma 2010, 156, 32–42. [Google Scholar] [CrossRef]
  40. Tian, T.; Zhang, D.; Shi, Y.; Quan, F.; Qin, Z. Pore-Fracture System Distribution Heterogeneity by Using the T2 Spectral Curve under a Centrifugal State. Processes 2024, 12, 1812. [Google Scholar] [CrossRef]
Figure 1. Samples and permeability testing apparatus used in this study. (a) Preparation of cylindrical core specimens; (b) schematic of sample dimensions; and (c) PDP-200 pulse decay permeameter.
Processes 13 01927 g001
Figure 2. Correlations between basic reservoir petrophysical parameters and permeability. (a) Ash yield (Ad), (b) volatile matter yield (Vdaf), (c) maximum vitrinite reflectance (Ro,max), and (d) porosity.
Processes 13 01927 g002
Figure 3. Mercury injection curves of selected samples. (a) Tucheng; (b) Laochang.
Processes 13 01927 g003
Figure 4. The pore size distribution characteristics of mercury injection experiments. (a) Tucheng; (b) Laochang.
Processes 13 01927 g004
Figure 5. Liquid nitrogen adsorption/desorption curve of Tucheng coal samples. (a) T1, (b) T2, (c) T3, and (d) T4.
Processes 13 01927 g005
Figure 6. Liquid nitrogen adsorption/desorption curve of Laochang coal samples. (a) L1, (b) L2, (c) L3, and (d) L4.
Processes 13 01927 g006
Figure 7. BJH pore size distribution characteristics from liquid nitrogen adsorption experiments. (a) Tucheng; (b) Laochang.
Processes 13 01927 g007
Figure 8. Carbon dioxide adsorption curves. (a) Tucheng; (b) Laochang.
Processes 13 01927 g008
Figure 9. DFT pore size distribution from carbon dioxide adsorption. (a) Tucheng; (b) Laochang.
Processes 13 01927 g009
Figure 10. Comprehensive characterization of pore size distribution in Tucheng block.
Processes 13 01927 g010
Figure 11. Comprehensive characterization of pore size distribution in Laochang block.
Processes 13 01927 g011
Figure 12. The double-logarithmic relationship between volume increment and injection pressure based on MIP data. (a) Tucheng; (b) Laochang.
Processes 13 01927 g012
Figure 13. Multifractal characteristics. (a) relationship between multifractal dimension and q; (b) relationship between quality function and q; (c) relationship between multifractal spectrum and singular intensity α.
Processes 13 01927 g013
Figure 14. Heatmap of Pearson correlation coefficients.
Processes 13 01927 g014
Table 1. Basic information of collected samples (units: % for proximate and elemental analysis; mD for permeability).
Sample IDProximateElemental AnalysisCoal PetrologyPorosityPermeability
MadAdVdafCdafOdafHdafNdafRo,maxVIE
T11.1413.6229.2485.647.864.731.581.5872.1827.8202.530.44
T21.1418.1719.0588.274.894.550.991.6569.4830.5202.840.65
T31.0010.9120.3673.3818.064.611.541.7169.1730.8301.330.76
T41.569.6134.4786.606.115.281.841.4051.0039.739.273.350.52
L11.2718.239.5291.073.263.621.683.0273.2127.7902.420.46
L21.325.39.5787.950.873.371.672.9571.3228.6803.650.81
L31.936.518.0292.072.423.391.653.3666.0833.9204.010.72
L41.5814.799.8391.153.293.521.623.1267.7632.2403.050.42
Notes: Mad denotes moisture content on an air-dried basis; Ad is the ash yield on a dry basis; Vdaf refers to volatile matter yield on a dry, ash-free basis; Cdaf, Odaf, Hdaf, and Ndaf represent the contents of carbon, oxygen, hydrogen, and nitrogen on a dry, ash-free basis, respectively; Ro,max indicates the maximum vitrinite reflectance, which reflects coal rank and thermal maturity; V, I, and E refer to the proportions of vitrinite, inertinite, and exinite macerals, respectively.
Table 2. List of multifractal parameters of coal samples.
Sample IDD10D−10D0ΔαD1D2D0D2D−10D0D0D10D−10D10
T10.411.971.001.810.760.610.390.970.591.57
T20.571.871.001.550.850.760.240.870.431.31
T30.591.591.001.220.870.780.220.590.411.01
T40.491.901.001.650.800.690.310.900.511.41
L10.471.781.001.530.810.690.310.780.531.31
L20.601.391.000.980.900.820.190.390.400.79
L30.581.671.001.320.870.790.220.670.421.09
L40.582.131.001.820.870.780.221.130.431.55
Table 3. Pearson correlation matrix.
ParameterMadAdVdafCdafOdafHdafNdafRo,maxD10D−10ΔαD1D2D0D2D−10D0D0D10D−10D10PorosityPermeability
Mad1.00−0.44−0.310.65−0.58−0.410.440.580.220.120.060.180.23−0.230.12−0.220.040.80−0.05
Ad−0.441.000.050.120.070.18−0.52−0.20−0.390.620.63−0.41−0.390.390.620.390.63−0.49−0.63
Vdaf−0.310.051.00−0.430.460.960.05−0.92−0.570.330.41−0.69−0.660.660.330.570.42−0.26−0.27
Cdaf0.650.12−0.431.00−0.95−0.530.070.60−0.090.290.28−0.04−0.030.030.290.090.270.77−0.36
Odaf−0.580.070.46−0.951.000.58−0.10−0.61−0.03−0.06−0.05−0.12−0.110.11−0.060.03−0.04−0.840.16
Hdaf−0.410.180.96−0.530.581.00−0.13−0.97−0.460.300.36−0.60−0.550.550.300.460.38−0.40−0.19
Ndaf0.44−0.520.050.07−0.10−0.131.000.28−0.22−0.11−0.05−0.17−0.180.18−0.110.22−0.040.22−0.19
Ro,max0.58−0.20−0.920.60−0.61−0.970.281.000.40−0.21−0.270.510.49−0.49−0.21−0.40−0.280.470.08
D100.22−0.39−0.57−0.09−0.03−0.46−0.220.401.00−0.47−0.630.970.99−0.99−0.47−1.00−0.660.200.72
D−100.120.620.330.29−0.060.30−0.11−0.21−0.471.000.98−0.55−0.510.511.000.470.97−0.07−0.88
Δα0.060.630.410.28−0.050.36−0.05−0.27−0.630.981.00−0.69−0.660.660.980.631.00−0.10−0.93
D10.18−0.41−0.69−0.04−0.12−0.60−0.170.510.97−0.55−0.691.000.99−0.99−0.55−0.97−0.710.210.72
D20.23−0.39−0.66−0.03−0.11−0.55−0.180.490.99−0.51−0.660.991.00−1.00−0.51−0.99−0.690.220.71
D0D2−0.230.390.660.030.110.550.18−0.49−0.990.510.66−0.99−1.001.000.510.990.69−0.22−0.71
D−10D00.120.620.330.29−0.060.30−0.11−0.21−0.471.000.98−0.55−0.510.511.000.470.97−0.07−0.88
D0D10−0.220.390.570.090.030.460.22−0.40−1.000.470.63−0.97−0.990.990.471.000.66−0.20−0.72
D−10D100.040.630.420.27−0.040.38−0.04−0.28−0.660.971.00−0.71−0.690.690.970.661.00−0.11−0.93
Porosity0.80−0.49−0.260.77−0.84−0.400.220.470.20−0.07−0.100.210.22−0.22−0.07−0.20−0.111.000.11
Permeability−0.05−0.63−0.27−0.360.16−0.19−0.190.080.72−0.88−0.930.720.71−0.71−0.88−0.72−0.930.111.00
Disclaimer/Publisher’s Note: The statements, opinions and data contained in all publications are solely those of the individual author(s) and contributor(s) and not of MDPI and/or the editor(s). MDPI and/or the editor(s) disclaim responsibility for any injury to people or property resulting from any ideas, methods, instructions or products referred to in the content.

