Abstract
To explore the influence of guide vanes on the energy loss of hydraulic turbines, a pump characterized by a simple structure and convenient operation was selected as the research subject. Entropy generation theory was utilized to analyze entropy generation losses at different flow rates, with a particular emphasis on the mechanisms in the impeller and draft tube. The findings indicate that turbulent entropy production dominates energy dissipation. Under the best efficiency point (BEP), the total entropy generation loss of Z0 = 11 turbine was 7.18% and 5.76% lower than that of Z0 = 7 and Z0 = 9, respectively. The proportion of entropy generation loss in the impeller was highest under low-flow and optimal operating conditions, while the proportion of entropy generation loss in the draft tube was highest under high-flow conditions. In guide-vane-free turbines, the impeller’s high turbulent entropy generation rate was attributed to vortices and backflow caused by significant velocity gradients. For guide-vane-equipped turbines, high turbulent entropy generation rates arose from rotor–stator interactions and flow separation at blade inlets. Under high-flow-rate conditions, the entropy generation loss in the draft tube was significantly larger than that in other flow components, primarily due to vortices generated by excessive velocity circulation at the impeller outlet near the upstream draft tube flow passages, leading to high turbulent entropy generation rates.
1. Introduction
A Pump as Turbine (PAT) is a common energy recovery device that plays a key role in energy conservation and consumption reduction. These systems have been extensively implemented in industrial processes such as petrochemical hydrocracking and wastewater treatment [1,2,3]. However, the internal flow structure of hydraulic turbines is very complex, and unstable phenomena such as stalling and vortices may occur during operation, which can affect their hydraulic performance. Thus, exploring the inherent flow behaviors and energy dissipation mechanisms inside hydraulic turbines is crucial for performance optimization.
Global researchers have undertaken comprehensive investigations into energy dissipation in internal fluid flows within hydraulic machinery. Using entropy production theory, Fu et al. [4] conducted a detailed investigation into energy transformation and dissipation mechanisms in pump-turbines. Pei and co-researchers [5] assessed the internal energy dissipation in a bidirectional axial-flow tubular pump using numerical simulation results. Their findings indicated that radial clearances between the impeller and guide vanes significantly affect pump operational performance. Turbulence-induced entropy production dissipation constitutes a major component of energy loss, offering a theoretical basis for optimizing low-head pump designs. Li et al. [6] carried out a comprehensive investigation into the performance of pump-turbines, employing wall-function equations to compute hydraulic dissipations in the wall-bounded regions. By deriving the variations in entropy generation, they conducted a detailed analysis of the hysteresis characteristics within the hump region. It was revealed that the hump-zone characteristics and associated hysteresis phenomena stemmed from inlet backflow at the impeller and separation vortices near the hub and shroud within the stationary guide vanes. Chang et al. [7] conducted a systematic investigation into hydraulic dissipations and their spatial distribution in self-priming pumps with varying blade thicknesses. Their analysis revealed that energy losses could be predominantly attributed to turbulent entropy generation and viscous entropy generation mechanisms. Significantly, boundary layer separation was found to not only induce energy dissipation but also obstruct impeller flow passages, thereby reducing the blade’s blockage coefficient. Zhang et al. [8] applied the entropy production methodology to examine hydraulic dissipative processes in centrifugal pumps. Their analysis illustrated that turbulent entropy production and wall-induced entropy production represent the main modes of energy dissipation in such pump systems. Brizuela [9] performed a comprehensive investigation into entropy production distribution within a radial impeller, demonstrating that entropy generation near the front shroud and blade-tip clearances displayed remarkably higher magnitudes, with comparable values observed in both regions. Hou Hucan [10] utilized the entropy production theory to investigate energy dissipation within centrifugal pumps with extremely low specific speeds, discovering that the impeller and volute serve as the primary zones of energy dissipation. Feng et al. [11] studied internal and external characteristics and energy loss during the power-off runaway conditions of centrifugal pumps and found that there is a significant correlation between entropy production and the external performance of centrifugal pumps. The energy loss of other flow components, except for the volute, is caused by turbulent dissipation. Liu et al. [12] investigated the hydraulic dissipations in mixed-flow turbines by applying entropy production theory, revealing that wall-generated entropy production and indirect entropy production played dominant roles. Gong et al. [13] investigated the energy dissipation in a hydro turbine, demonstrating that energy loss within the guide-vane region constituted 25% of the total flow passage dissipation. Over half of the energy dissipation was primarily localized at the leading and trailing edges of impeller blades, further validating the merits of entropy production analysis in identifying the spatial distribution of energy dissipation and loss generation. Altafi and colleagues [14] conducted a comprehensive investigation into the full operational spectrum of radial-flow compressors in turbochargers, spanning from surge to choke conditions. Their findings revealed that under design conditions, total entropy generation within the impeller domain primarily originates from the blade’s surface boundary layer friction and blade-tip clearance leakage flow. Meanwhile, entropy generation in the diffuser and volute is predominantly induced by turbulent mixing during fluid diffusion processes. Dennis and co-researchers [15] employed multi-objective optimization algorithms for the design of turbine blades, validating the optimization performance via numerical modeling. Entropy generation analysis indicates that mixing losses at a blade’s trailing edge represent the primary contributor to entropy generation, which can be effectively mitigated by modifying the thickness and curvature of the blade’s trailing edge. Iandoli et al. [16] theoretically derived a calculation method for entropy production in turbomachinery flow channels and verified the application of local entropy production analysis on optimization design through case studies. Research has found that the distribution of local entropy production can directly reflect the source of flow irreversibility and, by adjusting the blade’s load distribution, total entropy generation may decrease.
The aforementioned studies demonstrate that entropy production theory serves as a robust methodology for analyzing energy loss mechanisms in fluid machinery, thereby intuitively uncovering the spatial distribution of energy losses within such systems. Consequently, this study integrates entropy production theory to explore the energy dissipation mechanisms of flow components in turbines, clarifies the relationship between the spatial distribution of high entropy production zones and turbine flow instabilities, and provides a theoretical foundation and optimization guidance for hydraulic turbine design. This study starts from the application background of hydraulic turbine engineering and describes the necessity of studying the entropy generation loss of hydraulic turbines. A complete numerical analysis framework was established that included the theoretical basis of entropy generation, geometric modeling methods, grid partitioning techniques, numerical calculation parameter settings, and experimental verification processes. Subsequently, the energy loss characteristics of impellers, volutes, guide vanes, and draft tubes under different operating conditions were analyzed from the dual dimensions of entropy generation loss types and entropy generation loss of flow components. A systematic investigation was conducted on turbulent and wall-induced entropy production in impellers and draft tubes. Eventually, a series of conclusions regarding energy dissipation characteristics in hydraulic turbines were derived using entropy production theory.
2. Numerical Methodology
2.1. Entropy Generation Theory
Entropy is a physical quantity that measures the degree of chaos or energy unavailability in a system. There are two main aspects of energy dissipation caused by irreversible factors. On the one hand, due to the viscous force and internal friction effect of the fluid, some kinetic and pressure energies are irreversibly transformed into internal energy, leading to entropy generation. On the other hand, vortices and pulsations in fluid flow can cause additional energy dissipation, resulting in the elevation of entropy production [17]. Owing to water’s high specific heat capacity, and assuming isothermal conditions, entropy generation arising from heat transfer is neglected.
The direct dissipation entropy generation rate (EGR) is caused by the non-uniformity of the pulsating velocity field in the flow field, and the turbulent dissipation EGR is caused by the inhomogeneity of fluctuating velocity components in the flow. Their mathematical formulations are expressed as follows [18,19]:
In the formula, denotes dynamic viscosity, Pa·s; , , and represent the components of the time-averaged velocity, m/s; , , and signify the components of the pulsating velocity, m/s; and stands for temperature, K.
Among them, can be obtained through numerical calculations, while cannot be directly obtained due to the turbulent velocity field. References [20,21] found that the turbulent EGR is related to ε or ω, and the turbulent EGR of the Shear Stress Transport (SST) k-ω model is represented by the following equation:
In the formula, β denotes an empirical constant with a value of 0.09; ρ represents the density, kg/m3; ω signifies the turbulent vortex frequency, s−1; and k stands for the turbulent kinetic energy, m2/s2.
Previous studies have overlooked the influence of the velocity gradient in the near-wall region on wall EGRs, resulting in significant errors in the calculated hydraulic losses [22]. The formula for calculating a wall EGR is as follows [23]:
where denotes the wall shear stress, Pa, and represents the velocity of the first-layer grid node near the wall, m/s.
Integrating the EGR per unit fluid volume and unit area yields direct entropy generation, turbulent entropy generation, and wall entropy generation, which are expressed as follows:
In the formula, V denotes the volume of fluid, m3, and A represents the wall area, m2.
2.2. Geometric Model
This study investigated a single-stage single-suction centrifugal pump operated in reverse as a turbine (PAT) as the primary research subject. The operational design specifications for the pump’s working condition are as follows: flow rate Q = 170 m3/h, head H = 32.5 m, rotational speed n = 1450 r/min, and specific speed ns = 84.5. Guide vanes were added to the hydraulic turbine on this basis. The detailed geometric specifications are tabulated in Table 1 and visualized in Figure 1, with the hydraulic turbine’s 3D model illustrated in Figure 2.

Table 1.
Main geometric parameters of the hydraulic turbine.
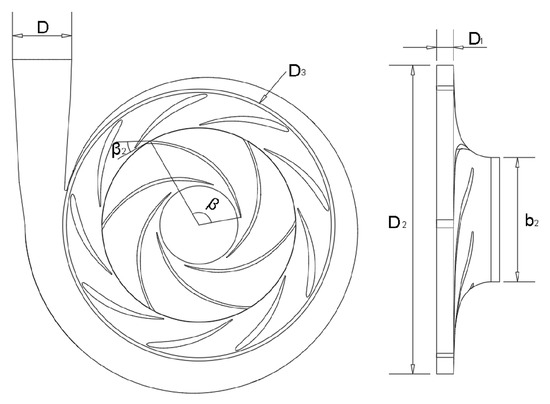
Figure 1.
Hydraulic design diagram of a hydraulic turbine.
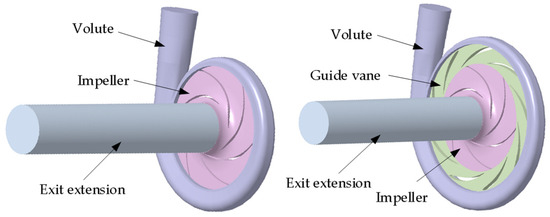
Figure 2.
Three-dimensional model of the hydraulic turbine.
2.3. Mesh Generation
Hexahedral-structured mesh partitioning was performed on the impeller, volute, guide vanes, and exit extension using ICEM CFD 2022 R1; meanwhile, boundary layer meshing was implemented for the wall-adjacent regions of these four areas. The first-layer boundary mesh height was set at 0.005 mm, with a mesh growth rate of 1.2, resulting in a total of 20 layers of mesh, as shown in Figure 3. The y+ values for the SST k-ω turbulence model are shown in Table 2, and it can be seen that the y+ values were all less than 30. Therefore, this grid could perfectly capture the energy loss in the near-wall region [24,25]. In order to mitigate the impact of mesh density on the simulation outcomes, a mesh independence study was conducted for the original turbine model. The hydraulic turbine efficiency under optimal operating conditions served as the criterion, as shown in Figure 4. The results indicated that hydraulic turbine efficiency gradually stabilized as the mesh quantity increased. When the mesh number was approximately 3.31 million, the change in hydraulic efficiency was less than 0.2%. Finally, the mesh number selected for the original turbine model was 3.31 million, and the mesh number of the turbine model incorporating guide vanes was controlled to be around 4.2 million.
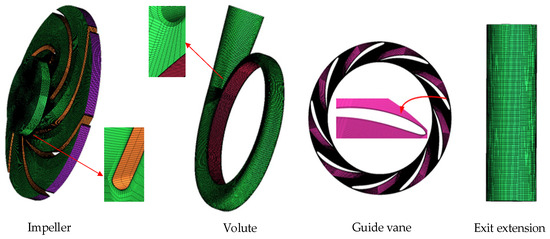
Figure 3.
Computational domain mesh.
Table 2.
Average y+ value of each flow component.
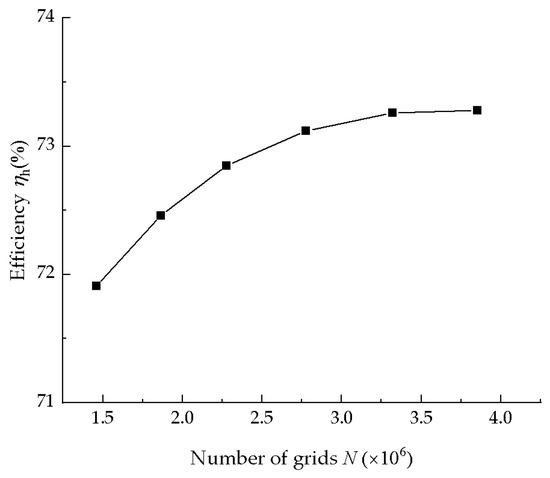
Figure 4.
Mesh independence verification.
2.4. Numerical Setup
A numerical simulation of the internal flow field in the hydraulic turbine was carried out using ANSYS Fluent 2022 R1. The SST k-ω turbulence model and the SIMPLEC algorithm were selected. The boundary conditions were set as a velocity inlet and a pressure outlet. The impeller was defined as a rotating domain, whereas the remaining computational regions were all stationary domains. Data exchange between the rotating and stationary domains was realized via the interface. No-slip wall boundary conditions were imposed on the walls, with the convergence accuracy specified as 10−6.
2.5. Experimental Validation
We performed numerical calculations on the external characteristics of the Z0 = 0 and Z0 = 9 guide-vane models, and conducted external characteristic experiments on the Z0 = 0 model. Then, a comparison was conducted between the numerical predictions and the experimental measurements of the Z0 = 0 model’s performance, as depicted in Figure 5. The analysis indicated that the numerical prediction curves exhibited a trend in agreement with the experimental counterparts, with the numerical prediction efficiency exceeding the experimental results. This discrepancy arose because the numerical simulations neglected leakage and mechanical losses, which are inherent in physical experiments. After adding guide vanes, the highest efficiency point shifted towards the high-flow condition. Under the optimal condition, the efficiency of the Z0 = 9 model was higher than that of the Z0 = 0 model, and the hydraulic head of the Z0 = 9 model was significantly lower than that of the Z0 = 0 model; As the flow rate increased, the efficiency of the Z0 = 0 model exhibited an initial increase followed by a subsequent decrease, while the efficiency of the Z0 = 9 model first increased to its peak and then slowly decreased. The hydraulic head of both the Z0 = 0 and Z0 = 9 models gradually increased. At the optimal operating point, the relative error of the efficiency and hydraulic head of the Z0 = 0 model was less than 5%, and the error was within a reasonable range [26]. Thus, the numerical modeling approach employed in this study was validated to be effective.
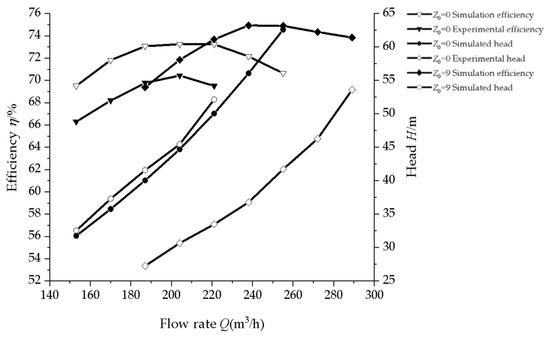
Figure 5.
Comparison of numerical and experimental performance characteristics.
3. Analysis of Entropy Generation Loss
3.1. Entropy Generation Losses of Different Types in a Hydraulic Turbine
Figure 6 shows the variations in the entropy generation losses of hydraulic turbines with different numbers of guide vanes under various operating conditions. As the flow rate increased, turbulent entropy production losses in turbines with varying quantities of guide vanes demonstrated a continuous upward trend, while the wall entropy generation losses changed very little and the direct entropy generation losses were almost zero. This indicated that the impact of the flow rate on entropy generation losses was mainly caused by turbulent entropy generation. Due to the addition of guide vanes, the size of the volute changed and the optimal operating point of the turbine shifted towards higher flow rates. Therefore, even if the turbulent entropy generation loss of the hydraulic turbine was not significantly different after the addition of guide vanes, it was still greater than that of the model without guide vanes. As the flow rate increased, the velocity pulsation became more intense, resulting in a continuous increase in turbulent entropy generation loss and a slow increase in wall entropy generation. After adding guide vanes, wall entropy generation loss discrepancies in the hydraulic turbine were also minimal, suggesting that an augmented flow rate induced an elevation in the wall velocity gradient. The momentum exchange between different velocity layers intensified, resulting in an increase in the shear stress and, consequently, the wall entropy generation losses increased. Through a loss proportion analysis, the findings revealed that the share of turbulent entropy production losses exhibited a gradual upward trend. For the Z0 = 0 turbine, it increased from 70% at 0.67 QBEP to 91% at 1.33 QBEP, while for the hydraulic turbine after adding guide vanes, it increased from approximately 74% to 94%. Although the wall entropy generation losses increased slowly, their proportion in the total entropy generation losses continued to decrease. For the Z0 = 0 turbine, it decreased from 30% at 0.67 QBEP to 9% at 1.33 QBEP, and for the hydraulic turbine after adding guide vanes, it decreased from about 26% to 6%. Thus, the hydraulic turbine’s energy loss was predominantly attributed to the combined effect of turbulent entropy production induced by unsteady flow and entropy production due to wall friction. At the optimal operation state, the turbine’s energy loss for the Z0 = 0 configuration was 53.08%, 52.36%, and 49.74% lower than the Z0 = 7, Z0 = 9, and Z0 = 11 turbines, respectively.
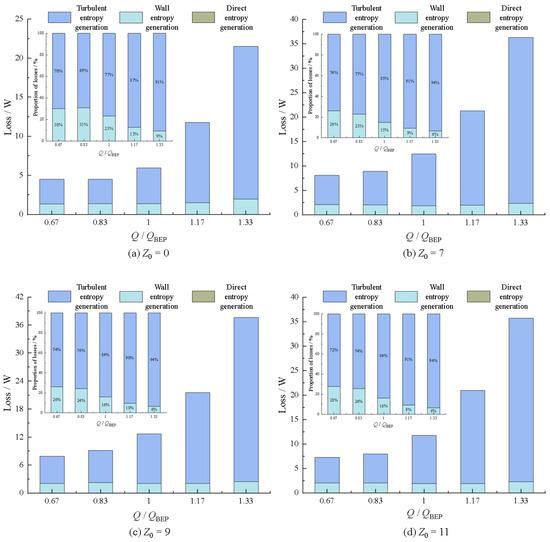
Figure 6.
Entropy generation losses of different types and their proportions.
3.2. Entropy Generation Losses of Different Flow Components in a Hydraulic Turbine
Figure 7 shows the variation diagrams of entropy generation losses for the flow components of the hydraulic turbine with different numbers of guide vanes under various operating conditions. Across diverse operational conditions, flow component entropy generation losses in turbine configurations without guide vanes demonstrated lower magnitudes than in models incorporating guide vanes. The entropy generation losses of each flow component increased with an increase in flow rate. When Q < 1.0 QBEP, the entropy generation losses followed the order from largest to smallest of impeller, volute, and draft tube. When Q > 1.0 QBEP, the draft tube exhibited the largest entropy generation loss followed by the impeller, with the volute showing the smallest loss. Regarding the turbine configuration incorporating guide vanes, losses within the volute, guide vanes, and draft tube showed a positive correlation with the flow rate. The impeller’s entropy production loss exhibited an initial decrease followed by a subsequent increase. When Q < 1.0 QBEP, the order of entropy generation losses from high to low was impeller > volute > guide vanes > draft tube. When Q > 1.0 QBEP, the order became draft tube > volute > impeller > guide vanes. Among them, the entropy generation loss of the draft tube increased most significantly. For Z0 = 0, it increased from 0.82 W at 0.67 QBEP to 11.68 W at 1.33 QBEP, and the proportion of the loss increased from 18.26% to 54.33%. For Z0 = 7, it increased from 0.55 W to 19.45 W, and the proportion of the loss increased from 6.81% to 52.68%. For Z0 = 9, it increased from 0.6 W to 20.1 W, and the proportion of the loss increased from 7.58% to 53.56%. For Z0 = 11, it increased from 0.41 W to 19.76 W, and the proportion of the loss increased from 5.63% to 55.33%. Under the optimal operating condition, the entropy generation losses of the flow components in the turbine without guide vanes followed the order from largest to smallest of impeller, volute, and draft tube. For the turbine with guide vanes, the entropy generation losses of the flow components were ordered as impeller > draft tube > volute > guide vanes. The proportions of entropy generation losses for the impellers of the Z0 = 0, Z0 = 7, Z0 = 9, and Z0 = 11 turbines were 49.24%, 30.52%, 32.79%, and 32.31%, respectively. After adding guide vanes, entropy production losses within the volute and draft tube components of the hydraulic turbine exhibited a gradual decline as the guide vane count increased. Based on the preceding analysis, it was evident that impeller entropy production losses represented a substantial portion of the total hydraulic turbine entropy production losses across various flow rates. Additionally, draft tube entropy production losses demonstrated the most pronounced variation with fluctuations in the flow rate. Consequently, the subsequent section is dedicated to analyzing the entropy generation loss mechanisms of the impeller and draft tube.
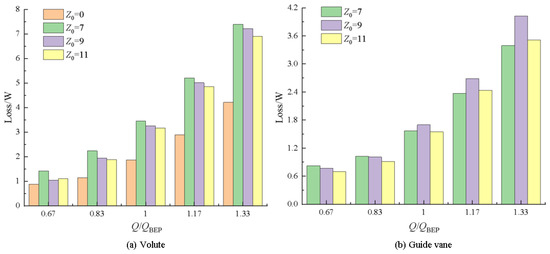
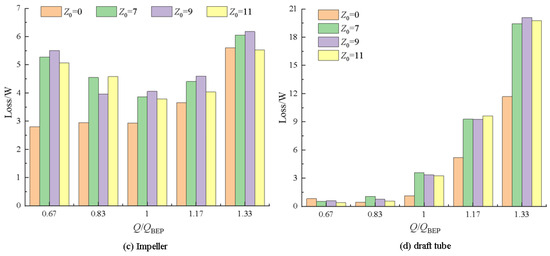
Figure 7.
Entropy generation losses of various flow components under different flow rates.
4. Analysis of Impeller Entropy Generation Rates
As a hydraulic turbine’s core flow component, the impeller significantly influences its operational performance. From the previous analysis, under the optimal operating condition, the impeller exhibited the greatest entropy production loss among all flow components for both the guide-vane-free turbine and the turbine models with guide vanes. Therefore, a mid-section of the impeller was selected for a detailed analysis.
4.1. Turbulent Entropy Generation Rates in the Impeller
Figure 8 shows the distribution map of turbulent entropy generation rates in the impeller mid-section of hydraulic turbines with different numbers of guide vanes under various operating conditions. At low-flow-rate operation, the Z0 = 0 model exhibited an extremely low entropy generation rate across the entire flow field, with energy loss reaching its minimum. Spot-like zones exhibiting relatively elevated turbulent entropy generation rates were present at the blade’s trailing edges, suggesting that energy dissipation in the impeller was localized at these trailing edge regions. This occurred due to the presence of a wake flow effect at the trailing edges of the blades. In the impellers of turbine configurations with guide vanes, the turbulent entropy generation rate was chaotically distributed. For the Z0 = 7 turbine, the entropy generation rate remained relatively high across the blade’s pressure surface. In the Z0 = 9 model, zones with high entropy production notably expanded, primarily spanning impeller flow passages and the junction between the guide vanes and the impeller. In the Z0 = 11 model, the high entropy production regions shrunk, predominantly manifesting on the pressure surfaces of neighboring blades and at the impeller inlet. This suggested that impeller energy losses in turbine configurations with guide vanes were predominantly localized at the blades and impeller inlet. Under the optimal operating condition, the entropy generation rates of the four models decreased, to varying degrees. In particular, the regions with high entropy generation rates in the Z0 = 9 and Z0 = 11 models were significantly reduced, and these high entropy generation rate regions were all located near the pressure surface of the blade’s leading edge. Under this condition, the energy losses of the four models were all lower than those under off-design conditions. Under high-flow-rate conditions, the entropy generation rate of the Z0 = 0 model increased somewhat, mainly near the blade’s suction surface. The distribution of entropy generation rates in the turbine models with guide vanes was similar to that under the optimal operating condition. It could be seen that the guide-vane-free turbine model exhibited lower energy losses under low-flow-rate conditions, while the turbine models with guide vanes showed higher energy losses under low-flow-rate conditions compared with the other operating conditions. Figure 9 shows the distribution maps of turbulent kinetic energy in the impeller mid-section, and Figure 10 shows the distribution maps of turbulent vortex frequency in the impeller mid-section. As per the calculation formula for the turbulent entropy generation rate, this rate showed a direct proportionality to both the turbulent kinetic energy and turbulent vortex frequency. It can be observed that in regions B1 and B3 of the turbulent entropy generation rate map, the corresponding regions in the turbulent kinetic energy map exhibit higher intensity. This suggests that an elevation in turbulent kinetic energy induces non-uniform pulsating velocity distributions, resulting in elevated turbulent entropy generation rates.
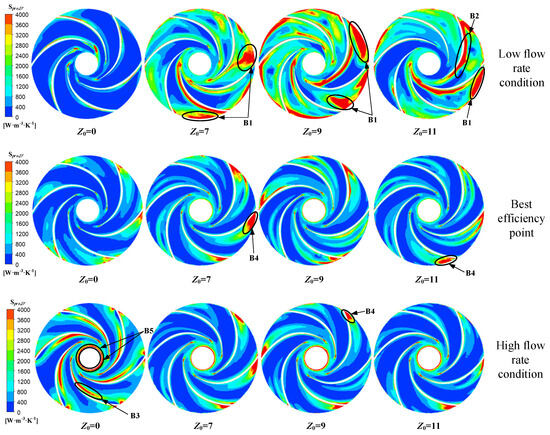
Figure 8.
Distribution of turbulent entropy generation rates in the impeller mid−section.
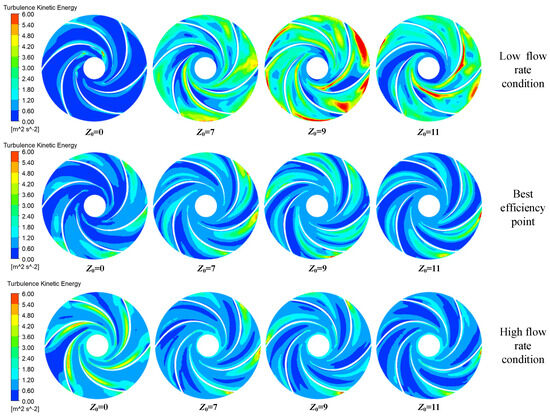
Figure 9.
Distribution of turbulent kinetic energy in the impeller mid−section.
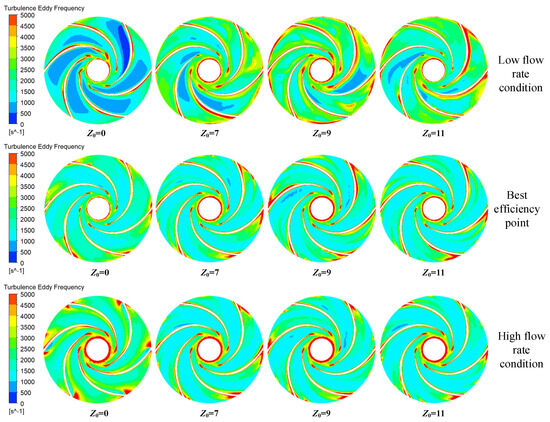
Figure 10.
Distribution of turbulent vortex frequency in the impeller mid−section.
Region B1 was located near the impeller inlet and was particularly evident under low-flow-rate conditions. This occurred because, under these operational conditions, the relative flow angle remained smaller than the blade’s inlet setting angle, thereby triggering the formation of a negative incidence angle at the blade inlet. At this point, the liquid flow impinged on the pressure surface of the blade, causing an increase in pressure in the vicinity, while the fluid struggled to flow smoothly along the blade’s surface, thereby inducing flow separation in the vicinity of the blade’s pressure surface. From the velocity streamline distribution in the impeller mid-section shown in Figure 11, it can be seen that backflow and vortices formed in the vicinity of local regions, increasing the complexity of the flow and energy losses. Meanwhile, the rotor–stator interaction between the impeller and guide vanes generated periodic pressure pulsations and velocity fluctuations near the interface, enhancing the turbulent intensity of the flow field. Additionally, the upstream region corresponded with the guide-vane flow domain, where the flow state of the fluid at the trailing edge of the guide vanes underwent significant changes, forming wake flows that caused the flow to become more disordered and increased the turbulence intensity. Consequently, turbulent kinetic energy increased in this area. Affected by this, when the fluid flowed from the wake region into this area, high entropy generation regions emerged.
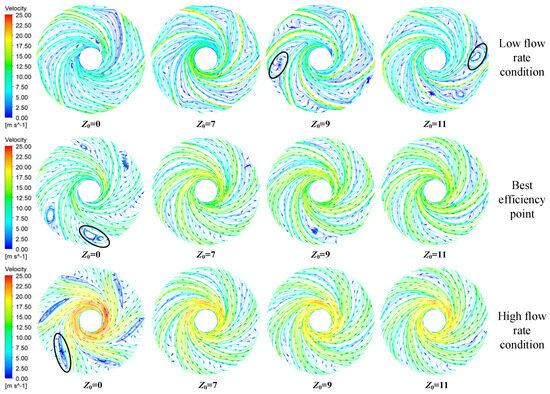
Figure 11.
Distribution of velocity streamlines in the impeller mid−section.
Region B2 was located on the blade’s pressure surface side. Under low-flow-rate conditions, the insufficient flow rate entering the flow passage led to a reduced incidence angle at the leading edge of the blade. As observed from the velocity streamline diagram, flow separation occurred near the blade’s pressure surface, forming vortices that affected the overall stability of the flow field. This altered the distribution and intensity of pulsating velocities, leading to an increase in the turbulent entropy generation rate on the blade’s pressure surface. As the flow rate increased, the velocity streamline distribution became more uniform, the flow separation phenomenon was mitigated, and the flow regime stabilized, resulting in a significant reduction in the turbulent entropy generation rate in this region.
Region B3 was located in the mid-rear portion of the blade’s suction surface side of the impeller. As the low-pressure side of the blade, the suction surface was influenced by a significant pressure gradient, particularly in its mid-rear region. During fluid flow along the blade’s suction surface, the near-wall fluid velocity gradually decreased owing to viscous effects, whereas the mainstream velocity remained comparatively high. This generated a significant velocity gradient in the boundary layer. When the adverse pressure gradient became sufficiently large, the kinetic energy of the fluid within the boundary layer was insufficient to overcome the adverse pressure gradient and continued to flow forward, leading to boundary layer separation. As observed from the velocity streamline diagram, vortices and backflow occurred in this area, causing flow disorder and intensified energy dissipation, which increased the turbulent entropy generation rate.
Region B4 was located at the pressure surface of the blade’s leading edge. When fluid passed through the guide vanes and entered the impeller, the incoming flow directly impinged upon the pressure surface of the blade’s leading edge. The fluid in this region exhibited strong disordered characteristics during flow, leading to the occurrence of flow separation, which resulted in a highly disordered flow regime. This caused a significant non-uniformity in the velocity distribution and a continuous increase in the turbulent entropy generation rate in this region. Additionally, flow separation in this area induced turbulence, significantly increasing the turbulent vortex frequency. As the flow rate increased, the incoming flow velocity rose, intensifying the impact of the fluid on the pressure surface of the blade’s leading edge and further exacerbating energy dissipation, thus sustaining the turbulent entropy generation rate within region B4 at a relatively elevated level.
Region B5 lay at the junction of the impeller outlet and the draft tube. When the fluid flowed out of the impeller and was about to enter the draft tube, the flow space expanded. A low-pressure backflow zone formed between the main flow and the wall, forcing the main flow to contract towards the center. This led to a drastic change in the fluid velocity distribution, creating a large velocity gradient and shear stress and increasing the turbulent dissipation. Moreover, the fluid at the impeller outlet had a certain tangential velocity and axial velocity. At the junction, the fluids interfered with and collided against each other, further intensifying the turbulence and thus generating a high turbulent entropy generation rate.
4.2. Impeller Wall Entropy Generation Rates
Figure 12 is a distribution map of the entropy generation rates on the impeller wall surface of a hydraulic turbine with different numbers of guide vanes. The observations indicated that at low-flow-rate operation, the elevated entropy generation rate on the blade wall surface was particularly pronounced. The high entropy production zone predominantly localized at the blade-leading-edge’s pressure surface. Meanwhile, for the turbine model with guide vanes, the entropy generation rate was relatively high near the inlet of the flow passage on the front and rear shrouds. This was because the fluid at a certain velocity impacted the blade, and there was relative motion between the fluid and the blade wall surface. Owing to the fluid’s viscous effect, a boundary layer developed adjacent to the wall surface, thereby leading to an elevated entropy generation rate at the blade wall. Overall, the four hydraulic turbine models showed relatively minimal discrepancies in both the magnitude and spatial distribution of entropy generation rates. At the optimal flow rate, the wall entropy generation rate of the guide-vane-free turbine model was notably lower when compared with that of the turbine model equipped with guide vanes. The spatial distribution of the impeller wall entropy generation rate in the guide-vane-equipped turbine model exhibited consistency. Nonetheless, their magnitudes were reduced compared with the low-flow-rate condition. Under high-flow-rate conditions, the guide-vane-free turbine model exhibited higher wall entropy generation rates near the blade’s trailing edge and at locations where the front and rear shrouds adjoined the blade’s suction surface. In the guide-vane-equipped turbine model, high entropy generation regions were concentrated near the flow passage inlet on the front and rear shrouds. This stemmed from the facts that the elevated flow rate augmented the viscous shear stress at the fluid–wall interface and strong rotor–stator interactions occurred in the junction region between the impeller and guide vanes, thereby leading to increased wall entropy generation losses.
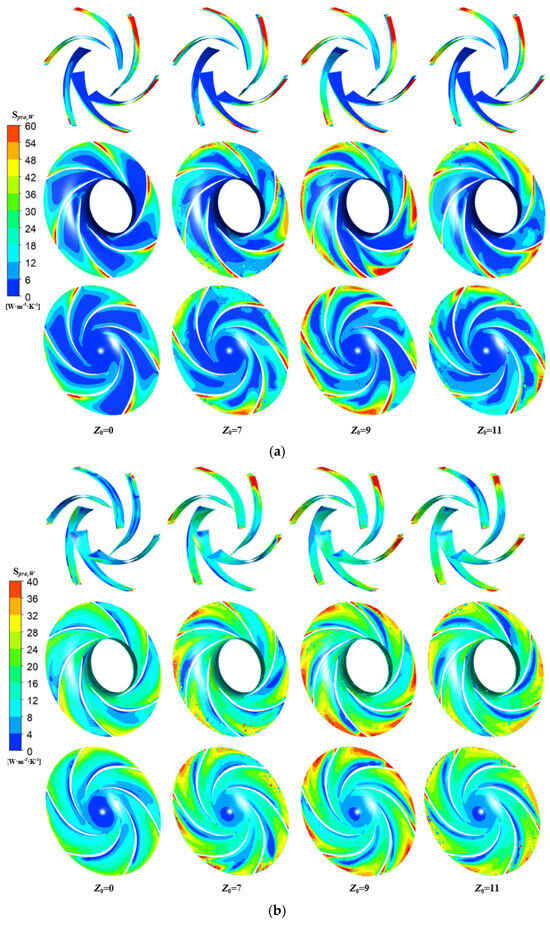
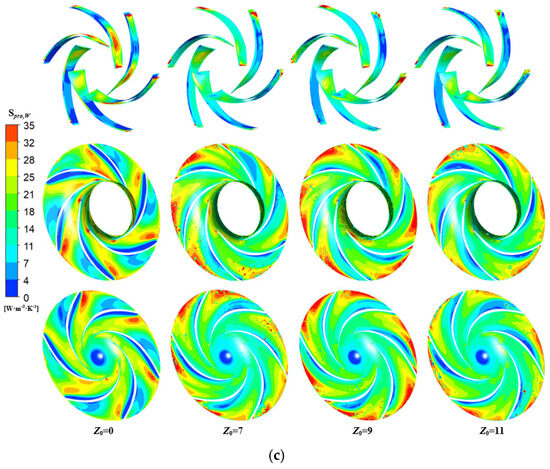
Figure 12.
Distribution of entropy generation rates on the impeller wall. (a) Low−flow−rate condition, (b) best efficiency point, and (c) high−flow−rate condition.
5. Analysis of Entropy Generation Rates in a Draft Tube
Based on the previous analysis, during high-flow-rate operation, the entropy production loss within the draft tube emerged as the dominant component of the total energy loss in the hydraulic turbine. Therefore, the mid-section plane of the draft tube was selected for investigation.
5.1. Turbulent Entropy Generation Rates in a Draft Tube
Figure 13 and Figure 14 show the distribution of turbulent entropy generation rates and the turbulent kinetic energy in the draft tube under different numbers of guide vanes. During low-flow-rate operation, the entropy generation rates in the draft tube of hydraulic turbines with varying numbers of guide vanes were negligibly low. For the optimal operating condition, narrow strip-shaped regions with relatively high entropy generation rates appeared in the mid-channel of the upstream draft tube for the guide-vane-equipped turbine models, with minor differences in both the magnitude and spatial distribution of the entropy generation rates. Under high-flow-rate conditions, the area of high entropy generation regions expanded, particularly showing the most significant changes for the Z0 = 0 turbine. The high entropy generation regions were located near the mid-channel of the upstream draft tube, while conical low entropy generation regions emerged in the mid-channel of the draft tube outlet section, with patchy high entropy generation regions appearing on both sides of these conical regions. The Z0 = 0 turbine exhibited a larger area of high entropy generation rates, while the guide-vane-equipped turbine models featured smaller high entropy generation regions. A low entropy generation region appeared in the mid-channel of the downstream draft tube, and this region gradually decreased as the number of guide vanes increased. Under high-flow-rate conditions, when the fluid discharged from the impeller entered the draft tube, a significant velocity circulation increased the turbulent kinetic energy at the draft tube inlet and induced vortices, leading to a substantial increase in the turbulent entropy generation rate in this region. It can be observed from the velocity streamline distribution in Figure 15 that under low-flow-rate conditions, the streamline distributions of the four models were relatively uniform, with stable flow characteristics. As the flow rate increased, the flow field became increasingly complex, exhibiting large-scale backflow and vortices, which were more pronounced near the draft tube inlet and at the outlet.
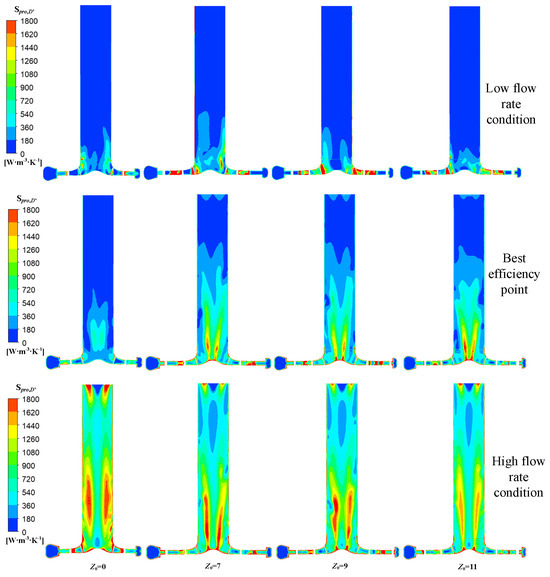
Figure 13.
Distribution of turbulent entropy generation rates in the draft tube.
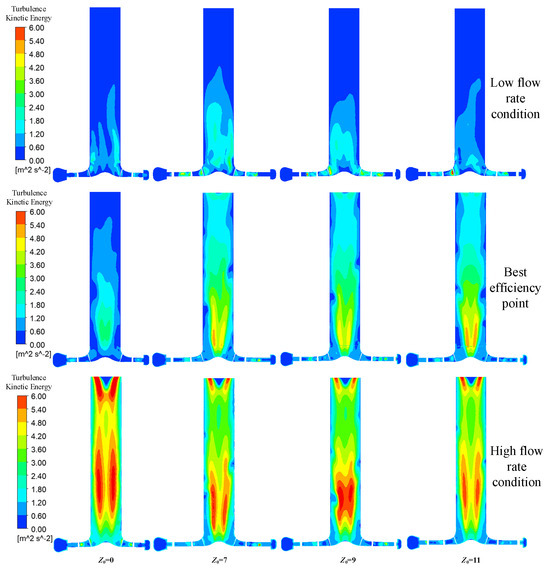
Figure 14.
Distribution of turbulent kinetic energy in the draft tube.
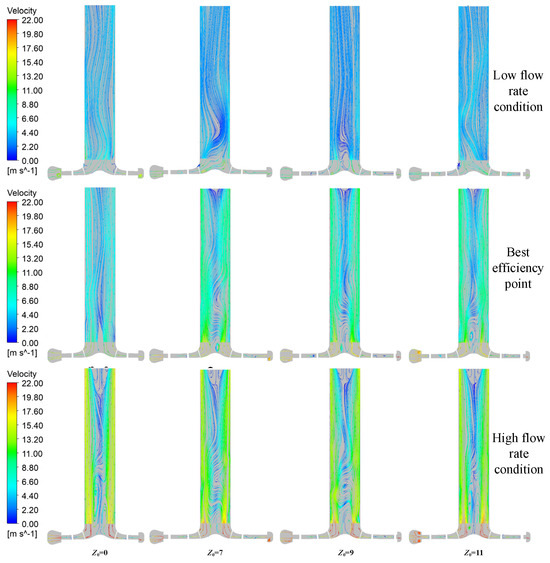
Figure 15.
Velocity streamline distribution in the draft tube.
5.2. Entropy Generation Rates in a Draft Tube Wall
Figure 16 depicts the wall entropy generation rates distributed within the draft tubes of hydraulic turbines featuring varying numbers of guide vanes. With the gradual increase in flow rate, the wall entropy generation rate within the draft tube of the four turbine models also demonstrated a continuous upward trend. This stemmed from the fact that during low-flow-rate operation, the fluid velocity remained comparatively low, giving rise to a diminished shear interaction with the wall surface. This mechanism kept the entropy generation rate at the wall at a reduced level. As the flow rate increased, the fluid velocity progressively rose, exacerbating the viscous shear effect and thereby enhancing frictional dissipation. This led to an elevated wall entropy generation rate and further intensified the energy loss. In the guide-vane-equipped turbine models, the high entropy generation regions on the draft tube wall surface gradually shifted from the inlet wall to the outlet wall, with a relatively high entropy generation rate emerging in the mid-wall region of the draft tube. Under the same operating conditions, these models exhibited similar distributions of wall entropy generation rates. For the Z0 = 0 turbine, the wall entropy generation rate exhibited a notably lower magnitude than guide-vane-equipped turbine models during low-flow-rate and optimal-flow-rate operations. However, it became slightly higher under high-flow-rate conditions, accompanied by a rapid rise in the entropy generation rate at the outlet wall of the draft tube. This was due to the enhanced frictional dissipation caused by backflow near the wall surface under the action of viscous shear, leading to a higher wall entropy generation rate.
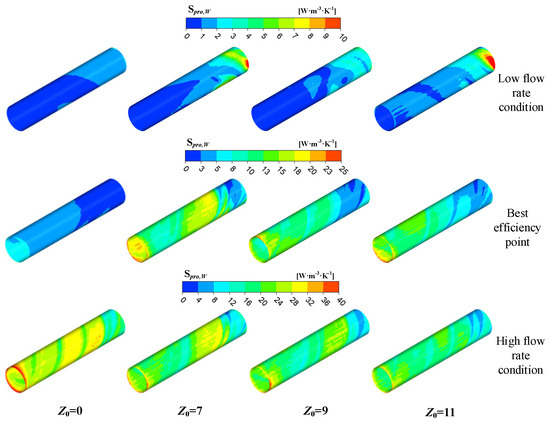
Figure 16.
Distribution of entropy generation rates on the draft tube wall.
6. Conclusions
- (1)
- For hydraulic turbines with different numbers of guide vanes, turbulent entropy generation was the main entropy generation loss, followed by wall entropy generation. The average proportion of turbulent entropy generation loss in guide-vane-free hydraulic turbines was 78.6%, while after adding guide vanes, the average proportion of turbulent entropy generation loss in hydraulic turbines was around 83%, indicating that turbulent fluctuations were the main cause of energy loss. Under optimal operating conditions, the proportions of impeller entropy generation loss in the Z0 = 0, Z0 = 7, Z0 = 9, and Z0 = 11 turbines were 49.24%, 30.52%, 32.79%, and 32.31%, respectively. The total entropy generation loss of the hydraulic turbine with added guide vanes gradually decreased as the number of guide vanes increased.
- (2)
- Under optimal operating conditions, the impeller entropy generation losses in the Z0 = 7, Z0 = 9, and Z0 = 11 turbines were 32.08%, 48.81%, and 29.35% higher, respectively, than in the Z0 = 0 turbine. In guide-vane-free turbines, the high turbulent entropy generation rate region in the impeller was relatively large under high-flow-rate conditions and was located on the suction side of the blades, where significant velocity gradients induced vortices and backflow. For guide-vane-equipped turbines, the turbulent entropy generation rate was higher under low-flow-rate conditions, primarily occurring at the impeller passage inlets and the pressure sides of the blades. This was attributed to rotor–stator interactions and the influence of the guide-vane wake flow as well as flow separation caused by negative incidence angles at the blade inlets, which increased turbulence intensity.
- (3)
- When the flow rate exceeded the optimal operating condition, the entropy generation loss in the draft tube increased more significantly. Under optimal conditions, the draft tube entropy generation loss of the Z0 = 7 turbine was 6.84% and 10.12% greater than the Z0 = 9 and Z0 = 11 turbines, respectively. The draft tube entropy generation rate was higher under high-flow-rate conditions, with the region of the high turbulent entropy generation rate located near the middle flow passage in the upstream of the draft tube. This was due to strong velocity fluctuations and the formation of vortices under such conditions, which led to higher turbulent kinetic energy.
This study indicates that the number of guide vanes has a significant impact on the distribution of entropy production. In the future, we will further explore the synergistic effects of parameters such as the number of guide vanes, blade angle, volute throat area, and cutwater radius while optimizing various parameters to reduce entropy production and improve efficiency. In addition, a parameter prediction model based on machine learning could be used to establish a mapping relationship between the number of guide vanes, flow rate, speed, and entropy production, achieving rapid prediction and real-time optimization and providing decision-making support for industrial design. In addition, the medium of this study was clean water, and the problem of multi-physics field-coupling is more in line with reality. For example, the phenomenon of cavitation has a significant impact on energy loss under high-speed or low-pressure conditions. In the future, a cavitation model could be introduced to analyze the entropy production distribution in the cavitation area by combining entropy production theory to study the correlation between turbulent dissipation and entropy production during the collapse of cavitation bubbles. Under high-load operation, the deformation of the impeller and the increase in temperature may alter the flow field characteristics. The conjugate heat transfer model could be used to analyze the effect of the temperature gradient on entropy production.
Author Contributions
Conceptualization, F.S. and D.Z.; methodology, D.Z.; software, D.Z.; validation, D.Z., P.W. and C.F.; formal analysis, X.W.; investigation, C.F.; resources, P.W.; data curation, P.W.; writing—original draft preparation, D.Z.; writing—review and editing, D.Z.; visualization, X.W.; supervision, X.W.; project administration, F.S.; funding acquisition, F.S. All authors have read and agreed to the published version of the manuscript.
Funding
The authors would like to thank the Key Research and Development Program of Gansu Province-Industrial Project (No. 25YFGA021); the Innovation Fund for College Teachers of Department Education of Gansu (No. 2024A-021); the Key Laboratory of Fluid and Power Machinery, Ministry of Education, Xihua University (Grant No. szjj2019-016, LTDL2020-007); and the National Natural Science Foundation of China (No. 52469018) for their support.
Data Availability Statement
The study’s primary and supporting data are embedded within the manuscript’s main text and figures.
Acknowledgments
The authors would like to thank all the researchers who participated in this study and the college for providing all the technical support.
Conflicts of Interest
No potential conflicts of interest relevant to this study were reported by the authors.
Abbreviations
The following abbreviations are used in this manuscript:
| BEP | Best Efficiency Point |
| PAT | Pump as Turbine |
| EGR | Entropy Generation Rate |
| SST | Shear Stress Transport |
References
- Diao, W.S. Study on Application Feasibility of Hydraulic Turbine in High-Pressure Hydrotreating Unit. Pet. Refin. Eng. 2008, 38, 33–35. [Google Scholar]
- Zheng, Z.; Wang, S.L.; Wang, T.; Song, Q.; Xie, L. Present Status and Prospect of Fluid Pressure Energy Recovery in Natural Gas Transmission and Distribution. Nat. Gas Oil. 2009, 27, 11–15. [Google Scholar]
- Shi, F.; Zong, X.; Zhao, G.; Zhang, D.; Wang, P.; Zhan, H. Study on the Influence of Split Blades on the Force Characteristics and Fluid–Structure Coupling Characteristics of Pumps as Turbines. Energies 2025, 18, 1642. [Google Scholar] [CrossRef]
- Fu, X.; Li, D.; Wang, H.; Zhang, G.; Li, Z.; Wei, X.; Qin, D. Energy Analysis in a Pump-Turbine During the Load Rejection Process. J. Fluids Eng. 2018, 140, 101107. [Google Scholar] [CrossRef]
- Pei, J.; Meng, F.; Li, Y.J.; Yuan, S.Q.; Chen, J. Effects of Distance Between Impeller and Guide Vane on Losses in a Low Head Pump by Entropy Production Analysis. Adv. Mech. Eng. 2016, 8, 1687814016679568. [Google Scholar] [CrossRef]
- Li, D.Y.; Wang, H.J.; Qin, Y.L.; Han, L.; Wei, X.Z.; Qin, D.Q. Entropy Production Analysis of Hysteresis Characteristic of a Pump-Turbine Model. Energy Convers. Manag. 2017, 149, 175–191. [Google Scholar] [CrossRef]
- Chang, H.; Shi, W.D.; Li, W.; Liu, J.R. Energy Loss Analysis of Novel Self-Priming Pump Based on the Entropy Production Theory. J. Therm. Sci. 2019, 28, 306–318. [Google Scholar] [CrossRef]
- Zhang, Y.X.; Hou, H.C.; Xu, C.; He, W.X.; Li, Z.L. Application of Entropy Production Method to Centrifugal Pump Energy Loss Evaluation. J. Drain. Irrig. Mach. Eng. 2017, 35, 277–282+288. [Google Scholar]
- Brizuela, E.A. Numerical Modelling of Entropy Generation and Transport in the Blade-Tip Gap Layer of a Radial Impeller. In Proceedings of the ASME 1993 International Gas Turbine and Aeroengine Congress and Exposition, Cincinnati, OH, USA, 24–27 May 1993. [Google Scholar]
- Hou, H.C. 2D Viscous Hydraulic Design and Entropy Production Diagnosis Optimization of an Ultra-Low Specific Speed Centrifugal Pump. Ph.D. Thesis, China University of Petroleum, Beijing, China, 2019. [Google Scholar]
- Feng, J.J.; Zhang, Y.; Zhu, G.J.; Li, Y.Z.; Li, W.F.; Luo, X.Q. Transition Process Characteristics of Centrifugal Pump with Power-Off Based on Entropy Production Theory. Trans. Chin. Soc. Agric. Eng. 2020, 36, 10–17. [Google Scholar]
- Liu, K.T.; Liu, H.Y.; Qu, L.T.; Liu, D.C.; Chi, F.D.; Kan, K.; Zhou, D.Q. Analysis of Hydraulic Loss Characteristics of Francis Turbine Based on Entropy Production Theory. Wat. Res. Pow. 2024, 42, 157–161. [Google Scholar]
- Gong, R.Z.; Wang, H.J.; Chen, L.X.; Li, D.Y.; Zhang, H.C.; Wei, X.Z. Application of Entropy Production Theory to Hydro-Turbine Hydraulic Analysis. Sci. China Technol. Sci. 2013, 56, 1636–1643. [Google Scholar] [CrossRef]
- Altafi, D.; Mojaddam, M.; Bastankhah, M. Entropy generation rate analysis of turbocharger radial flow compressor in range from surge to choke. Proc. Inst. Mech. Eng. Part A J. Power Energy 2024, 238, 401–426. [Google Scholar] [CrossRef]
- Dennis, B.H.; Egorov, I.N.; Han, Z.X.; Dulikravich, G.S.; Poloni, C. Multi-Objective Optimization of Turbomachinery Cascades for Minimum Loss, Maximum Loading, and Maximum Gap-to-Chord Ratio. Int. J. Turbo Jet Eng. 2001, 18, 201–210. [Google Scholar] [CrossRef]
- Iandoli, C.L.; Sciubba, E.; Zeoli, N. The Computation of the Entropy Generation Rate for Turbomachinery Design Applications: Some Theoretical Remarks and Practical Examples. Int. J. Energy Technol. Policy 2008, 6, 75–92. [Google Scholar] [CrossRef]
- Chen, Q.F. Entropy Production Rate Analysis in S Zone for a Pump-Turbine. Master’s Thesis, Tsinghua University, Beijing, China, 2018. [Google Scholar]
- De Groot, S.R.; Mazur, P. Non-Equilibrium Thermodynamics; Courier Corporation: North Chelmsford, MA, USA, 2013. [Google Scholar]
- Kolmogorov, A.N. The local structure of turbulence in incompressible viscous fluid for very large Reynolds numbers. Proc. R. Soc. Lond. A 1991, 434, 9–13. [Google Scholar]
- Kock, F.; Herwig, H. Local Entropy Production in Turbulent Shear Flows: A High-Reynolds Number Model with Wall Functions. Int. J. Heat Mass Transf. 2004, 47, 2205–2215. [Google Scholar] [CrossRef]
- Kock, F.; Herwig, H. Entropy Production Calculation for Turbulent Shear Flows and Their Implementation in CFD Codes. Int. J. Heat Fluid Flow 2005, 26, 672–680. [Google Scholar] [CrossRef]
- Sadiki, A.; Agrebi, S.; Ries, F. Entropy Generation Analysis in Turbulent Reacting Flows and Near Wall: A Review. Entropy 2022, 24, 1099. [Google Scholar] [CrossRef]
- Zhang, X.; Wang, Y.; Xu, X.M.; Wang, H.Y. Energy Conversion Characteristics within Impeller of Low Specific Speed Centrifugal Pump. Trans. Chin. Soc. Agric. Mach. 2011, 42, 75–81. [Google Scholar]
- Wang, X.H.; Yang, J.H.; Xia, Z.T.; Guo, Y.L. Calculation and Analysis of Velocity Slip in Pump as Turbine. J. Huazhong Univ. Sci. Technol. 2017, 45, 64–68. [Google Scholar]
- Zhang, J.F.; Cai, H.K.; Chen, S.B.; Xue, J.; Li, Y.L. Influence of Long and Short Blade Trailing Edge Shape on Performance and Rotor-Stator Interaction in Centrifugal Pump. Trans. Chin. Soc. Agric. Mach. 2020, 51, 122–130+190. [Google Scholar]
- Lin, T.; Li, X.J.; Zhu, Z.C.; Xie, J.; Li, Y.; Yang, H. Application of Enstrophy Dissipation to Analyze Energy Loss in a Centrifugal Pump as Turbine. Renew. Energy 2021, 163, 43–55. [Google Scholar] [CrossRef]
Disclaimer/Publisher’s Note: The statements, opinions and data contained in all publications are solely those of the individual author(s) and contributor(s) and not of MDPI and/or the editor(s). MDPI and/or the editor(s) disclaim responsibility for any injury to people or property resulting from any ideas, methods, instructions or products referred to in the content. |
© 2025 by the authors. Licensee MDPI, Basel, Switzerland. This article is an open access article distributed under the terms and conditions of the Creative Commons Attribution (CC BY) license (https://creativecommons.org/licenses/by/4.0/).