Provincial Electricity–Heat Integrated Energy System Optimal Dispatching Model for Time-Series Production Simulation

Abstract
1. Introduction
2. Provincial Energy System Structure and Production Simulation Ideas
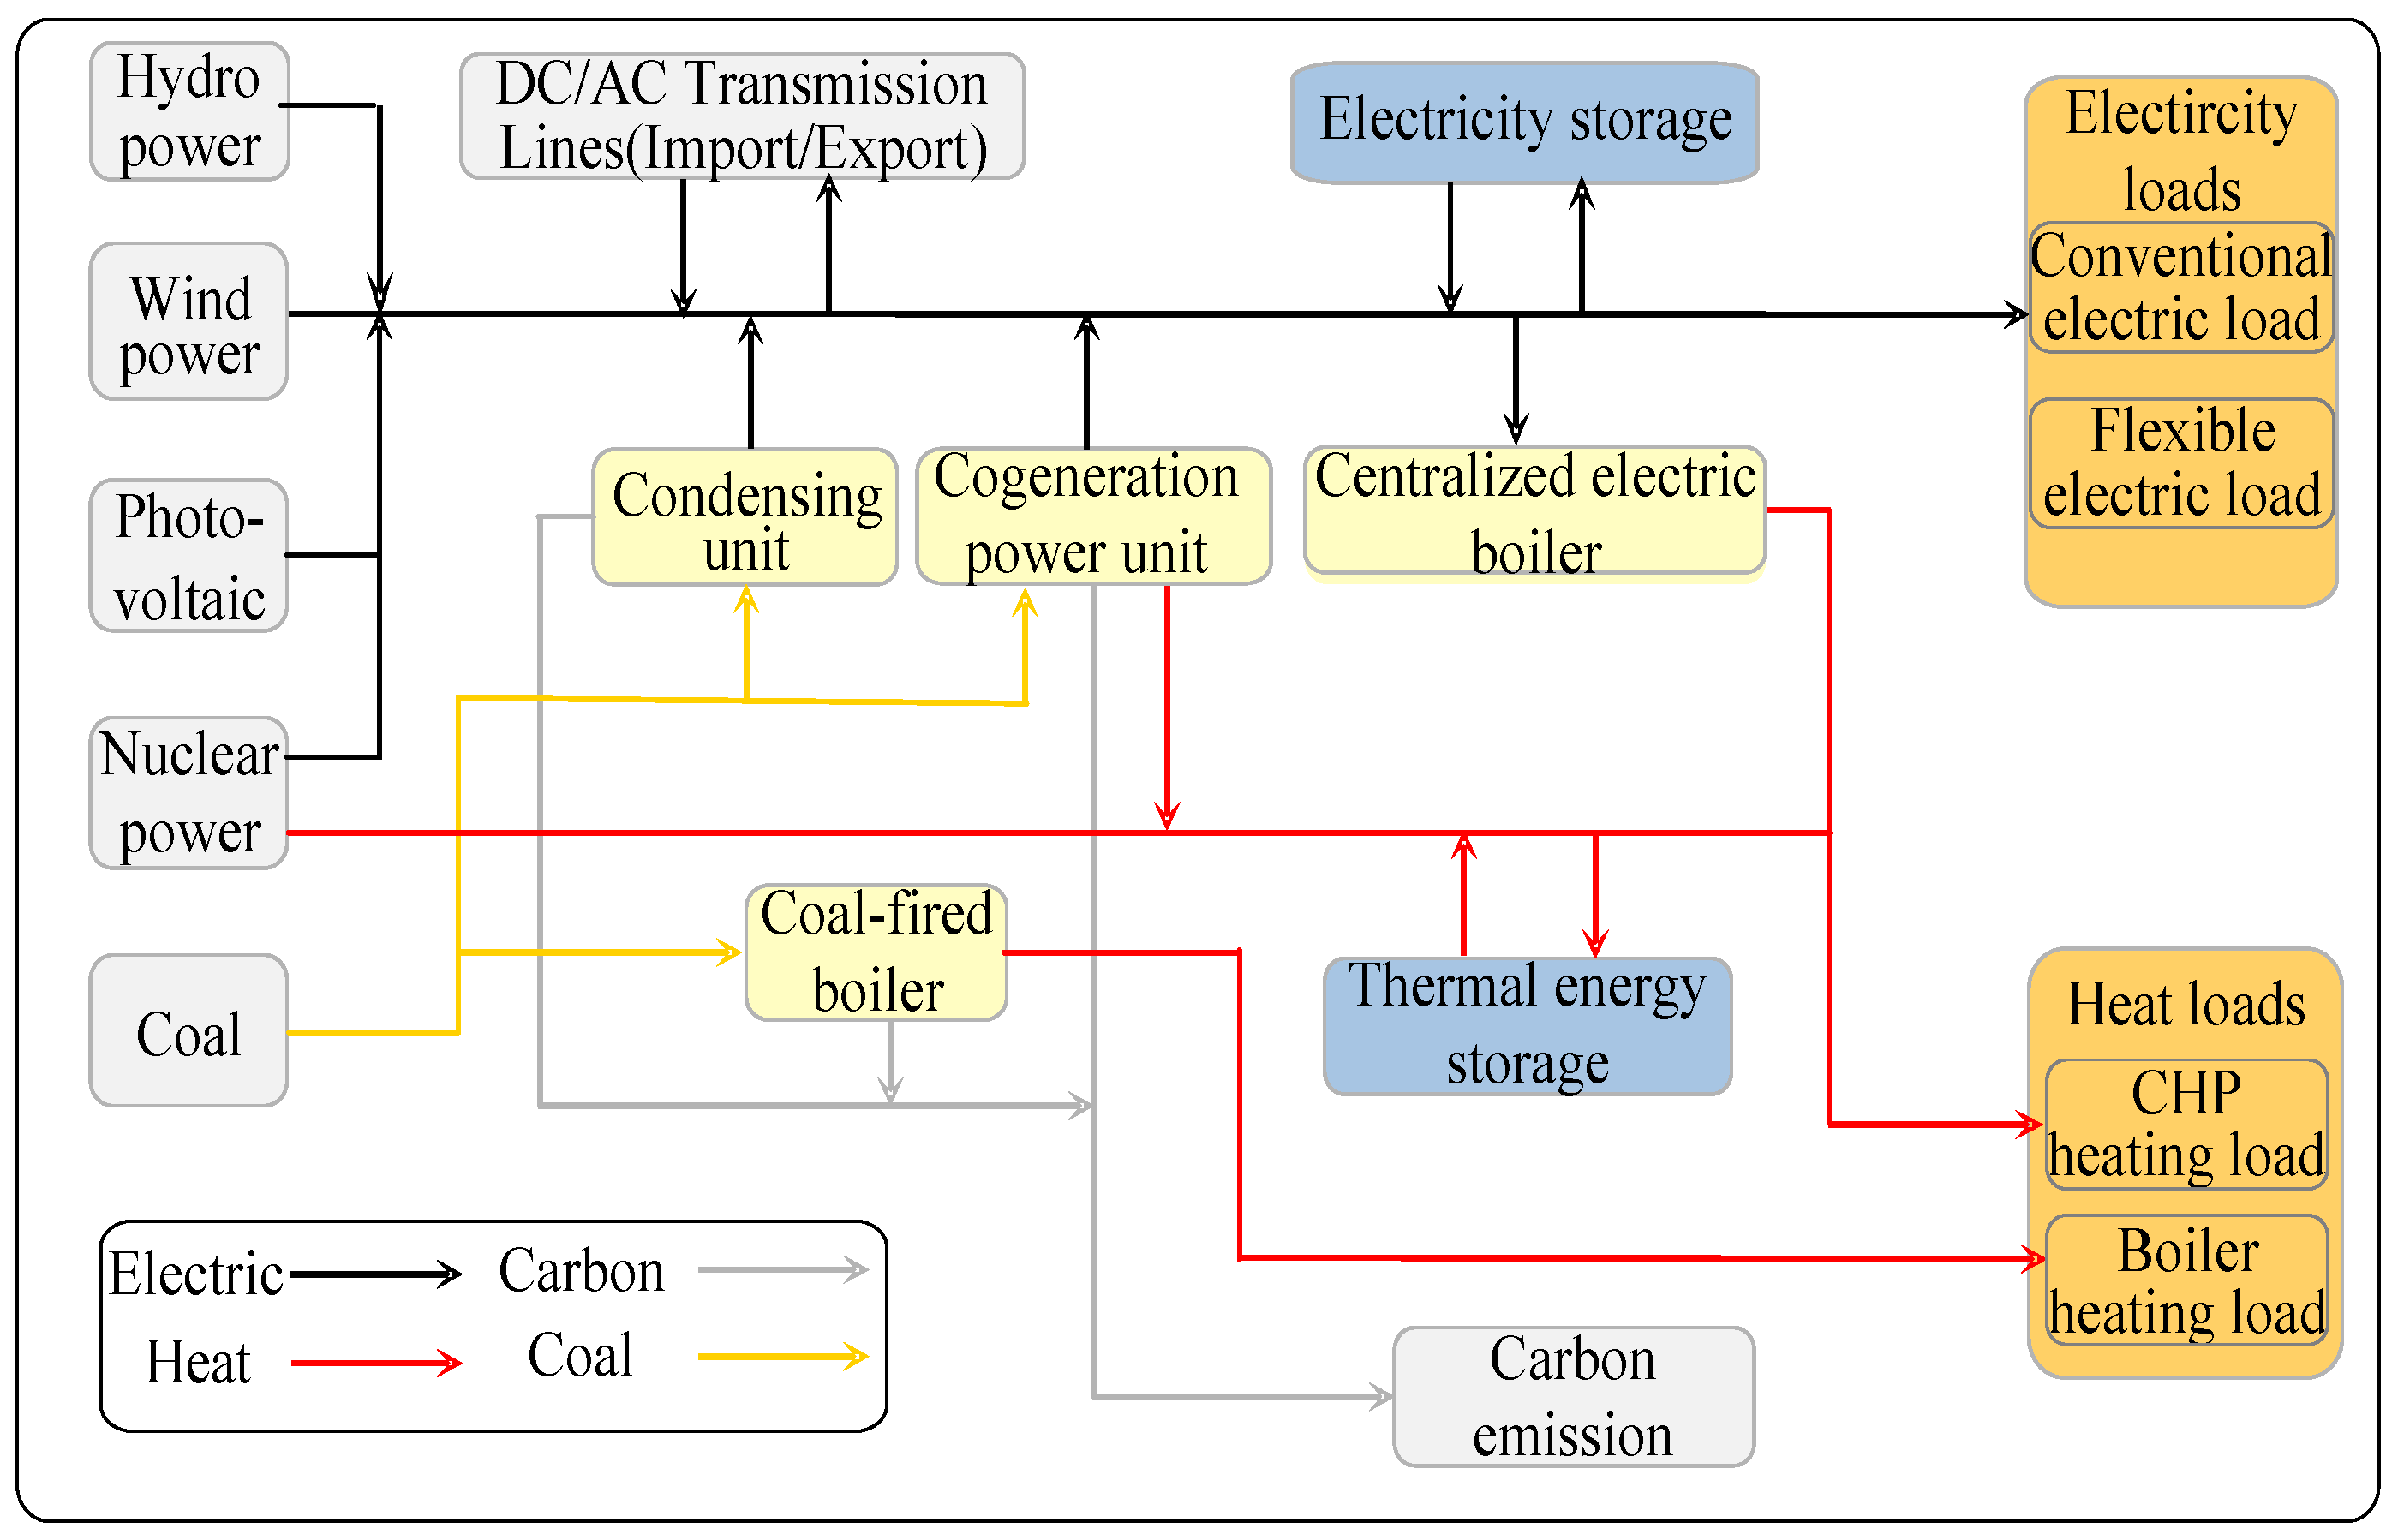
2.1. Energy System Structure
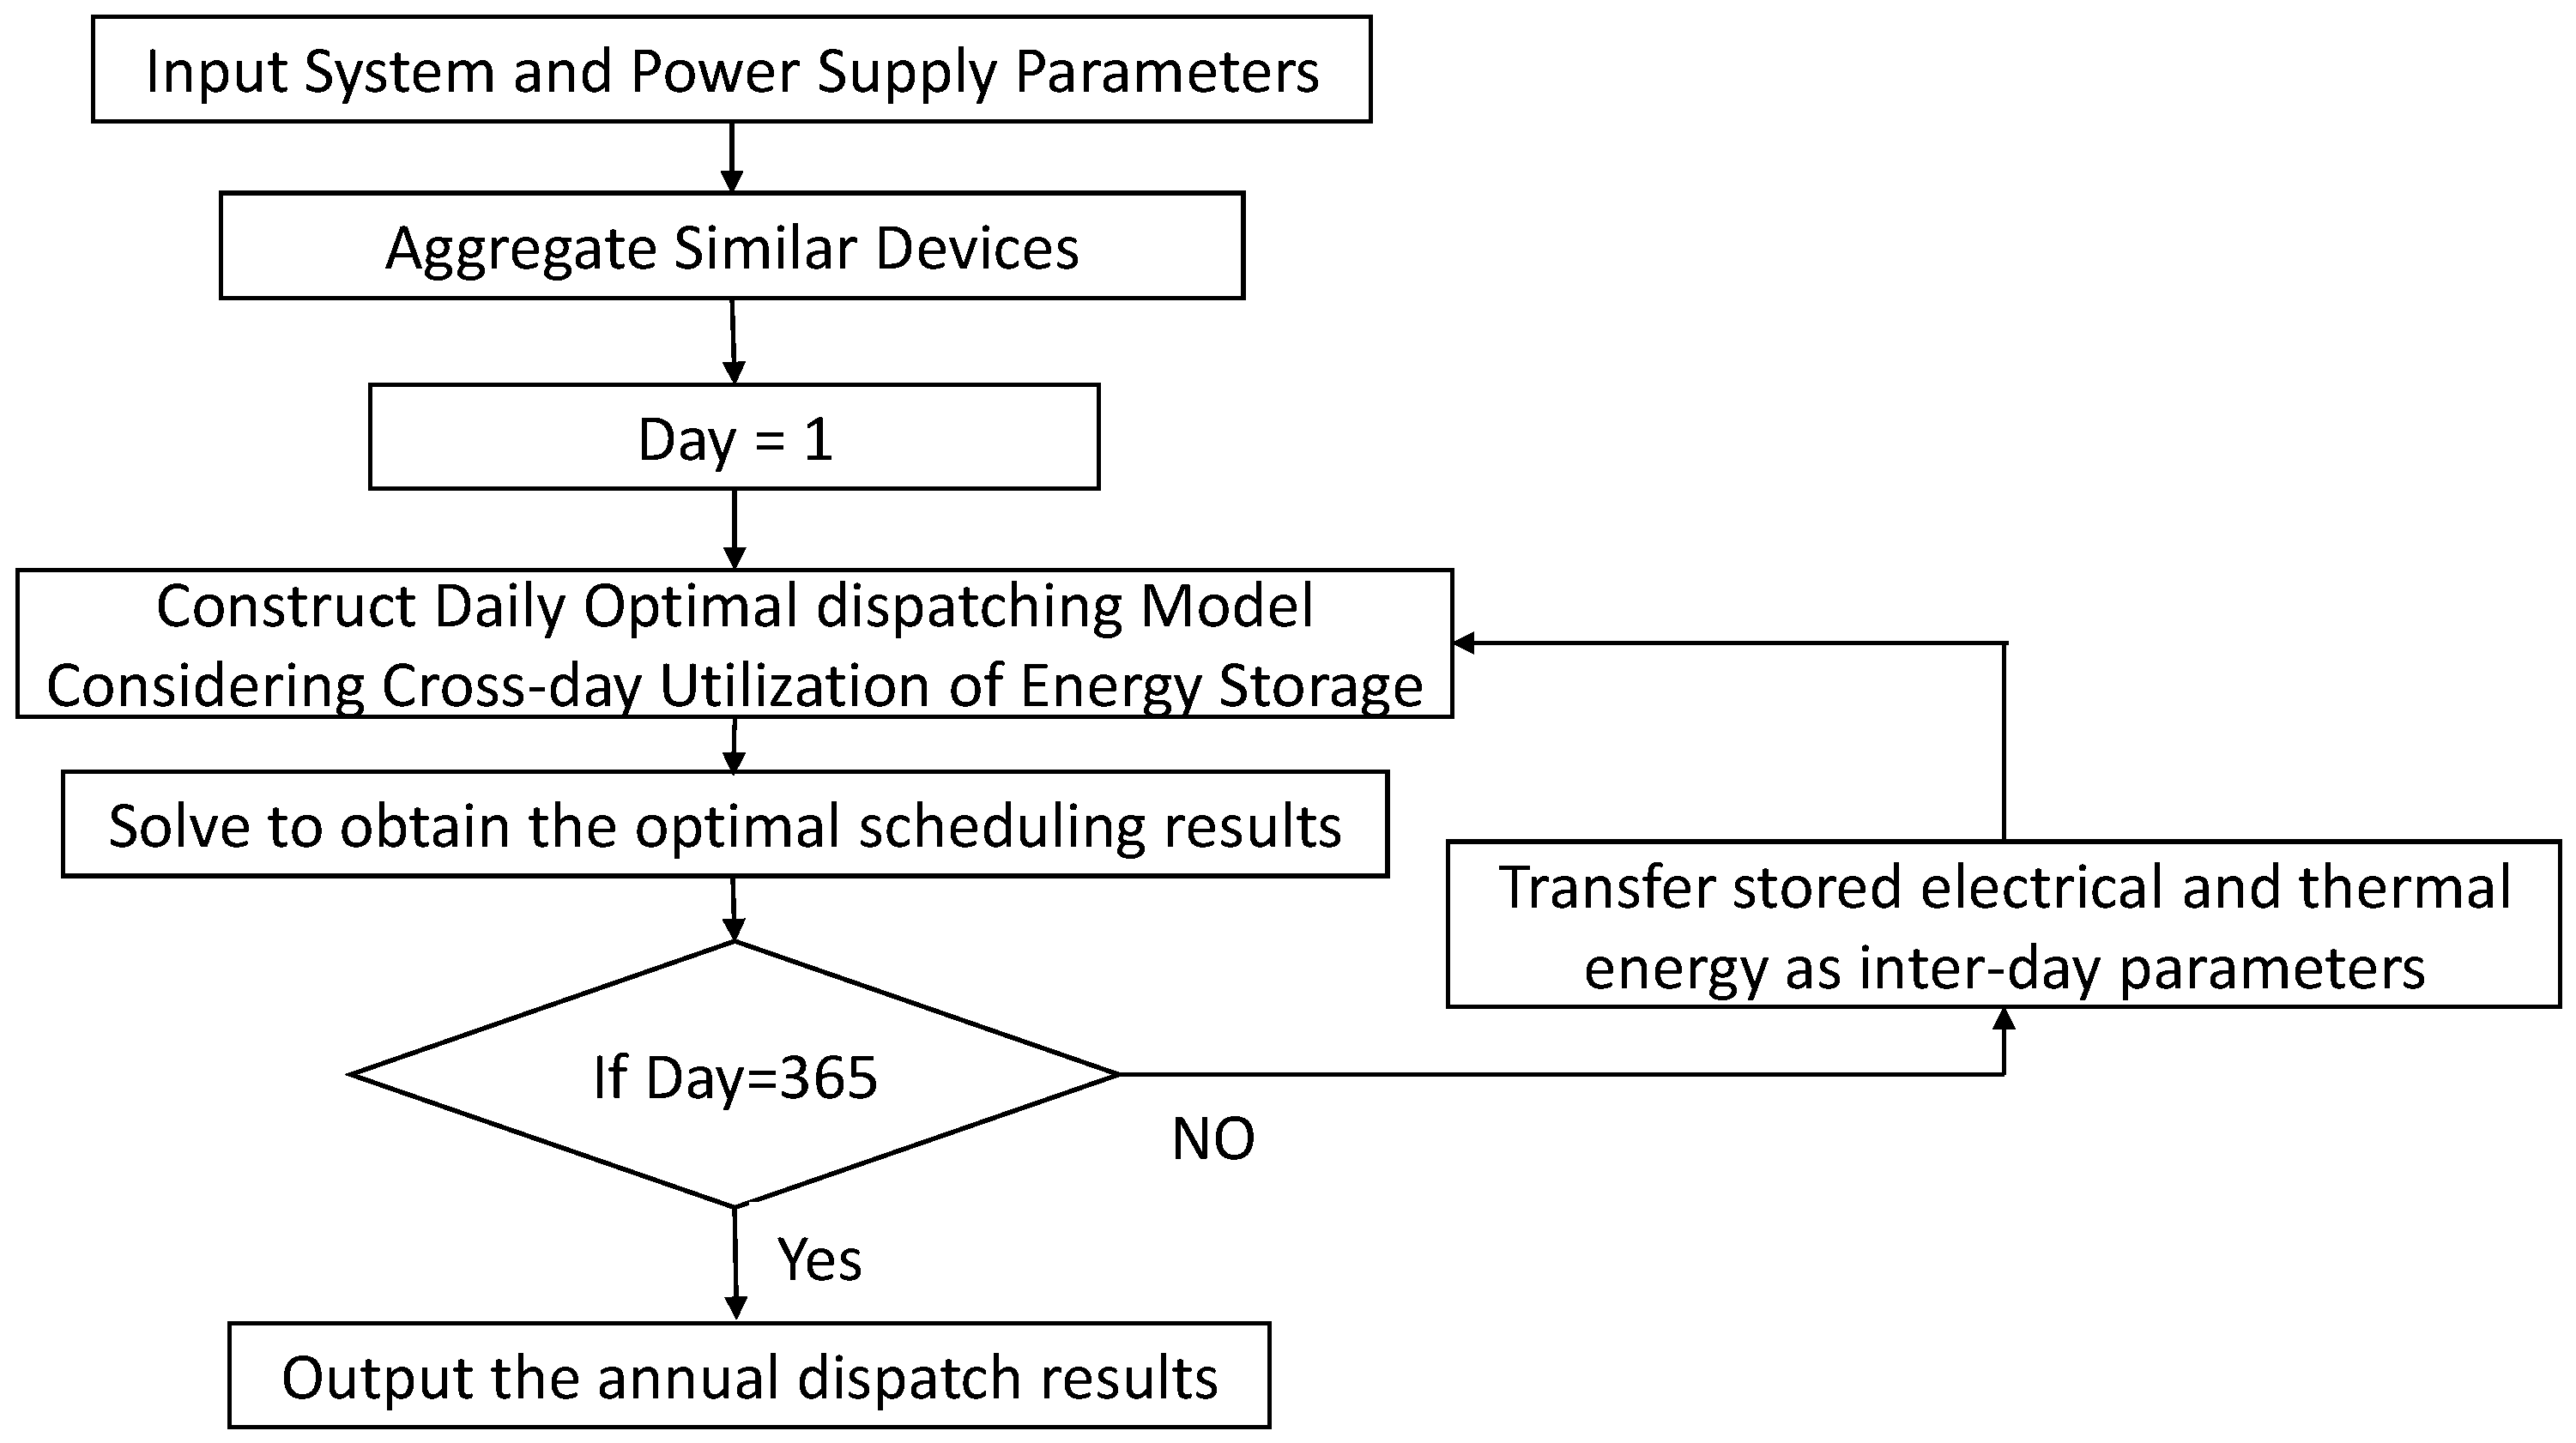
2.2. Ideas for Time-Series Production Simulation Based on Daily Rolling Optimal Dispatching
2.3. Energy System Aggregation Strategy
3. A Daily Optimal Dispatching Model Realizing Cross-Day Charging and Discharging of Energy Storage
3.1. Objective Function
3.1.1. Power and Heat Source Coal Consumption Model
3.1.2. Coal Consumption Converted from Load Loss Penalty and Demand Response Model
3.1.3. Equivalent Consumption Model of Electrical and Thermal Energy Storage
3.2. Analysis of Equivalent Coal Consumption Conversion Coefficient of Electric and Thermal Energy Storage
3.3. Constraint Condition
3.4. Model Solution Method
4. Case Analysis
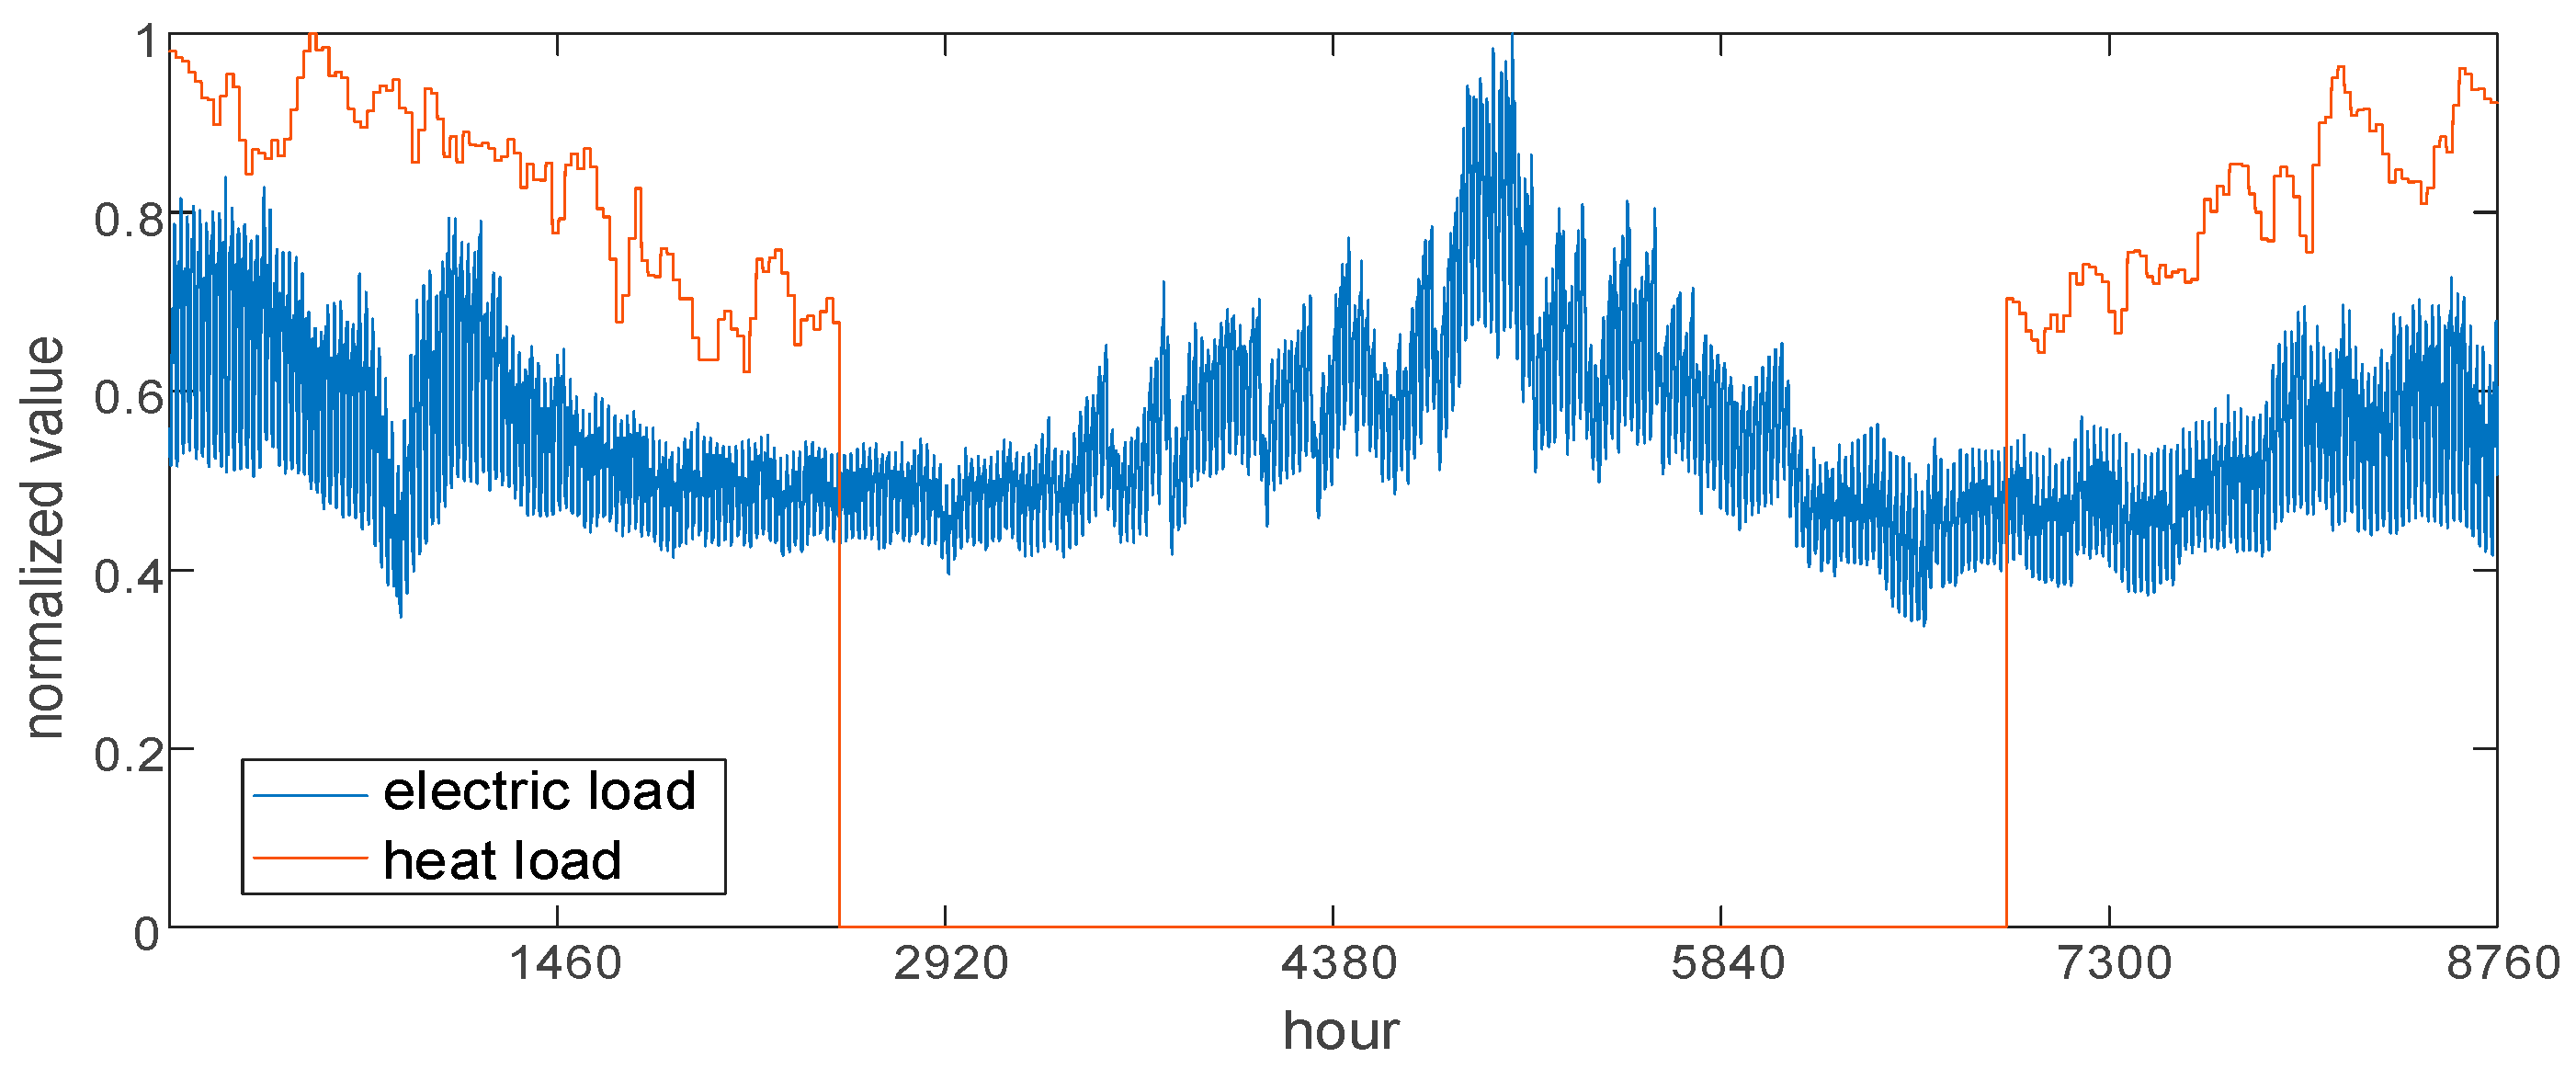
4.1. Basic Data
4.1.1. Case System
4.1.2. Production Dispatching Model Parameter Setting
4.1.3. Comparison of Scene Settings
4.2. Effectiveness Analysis of Suggested Optimal Dispatching Model
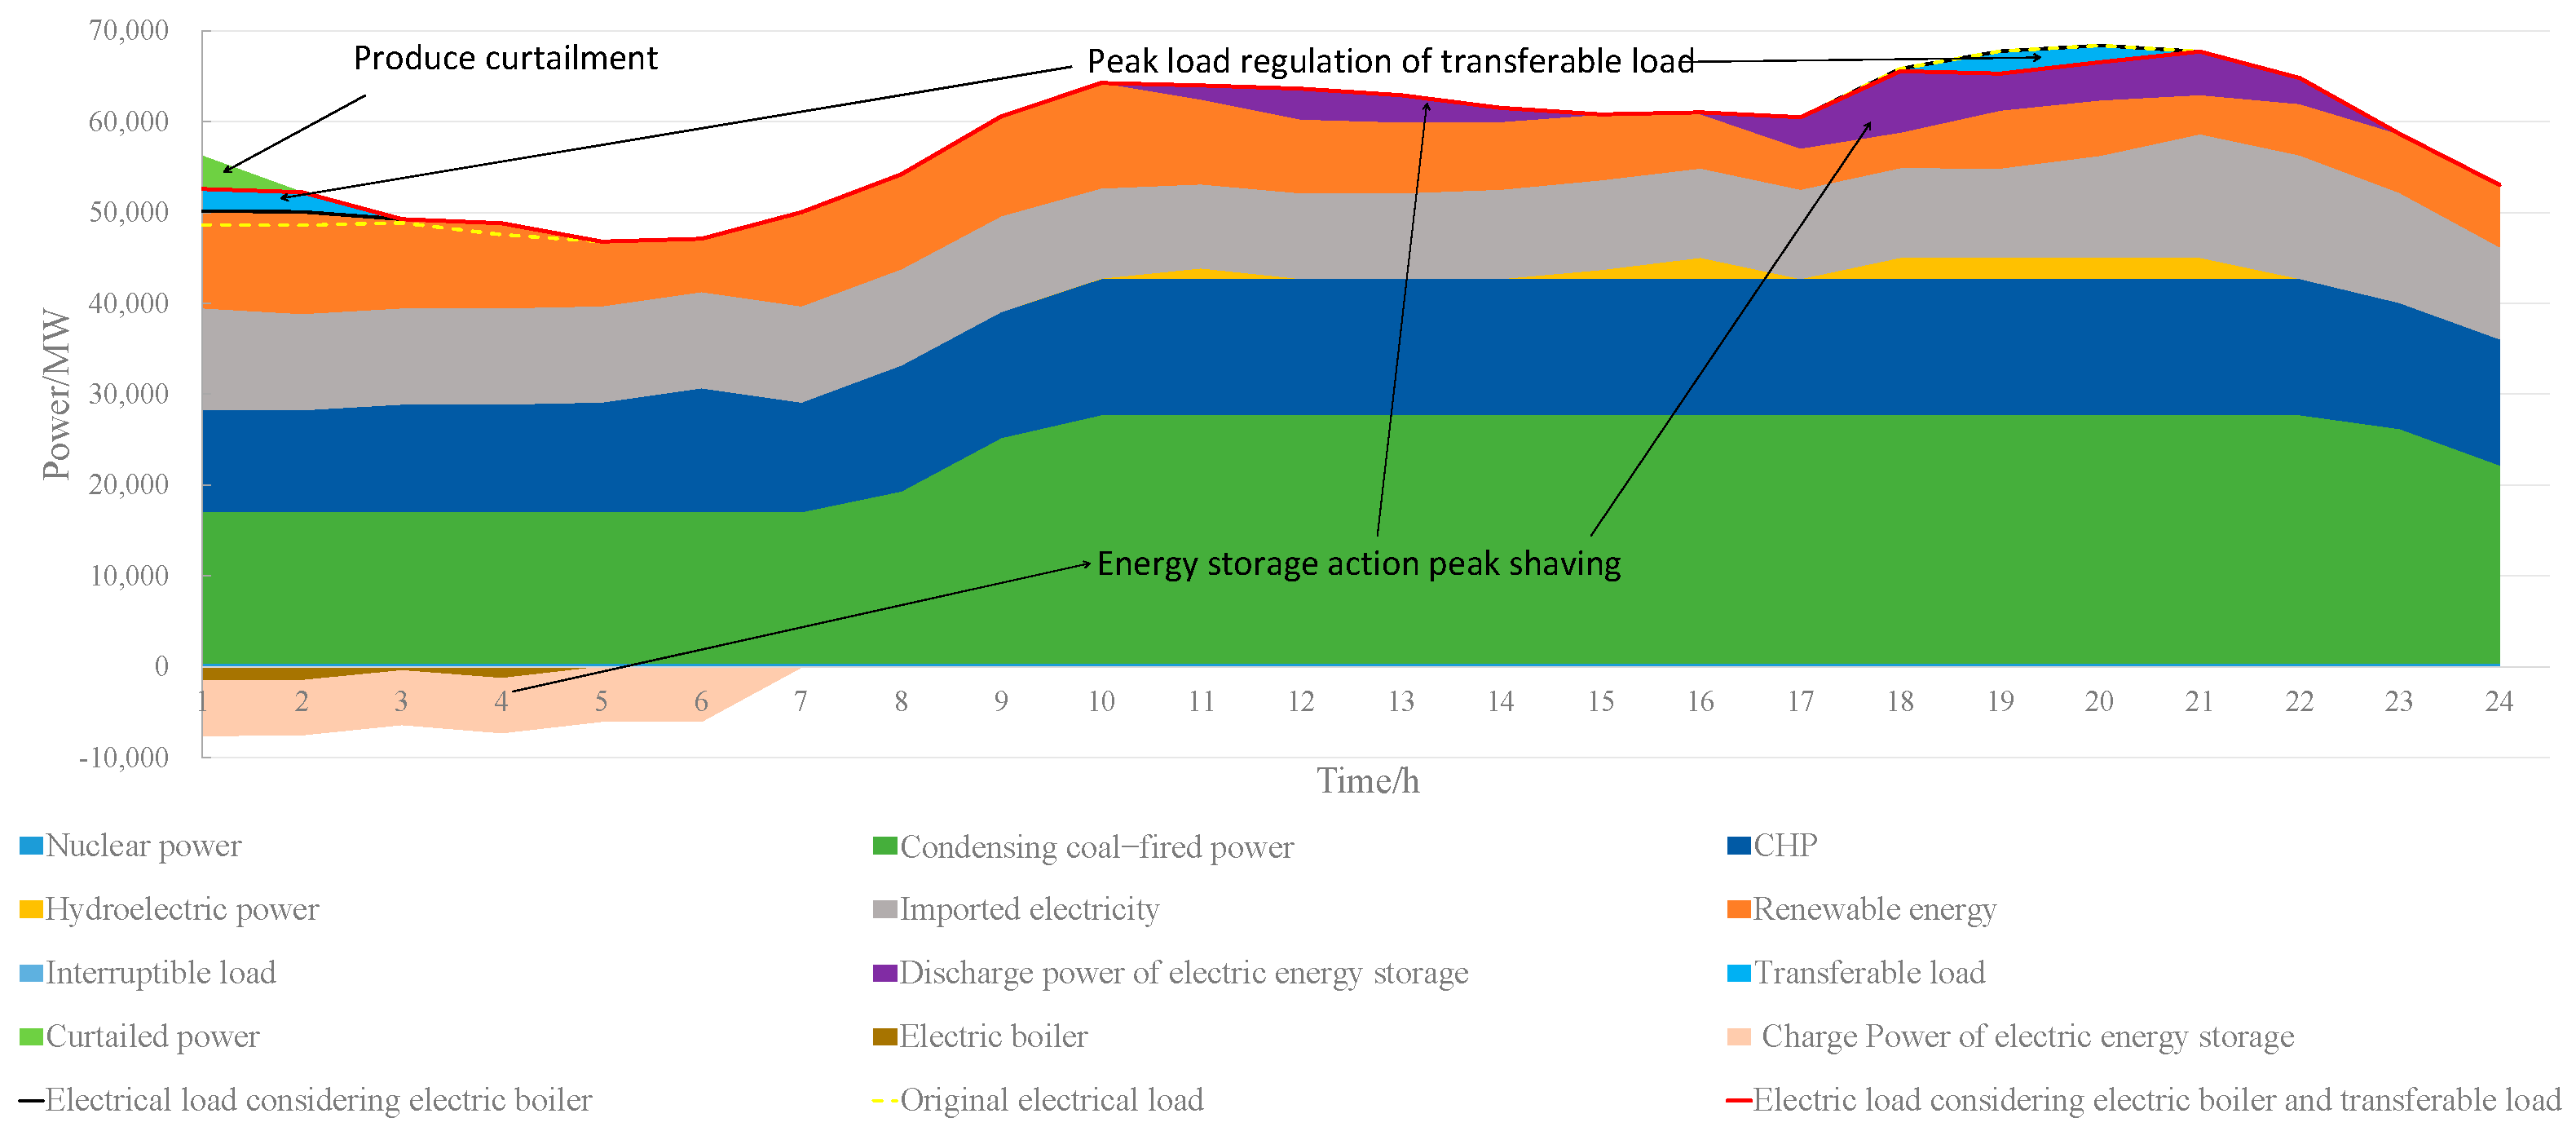
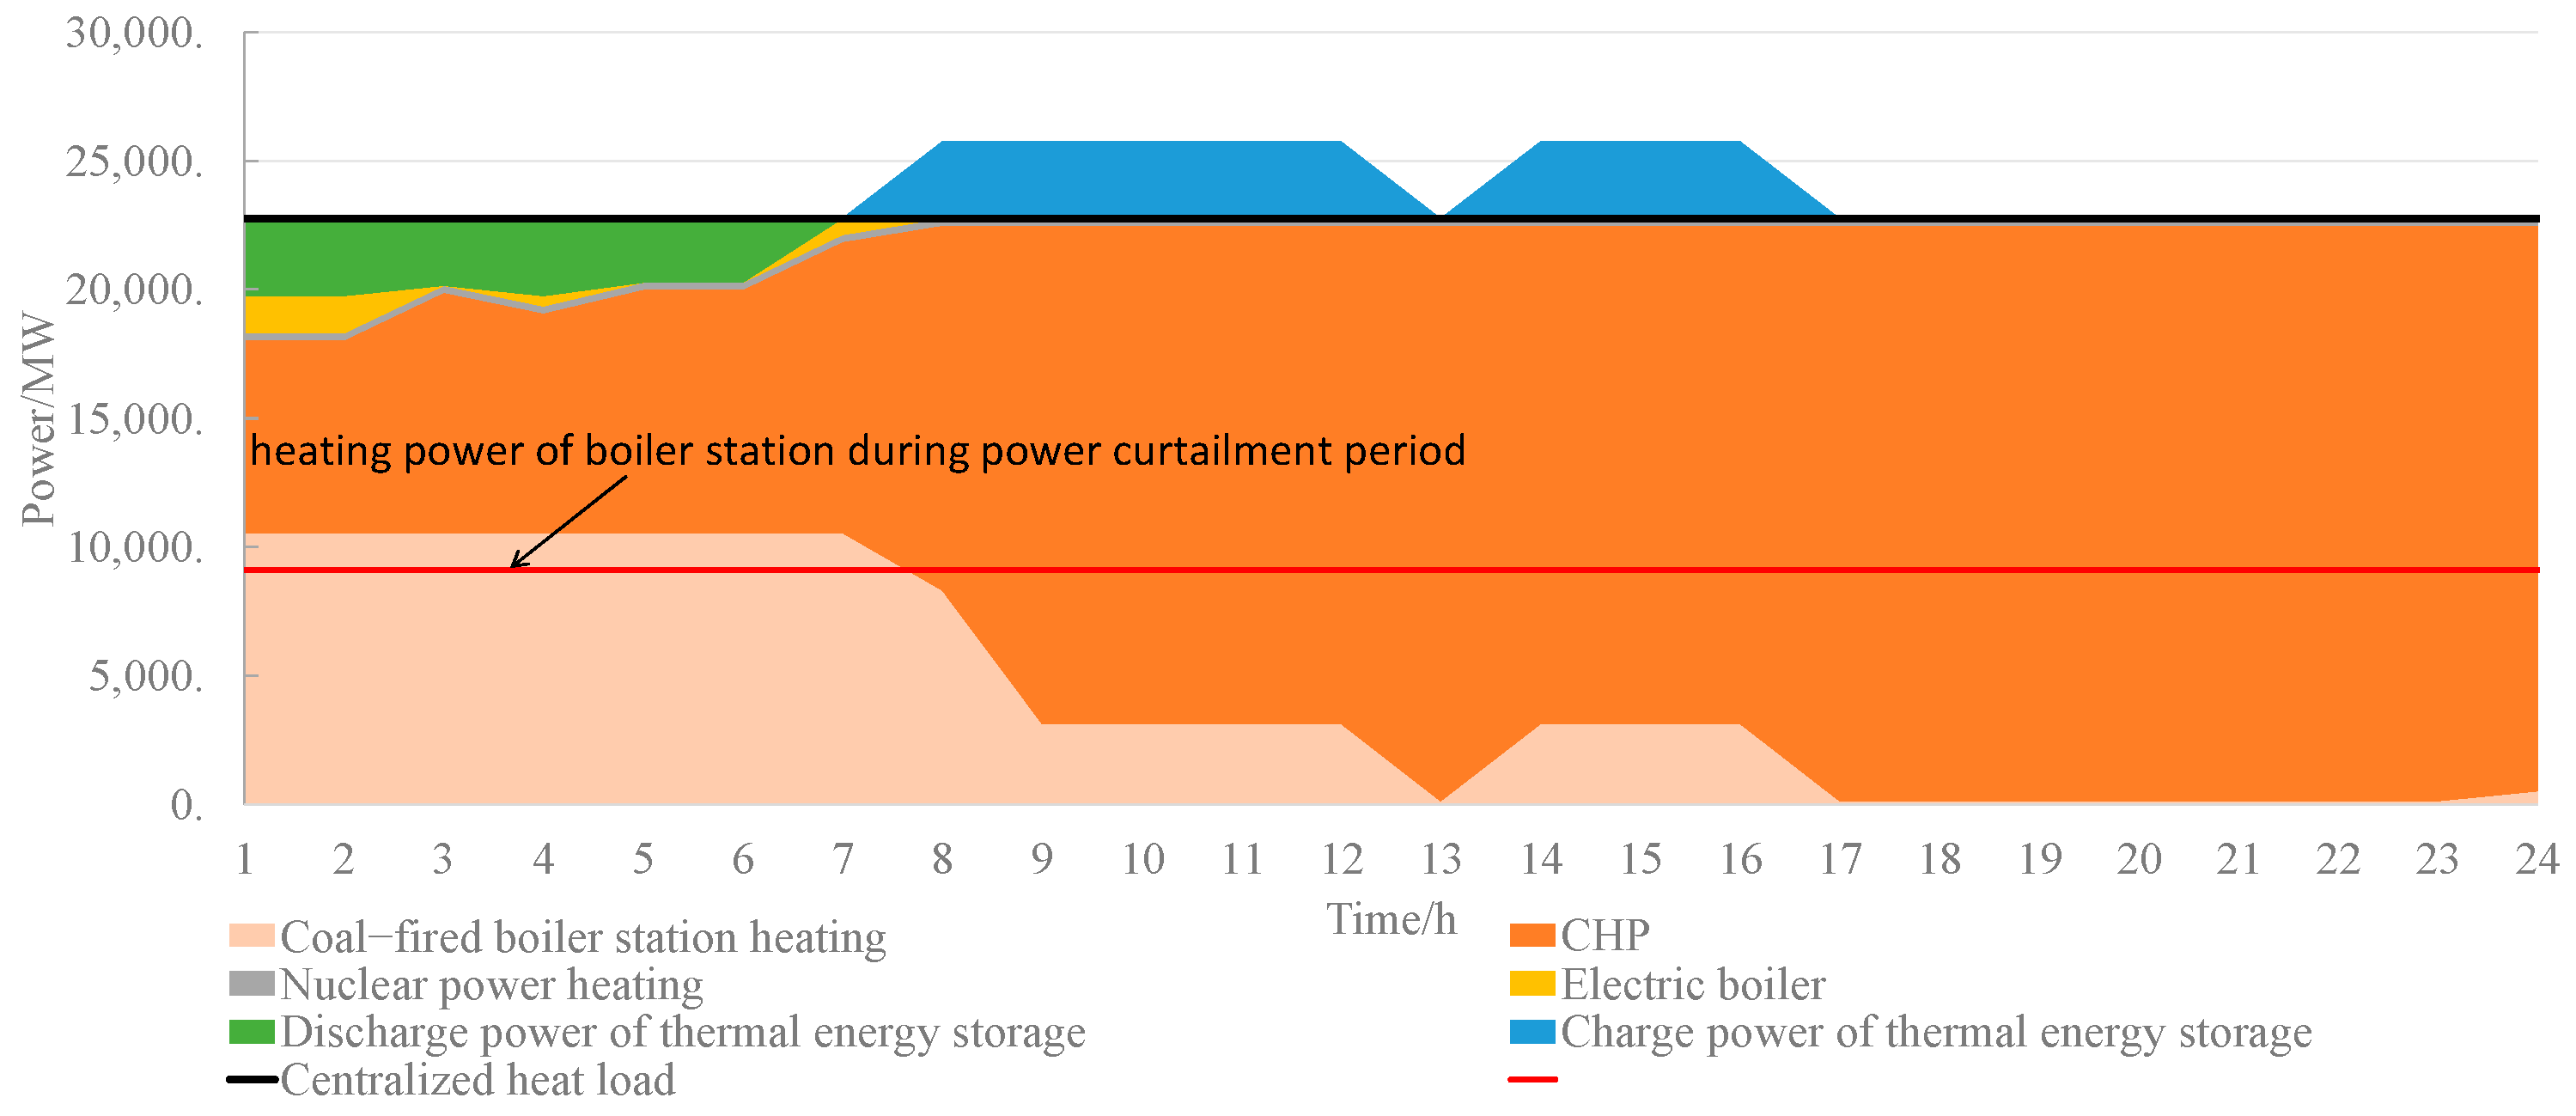
4.2.1. Rationality Analysis of a Typical Day’s Power Balance and Heating Balance
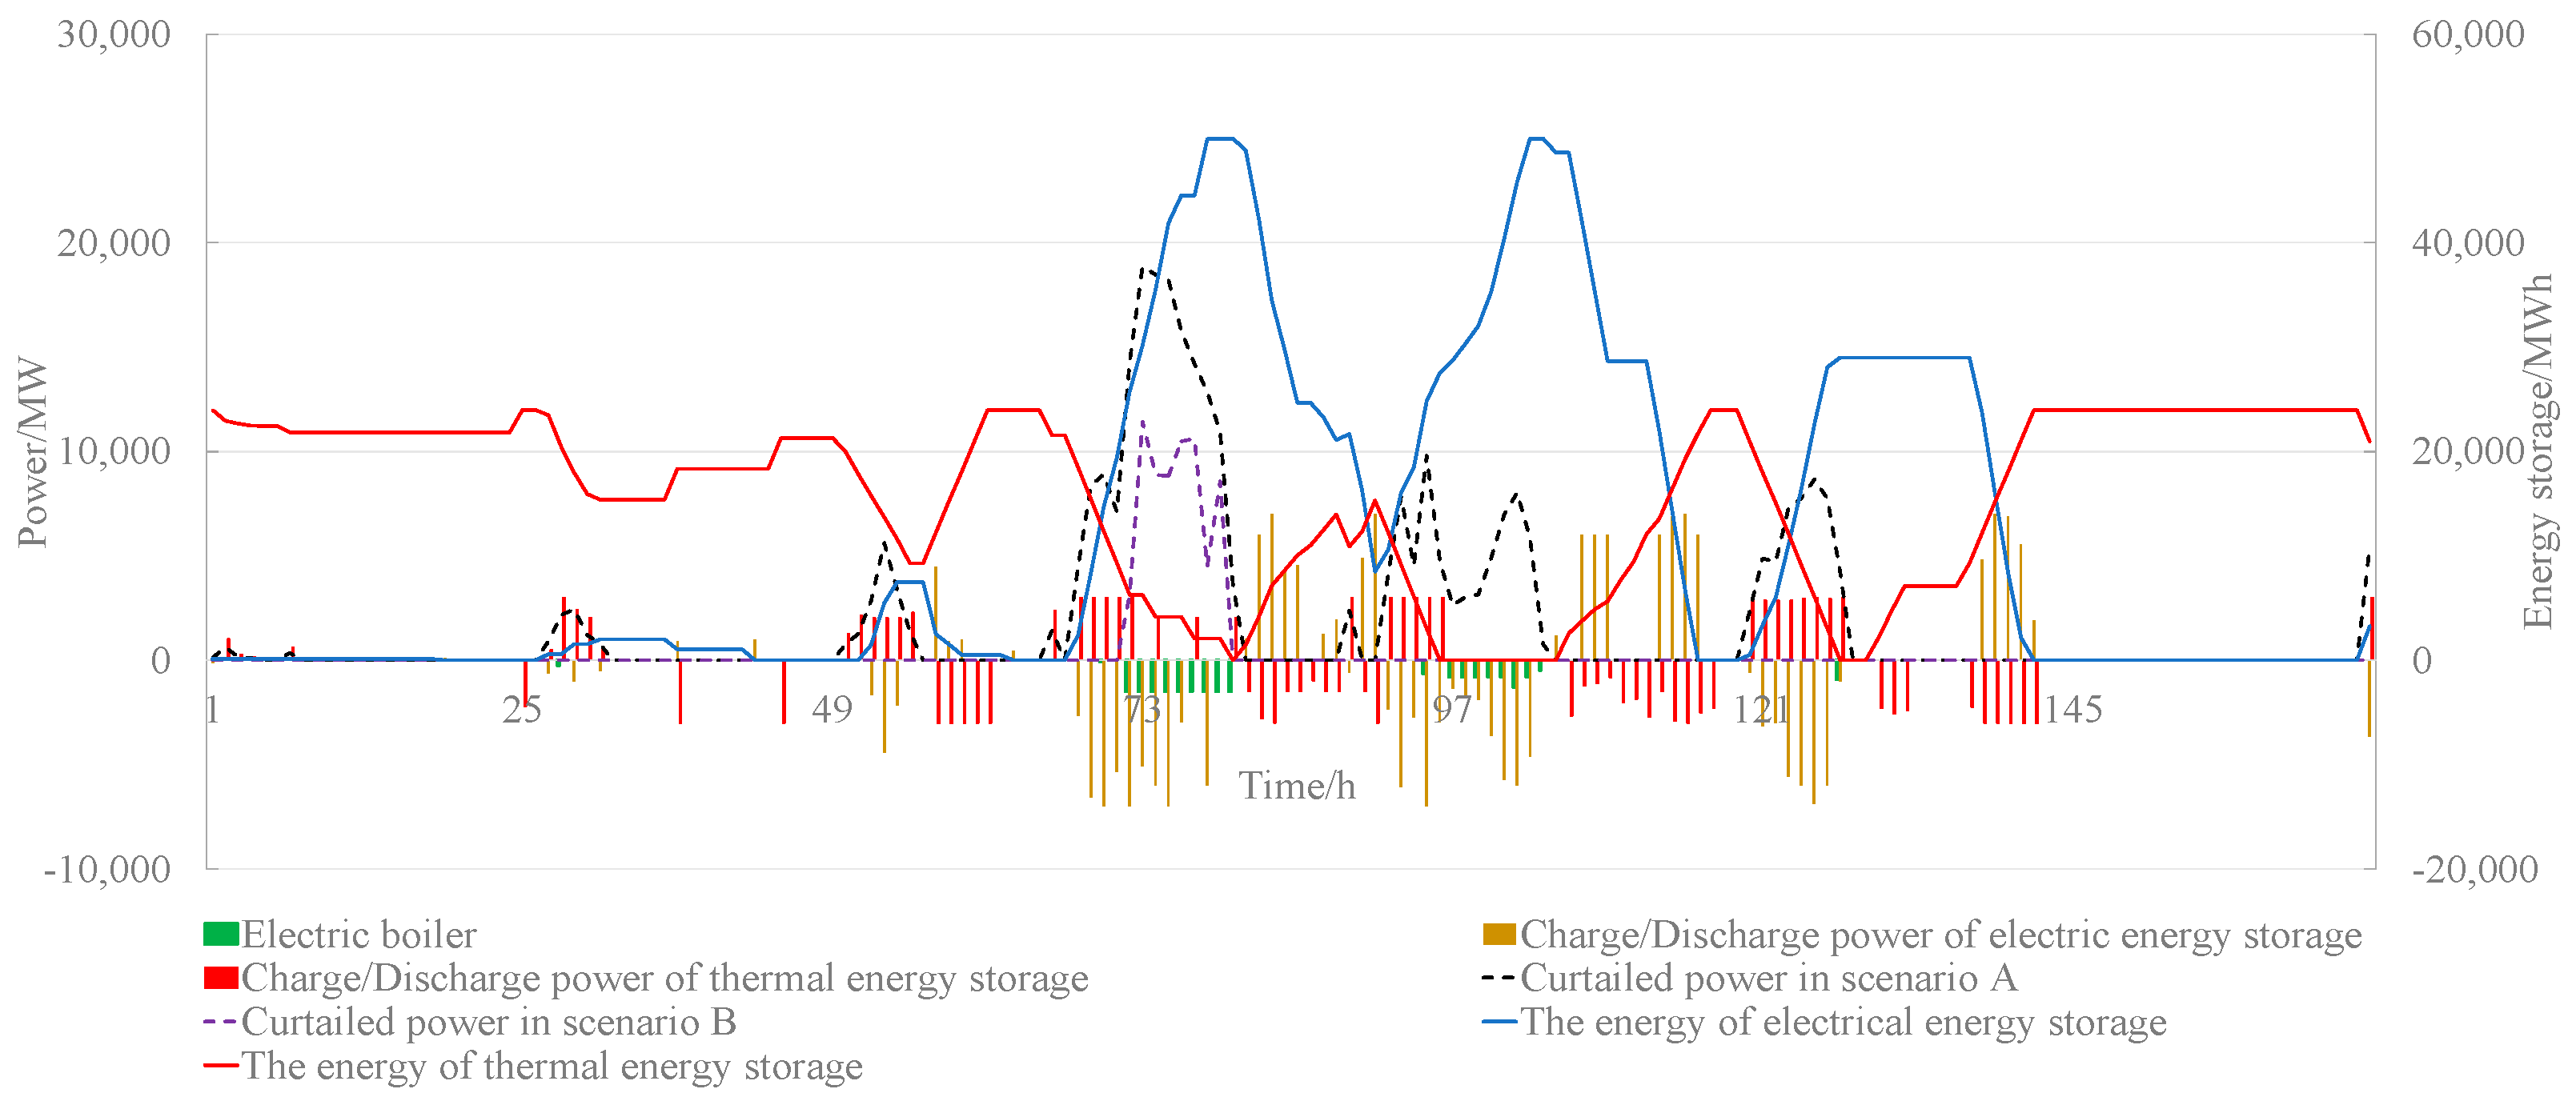
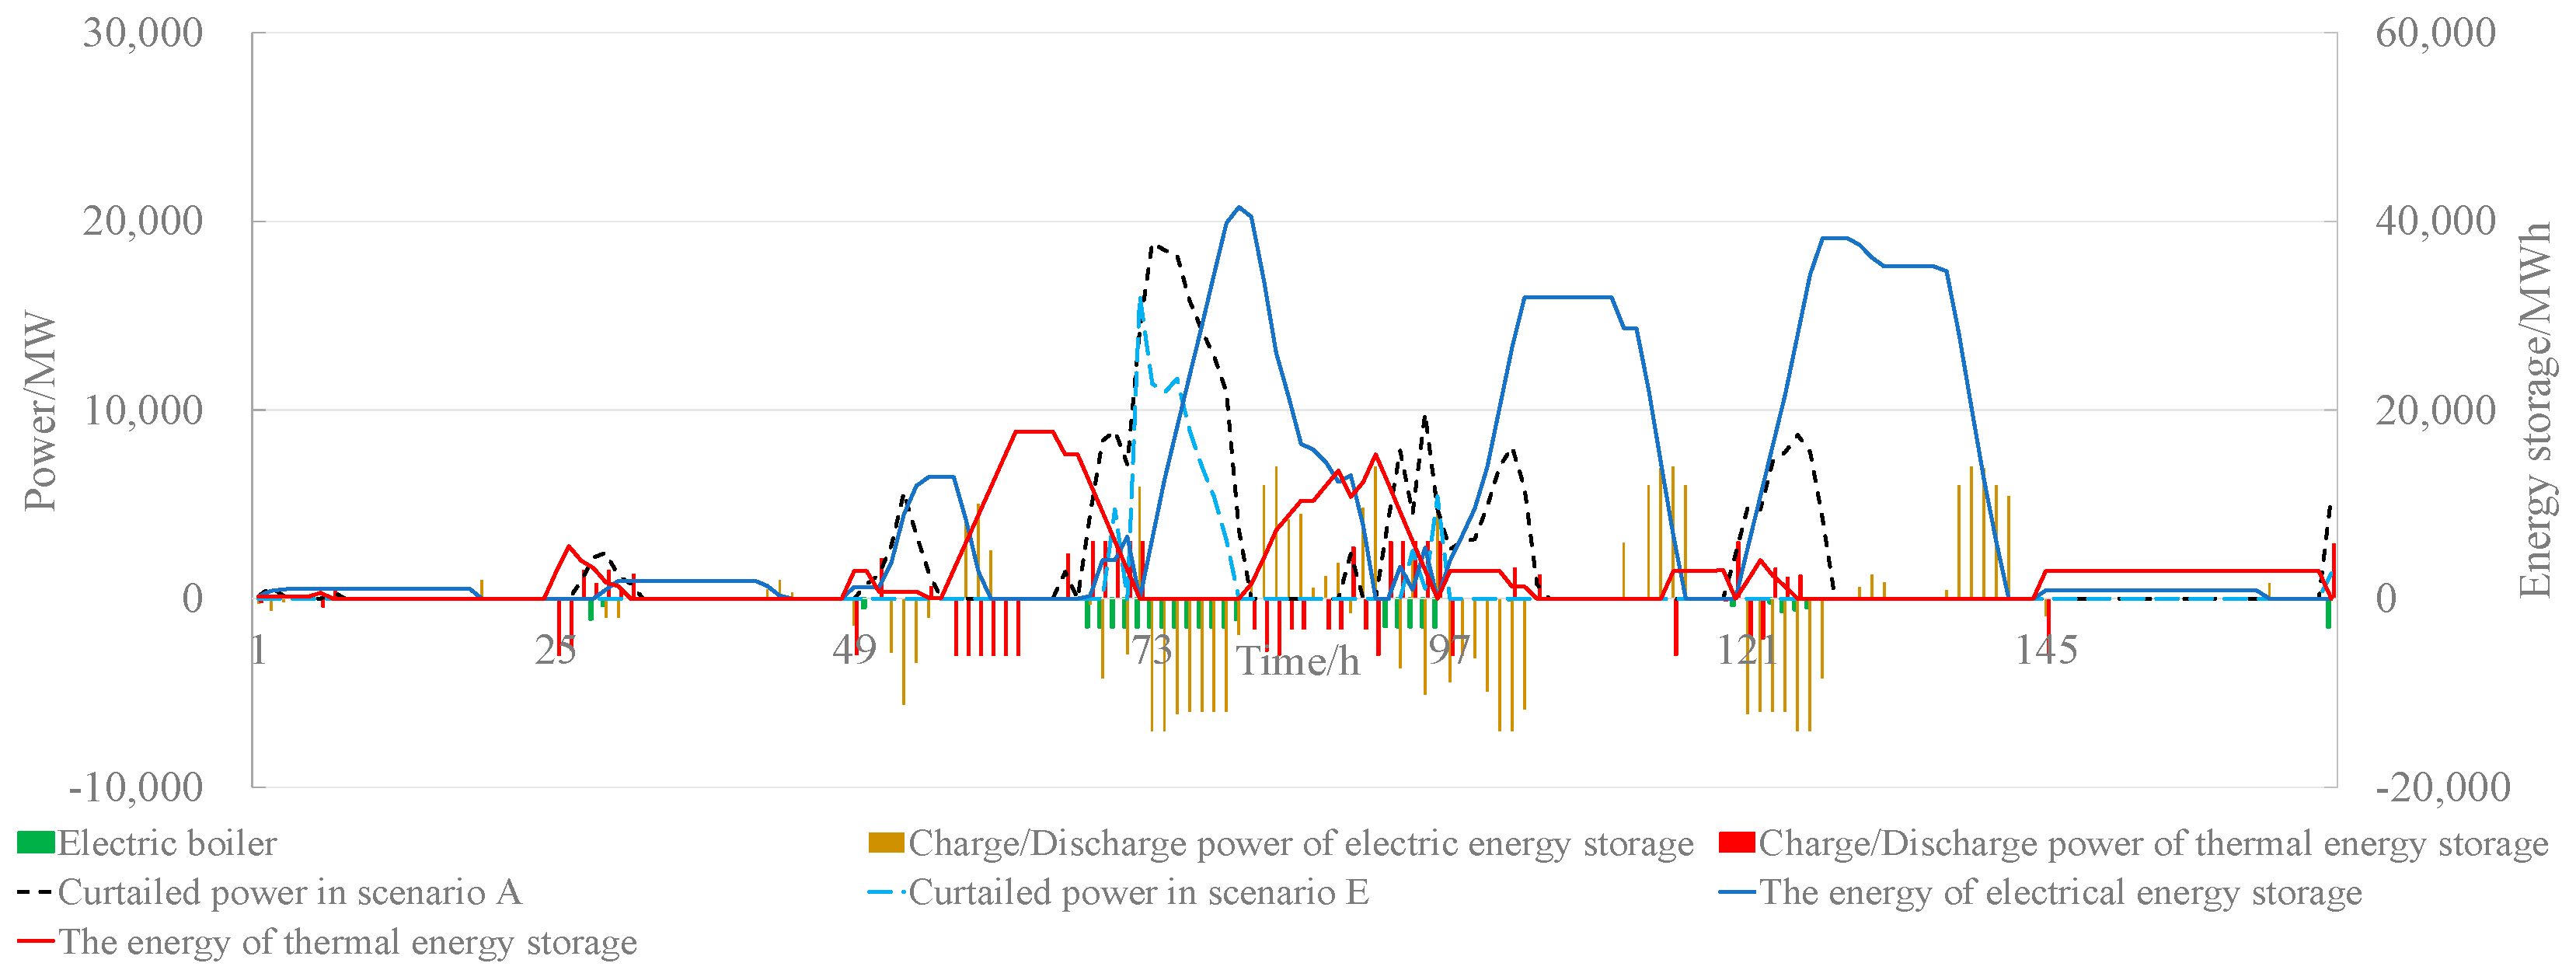
4.2.2. Effectiveness Analysis of the Cross-Day Coordinated Accommodation of Curtailed Electricity by Electric and Thermal Energy Storage
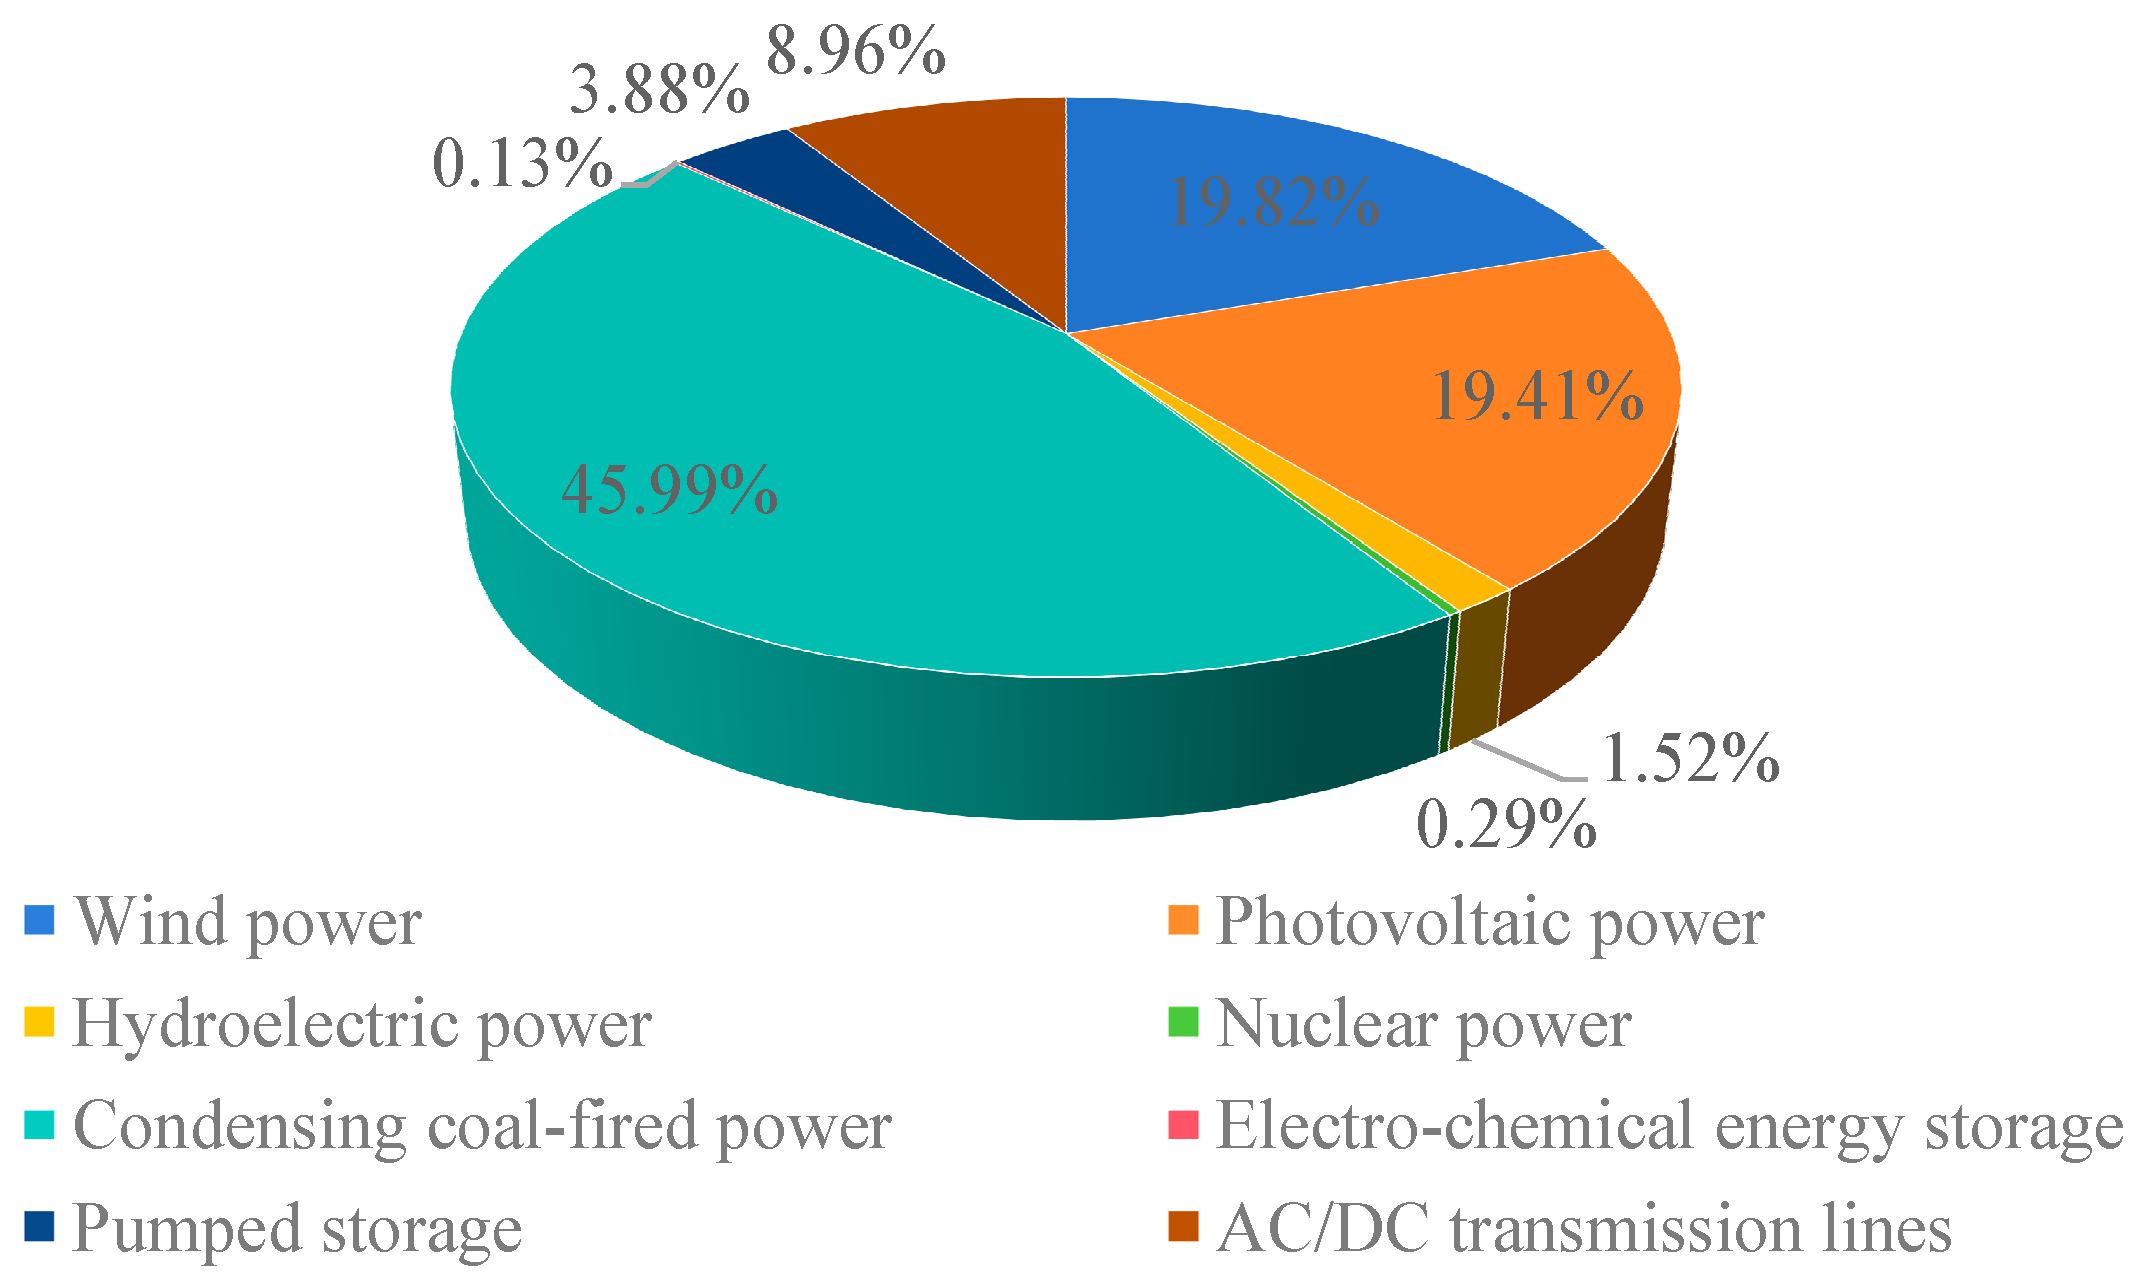
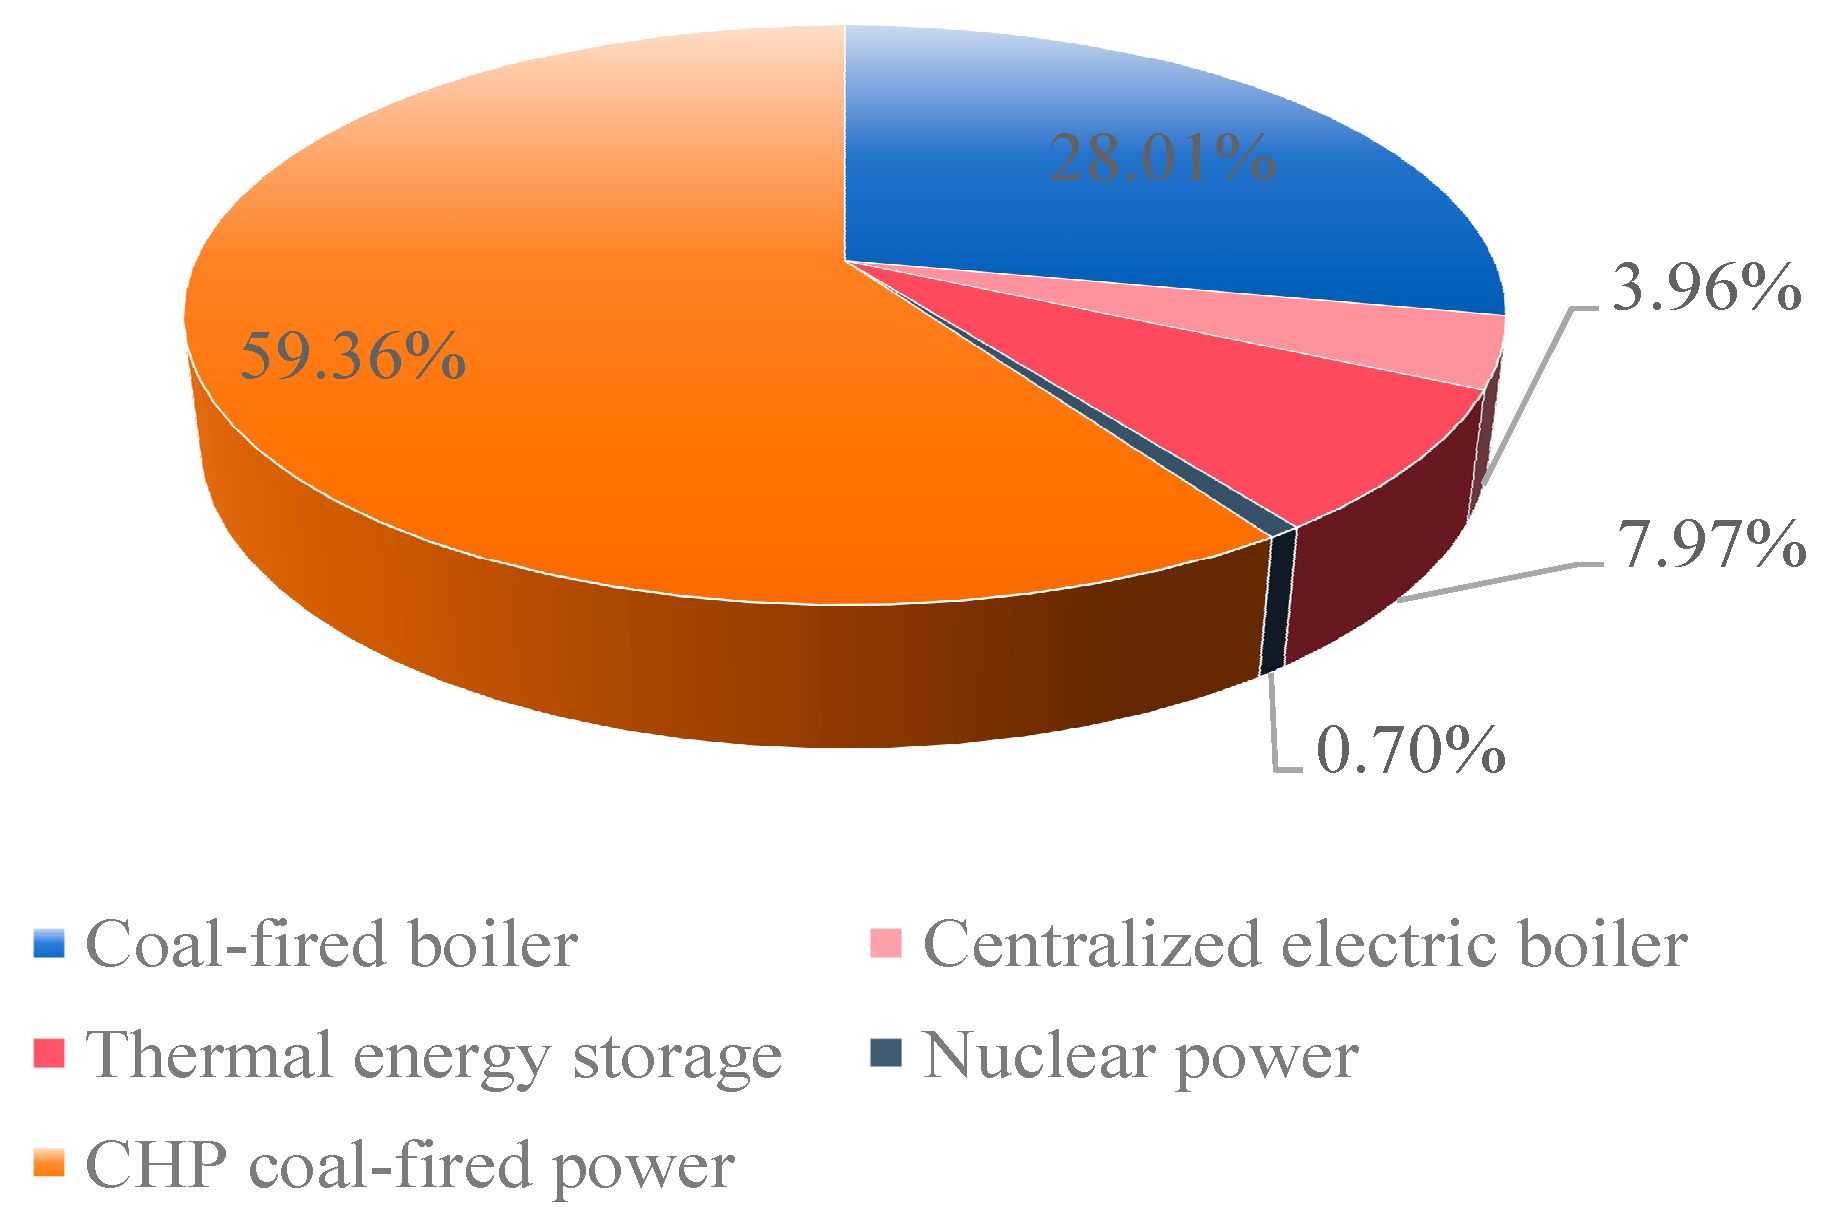
4.2.3. Effectiveness Analysis of the Annual Production Simulation Calculation
4.3. Comparing the Analysis of the Suggested Strategy and Traditional Strategy for Electrical and Thermal Energy Storage
5. Conclusions
Author Contributions
Funding
Data Availability Statement
Acknowledgments
Conflicts of Interest
References
- Electric Power Planning & Engineering Institute. Thermal Power Plant Flexibility, a Publication Under the Clean Energy Ministerial Campaign; Electric Power Planning & Engineering Institute: Beijing, China, 2018.
- Jiang, H.; Du, E.; Zhu, G.; Huang, J.; Qian, M.; Zhang, N. Review and prospect of seasonal energy storage for power system with high proportion of renewable energy. Autom. Electr. Power Syst. 2020, 44, 194–207. [Google Scholar]
- Zhang, N.; Dai, H.; Wang, Y. P2X technology progress and Simulation Studies on Its Participation in Power System Operation Optimization. Electr. Power 2021, 54, 119–127. [Google Scholar]
- Wei, L.; Ai, X.; Fang, J.; Zhu, X.; Wen, J. Review of application and solution technology of sequential production simulation for new power system. Autom. Electr. Power Syst. 2024, 48, 170–184. [Google Scholar]
- Wang, M.; Zhao, H.; Tian, H.; Chen, J.; Wu, Q. Review of typical simulation and planning platforms for integrated energy system. Power Syst. Technol. 2020, 44, 4702–4712. [Google Scholar]
- Connolly, D.; Lund, H.; Mathiesen, B.; Leahy, M. A review of computer tools for analyzing the integration of renewable energy into various energy systems. Appl. Energy 2009, 87, 1059–1082. [Google Scholar] [CrossRef]
- Lund, H.; Thellufsen, J.Z.; Østergaard, P.A.; Sorknæs, P.; Skov, I.R.; Mathiesen, B.V. EnergyPLAN—Advanced analysis of smart energy systems. Smart Energy 2021, 1, 2666–9552. [Google Scholar] [CrossRef]
- Luo, S.; Hu, W.; Liu, W.; Xu, X.; Huang, Q.; Chen, Z.; Lund, H. Transition pathways towards a deep decarbonization energy system—A case study in Sichuan. Appl. Energy 2021, 302, 117570. [Google Scholar] [CrossRef]
- Lyu, Q.; Zhang, J.; Zhang, N.; Li, X.; Ge, S. Coupling balance analysis model of provincial integrated electricity-heat energy system with multi-type flexibility resources. Autom. Electr. Power Syst. 2022, 46, 95–102. [Google Scholar]
- Thekkufsen, J.; Lund, H. Energy saving synergies in national energy systems. Energy Convers. Manag. 2015, 103, 259–265. [Google Scholar] [CrossRef]
- Hagos, D.; Gebremedhin, A.; Zethraeus, B. Towards a flexible energy system—A case study for inland Norway. Appl. Energy 2014, 130, 41–51. [Google Scholar] [CrossRef]
- Pupo-Roncallo, O.; Campillo, J.; Ingham, D.; Hughes, K.; Pourkashanian, M. Large scale integration of renewable energy sources (RES) in the future Colombian energy system. Energy 2019, 186, 115805. [Google Scholar] [CrossRef]
- Zhao, G.; Guerrero, J.M.; Jiang, K.; Chen, S. Energy modelling towards low carbon development of Beijing in 2030. Energy 2017, 121, 107–113. [Google Scholar] [CrossRef]
- Liu, W.; Hu, W.; Lund, H.; Chen, Z. Electric vehicles and large-scale integration of wind power—The case of Inner Mongolia in China. Appl. Energy 2013, 104, 445–456. [Google Scholar] [CrossRef]
- Hong, L.; Lund, H.; Möller, B. The importance of flexible power plant operation for Jiangsu’s wind integration. Energy 2012, 41, 499–507. [Google Scholar] [CrossRef]
- You, W.; Geng, Y.; Dong, H.; Wilson, J.; Pan, H.; Wu, R.; Sun, L.; Zhang, X.; Liu, Z. Technical and economic assessment of RES penetration by modelling China’s existing energy system. Energy 2018, 165, 900–910. [Google Scholar] [CrossRef]
- Wiese, F.; Bramstoft, R.; Koduvere, H.; Alonso, A.P.; Balyk, O.; Kirkerud, J.G.; Tveten, Å.G.; Bolkesjø, T.F.; Münster, M.; Ravn, H. Balmorel open source energy system model. Energy Strategy Rev. 2018, 20, 26–34. [Google Scholar] [CrossRef]
- Cui, J. Electric Power Grid Capability to Accommodate Wind Power Research Based on Balmorel Model. Master’s Thesis, Department Electronic Engineering, Shandong University, Jinan, China, 2012. [Google Scholar]
- Chen, Y.-K.; Jensen, I.G.; Kirkerud, J.G.; Bolkesjø, T.F. Impact of fossil-free decentralized heating on northern European renewable energy deployment and the power system. Energy 2021, 219, 119576. [Google Scholar] [CrossRef]
- Zhang, N.; Jiang, H.; Du, E.; Zhuo, Z.; Wang, P.; Wang, Z.; Zhang, Y. An efficient power system planning model considering year-round hourly operation simulation. IEEE Trans. Power Syst. 2022, 37, 4925–4935. [Google Scholar] [CrossRef]
- Zhu, J.; Shi, K.; Li, Q.; Yu, R.; Xia, J.; Yuan, Y. Time-series production simulation and new energy consumption capacity evaluation considering power flow constraint of transmission network. Power Syst. Technol. 2022, 46, 1955–1975. [Google Scholar]
- Li, M.; Chen, G.; Dong, C.; Liang, Z.; Wang, W.; Fan, G. Research on power balance of high proportion renewable energy system. Power Syst. Technol. 2019, 43, 3979–3986. [Google Scholar]
- Lin, Z.; Yan, W.; Luo, X.; Wen, X.; Liu, H.; Tan, H.; Zhang, S. Annual electricity purchase strategy optimization of provincial power grid company based on hierarchical sequential production simulation. Power Syst. Technol. 2023, 47, 1931–1945. [Google Scholar]
- Rehman, A.; Liu, N.; Siddique, A.; Aslam, W.; Guo, B.; Shah, F.M. Optimal Scheduling and Multi-objective Assessment of CCHP System. In Proceedings of the 2018 International Conference on Power Generation Systems and Renewable Energy Technologies (PGSRET), Islamabad, Pakistan, 10–12 September 2018; pp. 1–5. [Google Scholar]
- Li, C.; Zhang, J.; Yao, D.; Li, X.; Ge, X.; Lyu, Q. Power balance method of provincial power system with complex generation structure. High Volt. Eng. 2023, 50, 1100–1110. [Google Scholar]
- Jiang, W.; Wang, B.; Wang, N.; Ding, K.; Yang, H. Research on power output characteristics of large-scale wind power base in multiple temporal and spatial scales. Power Syst. Technol. 2017, 41, 493–499. [Google Scholar]
- Hou, Y.; Fang, D.; Qi, J.; Li, H.; Niu, W.; Yang, T. Analysis on active power fluctuation characteristics of large-scale grid-connected wind farm and generation scheduling simulation under different capacity power injected from wind farms into power grid. Power Syst. Technol. 2010, 34, 60–66. [Google Scholar]
- Xu, Z.; Liu, Q.; Xu, L.; Mo, L.; Zhang, Y.; Zhang, X. Optimal Dispatching Rules for Peak Shaving of Cascaded Hydropower Stations in Response to Large-Scale New Energy Integration. Processes 2025, 13, 612. [Google Scholar] [CrossRef]
- Lyu, Q.; Cheng, Y.; Liu, L. Research on Coal-saving Performance and Optimal Configuration of Wind Power Heating Project Considering Wind Power Curtailment Characteristics. Proc. CSEE 2017, 37, 4699–4711. [Google Scholar]
- Li, J.; Li, X.; Zhang, N.; Zhang, Y.; Lyu, Q. Optimal dispatch model of electricity- heat integrated energy system considering reserved benefits of heat storage. Power Syst. Technol. 2021, 45, 3851–3858. [Google Scholar]
- Tie, Y.; Wen, Z. Review on the Collaborative Planning of Sources, Storage, and Loads in New Power Systems. Proc. CSEE 2025, 8, 1–20. [Google Scholar] [CrossRef]
- Li, X.; Wang, S.; Hui, D. Review and Prospect of Operation Control and Application Methods for Battery Energy Storage Systems. Power Syst. Technol. 2017, 41, 3315–3325. [Google Scholar]
- Zhang, Y.; Lv, Q.; Li, Y.; Zhang, N. Analysis of the operation flexibility of four electro-thermal decoupling retrofit schemes for thermal power plants. Autom. Electr. Power Syst. 2020, 44, 164–172. [Google Scholar]


| Scenario | Electric Storage | Heat Storage | Electric Boiler | Demand Response | Heating Relationship Between Power Plant and Boiler Station | Operation Strategy |
|---|---|---|---|---|---|---|
| Scenario A | no | no | no | no | independent | suggested |
| Scenario B | yes | yes | yes | no | independent | suggested |
| Scenario C | yes | yes | yes | yes | independent | suggested |
| Scenario D | yes | yes | yes | yes | combined | suggested |
| Scenario E | yes | yes | yes | no | independent | traditional |
| Scenario | Coal Power Utilization Hours (h) | Curtailed Renewable Energy Generation (GWh) | Curtailed Power | CO2 Emission (Mt) |
|---|---|---|---|---|
| Scenario A | 3494 | 23,206 | 20.07% | 23,116 |
| Scenario B | 3395 | 12,866 | 11.13% | 22,475 |
| Scenario C | 3380 | 11,848 | 10.25% | 22,384 |
| Scenario D | 3374 | 11,443 | 9.90% | 21,775 |
| Scenario E | 3410 | 13,676 | 11.83% | 22,564 |
| Scheme | Scenario A | Scenario B | Scenario C | Scenario D | Scenario E |
|---|---|---|---|---|---|
| Time | 106.3 s | 203.1 s | 186.7 s | 203.4 s | 174.7 s |
Disclaimer/Publisher’s Note: The statements, opinions and data contained in all publications are solely those of the individual author(s) and contributor(s) and not of MDPI and/or the editor(s). MDPI and/or the editor(s) disclaim responsibility for any injury to people or property resulting from any ideas, methods, instructions or products referred to in the content. |
© 2025 by the authors. Licensee MDPI, Basel, Switzerland. This article is an open access article distributed under the terms and conditions of the Creative Commons Attribution (CC BY) license (https://creativecommons.org/licenses/by/4.0/).
Share and Cite
Zhang, N.; Yi, J.; Hu, J.; Ge, S.; Chi, C.; Lyu, Q. Provincial Electricity–Heat Integrated Energy System Optimal Dispatching Model for Time-Series Production Simulation. Processes 2025, 13, 1886. https://doi.org/10.3390/pr13061886
Zhang N, Yi J, Hu J, Ge S, Chi C, Lyu Q. Provincial Electricity–Heat Integrated Energy System Optimal Dispatching Model for Time-Series Production Simulation. Processes. 2025; 13(6):1886. https://doi.org/10.3390/pr13061886
Chicago/Turabian StyleZhang, Na, Jin Yi, Jingwei Hu, Sheng Ge, Changyu Chi, and Quan Lyu. 2025. "Provincial Electricity–Heat Integrated Energy System Optimal Dispatching Model for Time-Series Production Simulation" Processes 13, no. 6: 1886. https://doi.org/10.3390/pr13061886
APA StyleZhang, N., Yi, J., Hu, J., Ge, S., Chi, C., & Lyu, Q. (2025). Provincial Electricity–Heat Integrated Energy System Optimal Dispatching Model for Time-Series Production Simulation. Processes, 13(6), 1886. https://doi.org/10.3390/pr13061886