1. Introduction
The rising energy demand compels researchers to find an innovative solution. Natural gas is the cleanest fossil fuel and omits fewer harmful compounds in the environment [
1]. Natural gas is most often utilized as a fuel for power plants, a feedstock in petrochemical industries, and a source of heat. Until 2030, natural gas usage is estimated to increase by 1.6% per year. Raw natural gas has many impurities that need to be removed before we can use it as a fuel. These impurities include CO
2, H
2S, N
2, etc. [
2,
3], and the main focus of the present research is CO
2 removal. CO
2 removal can be achieved using several techniques, which include absorption, adsorption, membrane, and cryogenic technology. Chemical solvent-based absorption is presently the most common method used by the industry [
4]. However, the process becomes less attractive as the feed carbon dioxide concentration increases because of increased solvent loading and high energy consumption for solvent recovery [
5]. Cryogenic separation has long been considered an effective method for CO
2 removal [
6,
7]. However, due to the widespread belief that large cooling duty precluded substantial study of this technique, it has received little attention in the literature. Cryogenic technology offers some advantages over other technologies, such as not requiring harmful chemicals, making it environmentally friendly [
8,
9]. Secondly, it can handle higher CO
2 percentages in raw natural gas, which cannot be treated using other technologies. For example, cryogenic processing can handle natural gas that contains very high CO
2 contents, i.e., up to 80% [
10].
With a share of 4.7 percent of the global natural gas reserves, Saudi Arabia has acquired large natural gas reserves of 297.6 trillion cubic feet (8.4 trillion cubic meters) [
11,
12]. These deposits are the sixth largest in the world, and the Ghawar region contains one-third of them. Some gas deposits are very polluted and would not be treated economically using established membranes, absorption and adsorption techniques, etc. [
13]. This natural gas can be converted into hydrogen, and the captured CO
2, which is present as a contaminant, can be used as feedstock for methanol production [
14,
15].
Following the successful synthesis of methanol, which utilizes hydrogen and the captured CO
2 from the purification processes, the next phase is the production of dimethyl ether (DME). In this stage, the methanol serves as a primary feedstock. DME synthesis is typically achieved via the dehydration of methanol, a reaction that can be efficiently catalyzed under certain temperatures and pressures using specific catalysts. DME is a significant building block for synthesizing significant chemicals, such as high-value oxygenated compounds and dimethyl sulfate. It is also used in shaving cream and hair spray as an aerosol propellant [
16].
Traditional natural-gas decarbonization and methanol/DME synthesis typically rely on energy-intensive amine scrubbing (3.5–4.0 GJ/ton CO
2 for solvent regeneration), corrosion-resistant equipment, and extensive solvent management, followed by multiple syngas conditioning and separation steps [
17]. In contrast, integrated cryogenic separation eliminates chemical solvents by directly producing methane- and CO
2-rich streams, the latter being fed into methanol synthesis and downstream dehydration to DME, thereby closing the carbon loop. Techno-economic studies show that, for high-CO
2 feeds (>50 mol%), cryogenic capture with heat integration can consume as little as 1.2–1.6 GJ per t of CO
2 removed [
8], while single-pass DME reactors deliver ~98% purity without recycling or distillation [
18]. This approach reduces CAPEX (by dispensing with amine units) and OPEX (via lower utility and chemical demands) and valorizes stranded high-CO
2 gas into low-carbon fuels.
The experimental study of the DME synthesis from methanol is well-established using several process conditions and catalysts [
19,
20]. However, according to the author’s best knowledge, the production of DME from contaminated natural gas as a feedstock using a COCO simulator is unavailable. The simulation study offers several advantages, as it can be used to conduct a parametric study, which is extremely difficult, time-consuming, and expensive in the context of an experimental study.
This research aims to develop and simulate an integrated process for converting highly CO2-contaminated natural gas into dimethyl ether (DME) using cryogenic separation, hydrogen production, methanol synthesis, and methanol dehydration. The goal is to demonstrate that this approach not only mitigates the challenges of processing low-quality natural gas but also enables carbon recycling by using captured CO2 as a feedstock. By employing the COCO simulator, this study evaluates the technical feasibility, product purity, and operational efficiency of this end-to-end transformation process.
2. Proposed DME Synthesis Process
The process concept is provided in
Figure 1.
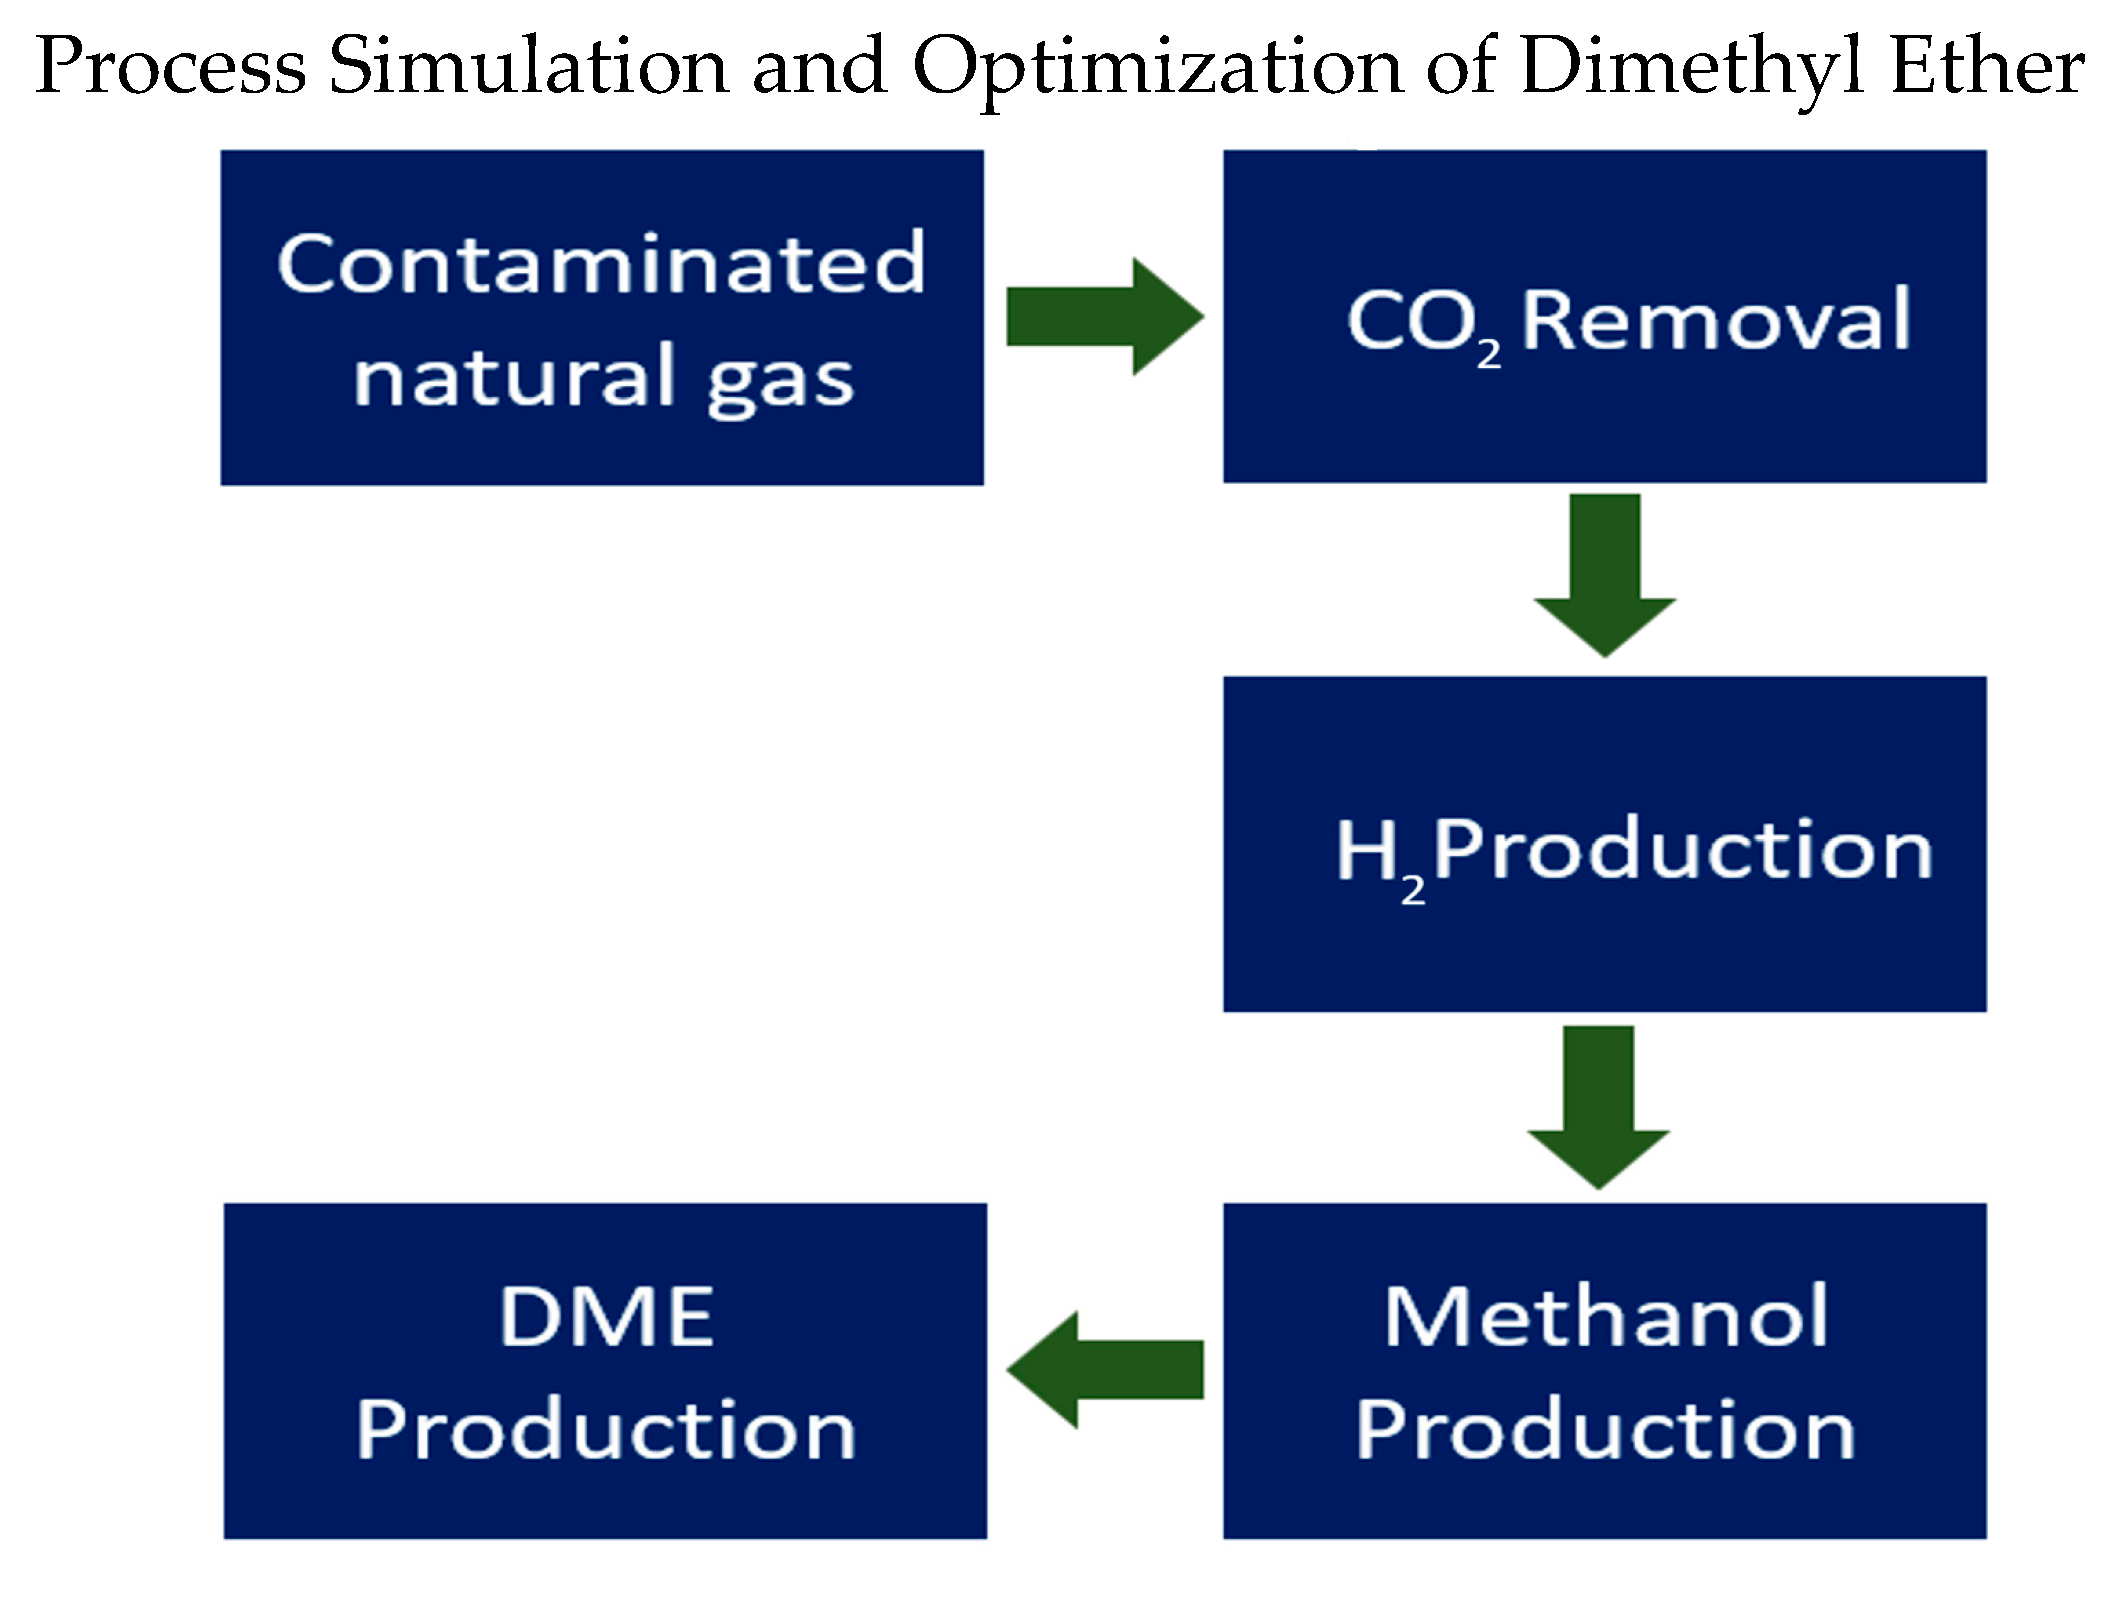
The proposed process follows a stepwise conversion of contaminated natural gas into dimethyl ether (DME), as illustrated in
Figure 1. Initially, carbon dioxide (CO
2) is removed from the gas stream using cryogenic separation techniques, which are effective for high CO
2 concentrations. The purified methane-rich stream then undergoes steam reforming to produce hydrogen (H
2). In the subsequent stage, hydrogen reacts with the captured CO
2 to produce methanol through a catalytic synthesis process. Finally, methanol is converted to DME via catalytic dehydration. This integrated approach utilizes CO
2 as a feedstock and enhances the system’s overall carbon efficiency.
COCO software (V 3.8.0.2) was used as a process simulator. The components used in the simulation were methane (CH4), carbon dioxide (CO2), carbon monoxide (CO), hydrogen (H2), water (H2O), nitrogen (N2), methanol (CH3OH), DME (CH3OCH3). The Peng–Robinson equation was selected as the property package.
The following reactions (Equations (1)–(7)) are involved in the whole process.
Steam reforming reaction for H
2 production
The optimization in this study was conducted using response surface methodology (RSM), with the objective of maximizing methane purity during the cryogenic separation stage. Temperature and pressure were selected as the key variables, with boundary conditions set between −120 °C and −90 °C and between 6 and 10 bar, respectively. These limits reflect practical cryogenic process constraints. While the current focus is on purity, future research will incorporate multi-objective optimization to assess trade-offs among methane purity, energy consumption, and economic feasibility, thereby enhancing the practical applicability of the process design.
3. Results and Discussion
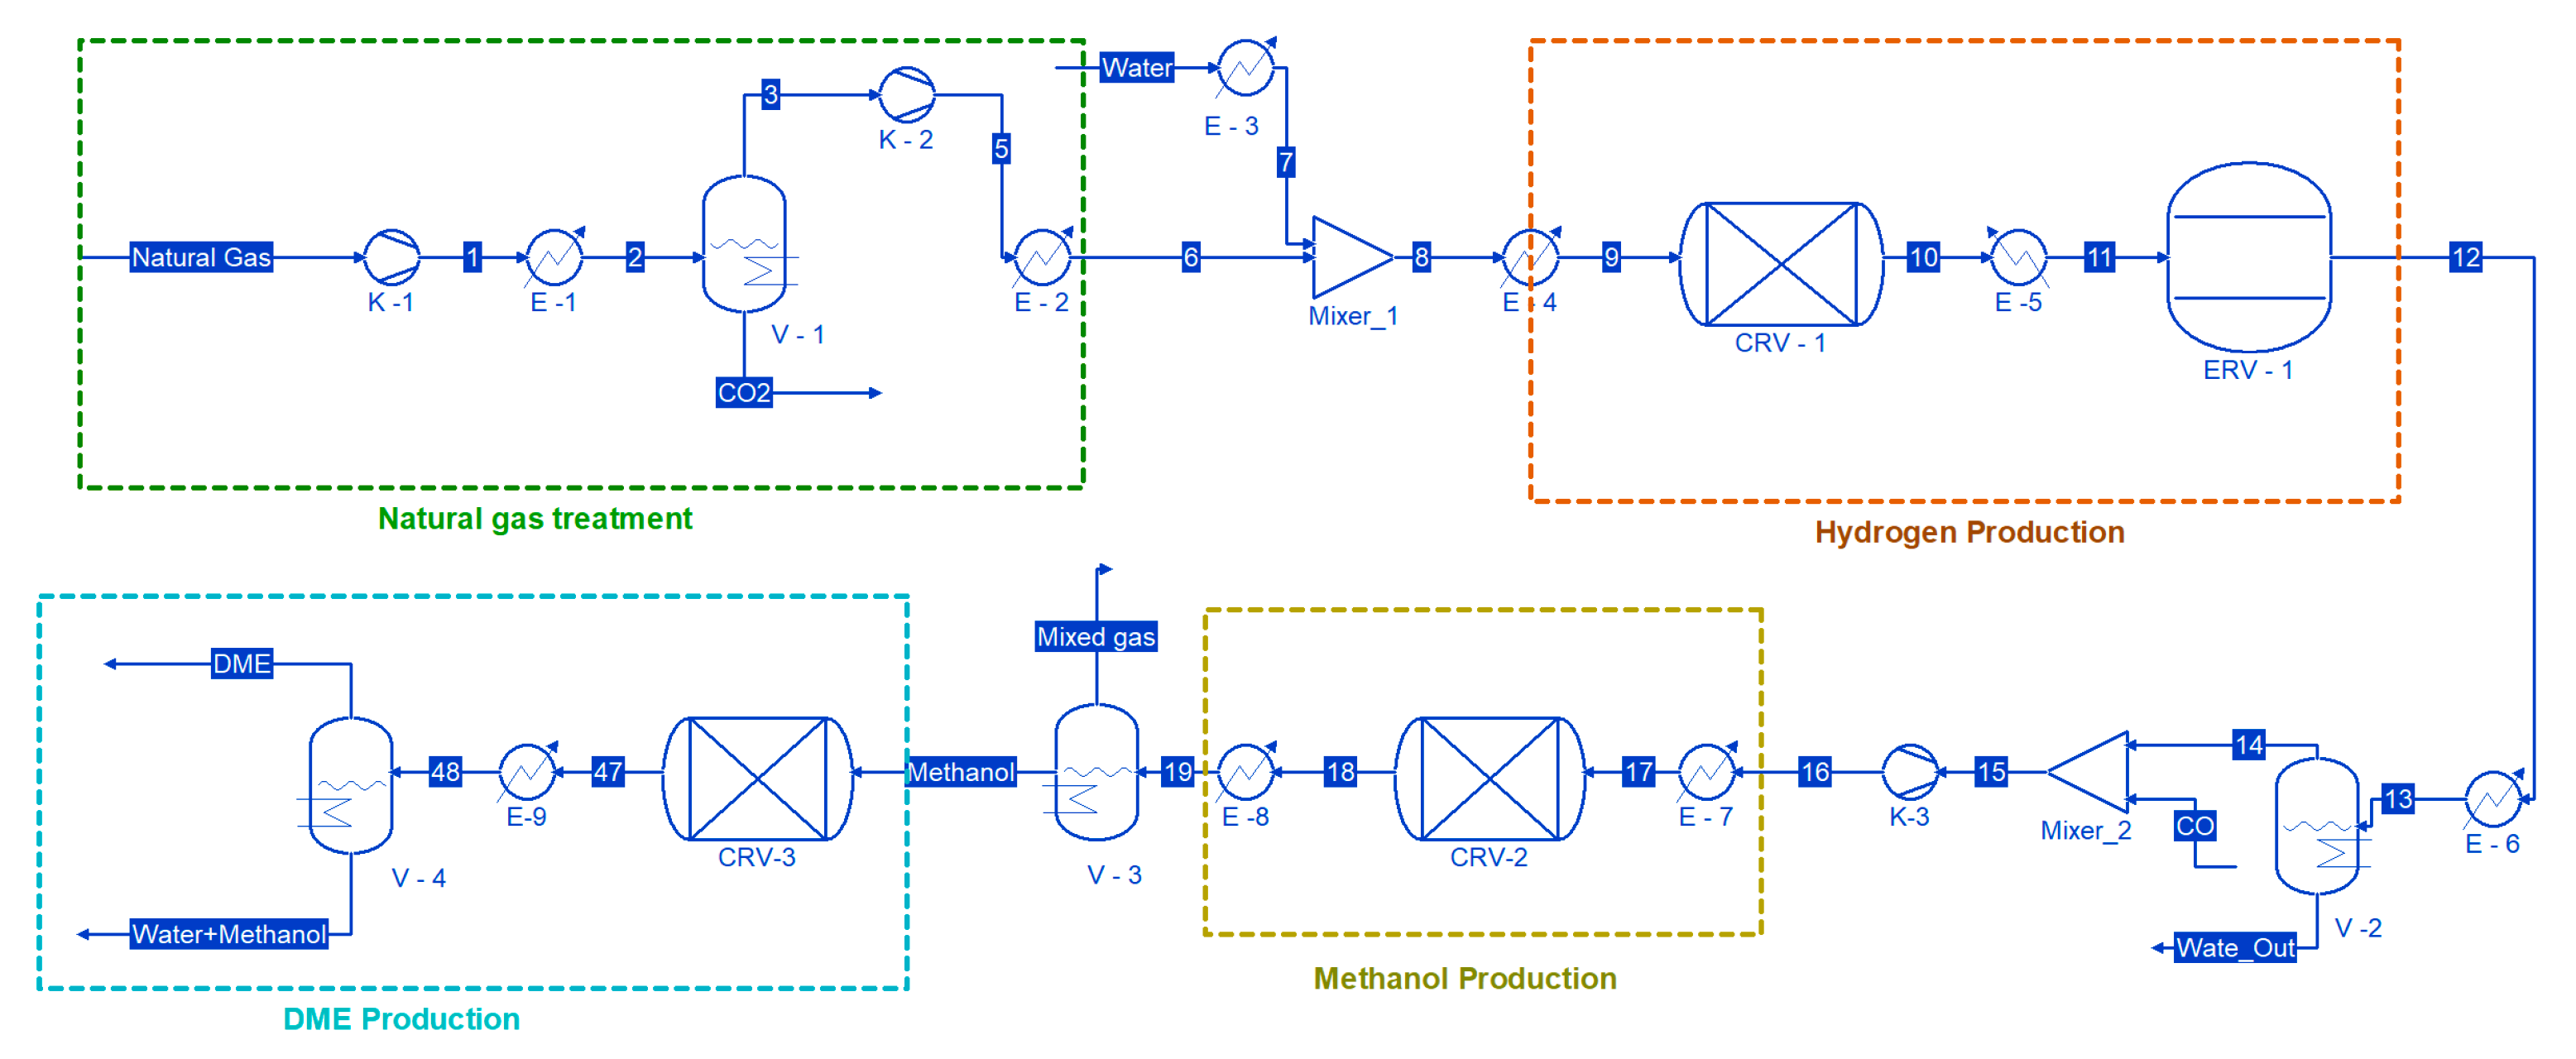
The simulation diagram is illustrated in
Figure 2. The overall process comprises four steps. The first step involves the removal of CO
2 from natural gas using cryogenic technology. The second step involves the production of hydrogen gas using steam reforming of methane. The third step includes the production of methanol from the hydrogen produced in the second step. The fourth step involves the synthesis of DME.
The feed comprised CH
4 and CO
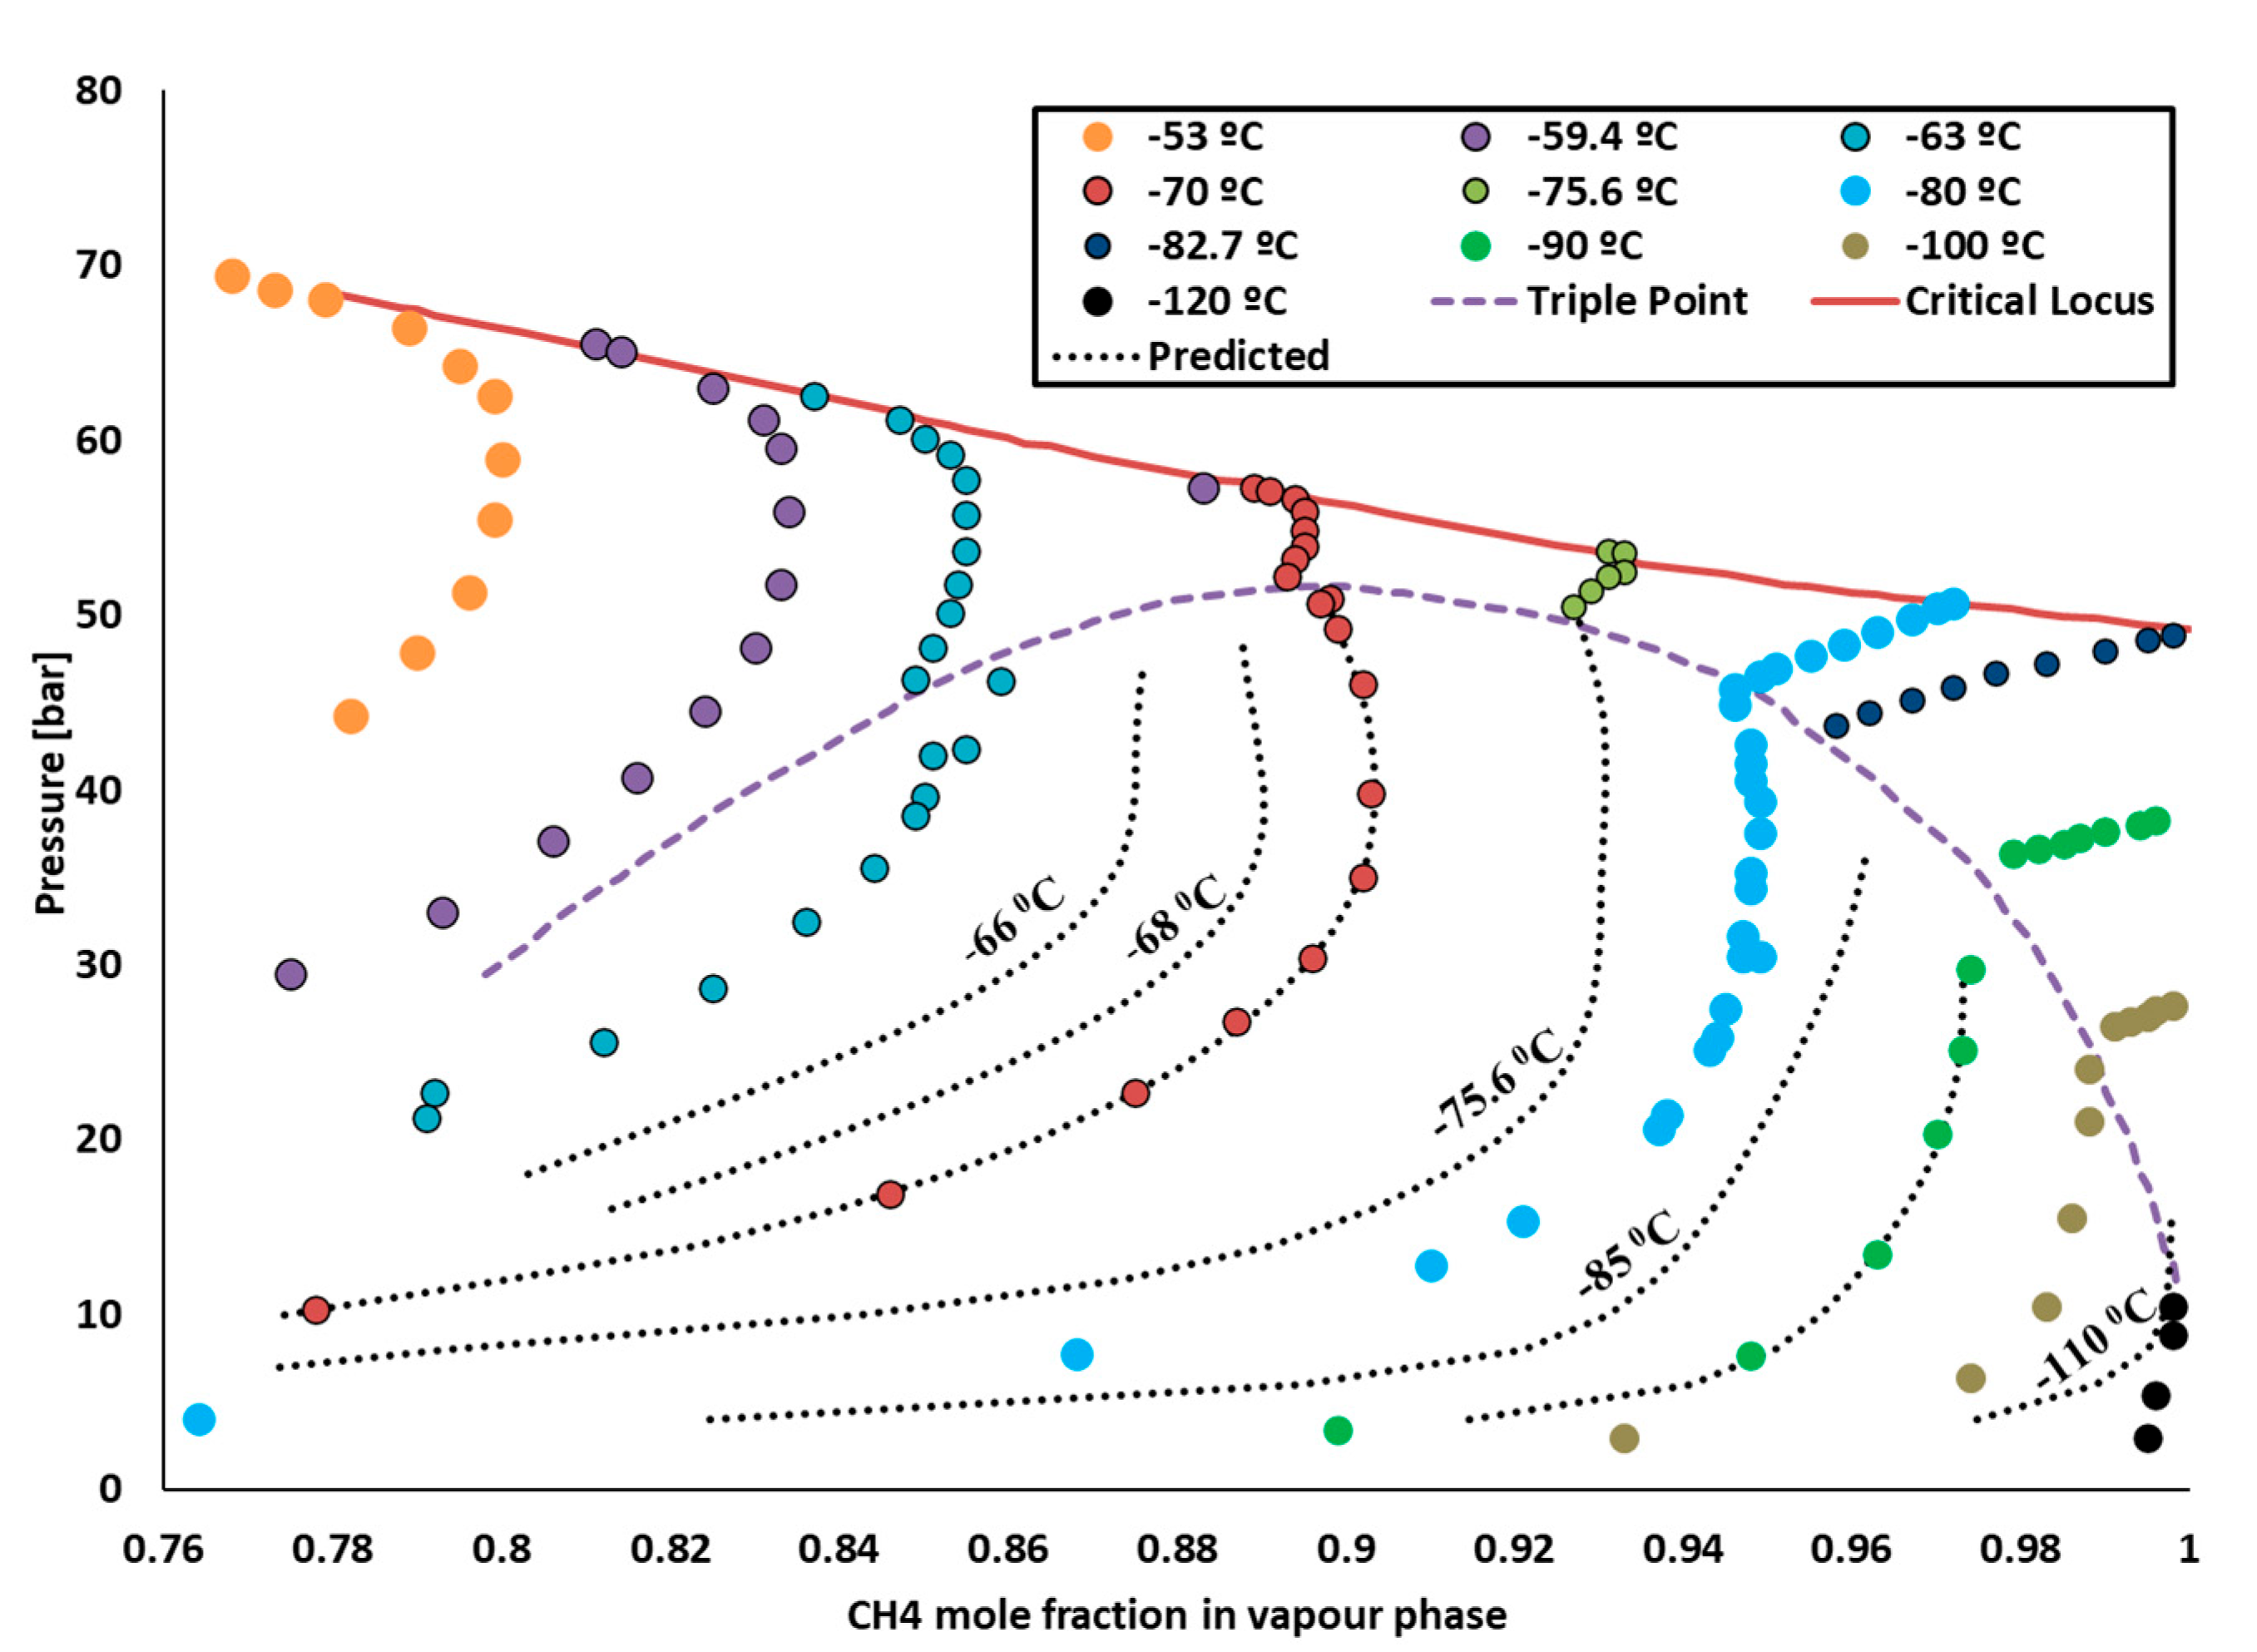
2, with mole fractions of 0.3 and 0.7, respectively. The feed at 1 bar and 25 °C entered in the first compressor, K-1, which increased the pressure up to 20 bar. The pressure increase resulted in the temperature increasing to 344.7 °C; therefore, a cooler was used to bring the temperature down to −90 °C. At this temperature, the mixture of CO
2 and CH
4 entered the two-phase region of phase equilibria, as shown in
Figure 3.
The liquid phase fraction of 0.85 and vapor phase fraction of 0.14 were achieved at this temperature and pressure. The liquid was mostly comprised of CO2, as its liquefaction temperature was higher than CH4. The composition of CO2 in the liquid phase was 0.80 and that of methane was 0.2, while the composition of methane in the vapor phase was 0.94. Once the feed entered the phase region, the effective separation between liquid and vapor was achieved using flash vessel V-1. The methane was further sent to compressor K-2 and cooler E-2 to increase the temperature and pressure to 34 bar and 870 °C. These higher temperature and pressure conditions are required for the steam reforming reaction. Water at 38 bars was entered in the E-3 heater to reach the temperature of 870 °C and entered in CRV-1. CRV-1 was a fixed conversion reactor. The temperature inside the reactor was 870 °C, and the conversion factor was 1.
The unit operation names, symbols, and conditions are provided in
Table 1. The process flow diagram includes key unit operations such as compressors, heaters, coolers, flash vessels, and reactors. Reactors are modelled as either fixed conversion or equilibrium types, based on the nature of the reactions. Each unit operates under defined temperature and pressure conditions relevant to industrial practice. While this study focuses on simulation rather than detailed equipment design, all major process steps are described to ensure clarity and reproducibility.
Stream 11 from CRV-1 then entered the second reactor, which was an equilibrium reactor (ERV-1). This reactor’s operating temperature and pressure were 378 °C and 28 bar. The product from ERV-1 was at a high temperature; therefore, it was in the vapor phase. The gasses were brought down at 50 °C, i.e., the gasses converted into a vapor–liquid phase. The liquid phase was mostly water, so a flash vessel (V-2) was used to separate the liquid and vapor phases. The liquid composition was 99.95% water, while the gas composition was 78% hydrogen, 21% CO
2, and a trace amount of water and CO. Now, these gases entered Mixer-2 along with a separate line of CO. The reactant then entered the third compressor, K-3, where the pressure reached up to 75 bar. Then, these gases entered CRV-2 for the production of methanol. The temperature and pressure of the rector were 75 bar and 150 °C. The reactor type was a fixed conversion reactor with a conversion factor of 0.5 for both reactions, which are provided in Equations (4) and (5). After the reactor, the resultant product entered the E-8 cooler to cool down the gases and liquify methanol. Once the product was converted into a liquid vapor phase, it entered the V-3 flash vessel. The liquid composition mole fraction was 0.66 methanol, 0.338 water, and 0.002 remaining components, including CH
4, CO
2, CO, H
2, and CH
3OH. There were two options: either the methanol and water mixture could be further separated using a distillation column or it could be used directly as a feedstock to produce DME. The detailed simulation results of the process model are tabulated in
Table 2.
The simulation results showed that neither option had any significant change in the DME final purity.
Figure 2 shows that the methanol and water mixture was fed to the conversion reactor CRV-3. The process conditions for CRV-3 were 25 °C and 1 bar. Once the DME synthesis was executed, the resultant product was cooled down to separate the unreacted methanol and DME. The final product purity of DME was obtained at about 97.98%. The main objective of this study was to produce DME using sour natural gas as a feedstock, so the parametric study was not performed. However, it can be observed that even without a parametric study, very high product purity was still obtained. Moreover, the liquid stream from the flash vessel V-4 consisted of 90.96% water, 9.02% methanol, and remaining traces of CH
4, CO
2, CO, and H
2. The water and methanol mixture can be further separated using a distillation column. As mentioned, the present research involves the proof of concept, so the energy integration and recycling of different streams were not considered. For example, instead of introducing a water stream in E-3, the water out from V2 can be utilized, and a similar approach can be used for the CO
2 stream coming out from V-1. It can also be observed from
Figure 2 that there are several heaters and coolers used in the flowsheet to provide heating or cooling duty. This equipment can also be integrated to conserve energy, and similarly, a heat exchanger can also be employed to minimize the energy. There are several streams that are coming out at very high temperatures; for example, the temperature of stream 10 was 870 °C, which was cooled down to 355 °C (stream 11). The heat energy of that stream can be used to increase the temperature of stream 7. Therefore, the author will conduct an economic analysis and energy integration in future work.
Overall, the simulation results confirm the technical feasibility of each step in the integrated process. Cryogenic CO2 removal achieves highly effective separation, producing a methane-rich stream with up to 99.07% purity, while also recovering CO2 for reuse. The reforming and methanol synthesis reactors operate within expected conversion ranges, with product compositions aligning well with literature-reported values. The final DME synthesis achieves nearly 98% purity without recycle or separation columns, demonstrating strong process efficiency. These outcomes collectively highlight the robustness of the proposed flowsheet and the potential for further optimization and scale-up.
4. Optimization Study
Optimizing the CO2 capture process is critical to enhancing the overall efficiency and output quality of the dimethyl ether (DME) synthesis from contaminated natural gas. The efficient removal of CO2 improves the purity of hydrogen produced and directly influences the quality of the resulting DME. This study employed response surface methodology (RSM), a robust statistical technique suited for developing predictive models and optimizing processes using limited experiments to achieve an optimal configuration. Initially, a model will be constructed using the Design of Experiments (DoE), focusing on temperature and pressure as the primary input variables while aiming to maximize methane purity as the output. This model will undergo rigorous adequacy testing to ensure it accurately represents the effects of operational conditions on CO2 capture. The model will be the basis for conducting detailed optimization analyses after successful validation. The ultimate goal of this optimization is to ascertain the most effective operational conditions for CO2 removal, thereby ensuring the production of high-purity hydrogen and, subsequently, superior-quality DME.
The optimization of CO
2 capture, critical for ensuring high-purity hydrogen for downstream DME synthesis, was conducted using a structured response surface methodology. The statistical analysis, focusing on the influences of temperature (A) and pressure (B) on methane purity, yielded significant insights, as shown in the
Table 3.
The model is statistically significant, with an F-value of 659.23 and an extremely low p-value, indicating that the model is highly predictive of the process conditions impacting methane purity. Specifically, the terms A (temperature) and B (pressure) showed profound impacts. Temperature had an F-value of 698.97, with a p-value of approximately (2.84 × 10⁻⁸), and pressure was even more influential, with an F-value of 1821.96 and a p-value of about (1.01 × 10⁻⁹). These results underline that temperature and pressure independently and significantly affect the purification process.
The interaction term (AB) and the quadratic terms (A2 and B2) also contributed to the model’s predictive capabilities. The interaction term, with an F-value of 118.28 and a p-value of approximately (1.23 × 10⁻⁵), suggests that the interplay between temperature and pressure also affects the CO2 capture efficiency. Additionally, the quadratic terms for temperature (A2) and pressure (B2) were significant, with p-values of 0.0037 and (1.10 × 10⁻⁷), respectively, indicating the nonlinear effects of these variables on the outcome.
The residuals of the model, important for assessing the fit and adequacy, are low, with a sum of squares at 0.000458, suggesting that the model adequately captures the variability in the data, with minimal unexplained noise. This detailed statistical analysis affirms the conditions that are optimal for CO2 capture. It provides a robust foundation for setting operational parameters in industrial applications to maximize hydrogen purity, thereby enhancing the overall quality of the produced DME.
Table 4 displays several important statistical metrics, enhancing the understanding of the model’s effectiveness in CO
2 capture optimization. The standard deviation of 0.0081 indicates minimal variability around the mean methane purity of 0.869, suggesting consistent model predictions under the experimental conditions. The model exhibits a high degree of fit, with an
R2 value of 0.9979, confirming that it explains nearly all the variability in the response. The adjusted
R2 of 0.9964, slightly lower than
R2, adjusts for the number of predictors and provides a more precise measure of model accuracy. The predicted regression constant of 0.9823, though lower than
R2, still indicates excellent predictive power, showing that the model is likely to perform well with new data. The coefficient of variation (CV) of 0.931% is very low, indicating the model’s reliability in terms of reproducibility and precision. Adequacy precision, a measure of signal-to-noise ratio, stands at 84.68, far exceeding the desirable threshold of 4, suggesting that the model can distinguish between design points effectively. These metrics underscore the robustness of the optimization model, demonstrating its suitability for practical application in improving CO
2 capture processes.
Figure 4 presents the normal probability plot of externally studentized residuals for the CO
2 capture optimization model. In this plot, residuals must align closely with the red reference line if the model errors follow a normal distribution. The points largely fall along this line, indicating that the residuals are approximately normally distributed. This suggests that the assumptions of normality and constant variance are satisfied, supporting the statistical validity of the model and reinforcing the reliability of the optimization results. The absence of significant outliers or systematic deviations confirms the model’s robustness for the range of input conditions tested.
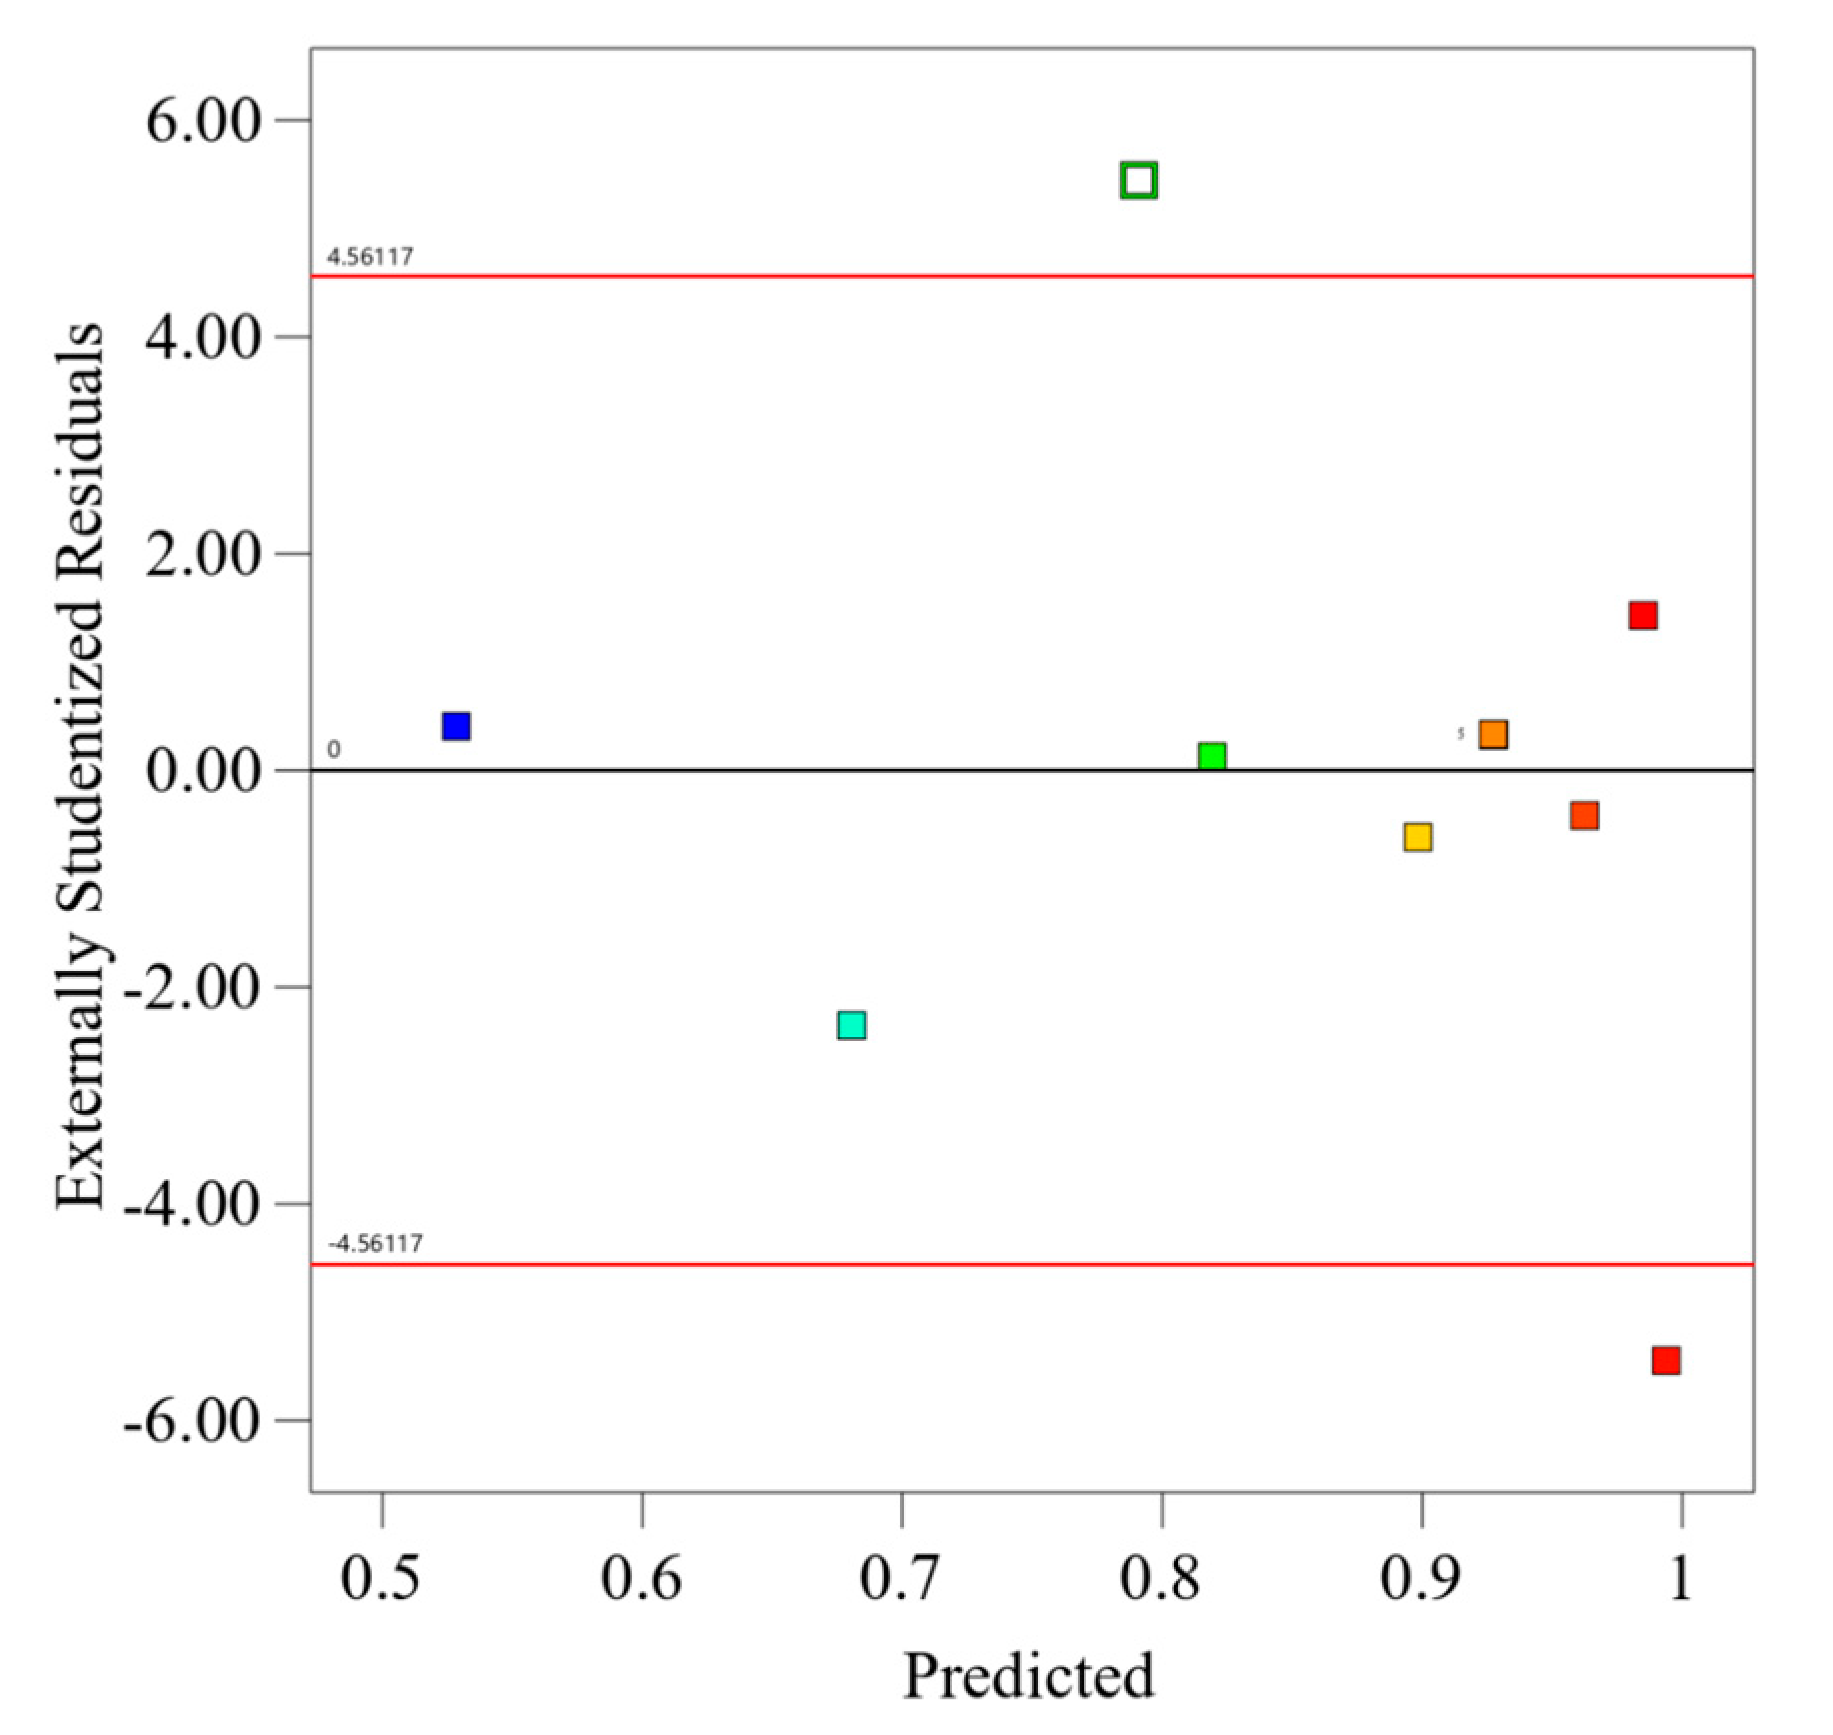
The “Residuals vs. Predicted” plot, which is shown in
Figure 5, is essential for assessing model fit in CO
2 capture optimization. This diagnostic tool plots externally studentized residuals against predicted methane purity values, color-coded from 0.53 to 0.99. Residuals ideally scatter randomly around the zero line, indicating unbiased predictions with consistent variance. However, significant deviations, marked by outliers at −4.56 and 4.56, suggest potential leverage points or unmodeled nonlinear effects. These observations highlight the need for further model investigation or possible data anomalies, guiding targeted improvements to enhance the model’s predictive accuracy.
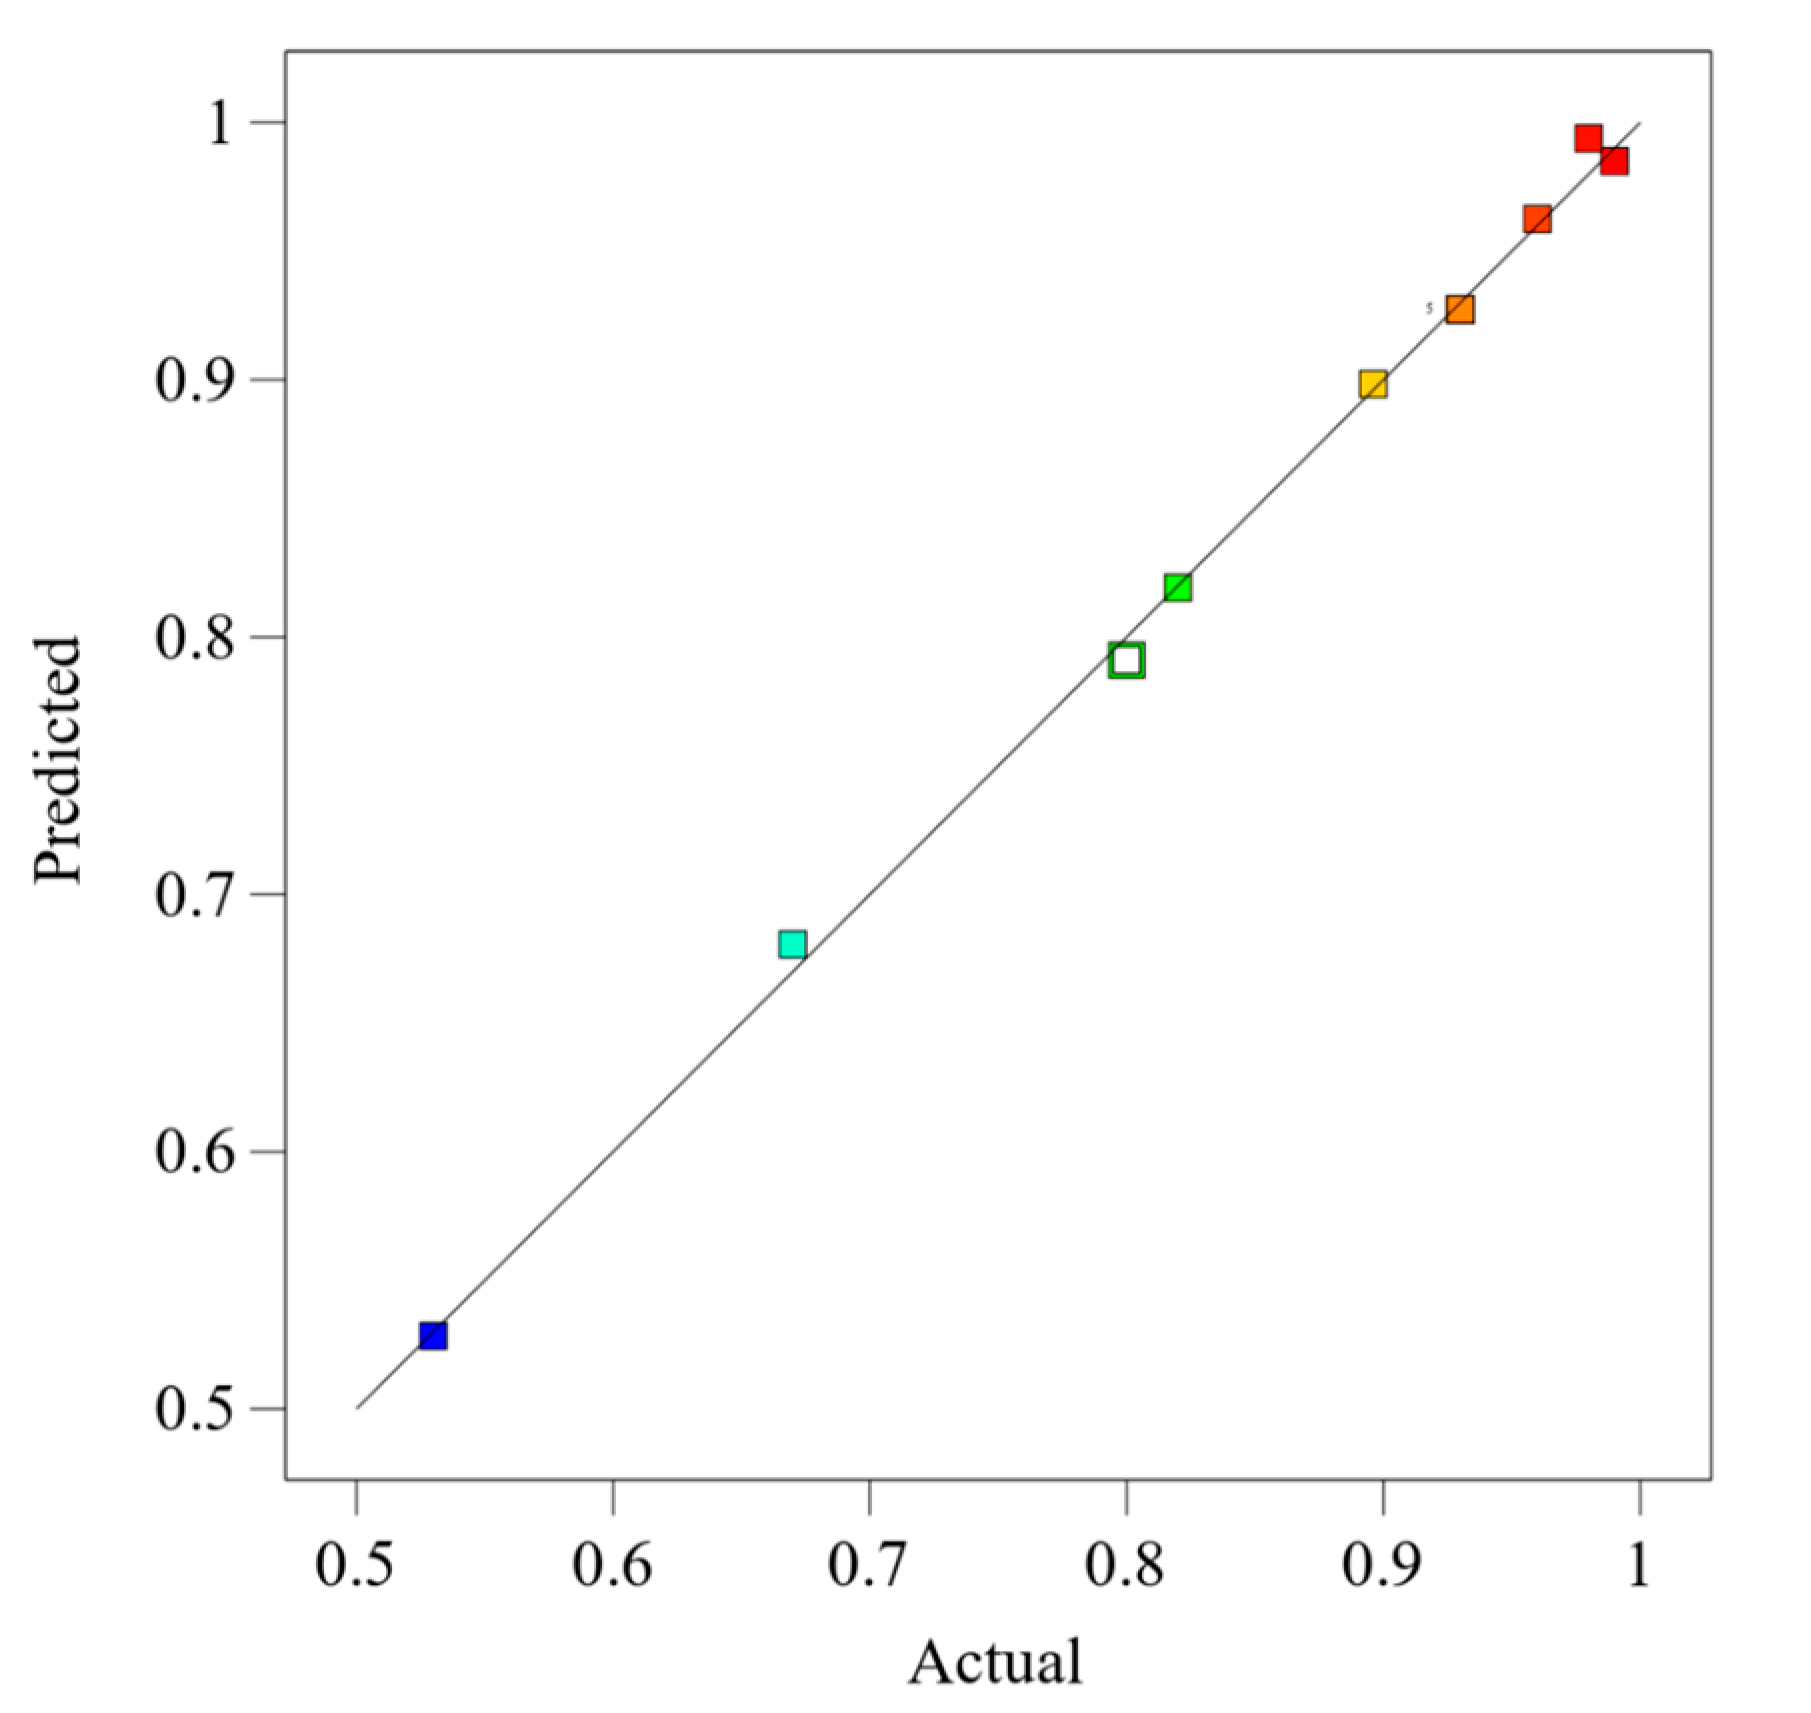
The model was tested using the result, which showed high accuracy, as shown in
Figure 6. The points on the plot are color-coded to represent varying levels of methane purity. The closer these points lie to the diagonal line, the more accurate the model’s predictions are relative to actual observed values. This plot shows a high degree of alignment along the diagonal, indicating that the model predicts methane purity accurately across the range tested. Points systematically arranged along the line without significant deviation suggest the model’s robustness, with higher purity levels (indicated by warmer colors) clustering near the upper right, affirming the model’s effectiveness at higher methane concentrations. This alignment supports the model’s utility in practical applications, where precise predictions of methane purity are crucial for process optimization.
Figure 7 shows the 3D response surface model for optimizing methane purity during CO
2 capture, constructed using response surface methodology (RSM). The plot visually explores the effects of temperature and pressure on methane purity, demonstrated through a color gradient from blue (low purity) to red (high purity). The surface itself represents the predicted methane purity, while the actual design points are shown as dots; those above the surface indicate experimental conditions where the actual methane purity exceeded predictions, and those below, where it fell short. This graphical representation helps identify optimal operating conditions and highlights the influence of temperature and pressure interactions on methane purity, thus guiding more informed decision-making for process adjustments.
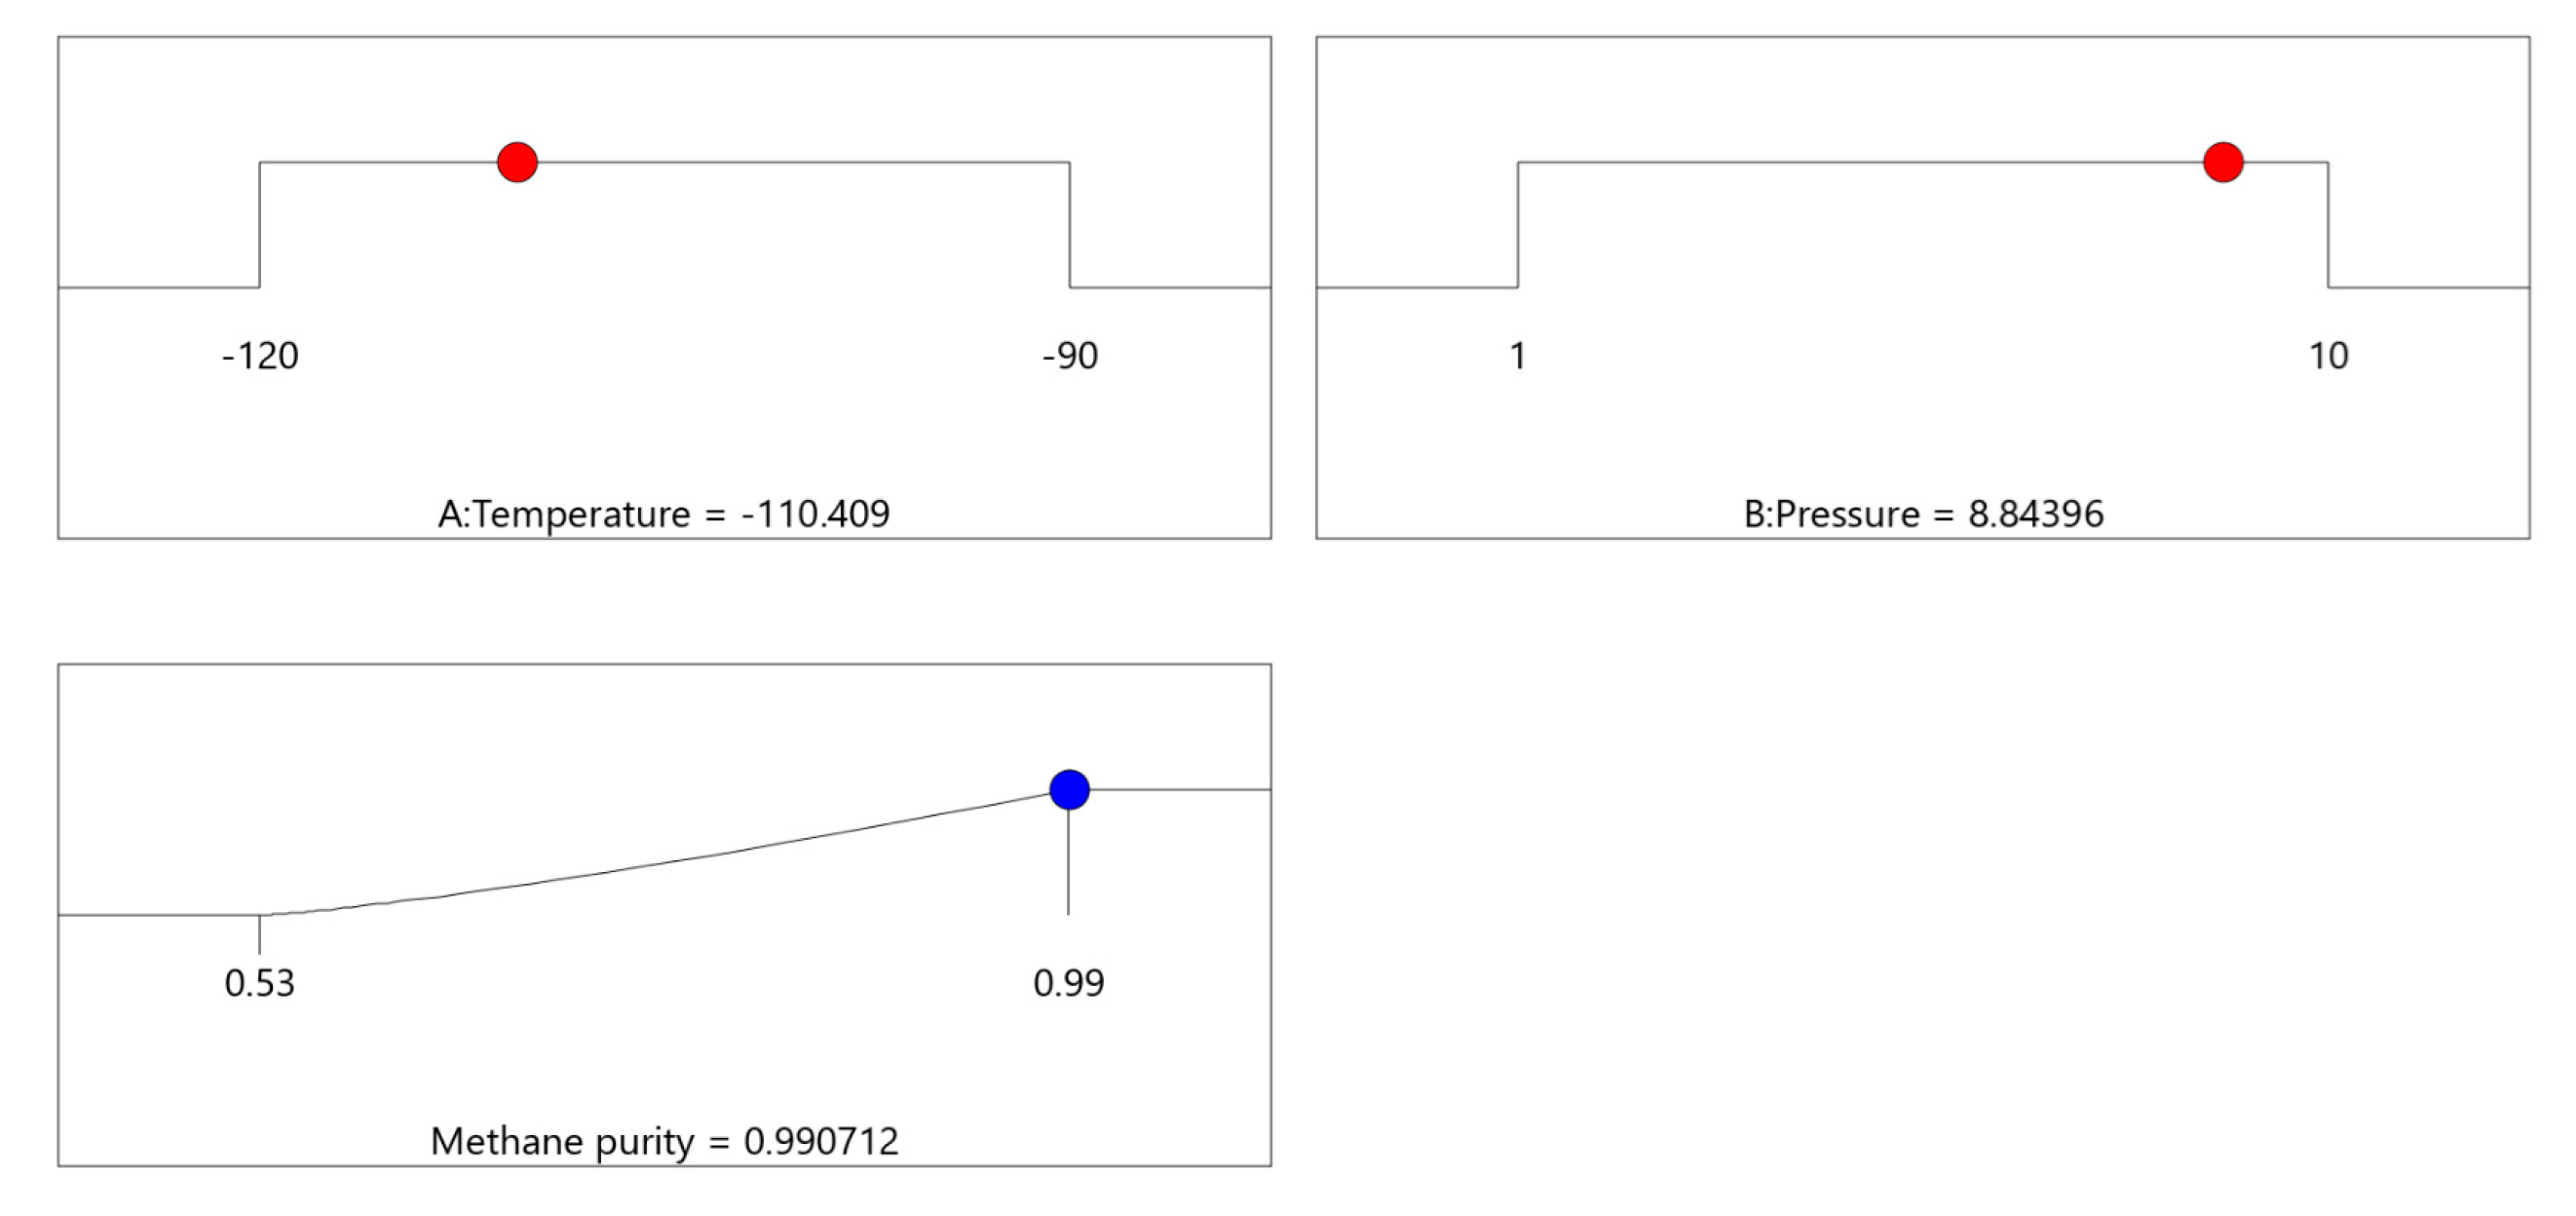
Figure 8 shows the results of optimizing CO
2 capture conditions focusing on maximizing methane purity. The first plot identifies the optimal temperature setting, −110.4 °C, under which methane purity is maximized. The second plot indicates the optimal pressure setting, 8.84 bar, to achieve similar outcomes. The third plot combines these settings, demonstrating that a methane purity of approximately 99.07% is attainable under these conditions, as shown by the blue dot at the high end of the purity spectrum. The response surface plots depict how adjustments in these variables correlate with changes in methane purity, providing a clear graphical representation of the process optimization. The overall desirability score of 1.000 confirms that these conditions are ideal for achieving the highest possible purity, making them crucial for process control and efficiency in industrial applications. Achieving 99.07% methane purity under these optimized cryogenic conditions highlights the strong separation efficiency of the process and its suitability for producing high-purity feed for downstream hydrogen and DME synthesis. The detailed explanation of all the statistical terms used in optimization analysis is compiled in
Table 5.
5. Conclusions
Contaminated natural gas must be treated before use, especially when the CO2 content is significantly high. Although such reserves are abundant, they are often underutilized due to the technical and economic challenges of purification. This study presents an integrated and cost-effective approach for utilizing highly contaminated natural gas containing up to 70% CO2 by converting it into valuable chemical products.
The process begins with cryogenic CO2 separation, avoiding energy-intensive chemical solvents. This method efficiently handles high CO2 concentrations and offers environmental benefits by eliminating solvent-related emissions. Optimized using response surface methodology, the cryogenic unit achieved a methane purity of approximately 99.07% under optimal conditions of −110.4 °C and 8.84 bar. These results were validated through model consistency and statistical analysis.
The purified methane stream was used for hydrogen production via steam reforming. The captured CO2 and generated hydrogen were then employed in methanol synthesis, achieving partial carbon recycling. Methanol was subsequently converted into dimethyl ether (DME), a clean-burning alternative fuel. A final product purity of up to 98% was achieved without additional tuning, demonstrating the robustness of the proposed configuration.
Unlike previous studies that treated CO2 solely as a contaminant, this work introduces a novel, fully integrated process that captures and utilizes CO2 as a feedstock for methanol and DME synthesis. This approach supports carbon circularity and reduces environmental impact. Furthermore, the process offers potential for heat integration, particularly by recovering energy from exothermic methanol and DME synthesis steps. Since CO2 is used rather than vented, the system generates minimal gaseous waste.
The simulation-based approach confirms technical feasibility and lays a solid foundation for future work. This will include detailed techno–economic analysis, heat integration strategies, and process scale-up to assess full industrial applicability.


