Abstract
The stress sensitivity of shale caprock permeability is a critical factor influencing the long-term security of CO2 geological sequestration systems. Substantial amounts of clay minerals and nanoscale pore structures reduce shale permeability by trapping water films and throat contraction. Conventional permeability models, which are based on homogeneous pore compressibility, tend to overestimate the contribution of non-effective pores to water mobility, resulting in significant inaccuracies in predicting stress-dependent permeability. Therefore, this study conducted NMR–seepage experiments under varying confining pressures on four shale samples with distinct lithologies to investigate pore compression deformation and permeability stress sensitivity. The T2 cutoff was subsequently determined through displacement tests to distinguish seepage and adsorption pores. Two distinct constitutive models were calculated with respective compressibility coefficients. Finally, the effects of seepage and adsorption pores on shale permeability stress sensitivity were investigated. The results indicate the following. (1) Increasing confining pressure from 15 to 19 MPa reduces porosity by 14.2–39.6%, with permeability exhibiting a significant decline of 35.6–67.8%. (2) Adsorption pores, stabilized by bound water films of clay minerals, exhibit limited closure under stress. In contrast, seepage pores, influenced by brittle minerals, experience significant deformation, which predominantly contributes to permeability decline. (3) A dual-spring model, differentiating the compressibility of seepage and adsorption pores, reduces prediction errors by 92–96% compared to traditional models. These results highlight that neglecting pore-type-specific compressibility leads to overestimated permeability in heterogeneous shale, with critical implications for optimizing CO2 storage integrity and hydrocarbon recovery strategies.
1. Introduction
The extensive reliance on fossil fuels has significantly contributed to global climate change, environmental pollution, ecosystem degradation, and threats to human health, thereby severely restricting the advancement of sustainable development worldwide [1,2]. The extraction of unconventional oil and gas, along with CO2 geological storage, can effectively mitigate the negative environmental impacts of fossil fuels and play a crucial role in ensuring global energy security and achieving sustainable development [3,4]. Shale serves not only as a reservoir for hydrogen-sourced oil and gas but also as a cap rock for CO2 geological sequestration [5]. The permeability characteristics of shale are crucial for both the recovery efficiency of shale gas and the long-term security of CO2 sequestration [6,7]. However, engineering activities during extraction and sequestration inevitably induce geological stress changes, which can significantly alter the shale permeability characteristics [8,9]. Compared to conventional reservoir media such as sandstone and coal, tight shale exhibits significantly lower porosity and permeability characteristics. Its multiscale pore–throat system demonstrates pronounced heterogeneity with complex topological structures and weak connectivity [10]. Notably, clay minerals within the shale matrix not only induce wettability heterogeneity at pore surfaces but also amplify stress sensitivity through hydration and swelling effects [11,12]. Experimental studies reveal that shale samples with comparable porosity and permeability parameters can manifest distinct permeability behaviors due to variations in pore size distribution and fluid phase arrangement [13].
Li et al. [14] conducted a systematic investigation into the pore–throat structure and seepage mechanisms of shale. The analytical results demonstrate that the pore structure of shale exhibits pronounced multi-scale heterogeneity, characterized by large pores interconnected through narrow pore throats. Although pore throats constitute a relatively minor fraction of the total pore volume, their influence on permeability is disproportionately significant. This phenomenon occurs because only those macropores interconnected by continuous pore–throat networks can establish effective flow pathways, while isolated macropores contribute negligibly to fluid mobility [15]. Chang et al. [16] demonstrated that pore connectivity in shale is inherently weak, primarily due to high clay content and complex pore–throat morphology. Their findings further indicated that permeability is predominantly governed by larger pore throats, which serve as critical conductive pathways. Supporting this observation, Cheng et al. [17] revealed that an increased clay mineral content reduces pore volume compressibility, thereby influencing reservoir storage and flow dynamics.
Tian et al. [18] characterized the sensitivity of permeability stresses considering the effect of the boundary layer and critical throat radius. The results show that the permeability stress sensitivity increases when the throat distribution becomes narrower or the thickness of the boundary layer increases. Zheng et al. [19] compared the mechanism of effective stress on the porosity and permeability of low-permeability core samples based on the two-part Hooke model and showed that the porosity of low-permeability rocks changes less with the increase in effective stress, but permeability decreases significantly. Pimient et al. [20] measured drained and undrained compression coefficients and found that the effect of fluid bulk modulus was observed under undrained conditions but not under drained. Hou et al. [21] proposed a new two-pore model based on low-field nuclear magnetic resonance (LF-NMR) experiments to divide the total pore volume into movable and immovable pore volumes. Different pore compressibility models are proposed to determine the sensitivity of stresses. In summary, these pore–throat structures and clay minerals lead to significant differences in the compressibility of connected and ineffective seepage pores in shales, which in turn have a significant impact on the evolution of permeability. While previous studies [19,22] predominantly assumed homogeneous pore compressibility, this approach fails to capture the bimodal compressibility responses observed in shale. This study introduces a dual-spring constitutive model that characterizes the compression responses of pores of different scales. This advancement addresses the critical issue of modeling stress-dependent permeability for heterogeneous media. Accurately characterizing the dynamic evolution law of permeability in shale caps has become a critical challenge in the security assessment of unconventional oil and gas development and CO2 sequestration projects.
Therefore, in this study, seepage tests under different confining pressures were carried out based on NMR, and the effects of shale permeability and pore structure under confining pressure were investigated. Then, the T2 cut-off value was determined by displacement tests. According to the T2 cutoff value, the pores were divided into two parts: seepage pores and adsorption pores. Seepage pores enable fluid flow (T2 ≥ T2 cutoff), while adsorption pores trap bound fluids (T2 < T2 cutoff), classified by NMR relaxation thresholds. The stress sensitivity coefficients of seepage pores and adsorption pores were calculated separately. Finally, a novel stress-sensitive model for permeability was established based on the dual-spring compression model. It is proven that the permeability model is beneficial to forming a deeper understanding of the variation in permeability characteristics of low-permeability shale concerning stress by comparing it with experimental data.
2. Materials and Methodology
2.1. Sampling Locations and Mineral Composition
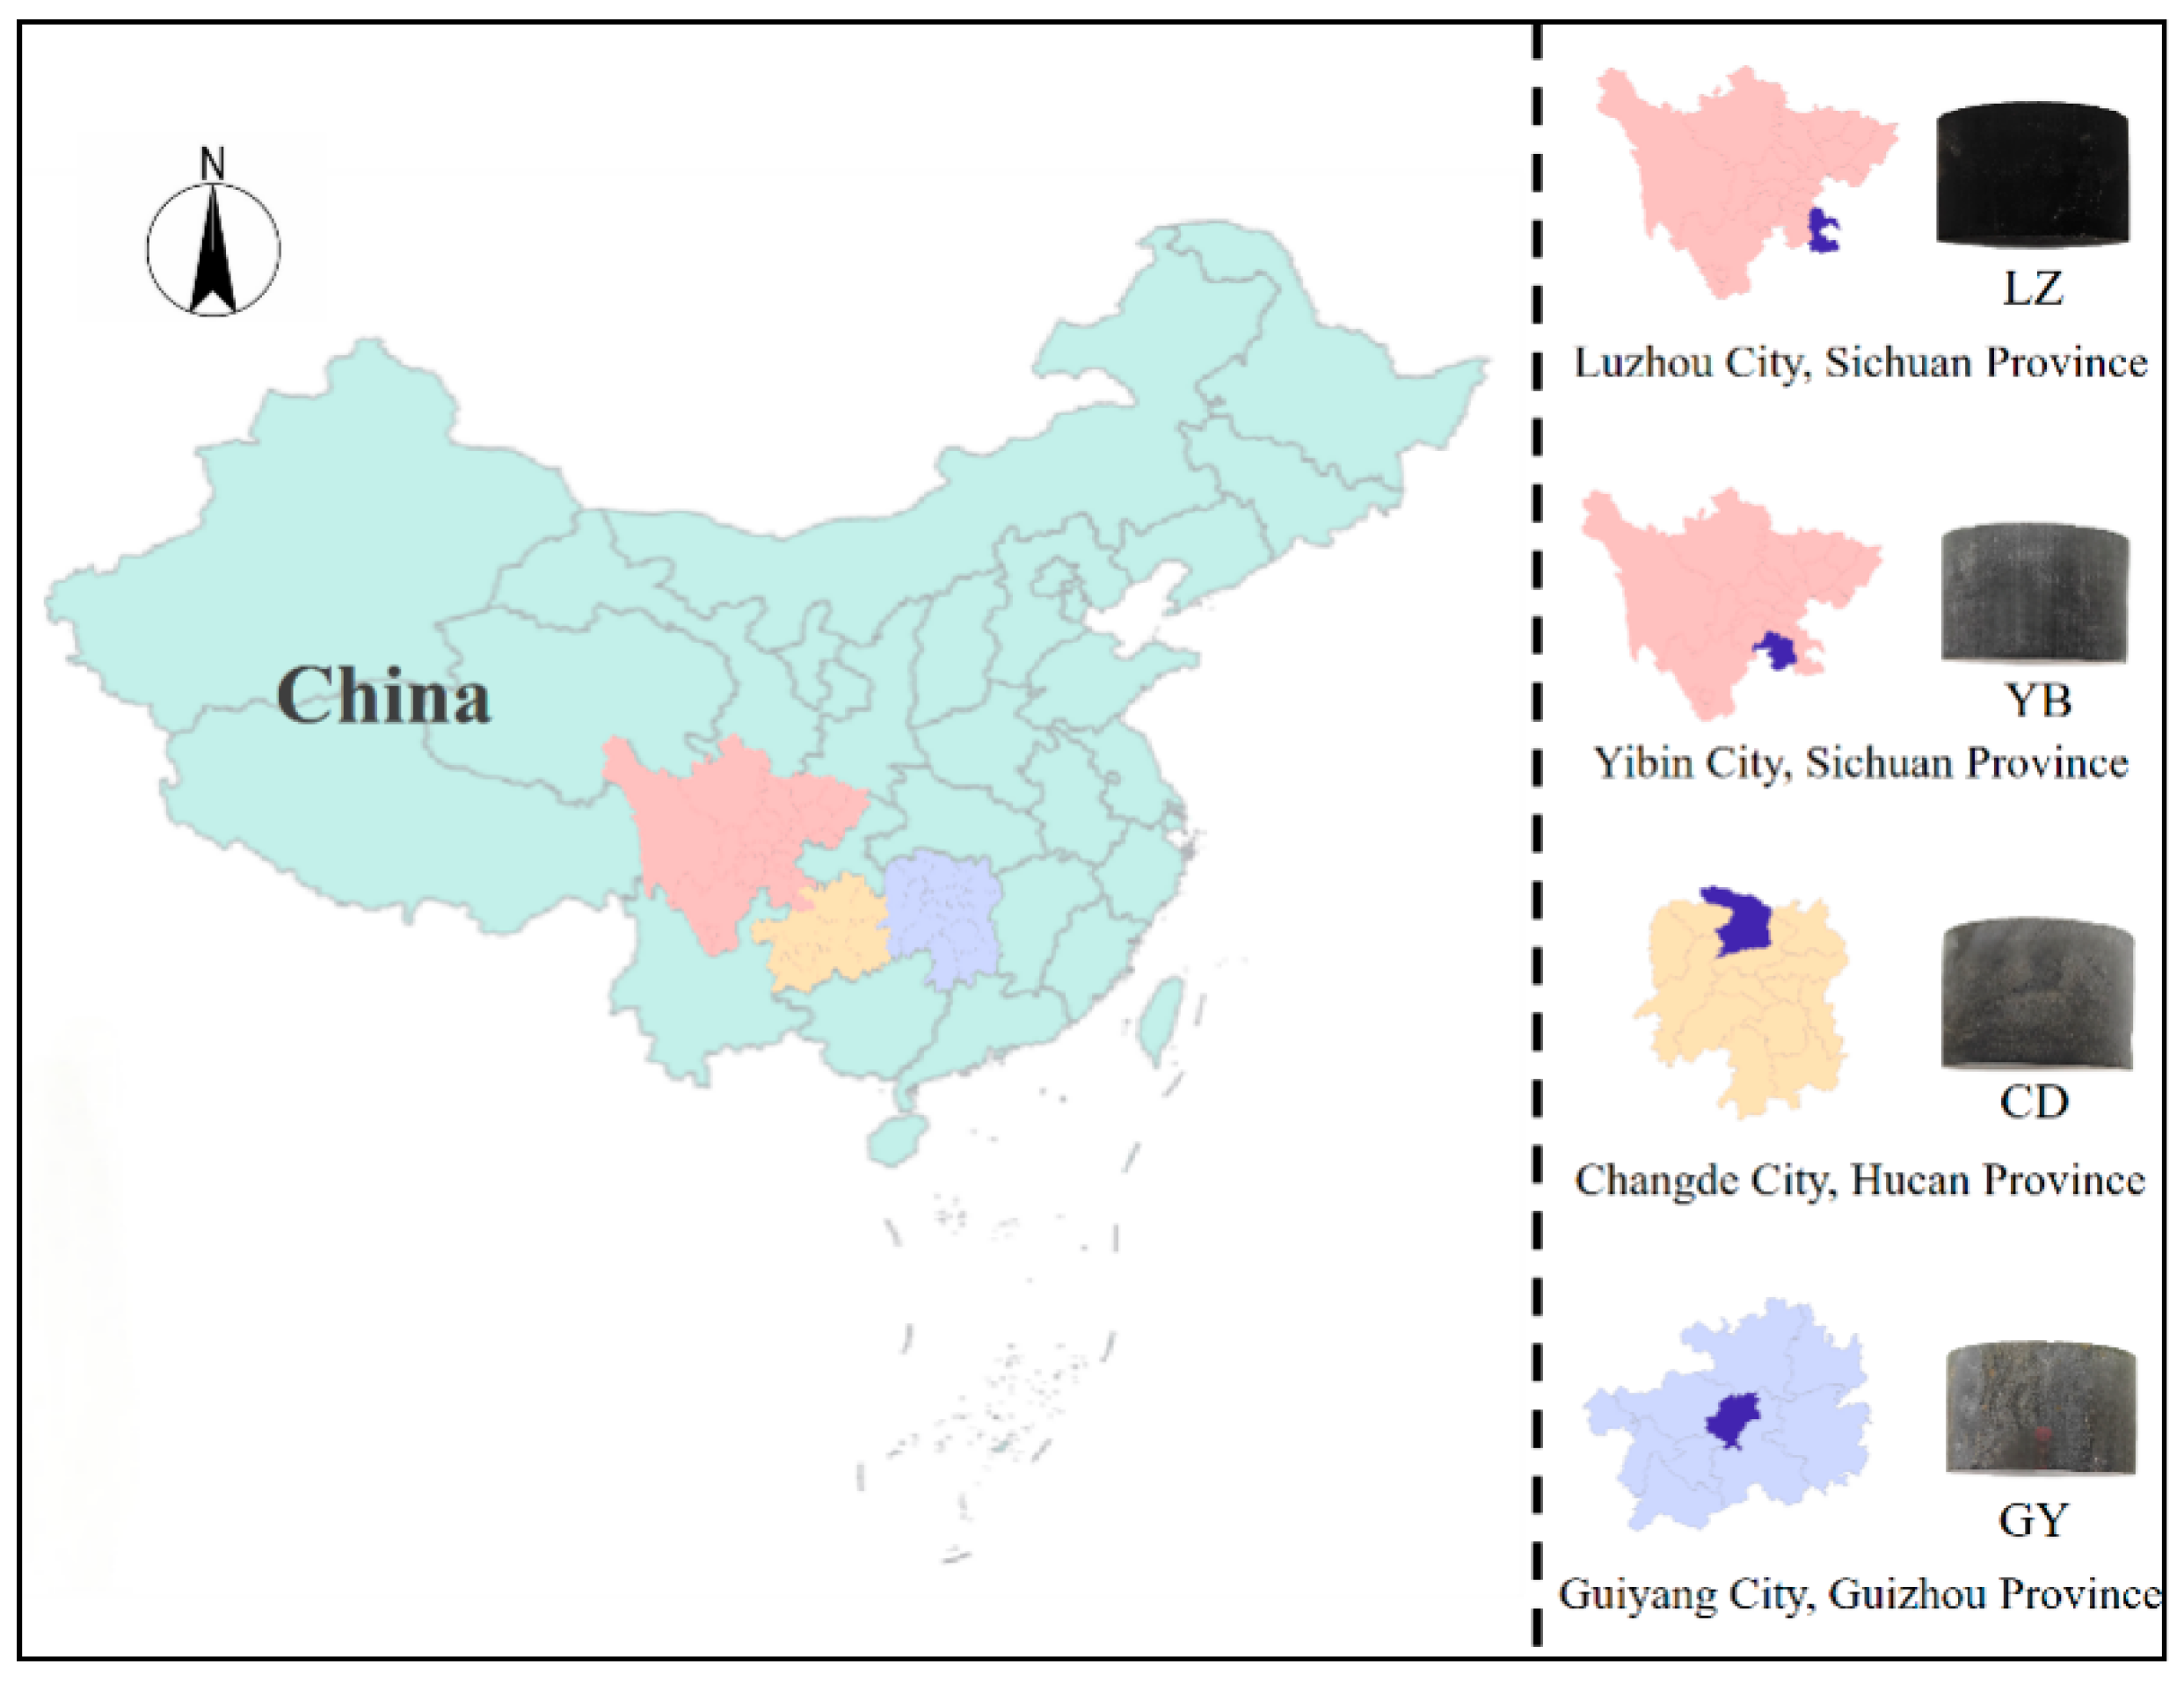
The study employed four shale samples sourced from geographically distinct regions across China: Changde City in Hunan Province, Guiyang City in Guizhou Province, and Yibin City, and Luzhou City in Sichuan Province (Figure 1). These core samples were precision-machined into cylindrical samples (25 mm diameter × 20 mm height) and both end surfaces were polished to ensure planar geometry.
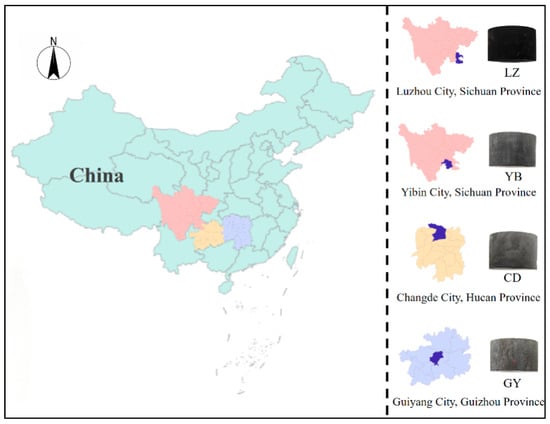
Figure 1.
Locations of shale samples.
Mineralogical characterization was conducted using X-ray diffraction (XRD) analysis, with quantitative phase composition data summarized in Table 1. The XRD results highlight pronounced regional variations in mineralogical composition. Samples from Luzhou (LZ) and Yibin (YB) exhibit quartz-dominated matrices and minimal clay, whereas samples from Changde (CD) and Guiyang (GY) exhibit a carbonate-dominated mineral assemblage, with minimal quartz.

Table 1.
Mineralogical composition in shale samples.
2.2. Low-Field Nuclear Magnetic Resonance
Nuclear magnetic resonance (NMR) is a quantum mechanical phenomenon arising from the interaction between nuclear spin magnetic moments and external static magnetic fields. When subjected to a uniform magnetic field, nuclei with non-zero spin angular momentum exhibit characteristic resonance frequencies determined by their gyromagnetic ratios (γ). This frequency selectivity enables targeted excitation of specific nuclei through precisely tuned radiofrequency pulses, forming the basis for non-invasive characterization of hydrogen-bearing fluids in porous media. In geological applications, low-field NMR techniques leverage the transverse relaxation time (T2) of hydrogen nuclei to probe pore-scale structures in sedimentary rocks. The T2 distribution directly correlates with pore size distribution, as it is governed by three simultaneous relaxation mechanisms:
where T2B represents the bulk relaxation time, T2S denotes the surface relaxation time, and T2D corresponds to the diffusion relaxation time. Under the conditions of complete water saturation, a uniform magnetic field, and minimized echo time, the bulk relaxation and diffusion relaxation terms can be neglected. Thus, the observed transverse relaxation time is dominated by surface relaxation, and the Equation (1) simplifies to
where ρ2 is the surface relaxation rate of the pore; S/V is the pore-specific surface area; Fs is the shape factor, which varies with the pore shape; and r is the pore radius.
NMR measurements provide T2 relaxation distributions under varying confining pressures. Since T2 relaxation is inversely proportional to pore size, these distributions directly reflect the pore-size distribution. In our stress-sensitive NMR experiments, we utilized water as the sole fluid to avoid interference from other hydrogen-containing substances. Consequently, the T2 distributions accurately represent changes in fluid distribution and pore volume, elucidating how porosity and permeability vary with confining pressure [23].
2.3. Experimental Equipment and Procedure
2.3.1. Experimental Equipment
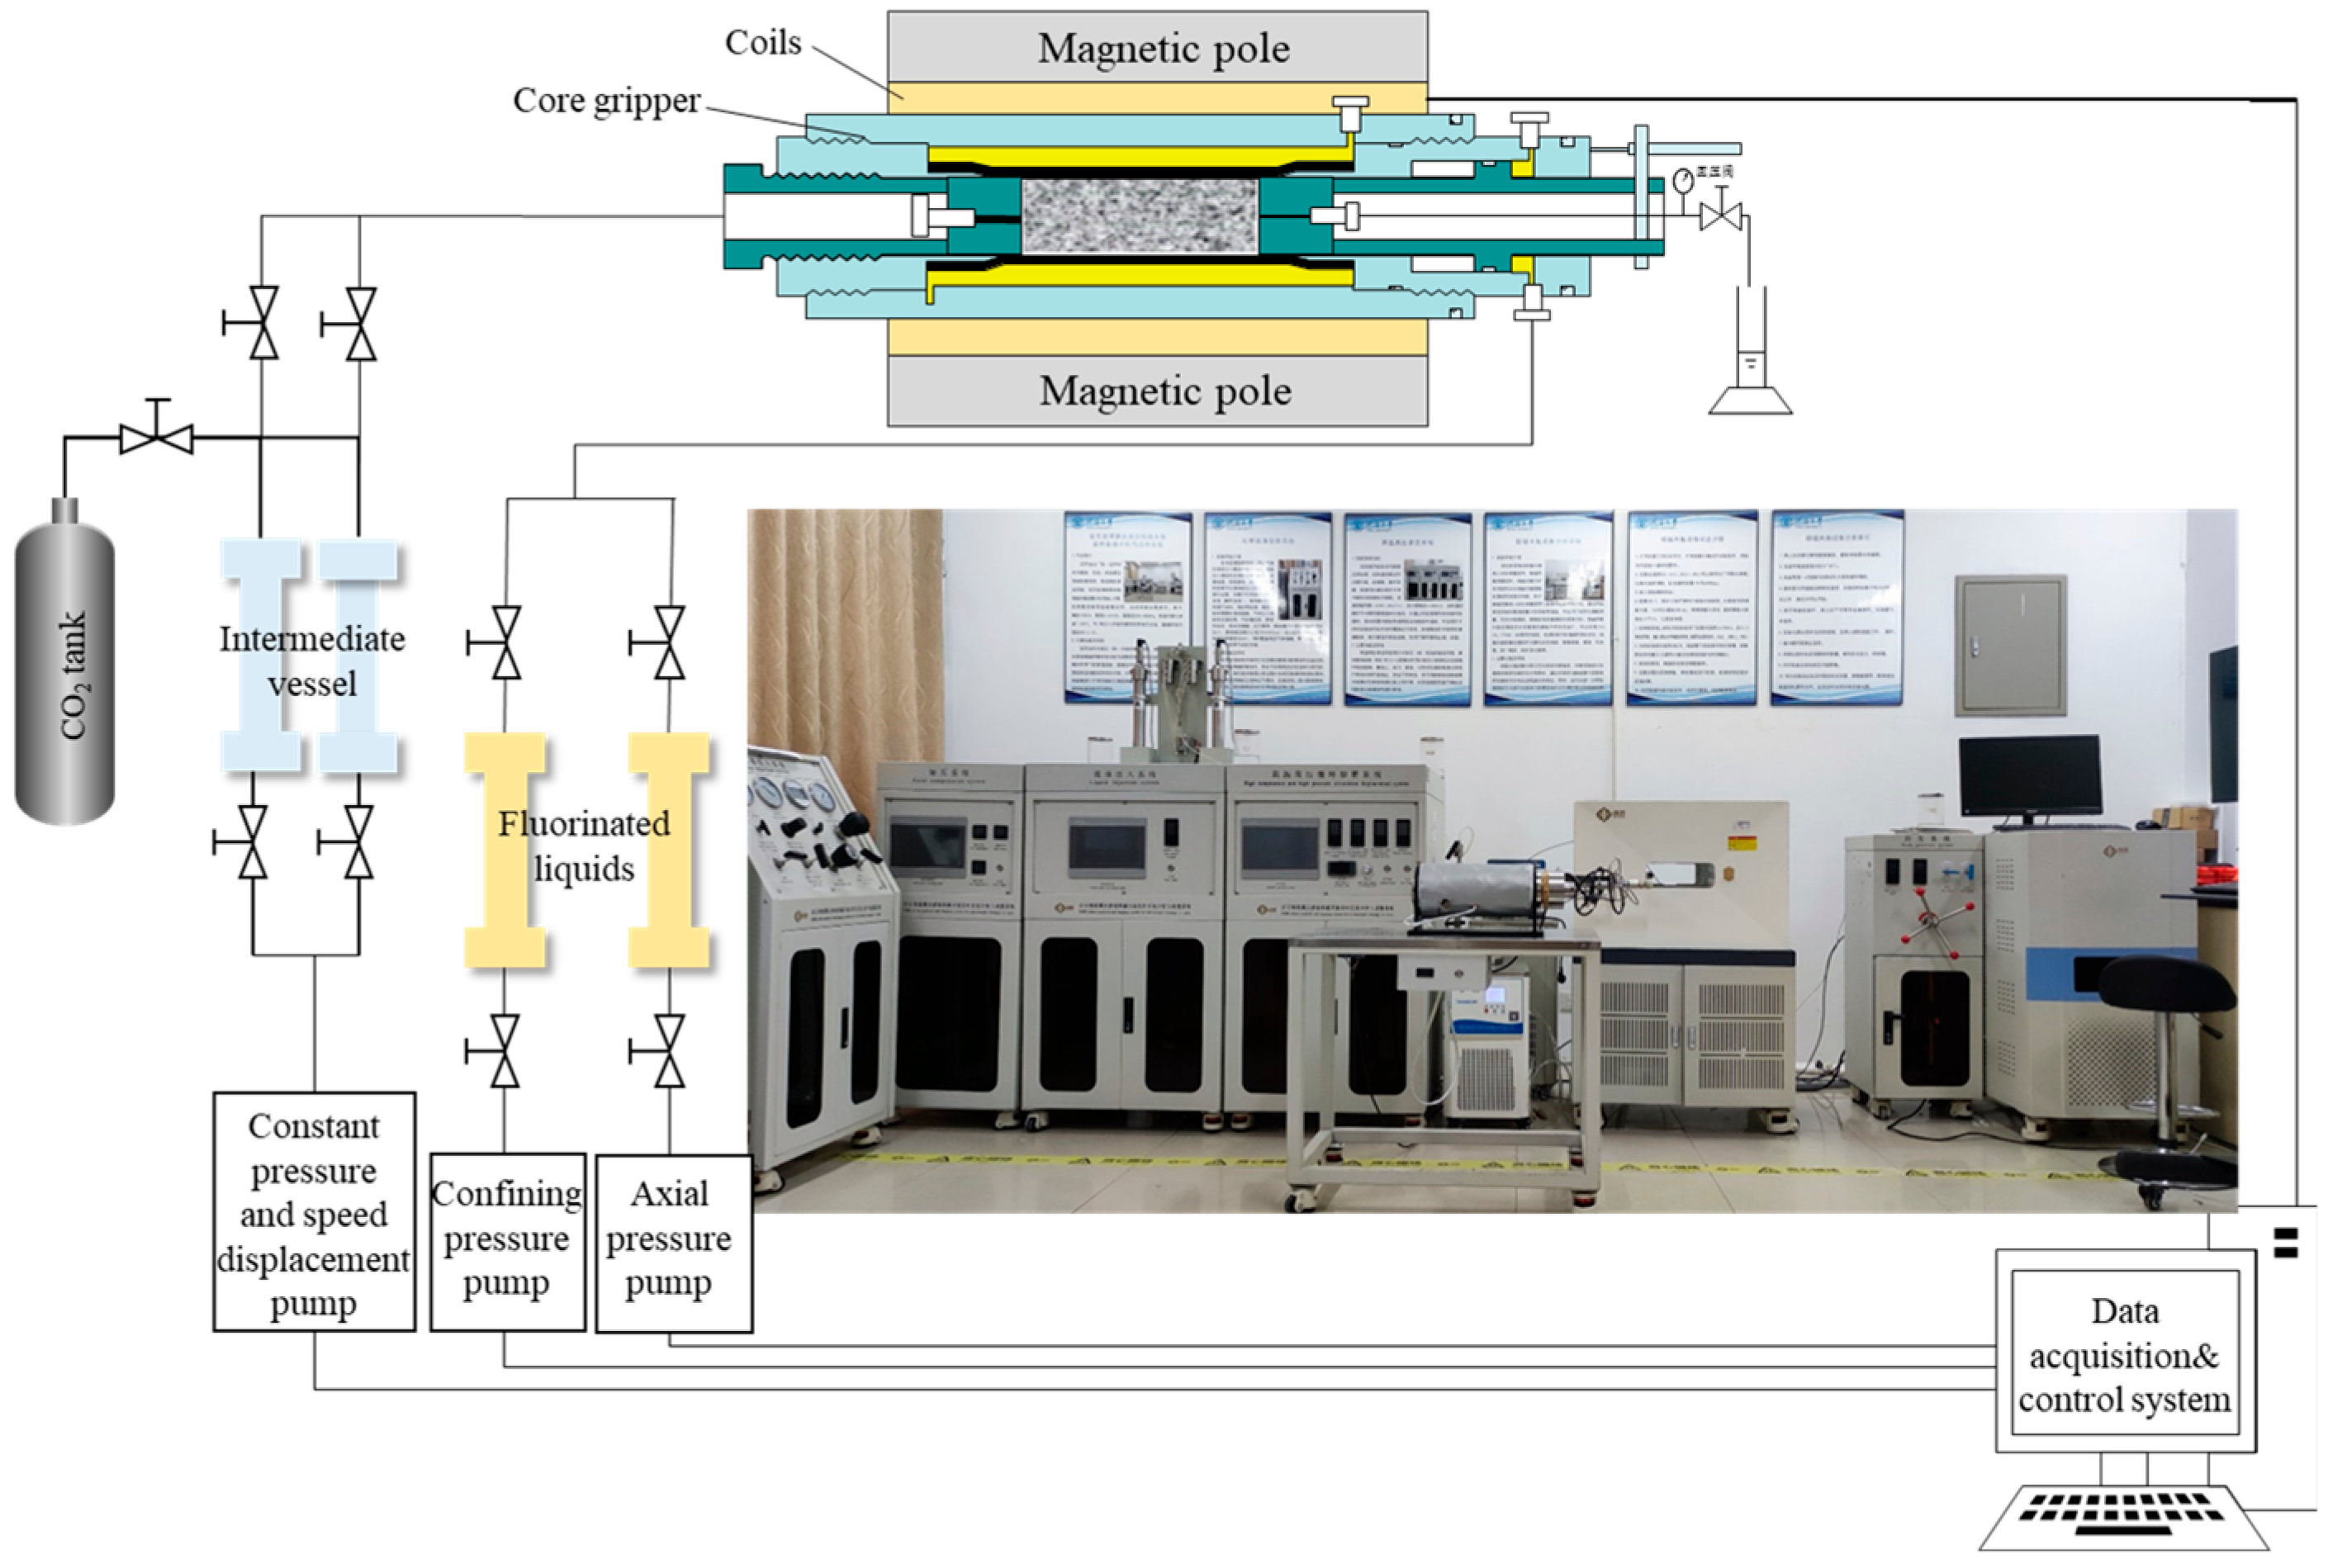
The seepage experiment conducted using the in situ NMR monitoring system for rock multi-field coupling seepage is shown in Figure 2. This system primarily consists of a computer servo control system, a core gripper, a confining pressure control system (0–40 MPa), an axial pressure control system (0–40 MPa), a seepage pressure control system, a gas injection system, and a gas–liquid separation system. The integration of nuclear magnetic resonance (NMR) technology with the triaxial seepage device enables real-time observation of changes in the core’s pore structure and seepage characteristics during the infiltration process.
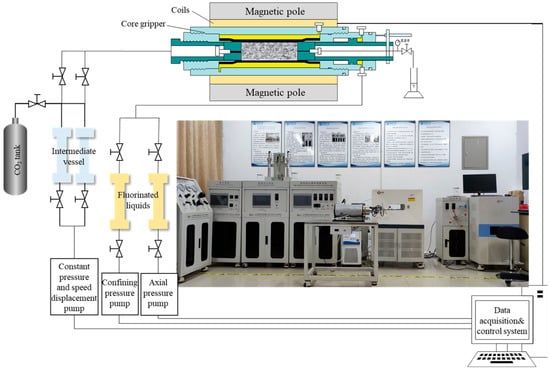
Figure 2.
Schematic of in situ NMR monitoring system for rock multi-field coupling seepage.
2.3.2. Experimental Schemes
To investigate the pore deformation of shale caprocks under CO2 sequestration, this study focuses on the confining pressure-dependent pore structure and permeability evolution in 150 m thick shale cap rocks at 800 m depth, representative of typical saline aquifer storage reservoirs. A comprehensive experimental method combining triaxial stress–seepage coupling with nuclear magnetic resonance characterization was implemented to analyze the stress–permeability–pore structure relationship under stepwise confining pressure loading. The experimental procedure is as follows:
(1) Sample Fabrication and Saturation: The shale samples were polished into a standard cylindrical geometry (φ25 ± 0.03 mm × 20 ± 0.05 mm). The shale samples were vacuum-saturated in deionized water for 48 h to achieve complete pore fluid saturation. Following saturation, each sample was mounted in a triaxial core holder and encapsulated with heat-shrink tubing to ensure hydraulic integrity under confining pressure. The prepared assembly was then positioned within the NMR magnet chamber for subsequent testing.
(2) Triaxial Stress Loading: Loading circumferential pressure and axial pressure of 15 MPa by electro-hydraulic servo system. Upon achieving mechanical equilibrium, a steady-state seepage pressure gradient of 12 MPa was imposed using a constant-pressure permeation system. Stress online monitoring was maintained via a computer servo control system.
(3) NMR Transverse Relaxometry Parameterization: Transverse relaxation time (T2) distributions were acquired with the following pulse sequence parameters: relaxation delay (Tw) = 3000 ms; echo spacing (Te) = 0.12 ms; number of echoes (NE) = 10,000; and signal accumulations (NS) = 64.
(4) Magnetic Resonance Imaging: High-resolution NMR imaging was performed along the sample’s axial orientation using a spin-echo pulse sequence. The imaging protocol employed a 20 mm slice thickness to capture full cross-sectional fluid phase distribution, with spatial resolution optimized for detecting pore networks and preferential flow pathways.
(5) Dynamic Permeability Quantification: Exudate flux was monitored at 1 h intervals using a traceable mass flow meter (calibration uncertainty: ±0.01 mL/min). Real-time permeability was calculated using the Darcy equation.
(6) Stepwise Confining Pressure Loading: The permeability stabilization criterion necessitated three consecutive measurements demonstrating a coefficient of variation in less than 5%. A stepwise confining pressure loading with 1 MPa gradients spanning 15–19 MPa was applied. Each confining pressure condition was maintained for 12 h to achieve hydrodynamic equilibrium, with simultaneous testing of NMR relaxation time and fluid flow.
3. Experimental Results
3.1. Effect of Confining Pressure on Permeability
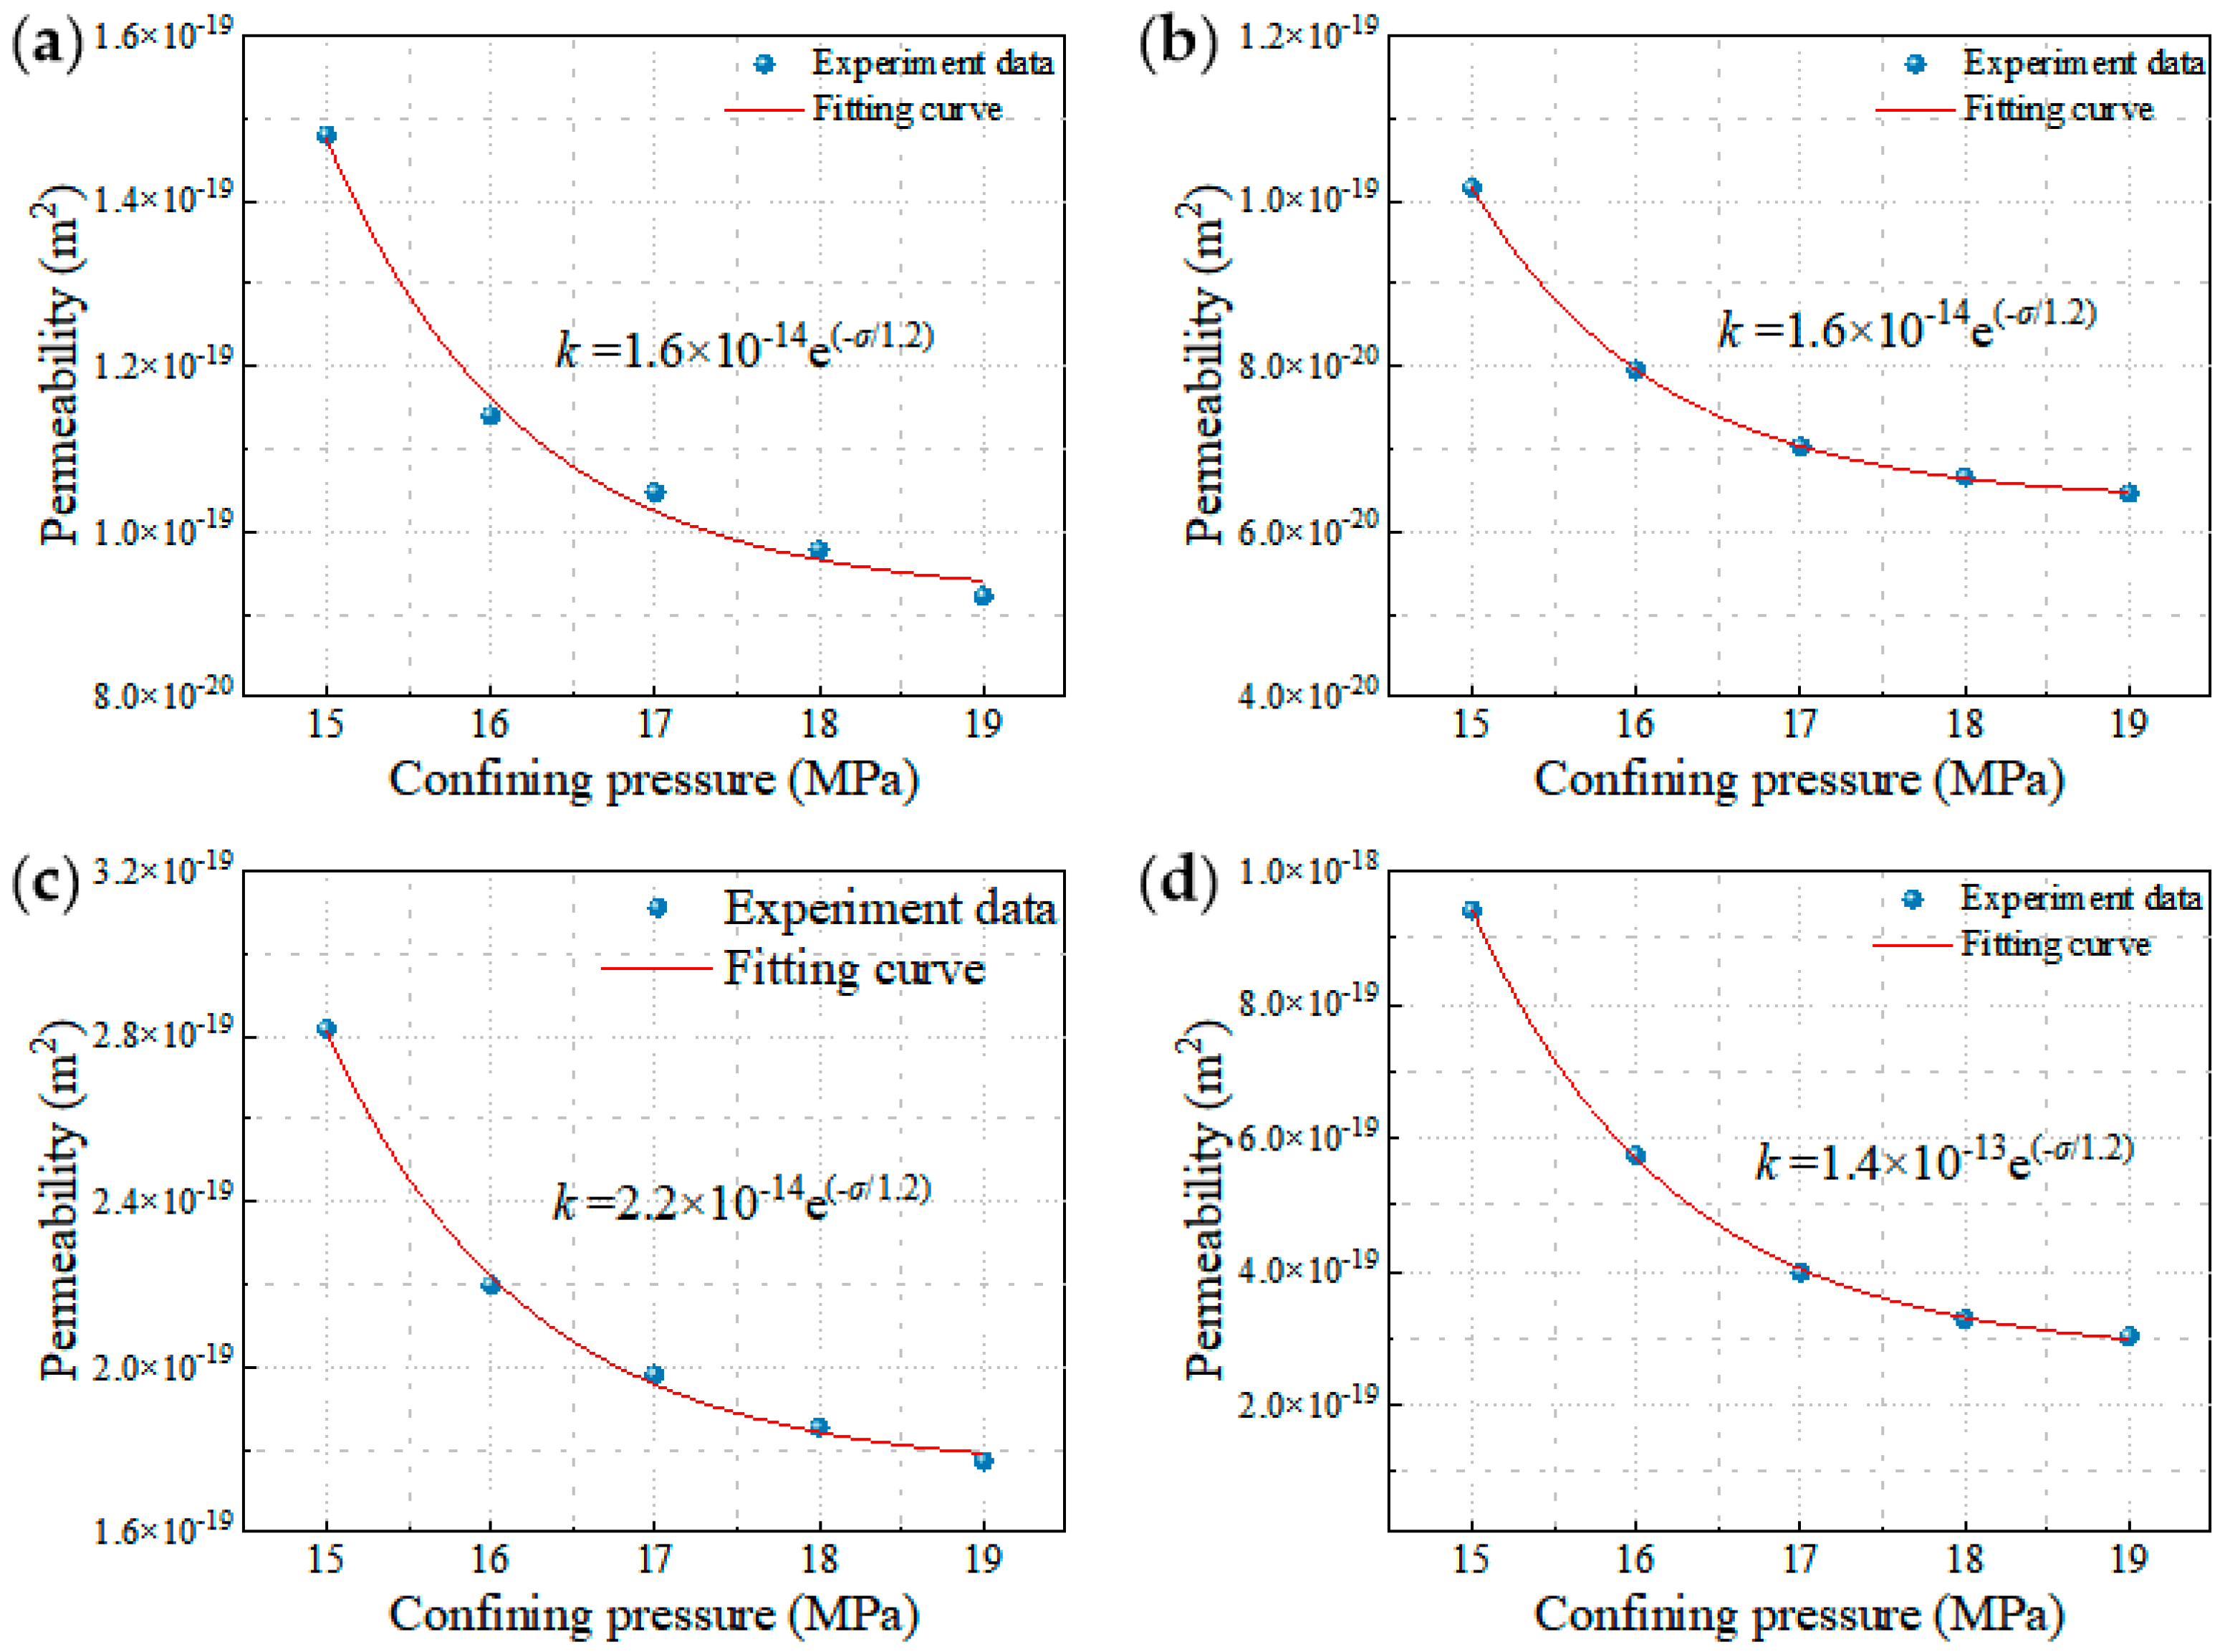
Figure 3 illustrates the evolution of permeability under different confining pressures. The four shale samples show exponential permeability reduction with increasing confining pressure, and the decline is particularly significant when the confining pressure increases from 15 MPa to 16 MPa. With the increase in confining pressure, the shale pores were gradually compacted and the pore–throat connectivity decreased, resulting in a significant decrease in the permeability of the shale samples. As the confining pressure increased from 15 MPa to 19 MPa, the permeability variation rate decreased. The permeability of sample CD decreased from 1.02 × 10⁻¹⁹ m2 to 6.47 × 10⁻²⁰ m2, with a reduction of 36.6%. The initial permeability of sample CD is the smallest, with a relatively gentle decrease. The permeability of sample GY decreased from 1.48 × 10⁻¹⁹ m2 to 9.22 × 10⁻²⁰ m2, with a reduction of 37.7%, and the permeability of sample YB decreased from 2.82 × 10⁻¹⁹ m2 to 1.77 × 10⁻¹⁹ m2, with a reduction of 37.2%. The permeability of sample LZ decreased from 9.41 × 10⁻¹⁹ m2 to 3.03 × 10⁻¹⁹ m2, with a reduction of 35.6%. Sample LZ had the largest initial permeability among the four shale samples and showed the largest decrease in permeability of 67.8%.
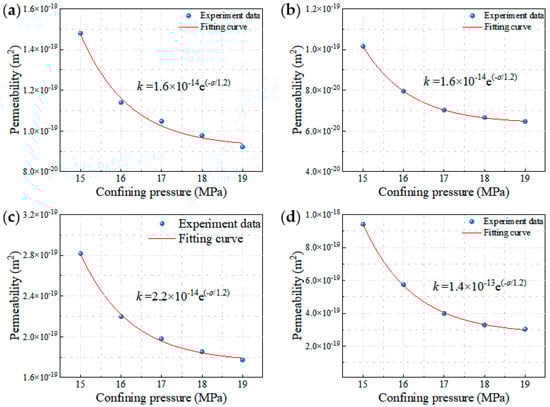
Figure 3.
Effects of confining pressure on permeability evolution. (a) Sample CD. (b) Sample GY. (c) Sample YB. (d) Sample LZ.
3.2. Pore Size Distribution at Different Confining Pressures
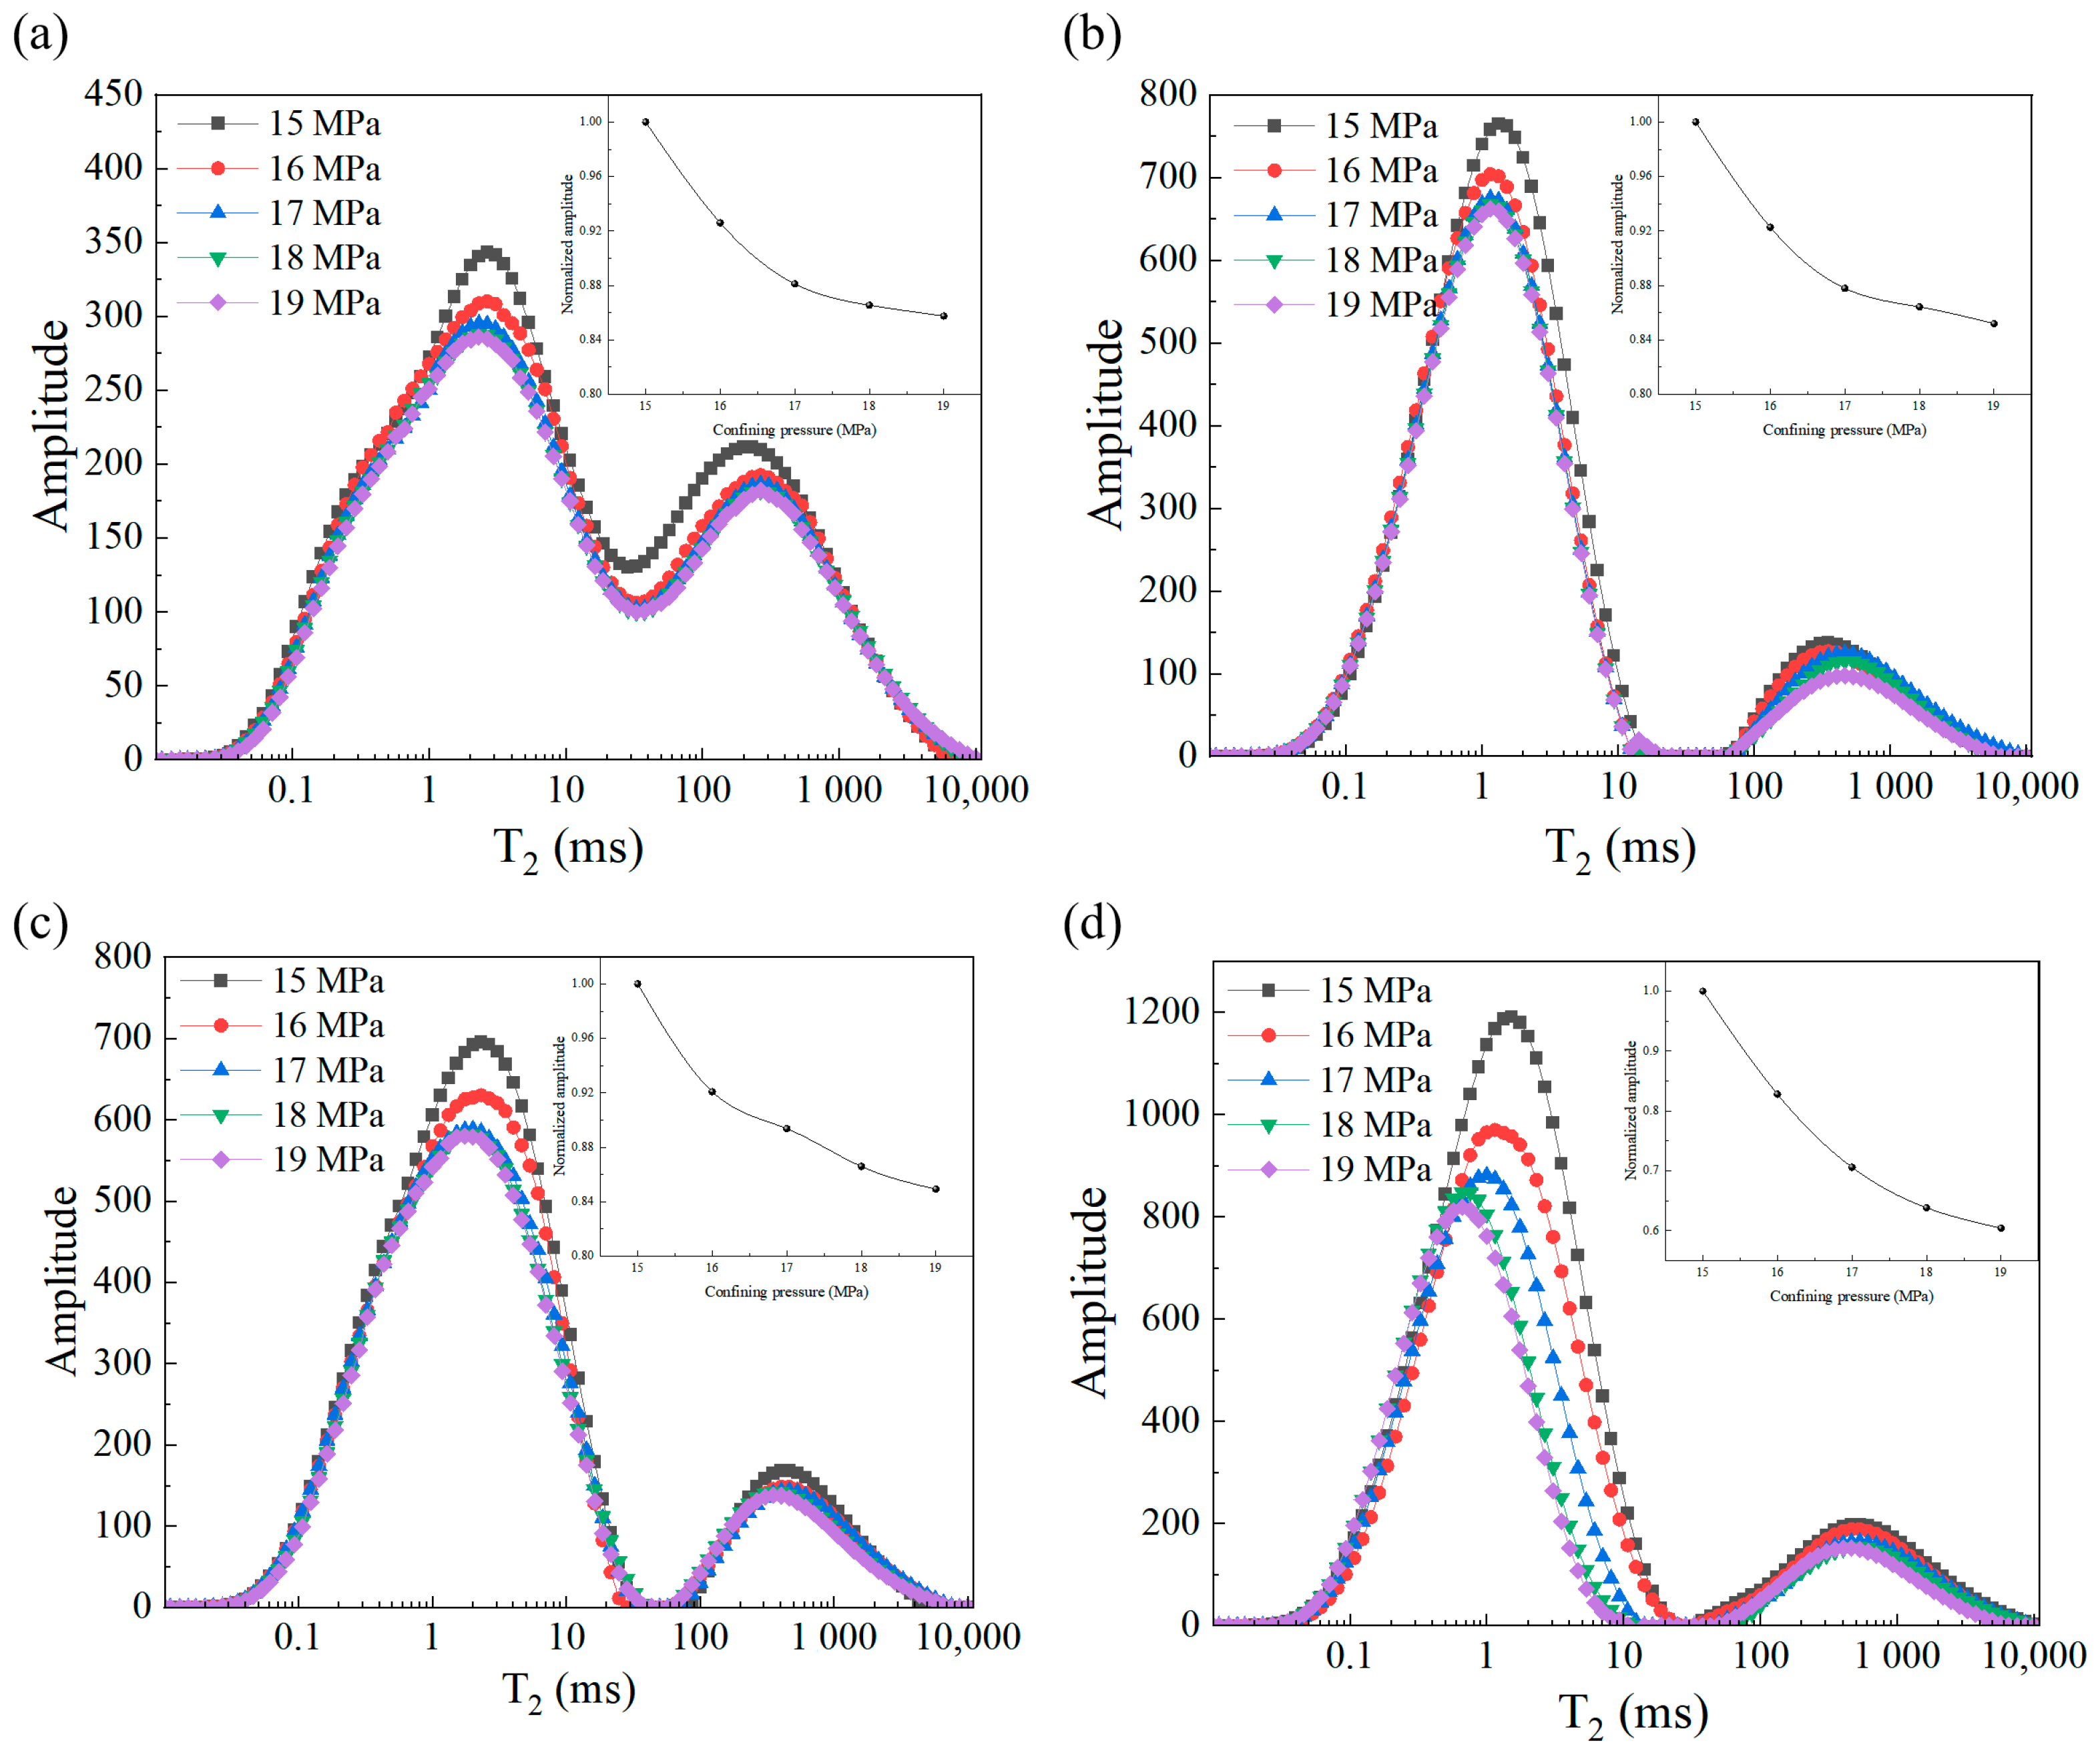
Figure 4 illustrates the pore size distribution evolution of four shale samples under progressive confining pressures, which reveals distinct bimodal pore structures. Sample CD displays interconnected dual-peak pores, reflecting a homogeneous pore network. In contrast, samples GY, YB, and LZ exhibit pronounced heterogeneity dominated by left-skewed peaks adjacent to amplitude-free troughs. These structural differences critically influence their pore evolution under mechanical stress.
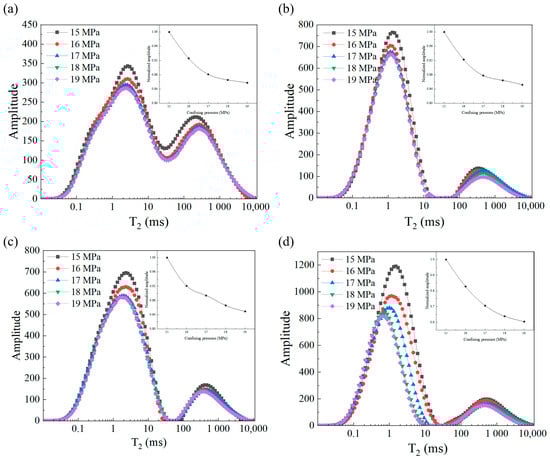
Figure 4.
T2 spectra of shale samples at different confining pressures. (a) Sample CD. (b) Sample GY. (c) Sample YB. (d) Sample LZ.
With increasing confining pressure, sample CD shows synchronized attenuation of both amplitude peaks, indicating effective cross-scale pore connectivity. Conversely, the heterogeneous samples exhibit divergent responses; their primary peaks diminish markedly, while secondary peaks remain stable, suggesting differential compression across different pores. Notably, sample LZ demonstrates the most significant amplitude reduction (49.1%) among all samples, accompanied by a leftward peak shift and narrowed pore size distribution, implying preferential compression of mesoscale pores. Here, the normalized signal amplitude ratio Ai/A0 was introduced to characterize stress-dependent porosity changes, where Ai and A0 represent NMR signals under specific and baseline (15 MPa) confining pressures, respectively. As illustrated in Figure 4, the ratio exhibits exponential decay with increasing confining pressure, indicating progressive pore collapse and compaction under mechanical loading. The rate of amplitude reduction correlates strongly with stress magnitude, influenced by pore structure compressibility and material heterogeneity. These observations underscore the critical role of initial pore structure in determining the mechanical compaction behavior.
3.3. Magnetic Resonance Imaging at Increasing Confining Pressure
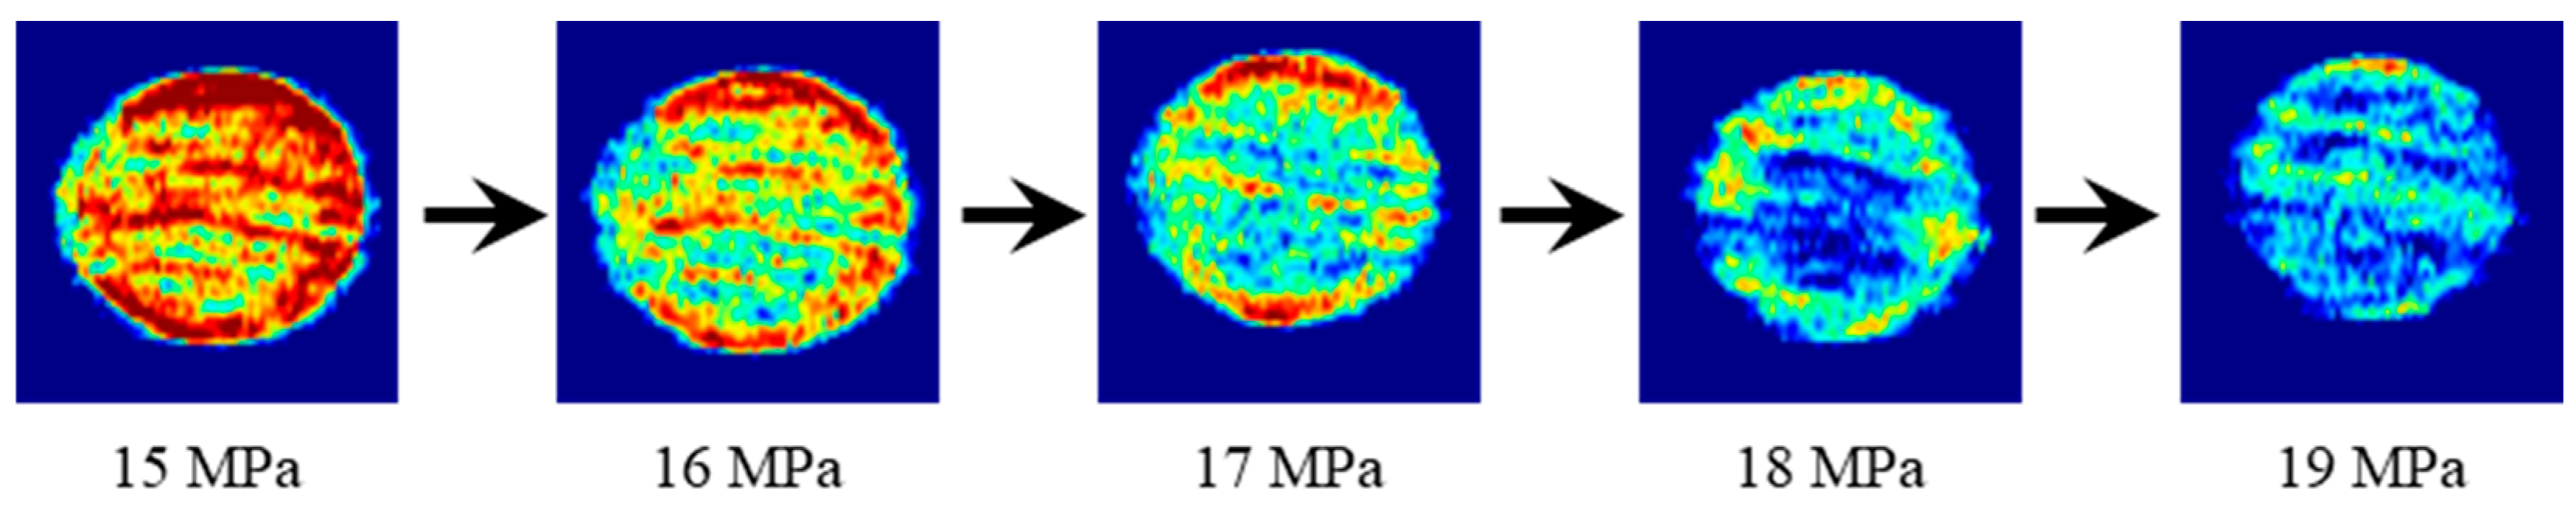
Magnetic resonance imaging (MRI) utilizes phase-encoded spatial mapping to non-invasively reconstruct fluid distributions in rock samples, revealing pore network characteristics. Due to the resolution limitations of MRI in low-porosity media, the sample LZ with the highest porosity was selected for MRI. Figure 5 illustrates the evolving pore distribution in transverse sections of sample LZ under stepwise confining pressure increases. The blue regions represent the MRI background, excluded from compaction analysis. Warm colors (higher luminance) indicate elevated proton density, where gradual darkening reflects increasing fluid saturation and enhanced hydraulic connectivity within pores. Conversely, cooler colors (lower luminance intensity) denote attenuated spin-echo signals, mineral-dominated or low porosity. At 15 MPa confining pressure, MRI images exhibit extensive, contiguous red pixel clusters corresponding to high-porosity domains dominated by macropores.
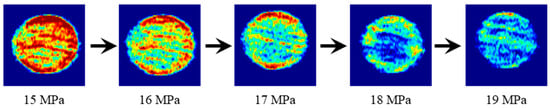
Figure 5.
NMR image of sample LZ under different confining.
Increasing confining pressure drives systematic closure of the pore network, transitioning from continuous percolation pathways to isolated microporous clusters. This demonstrates the stress-activated porosity reduction mechanism, where intensified effective stress progressively collapses pore spaces and constricts connecting throats, ultimately impairing hydraulic connectivity. At 19 MPa, MRI signals shift to a blue-dominated spectrum, indicating hydraulic discontinuity caused by throat compression and subsequent seepage pathway fragmentation. These mechanically induced flow resistances show a strong correlation with the left-shift trends in T2 relaxation time documented in Section 3.2.
4. Discussions
4.1. Determination of T2 Cutoff Based on NMR-Displacement Tests
Displacement tests quantitatively characterize the occurrence of movable and bound fluids in porous media by applying displacement pressure to a non-wetting phase fluid to overcome capillary resistance to displace the wetting phase fluid. When displacement pressures surpass capillary resistance thresholds, macropore fluids mobilize preferentially while irreducible water is trapped in micropores.
The T2 cutoff is defined as the critical threshold of the effective seepage throat radius in the reservoir rock, and its core physical meaning is to classify the pore fluid endowment state through the NMR transverse relaxation time. When the NMR transverse relaxation time is lower than this threshold, it characterizes the bound fluid, and vice versa, it is the movable fluid [24]. Physically, this parameter establishes the lower limit of the pore–throat scale for the free flow of fluids in the pore network, according to which the storage space can be divided into two main types: adsorption and seepage pores [25].
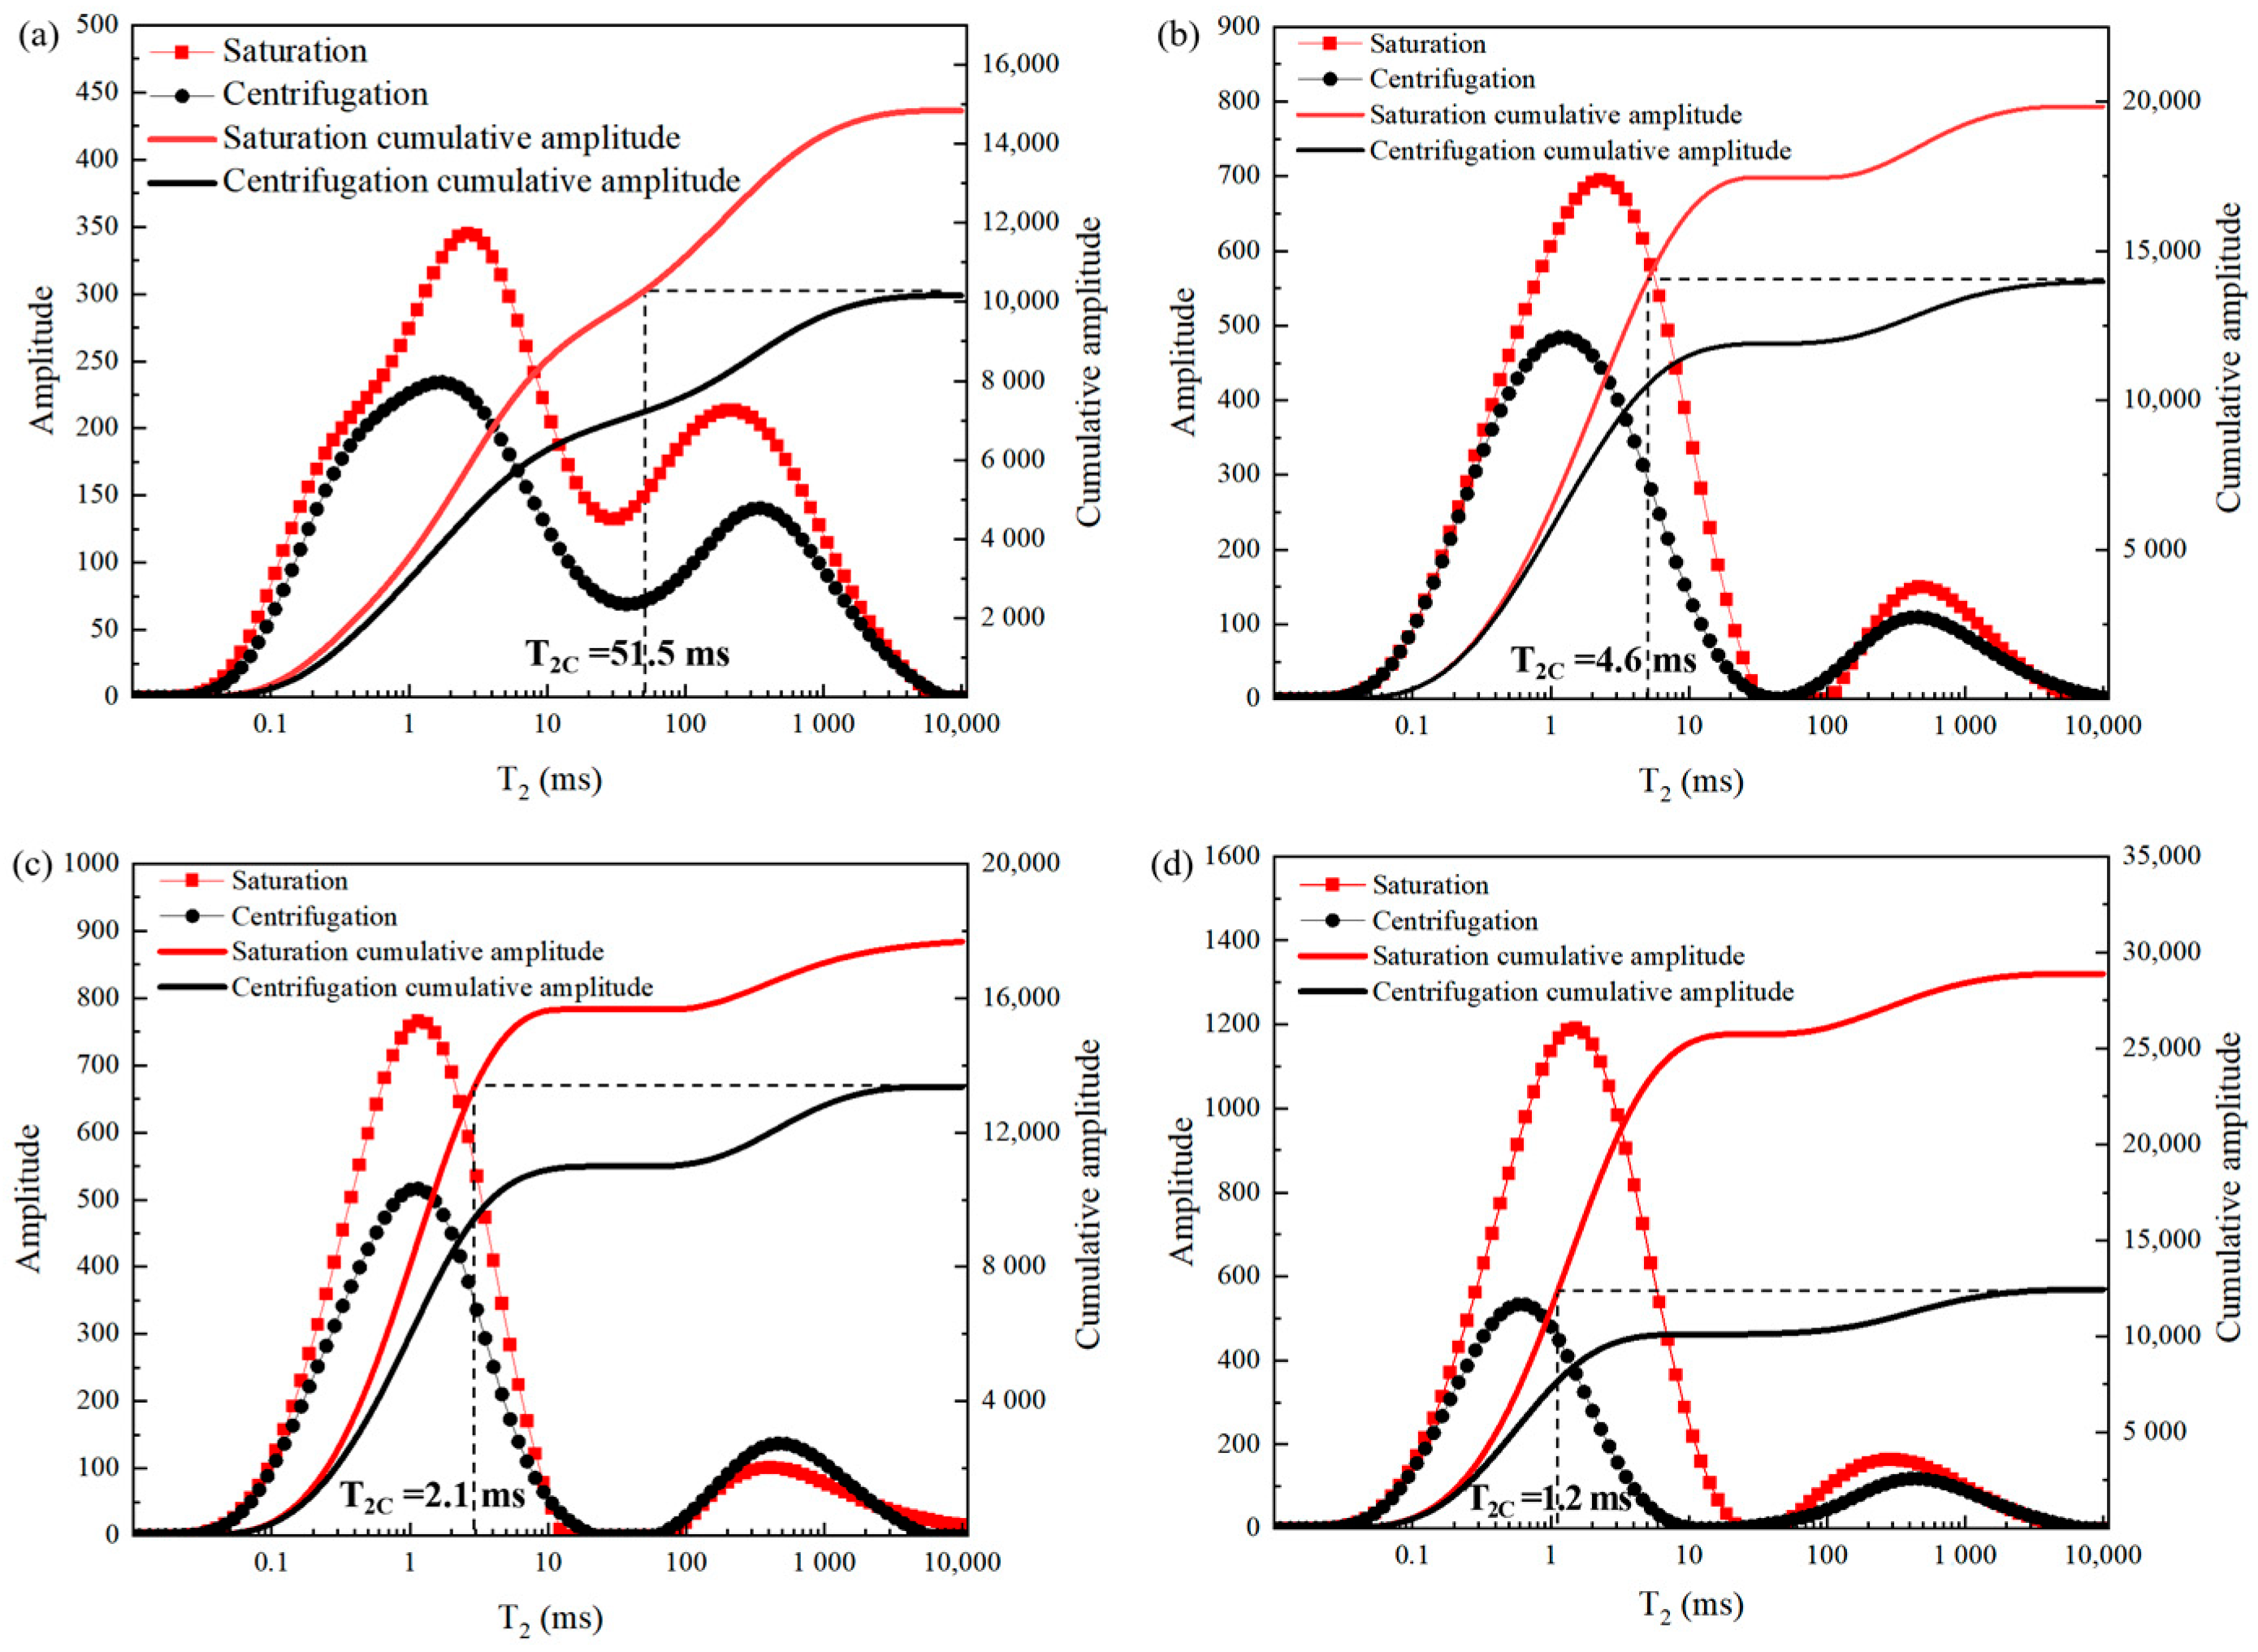
The T2 cutoff was determined as follows. First, NMR measurements were performed on saturated shale samples to establish the T2 relaxation distribution in the saturated state. Subsequently, gas–water displacement experiments were conducted until the stabilization of the NMR signal confirmed the attainment of irreducible water saturation. Thereafter, a secondary NMR acquisition captured the T2 spectra of the irreducible water. Finally, a comparative analysis of the cumulative T2 spectra identified the critical cutoff value by horizontally extrapolating the plateau segment of the irreducible water curve to intersect with the saturated-state curve [26,27].
Figure 6 illustrates the T2 relaxation spectra and corresponding cutoff values for four shale samples under pre- and post-displacement conditions. Elevated T2 cutoff values indicate enhanced fluid confinement within pore networks, resulting from the synergistic effects of refined micro-throat geometries and intensified solid–fluid interfacial interactions. The T2 cutoff follows a descending order: CD (51.5 ms) > GY (4.6 ms) > YB (2.1 ms) > LZ (1.2 ms). This progressive reduction signifies an increased contribution from smaller aperture pores to fluid migration pathways, thereby elevating movable fluid saturation. Notably, sample LZ demonstrates superior hydrodynamic performance, with the highest mobile water, attributable to its well-developed macropores and optimized pore–throat connectivity. These structural advantages mitigate capillary confinement effects by enhancing hydrodynamic efficiency and facilitating preferential fluid mobilization through low-resistance transport networks.
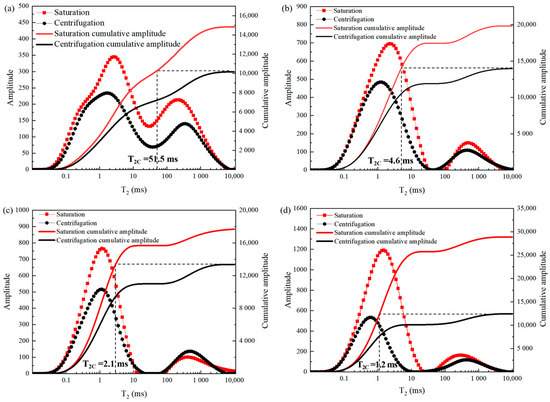
Figure 6.
T2 relaxation distribution of shale samples under saturation and post-centrifugation. (a) Sample CD. (b) Sample GY. (c) Sample YB. (d) Sample LZ.
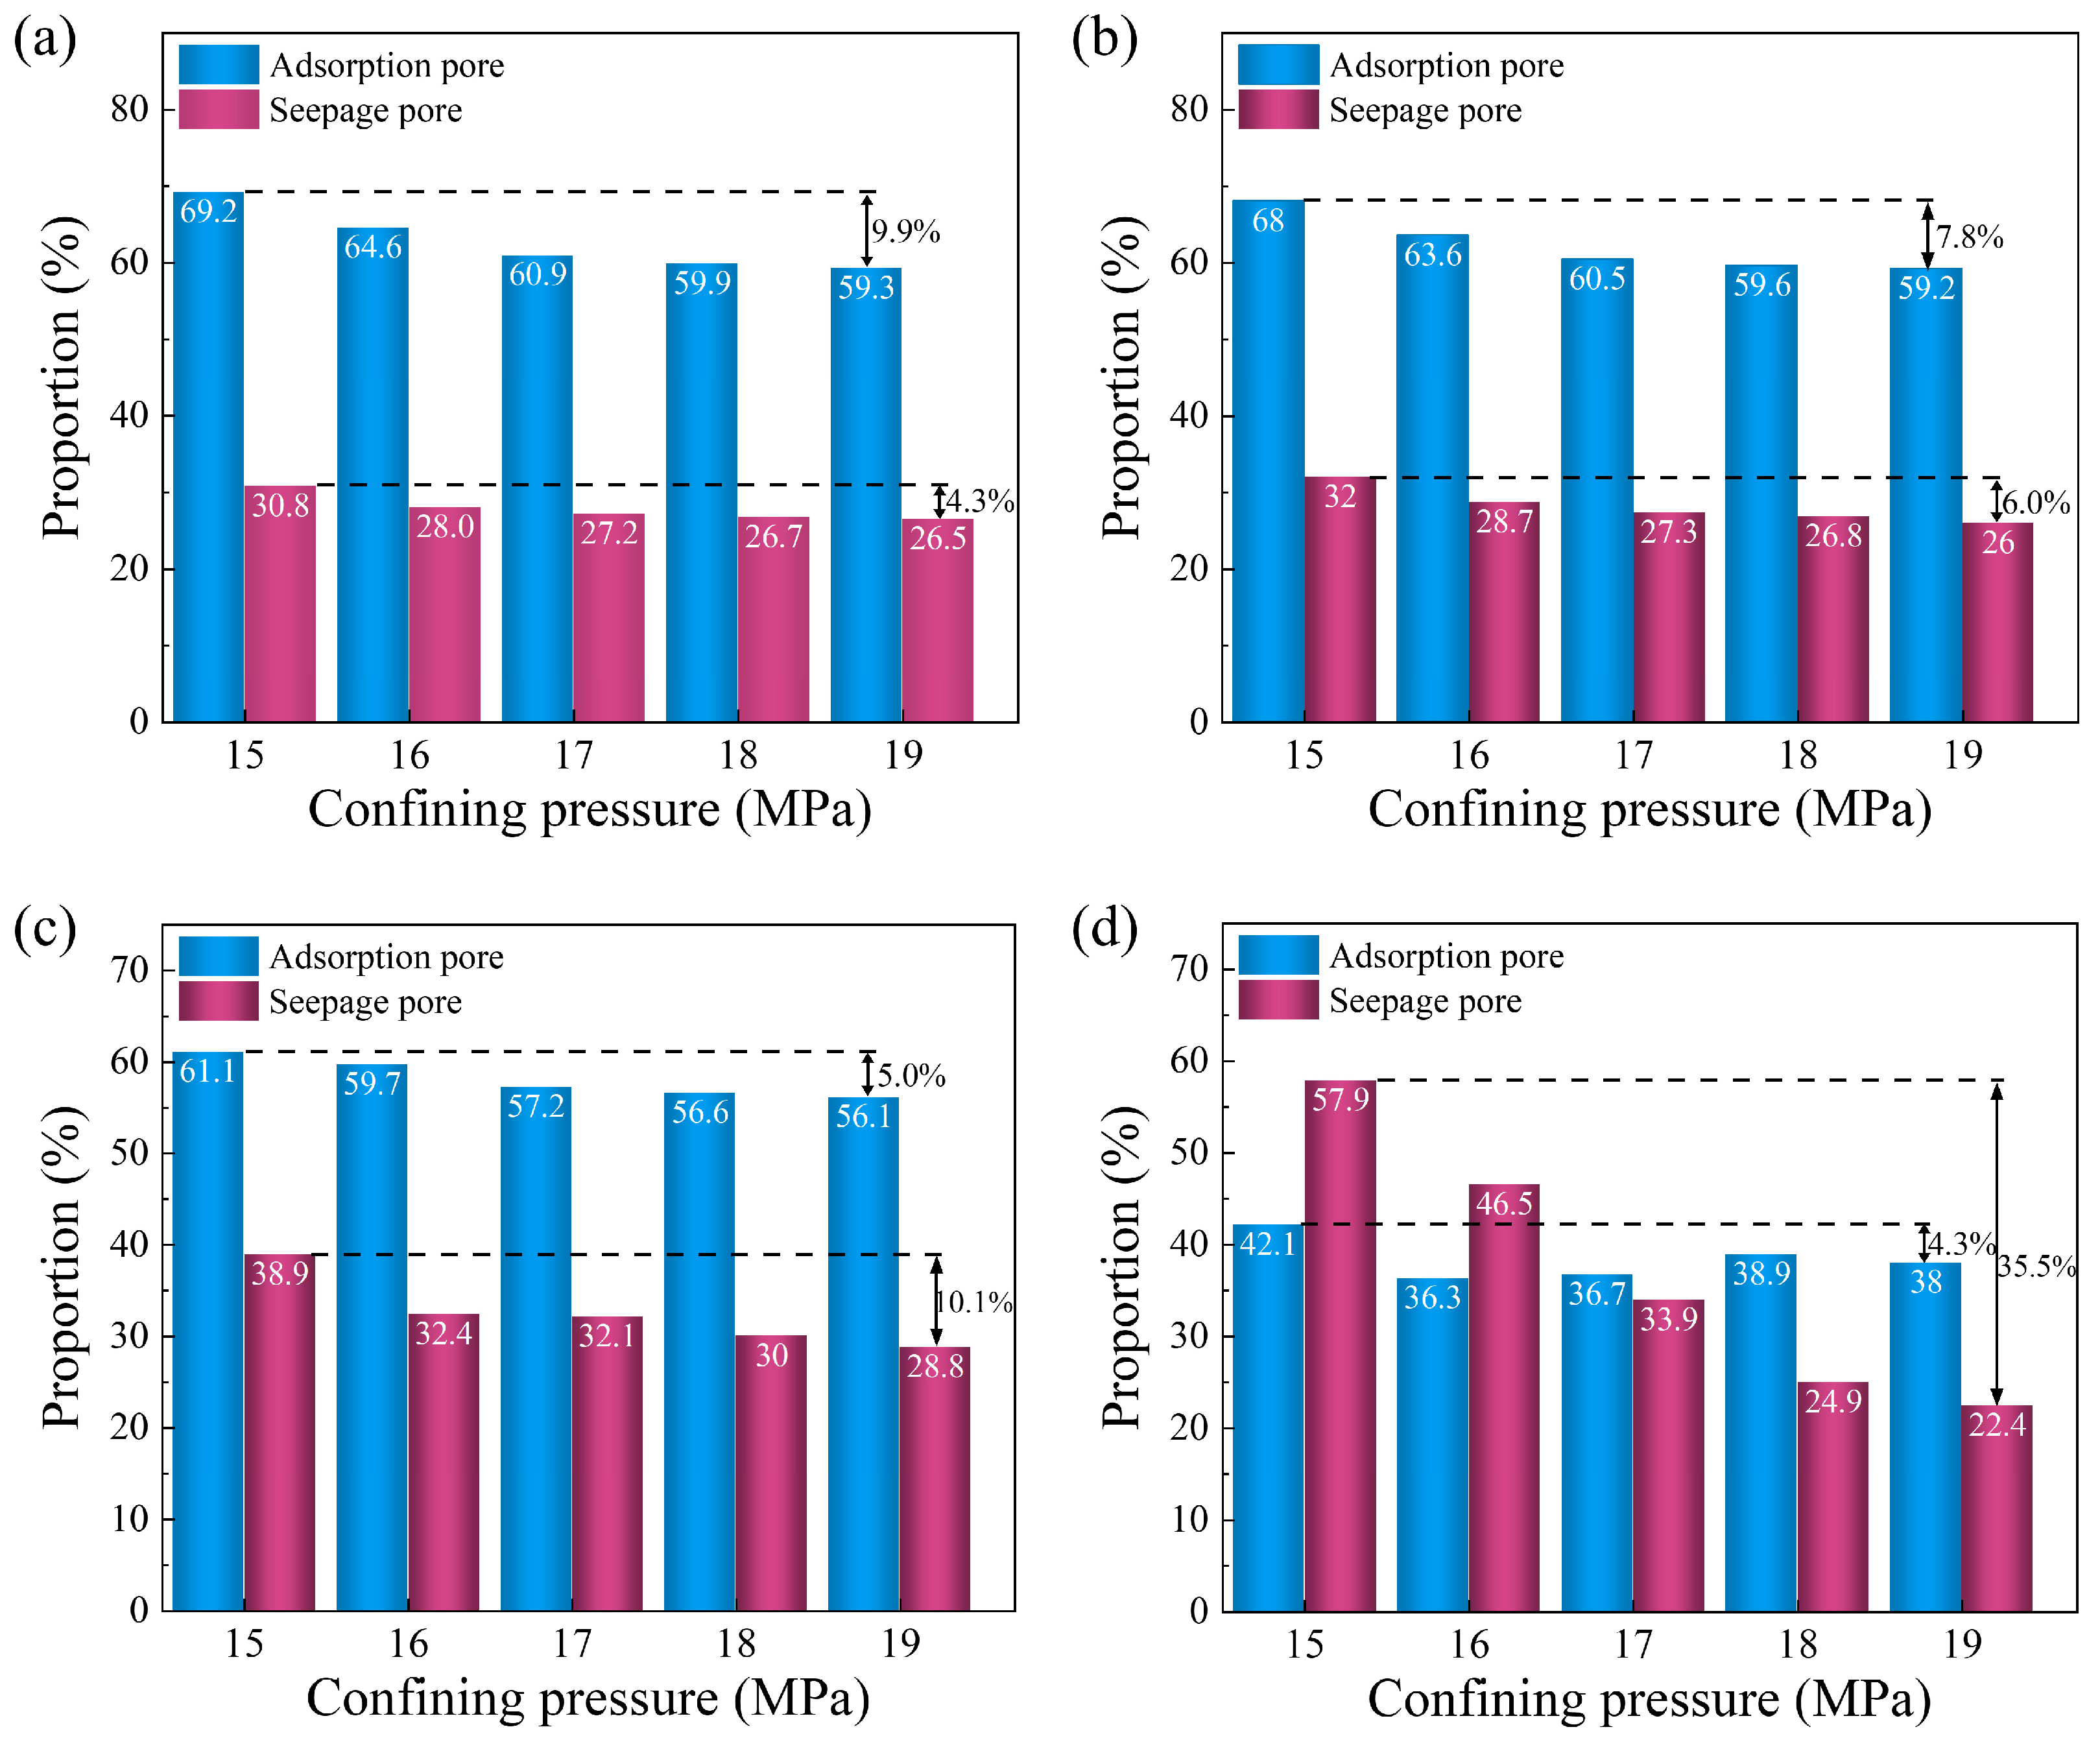
Figure 7 shows the proportion evolution of seepage pores and adsorption pores of four shale samples under different confining pressures. The results reveal that seepage pores exhibit significant pressure sensitivity compared to adsorption pores, demonstrating distinct mechanical responses between the two types of pores [28,29]. As the primary pathway for fluid migration, seepage pores show a substantial reduction with increasing confining pressure. The compressive sensitivity of seepage pores in the shale samples exhibits notable disparities due to mineral composition, following the order of LZ (35.5%) > YB (10.1%) > GY (6.0%) > CD (4.3%). Sample LZ is mainly composed of quartz and illite, and the weakly cemented macropores preferentially close during stress loading, leading to a dramatic decrease in seepage pore volume [18]. Sample YB is also predominantly composed of quartz and illite, but its moderately connected pore network results in moderate compressibility, leading to a smaller variation in seepage pore volume. In contrast, samples GY and CD are primarily composed of calcite and dolomite, which effectively inhibit seepage pore deformation due to their rigid mineral skeletons [22]. Consequently, the seepage pore volume decreases only slightly with increasing confining pressure.
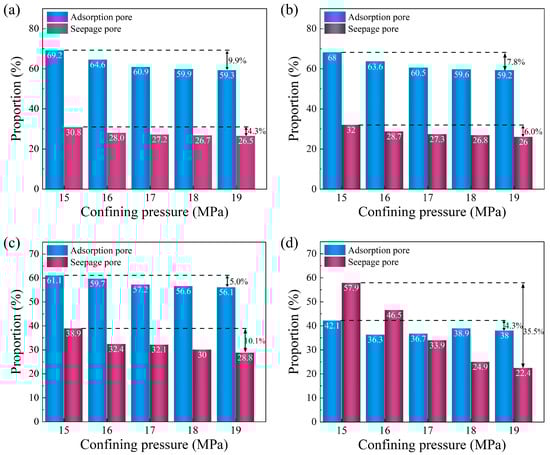
Figure 7.
Evolution of seepage and adsorption pore proportions in confining pressure. (a) Sample CD. (b) Sample GY. (c) Sample YB. (d) Sample LZ.
Notably, the adsorption and seepage pores exhibit divergent trends with increasing confining pressure, following the sequence CD (9.9%) > GY (7.8%) > YB (5.0%) > LZ (4.1%). The relatively minor reductions in the proportions of adsorption pores observed in the samples LZ and YB (4.1% and 5.0%, respectively) can be attributed to the interfacial stabilization mechanism of water films and enhanced mechanical stability. This stabilization effect is manifested through an increased elastic modulus of the water film structures, which effectively constrains nanopore plastic deformation. Conversely, samples CD and GY, containing significant quantities of calcite and dolomite along with low quantities of clay minerals, exhibit diminished bound water and insufficient cementation strength [30], leading to a notable reduction in adsorption pores. These observations reveal that the stress sensitivity of adsorption pores fundamentally derives from competing mechanisms between clay mineral cementation plasticity and adsorbed water film effects under pore geometrical constraints. Rigid minerals facilitate pore closure through efficient stress transmission pathways, while clay mineral water films maintain pore structure integrity with interfacial reinforcement mechanisms.
4.2. Compression Coefficients for Adsorption and Seepage Pores
To quantify the disparity in stress sensitivity between seepage pores and adsorption pores, this study proposes dividing heterogeneous rock into two components: one governed by Hooke’s law formulated with engineering strain and the other by Hooke’s law based on natural strain. The two components, analogous to springs under identical stress, exhibit distinct constitutive behaviors defined by their respective strain measures. This study employs subscripts h and s to designate the “hard” part (governed by engineering strain-based Hooke’s law) and the “soft” part (governed by natural strain-based Hooke’s law), respectively [31,32].
In rock mechanics, it is conventional to use engineering strain considering that the elastic strain in rocks under compression is typically minor. Consequently, the compression coefficient of the adsorption pore is expressed as follows:
where σ0 and σi are the initial confining pressure and the confining pressure increasing from 15 MPa to 19 MPa, respectively. Vap0 and Vapi are the initial adsorption pore volume and the adsorption pore volume at different confining pressures, respectively.
In contrast to adsorption pores, our experimental characterization reveals that interconnected seepage pores exhibit pronounced stress-sensitive deformation, characterized by progressive aperture reduction and even closure under confining pressure loading. This nonlinear compressibility response necessitates formulation through natural strain theory, where the seepage pore compressibility coefficient is expressed as
where σm and σi are the maximum confining pressure and the confining pressure increasing from 15 MPa to 19 MPa, respectively. Vspm and Vspi are the maximum seepage pore volume and the seepage pore volume at different confining pressures, respectively.
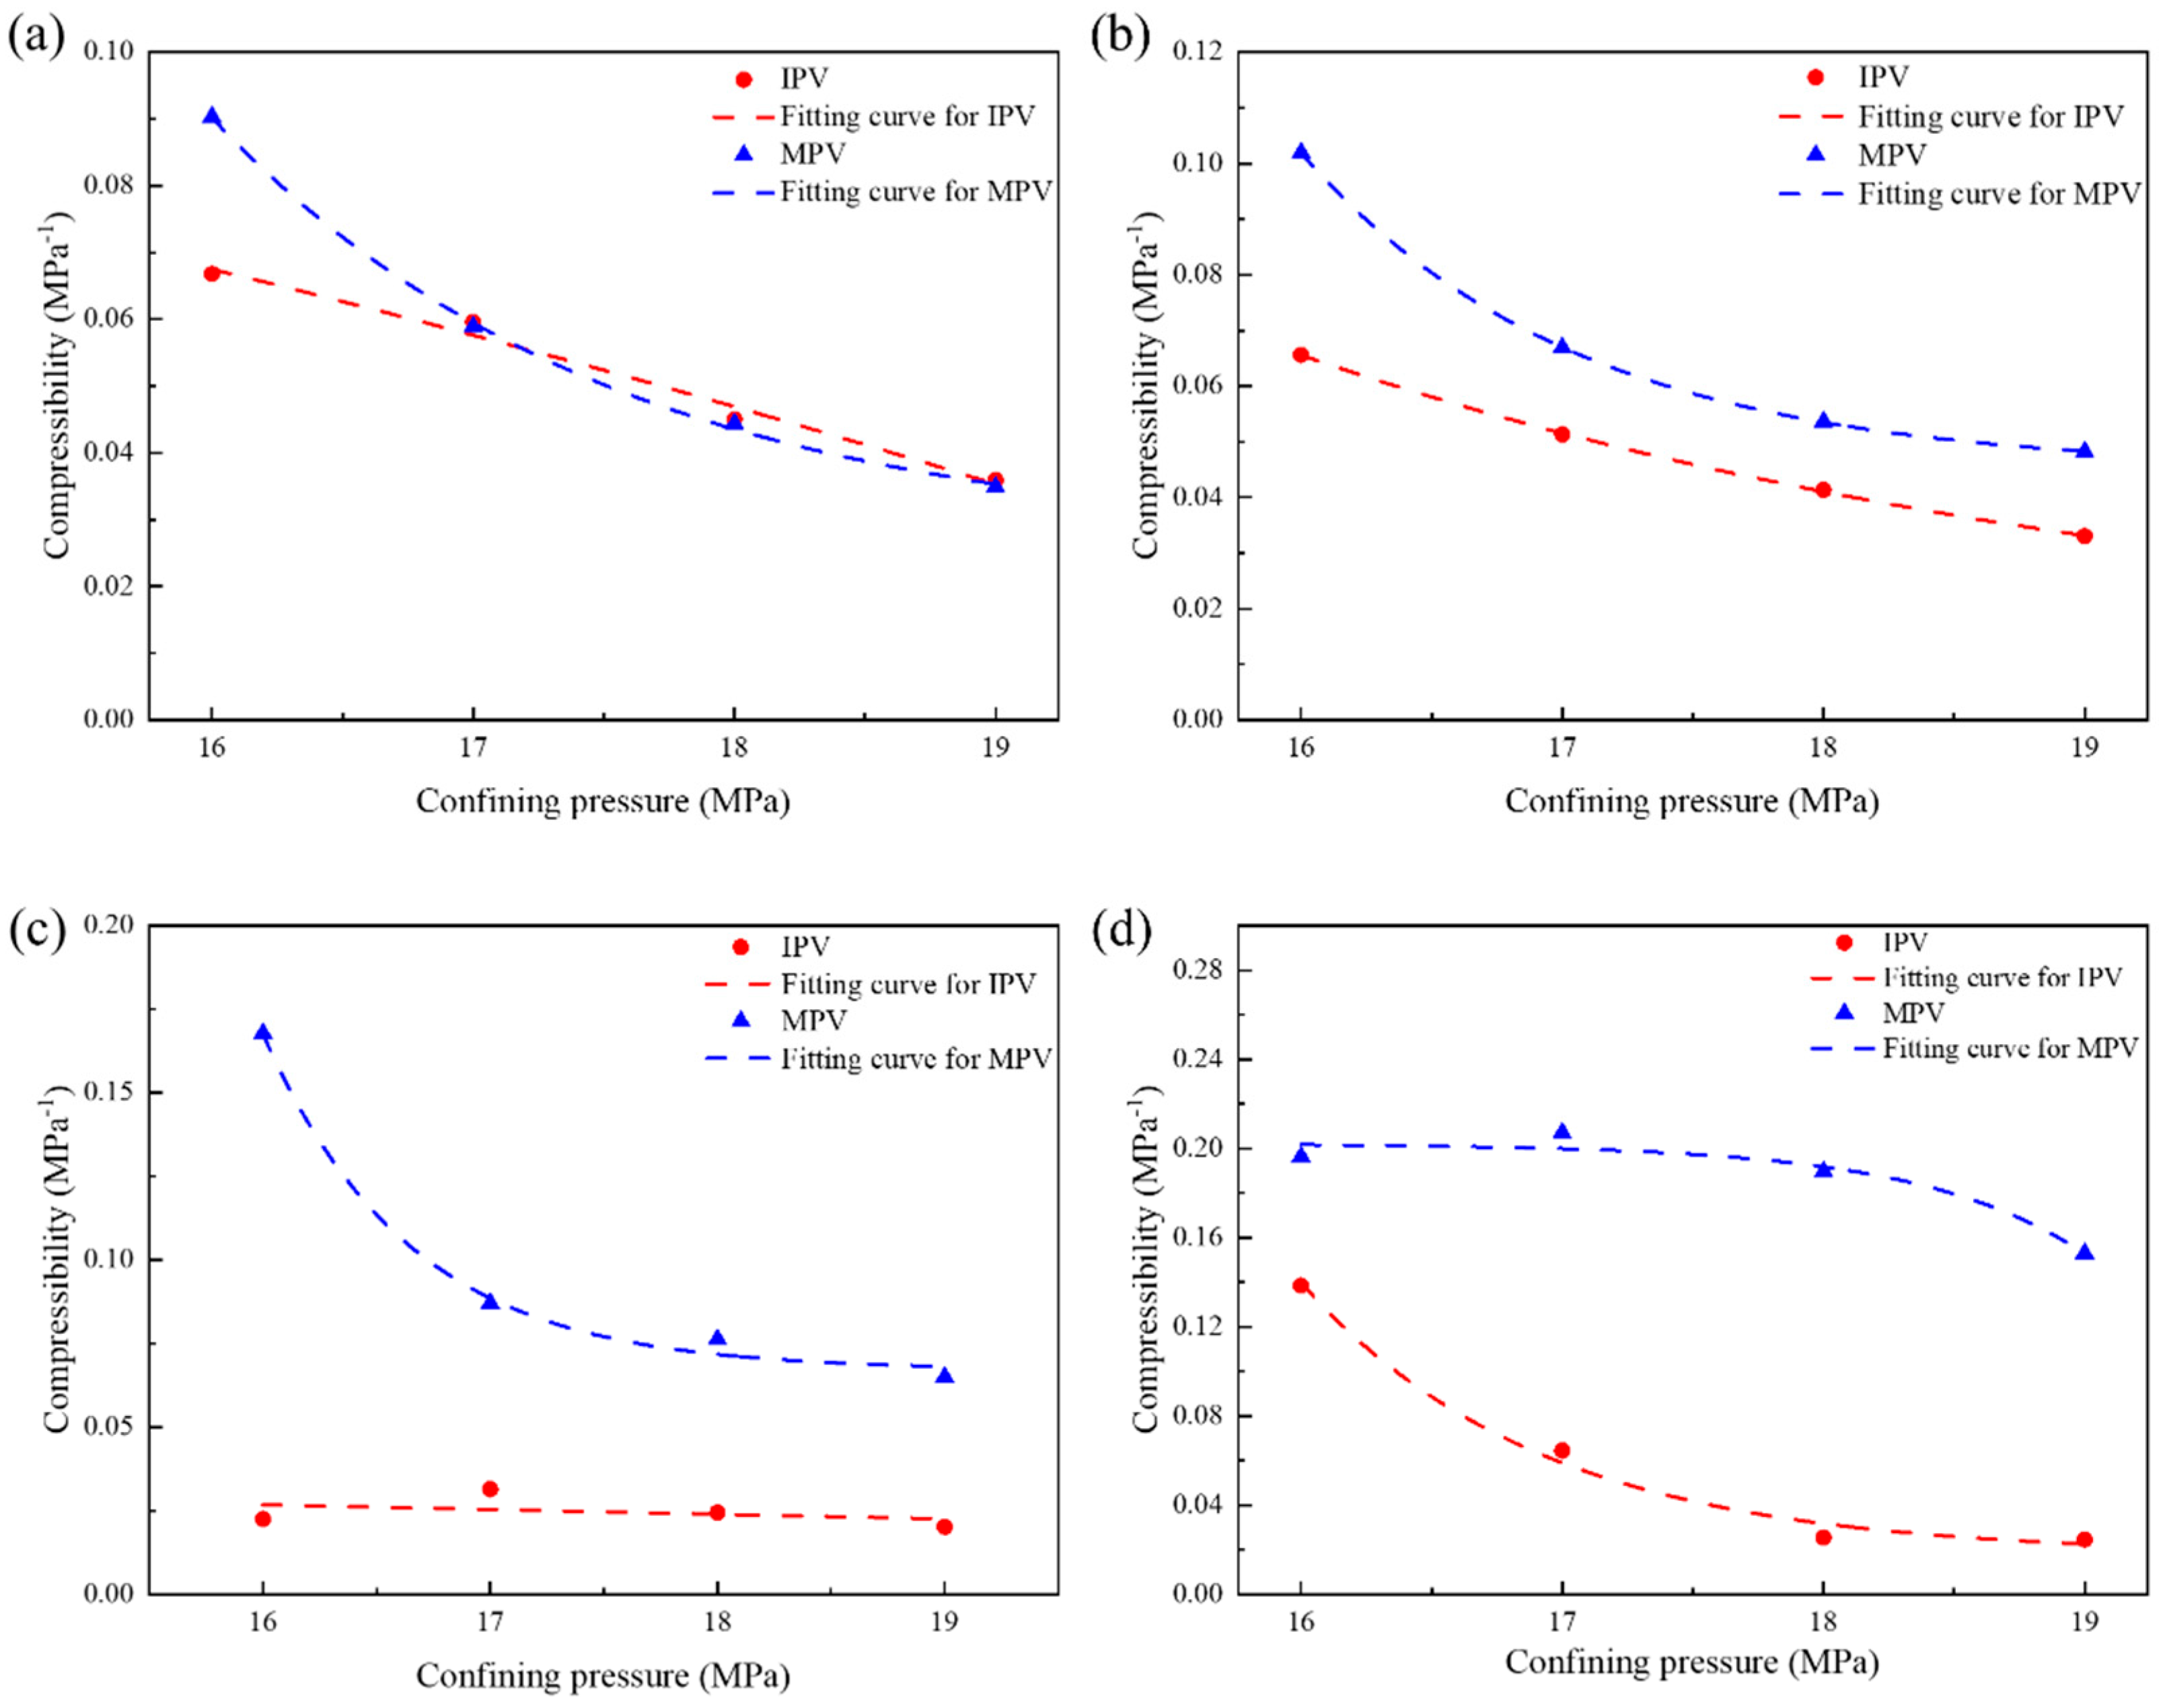
Figure 8 illustrates the evolution of compression coefficients for seepage and adsorption pores in various rock samples under varying confining pressures. The experimental data indicate that the compression coefficients for both types of pores decrease as confining pressure increases. In the sample CD, the compression coefficients for seepage and adsorption pores are comparable, with the initial value of the adsorption pore compression coefficient approximately 0.07 MPa−1. This coefficient exhibits a continuous decline as confining pressure rises from 15 to 19 MPa. Similarly, the initial compression coefficient for the seepage pores is 0.09 MPa−1, which also demonstrates a consistent decreasing trend with increasing confining pressure. In contrast, the compression coefficients for seepage pores in samples GY and YB decrease significantly with increasing confining pressure, showing a maximum reduction of 35% to 42%. However, the compressibility coefficient of adsorption pores exhibits a linear decrease with increasing confining pressure, showing an average decay rate of 0.008 MPa−1/MPa. The sample LZ exhibits high compression coefficients for both seepage and adsorption pores; the compression coefficient for adsorption pores decreases continuously from 0.12 MPa−1, while the seepage pore compression coefficient decreases from 0.20 MPa−1 to 0.15 MPa−1. The difference in compressibility between the seepage and adsorption pores of sample CD, compared to the other samples mainly results from the different pore structures and mineral compositions. This variation further affects the distribution characteristics of the T2 signals relaxation through the pore deformation under confining pressure, which is in agreement with the experimental observations presented in Section 3.2.
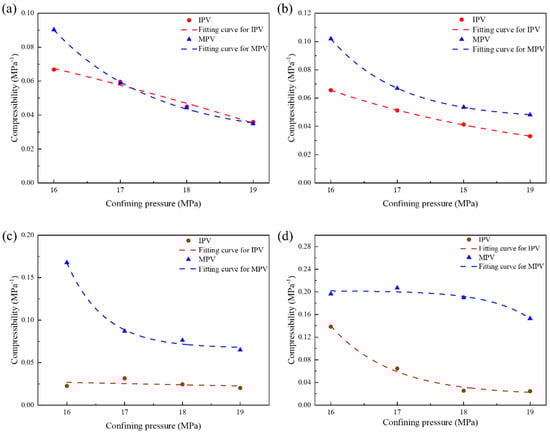
Figure 8.
Compressibility of IPV and MPV under different confining pressures. (a) Sample CD. (b) Sample GY. (c) Sample YB. (d) Sample LZ.
Figure 8 illustrates the evolution of compression coefficients for seepage and adsorption pores in various rock samples under varying confining pressures. The experimental data indicate that the compression coefficients for both types of pores decrease as confining pressure increases. In the sample CD, the compression coefficients for seepage and adsorption pores are comparable, with the initial value of the adsorption pore compression coefficient approximately 0.07 MPa−1. This coefficient exhibits a continuous decline as confining pressure rises from 15 to 19 MPa. Similarly, the initial compression coefficient for the seepage pores is 0.09 MPa−1, which also demonstrates a consistent decreasing trend with increasing confining pressure. In contrast, the compression coefficients for seepage pores in samples GY and YB decrease significantly with increasing confining pressure, showing a maximum reduction of 35% to 42%. However, the compressibility coefficient of adsorption pores exhibits a linear decrease with increasing confining pressure, showing an average decay rate of 0.008 MPa−1/MPa. The sample LZ exhibits high compression coefficients for both seepage and adsorption pores; the compression coefficient for adsorption pores decreases continuously from 0.12 MPa−1, while the seepage pore compression coefficient decreases from 0.20 MPa⁻1 to 0.15 MPa−1. The difference in compressibility between the seepage and adsorption pores of sample CD, compared to the other samples mainly results from the different pore structures and mineral compositions. This variation further affects the distribution characteristics of the T2 signals relaxation through the pore deformation under confining pressure, which is in agreement with the experimental observations presented in Section 3.2.
4.3. Mechanism of Stress Sensitivity to Permeability Evolution
The characterization of stress-dependent permeability is one of the critical issues in the development of unconventional oil and gas extraction and CO2 geological sequestration [33,34,35]. The traditional permeability model assumes the homogeneity of the rock’s pore structure and assumes that the variation in permeability with effective stress is dominated by only a single pore type. Shi and Durucan proposed the reservoir permeability as a function of stress and pore compression coefficient [36]:
where k0 and k are the initial permeability and the permeability after loading confining pressure, respectively, Cf is the average pore compression coefficient of the rock samples, Δσ is the pressure difference, and α is the deformation coefficient.
Equation (7) effectively characterizes permeability–pore compressibility relationships in conventional reservoirs with homogeneous, interconnected pore networks. However, shales exhibit significant divergence in compressibility coefficients between adsorption and seepage pores. The two-part Hooke model effectively quantifies this heterogeneity effect [32]. This model assumes that the pore structure can be represented as a composite spring system, consisting of a hard spring (adsorption pore) and a soft spring (seepage pore), as illustrated in Figure 9. The total permeability of the shale can be expressed by incorporating the distinct, stress-dependent permeability contributions from its soft and hard components [37]:
where kh and ks are the permeability of the hard and soft parts, respectively, kh0 is the initial permeability of the hard part, β is the stress-sensitive coefficient, ch and cs are the pore compression coefficient of the hard and soft parts, respectively, ϕh0 is the initial porosity of the hard part, Ks is the elastic modulus, and m is the material constants.
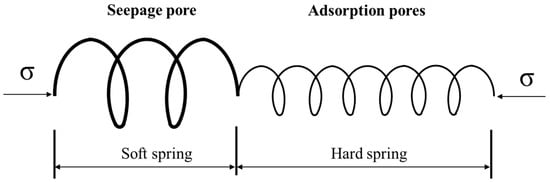
Figure 9.
A dual spring model.
The normalized permeability can quantify the permeability reduction due to the increase in confining pressure:
where k0 is the sample permeability under the initial confining pressure and ki is the sample permeability under different confining pressures.
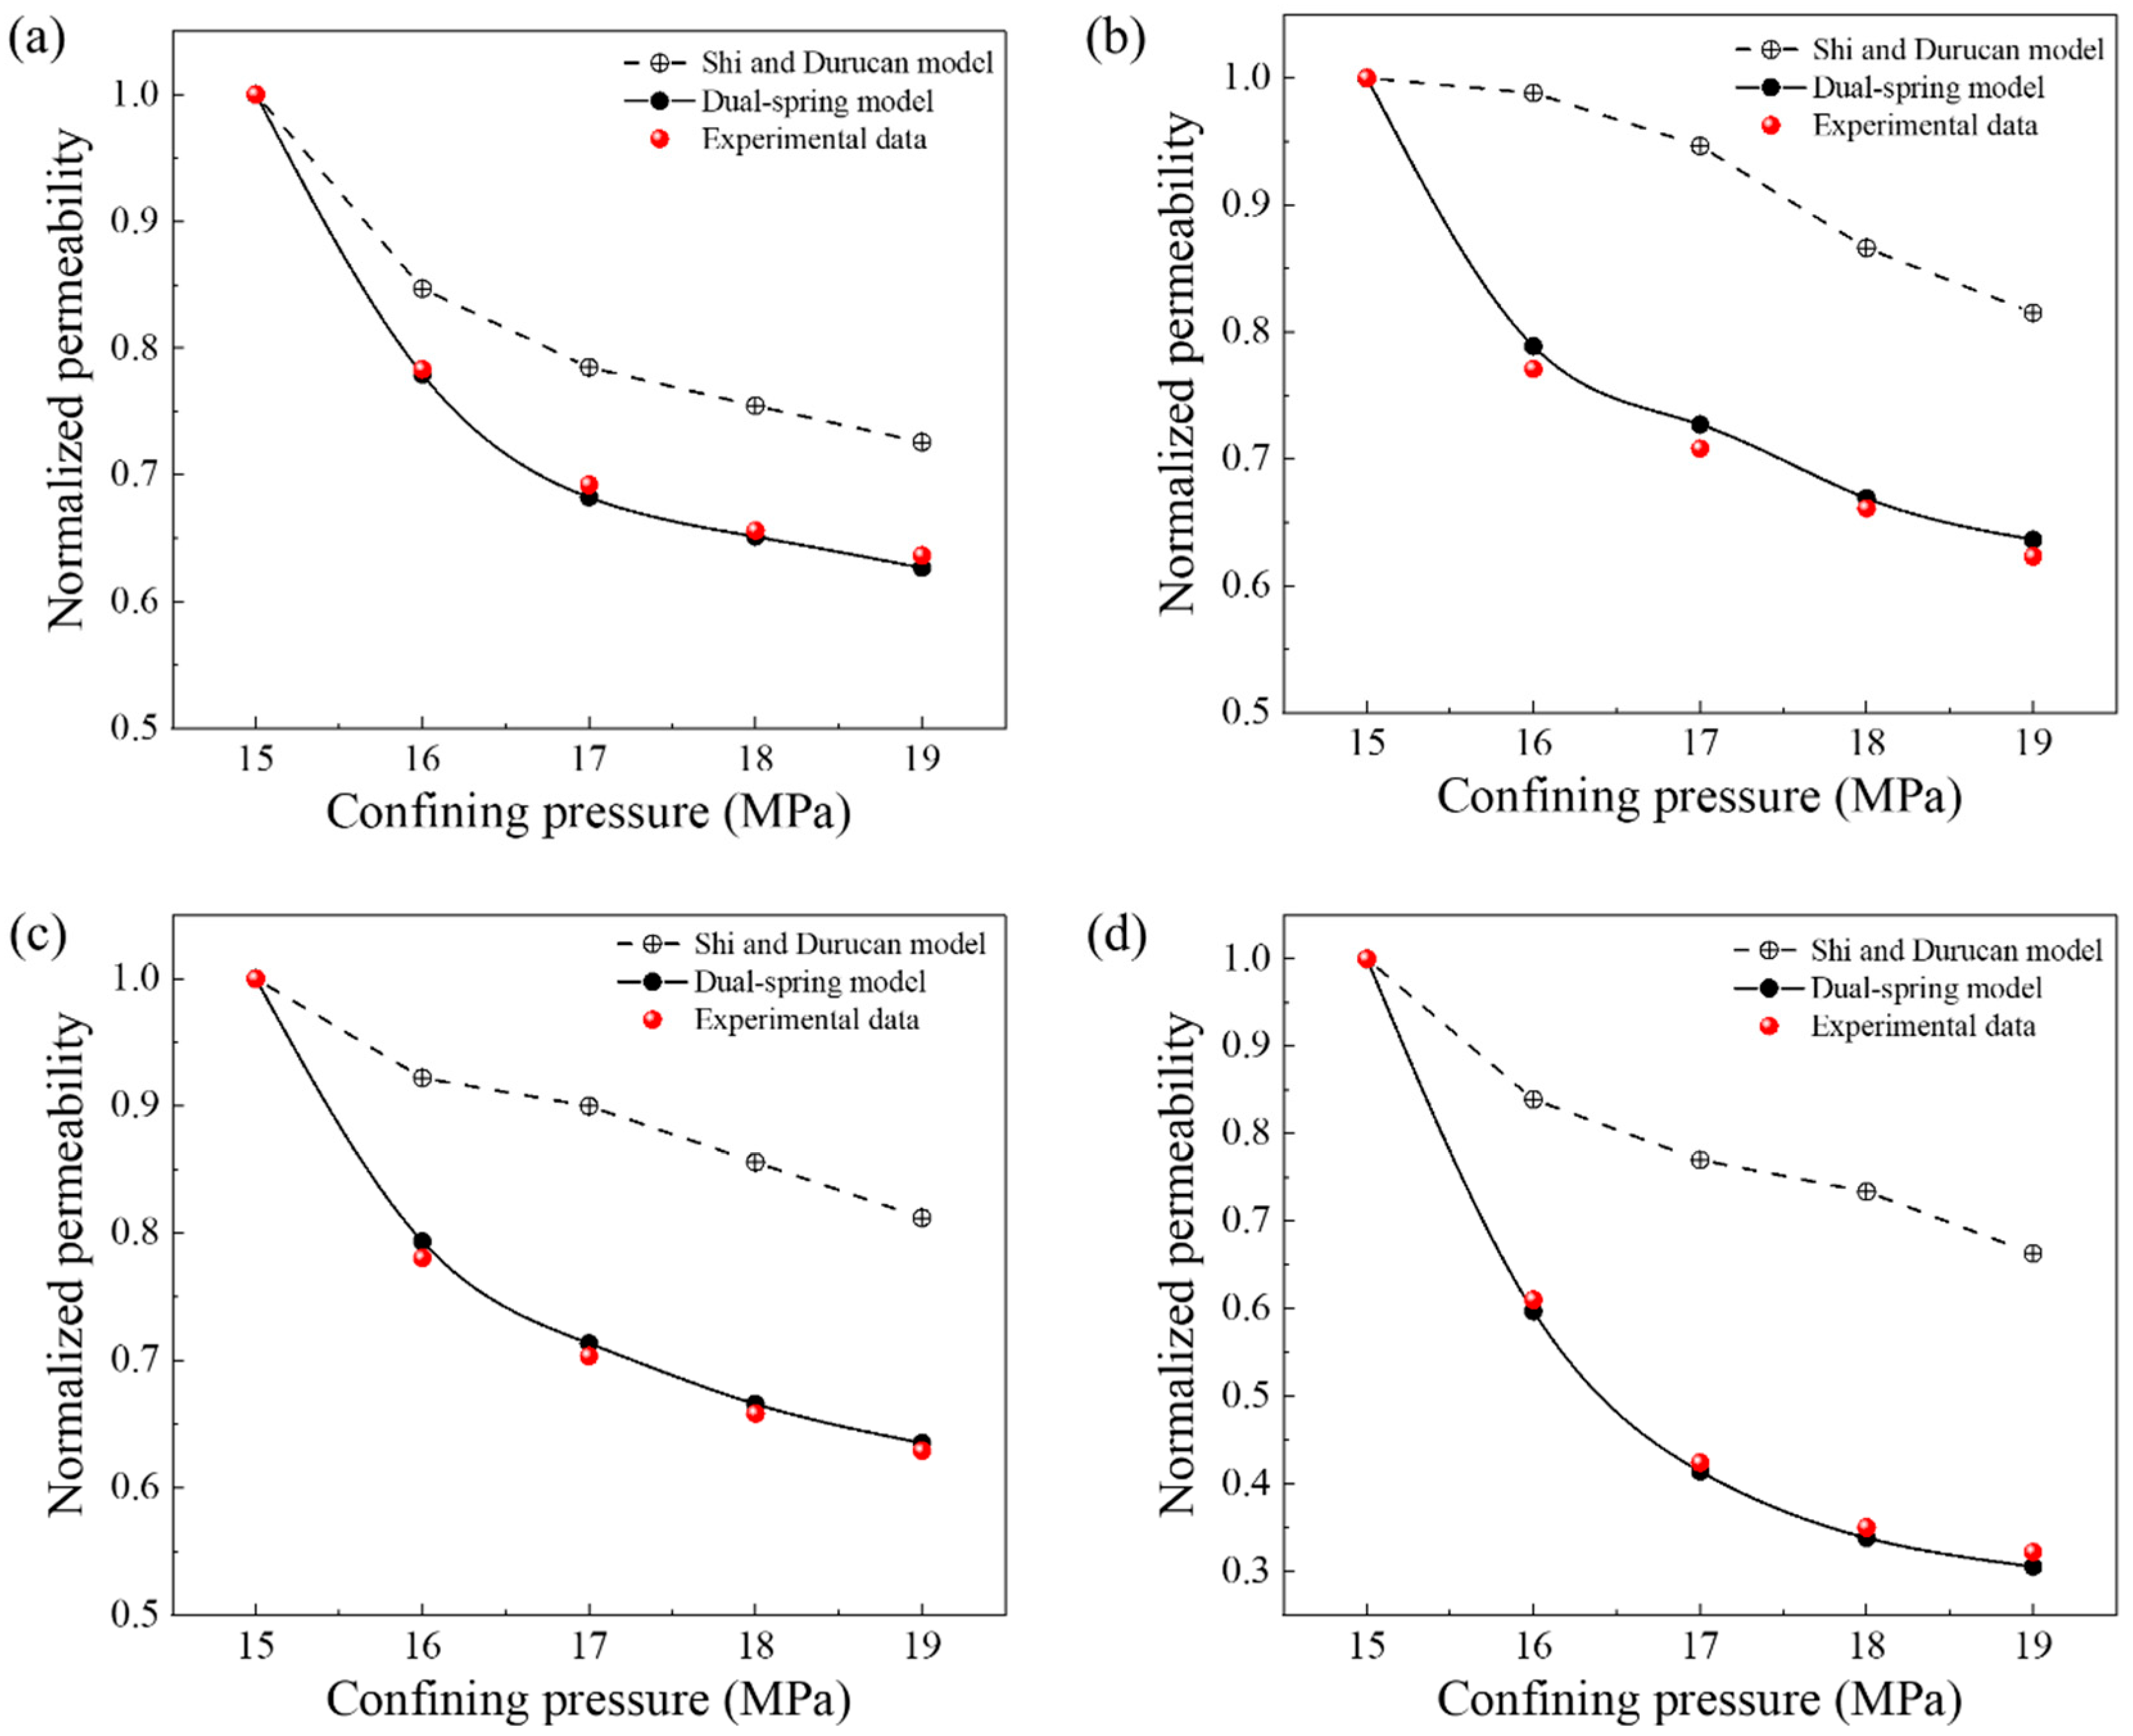
The normalized permeability of the four shales was calculated using both the Shi and Durucan model and the dual-spring model, with comparative results presented in Figure 10. The normalized permeability derived from the Shi and Durucan model is significantly higher than the experimental results, exhibiting an error exceeding twofold. In contrast, the permeability calculated using the dual-spring model is more consistent with the experimental values.
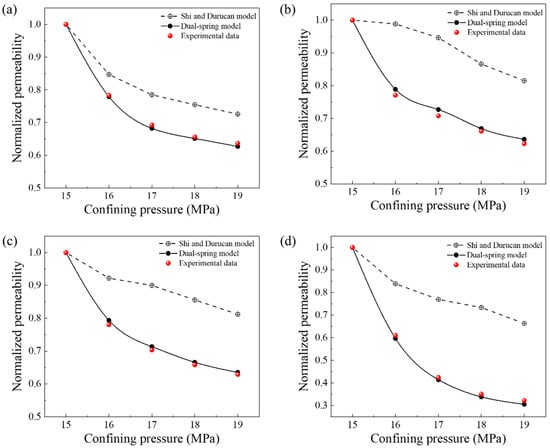
Figure 10.
Comparison of permeability evolution under varying confining pressures: dual-spring model, Shi–Durucan model, and experimental data. (a) Sample CD. (b) Sample GY. (c) Sample YB. (d) Sample LZ.
Root mean squared error (RMSE) is a widely used metric for assessing the discrepancy between model predictions and actual observations. It quantifies the accuracy of the model’s predictions, with smaller values indicating a closer alignment between the calculated model values and the experimental data [30].
here, e is the root mean square error, n is the number of data points, ki-m is the model-calculated permeability, and ki-e is the experimentally measured permeability.
The root mean squared error (RMSE) values of the two computational models are presented in Table 2. The RMSE of the Shi and Durucan model ranges from 0.0777 (CD sample) to 0.2947 (LZ sample), whereas the RMSE values of the dual-spring model remain consistently below 0.0136 across all samples. A dual-spring model, differentiating the compressibility of seepage and adsorption pores, reduces prediction errors by 92–96% compared to traditional models. This comparison highlights the superior accuracy and robustness of the dual-spring model in predicting permeability under varying confining pressures, particularly in low-permeability rock.
Table 2.
Root mean square error for the two computational models.
This discrepancy is due to the average pore compression coefficient underestimating the closure of seepage pores, resulting in a smaller compression coefficient that leads to overestimated permeability calculations. Therefore, it is evident that the traditional permeability model effectively describes the relationship between permeability and pore compressibility in conventional reservoirs characterized by good pore connectivity. In contrast, low-permeability shale exhibits poor pore connectivity, a complex pore size distribution, and a maximum variation in pore size spanning five orders of magnitude. Furthermore, significant differences exist between the compressibility of seepage pores and adsorption pores, complicating the influence of pore structure on shale permeability. The permeability calculated using the dual-spring model can more accurately represent the varying contributions of pores with different properties to shale permeability, thereby significantly enhancing the precision of permeability calculations in shale.
5. Conclusions
This study investigates the stress-dependent permeability of shale through integrated NMR–seepage experiments conducted under varying confining pressures, focusing on the differential compressibility of seepage and adsorption pores. The main conclusions are as follows:
(1) Based on NMR-displacement experiments, this study quantitatively established the T2 cutoff distinguishing seepage pores (T2 ≥ T2 cutoff) and adsorption pores (T2 < T2 cutoff). The compression coefficient of the pores decreases as confining pressure increases, and the stress sensitivity of the seepage pores is significantly greater than that of the adsorption pores, particularly in shale samples that are rich in clay minerals. Revealing the critical influence of mineral composition on fluid occupancy states. Results demonstrate that sample LZ (quartz–illite-dominated) exhibits the lowest T2 cutoff (1.2 ms) and highest mobile fluid proportion (67.8%), whereas calcite–dolomite-dominated sample CD (51.5 ms) shows limited pore connectivity due to rigid mineral frameworks, resulting in the lowest mobile fluid fraction (36.6%).
(2) Seepage and adsorption pores exhibit distinct stress sensitivities under confining pressure (15–19 MPa). Seepage pores display higher compressibility (Cs = 0.09–0.20 MPa−1) than adsorption pores (Ch = 0.07–0.12 MPa−1), with significant volumetric reductions Clay minerals develop adsorbed water films that create nanoscale elastic buffer layers, effectively mitigating the closure of adsorption pores under confining pressure. Conversely, the closure of seepage pores is primarily influenced by brittle minerals, which play a dominant role in reducing permeability.
(3) The dual-spring model significantly enhances permeability prediction accuracy by differentiating the compressibility of seepage pores and adsorption pores. Compared to the Shi–Durucan model (RMSE = 0.0777–0.2947), the dual-spring model reduces errors by 92–96% (RMSE <0.0136), achieving strong agreement with experimental data. This advancement enhances predictive capabilities related to CO2 geological storage, hydrocarbon reservoirs, and hydraulic engineering applications.
This study advances the understanding of stress-dependent permeability in shale caprocks; however, certain limitations exist. Experiments were restricted to water-saturated samples under monotonic confining pressure at ambient temperature, omitting multiphase fluids, thermal effects, and cyclic stress conditions. Future work will address these gaps by expanding lithological diversity, incorporating cyclic loading–unloading experiments, and integrating temperature-controlled experiments. These extensions aim to refine predictive models for CO2 geological storage safety under realistic subsurface conditions.
Author Contributions
Data curation, J.T. and J.Y.; Formal analysis, J.T.; Writing-original draft, J.T.; Conceptualization, H.W.; Methodology, H.W.; Writing—review &editing, X.L.; Formal analysis, X.L.; Supervision, J.S.; Funding acquisition, J.S. All authors have read and agreed to the published version of the manuscript.
Funding
This research was funded by the National Natural Science Foundation of China under Grant No. 42372296.
Data Availability Statement
Data will be made available on request.
Conflicts of Interest
The authors declare no conflict of interest.
References
- McGlade, C.; Ekins, P. The geographical distribution of fossil fuels unused when limiting global warming to 2 °C. Nature 2015, 517, 187–190. [Google Scholar] [CrossRef] [PubMed]
- Wang, J.; Wang, H.; Wang, X.; Yang, S.; Wu, H.; Leung, C.; Tian, J. A multiphysical-geochemical coupling model for caprock sealing efficiency in CO2 geosequestration. Deep Undergr. Sci. Eng. 2023, 2, 188–203. [Google Scholar] [CrossRef]
- Cui, G.; Liu, J.; Wei, M.; Elsworth, D. Evolution of permeability during the process of shale gas extraction. J. Nat. Gas Sci. Eng. 2018, 49, 94–109. [Google Scholar] [CrossRef]
- Tian, J.; Sheng, J.; Wang, H.; Wang, J.; Wang, X.; Shen, L. Competing impacts of internal pores dissolution and external compression on the permeability evolution during the infiltration of weakly acidic fluids. J. Hydrol. 2023, 625, 130027. [Google Scholar] [CrossRef]
- Hou, L.; Yu, Z.; Luo, X.; Wu, S. Self-sealing of caprocks during CO2 geological sequestration. Energy 2022, 252, 124064. [Google Scholar] [CrossRef]
- Liu, Z. Assessment of CO2 Sequestration Capacity in a Low-Permeability Oil Reservoir Using Machine Learning Methods. Energies 2024, 17, 3979. [Google Scholar] [CrossRef]
- Romanov, V.; Haljasmaa, I.; Soong, Y. On Caprock Seal Integrity of Tuscaloosa Mudstone at Cranfield, MS (USA), CO2 Injection Site. Sustainability 2024, 16, 5758. [Google Scholar] [CrossRef]
- Wang, L.; Wei, B.; You, J.; Pu, W.; Tang, J.; Lu, J. Performance of a tight reservoir horizontal well induced by gas huff–n–puff integrating fracture geometry, rock stress-sensitivity and molecular diffusion: A case study using CO2, N2 and produced gas. Energy 2023, 263, 125696. [Google Scholar] [CrossRef]
- Moosavi, S.A.; Goshtasbi, K.; Kazemzadeh, E.; Bakhtiari, H.A.; Esfahani, M.R.; Vali, J. Relationship between porosity and permeability with stress using pore volume compressibility characteristic of reservoir rocks. Arab. J. Geosci. 2014, 7, 231–239. [Google Scholar] [CrossRef]
- Wang, H.; Tian, J.; Lin, J.; Liu, J.; Maharjan, N.; Sheng, J. NMR investigation on pore-scale stress sensitivity during pore fluid pumping cycles: Implication for geological fluid storage. Int. J. Hydrogen Energy 2025, 120, 1–12. [Google Scholar] [CrossRef]
- Liu, M.; Xie, R.; Li, C.; Gao, L. A new method for determining tight sandstone permeability based on the characteristic parameters of the NMR T2 distribution. Appl. Magn. Reson. 2017, 48, 1009–1029. [Google Scholar] [CrossRef]
- Zhang, H.L.; Zuo, X.B.; Sun, Q.Q.; Liu, J.H.; Hou, Z.J.; Liu, J.Y.; Tian, J.L. Preparation superhydrophobic surfaces of concrete via evaporation-induced self-assembly of TiO2 and MA-TiO2 suspension. Constr. Build. Mater. 2025, 475, 140984. [Google Scholar] [CrossRef]
- Adenutsi, C.D.; Li, Z.; Xu, Z.; Sun, L. Influence of net confining stress on NMR T2 distribution and two-phase relative permeability. J. Pet. Sci. Eng. 2019, 178, 766–777. [Google Scholar] [CrossRef]
- Li, S.; Tang, D.; Pan, Z.; Xu, H.; Huang, W. Characterization of the stress sensitivity of pores for different rank coals by nuclear magnetic resonance. Fuel 2013, 111, 746–754. [Google Scholar] [CrossRef]
- Wang, H.; Tian, J.; Wang, J.; Wang, X.; Sheng, J. A novel NMR-capillary pressure method for quantifying pore connectivity and its impact on permeability evolution. J. Hydrol. 2025, 660, 133330. [Google Scholar] [CrossRef]
- Chang, B.; Tong, Q.; Cao, C.; Zhang, Y. Effect of pore-throat structure on movable fluid and gas–water seepage in tight sandstone from the southeastern Ordos Basin, China. Sci. Rep. 2025, 15, 7714. [Google Scholar] [CrossRef]
- Cheng, Y.; Guo, C.; Chen, P.; Shi, H.; Tan, C.; Cheng, M.; Xing, Y.; Luo, X. Stress sensitivity of carbonate gas reservoirs and its microscopic mechanism. Pet. Explor. Dev. 2023, 50, 166–174. [Google Scholar] [CrossRef]
- Tian, X.; Cheng, L.; Cao, R.; Wang, Y.; Zhao, W. A new approach to calculate permeability stress sensitivity in tight sandstone oil reservoirs considering micro-pore-throat structure. J. Pet. Sci. Eng. 2015, 133, 576–588. [Google Scholar] [CrossRef]
- Liu, H.; Zheng, L.; Yang, J. Relationships between permeability, porosity and effective stress for low-permeability sedimentary rock. Int. J. Rock Mech. Min. Sci. 2015, 78, 304–318. [Google Scholar] [CrossRef]
- Pimienta, L.; Fortin, J.; Guéguen, Y. New method for measuring compressibility and poroelasticity coefficients in porous and permeable rocks. J. Geophys. Res. Solid Earth 2017, 122, 2670–2689. [Google Scholar] [CrossRef]
- Hou, X.; Zhu, Y.; Wang, Y.; Liu, Y. Experimental study of the interplay between pore system and permeability using pore compressibility for high rank coal reservoirs. Fuel 2019, 254, 115712. [Google Scholar] [CrossRef]
- Zhao, N.; Wang, L.; Sima, L.; Guo, Y.; Zhang, H. Understanding stress-sensitive behavior of pore structure in tight sandstone reservoirs under cyclic compression using mineral, morphology, and stress analyses. J. Pet. Sci. Eng. 2022, 218, 110987. [Google Scholar] [CrossRef]
- Gao, H.; Wang, C.; Cao, J.; He, M.; Dou, L. Quantitative study on the stress sensitivity of pores in tight sandstone reservoirs of Ordos basin using NMR technique. J. Pet. Sci. Eng. 2019, 172, 401–410. [Google Scholar] [CrossRef]
- Jin, L.; Wang, G.; Cao, J.; Xiao, C.; Qin, Z. Investigation of pore structure and petrophysical property in tight sandstones. Mar. Pet. Geol. 2018, 91, 179–189. [Google Scholar] [CrossRef]
- Shang, X.; Wang, J.; Wang, H.; Wang, X. Combined effects of CO2 adsorption-induced swelling and dehydration-induced shrinkage on caprock sealing efficiency. Int. J. Environ. Res. Public Health 2022, 19, 14574. [Google Scholar] [CrossRef]
- Lai, F.; Li, Z.; Zhang, W.; Dong, H.; Kong, F.; Jiang, Z. Investigation of pore characteristics and irreducible water saturation of tight reservoir using experimental and theoretical methods. Energy Fuels 2018, 32, 3368–3379. [Google Scholar] [CrossRef]
- Yao, Y.; Liu, D.; Yao, C.; Tang, D.; Tang, S.; Huang, W. Petrophysical characterization of coals by low-field nuclear magnetic resonance (NMR). Fuel 2010, 89, 1371–1380. [Google Scholar] [CrossRef]
- Liao, J.J.; Tang, H.M.; Zhu, X.M.; Li, G.; Lin, D. Study on stress sensitivity in ultra-low permeability sandstone reservoir of Chang 8 oil formation in Xifeng Oilfield based on microscopic methods. J. China Univ. Pet. 2012, 36, 27–33. [Google Scholar] [CrossRef]
- Li, F.F.; Yang, S.L.; Liao, W.W.; Gao, W.L.; Nie, X.R. Stress sensitivity of extra-low permeability volcanic gas reservoir Jilin oilfield and its origin. J. Xi’Shiyou Univ. (Nat. Sci. Ed.) 2013, 28, 1–5. [Google Scholar]
- Zhang, W.; Zhang, D.; Zhao, J. Experimental investigation of water sensitivity effects on microscale mechanical behavior of shale. Int. J. Rock Mech. Min. Sci. 2021, 145, 104837. [Google Scholar] [CrossRef]
- Berryman, J.G. Estimates and rigorous bounds on pore-fluid enhanced shear modulus in poroelastic media with hard and soft anisotropy. Int. J. Damage Mech. 2006, 15, 133–167. [Google Scholar] [CrossRef]
- Liu, H.H.; Rutqvist, J.; Berryman, J.G. On the relationship between stress and elastic strain for porous and fractured rock. Int. J. Rock Mech. Min. Sci. 2009, 46, 289–296. [Google Scholar] [CrossRef]
- Wang, S.; Gu, Z.; Guo, P.; Zhao, W. Comparative laboratory wettability study of sandstone, tuff, and shale using 12-MHz NMR T1-T2 fluid typing: Insight of shale. SPE J. 2024, 29, 4781–4803. [Google Scholar] [CrossRef]
- Liu, G.; Shang, D.; Zhao, Y.; Du, X.; Wang, W.; Zhu, H.; Mews, K.S. Characterization of brittleness index of gas shale and its influence on favorable block exploitation in southwest China. Front. Earth Sci. 2024, 12, 1389378. [Google Scholar] [CrossRef]
- Zhang, L.; Yuan, X.; Luo, L.; Tian, Y.; Zeng, S. Seepage characteristics of broken carbonaceous shale under cyclic loading and unloading conditions. Energy Fuels 2023, 38, 1192–1203. [Google Scholar] [CrossRef]
- Shi, J.Q.; Durucan, S. Drawdown induced changes in permeability of coalbeds: A new interpretation of the reservoir response to primary recovery. Transp. Porous Media 2004, 56, 1–16. [Google Scholar] [CrossRef]
- Zhao, Y.; Zhu, G.; Liu, S.; Wang, Y.; Zhang, C. Effects of pore structure on stress-dependent fluid flow in synthetic porous rocks using microfocus x-ray computed tomography. Transp. Porous Media 2019, 128, 653–675. [Google Scholar] [CrossRef]

Disclaimer/Publisher’s Note: The statements, opinions and data contained in all publications are solely those of the individual author(s) and contributor(s) and not of MDPI and/or the editor(s). MDPI and/or the editor(s) disclaim responsibility for any injury to people or property resulting from any ideas, methods, instructions or products referred to in the content. |
© 2025 by the authors. Licensee MDPI, Basel, Switzerland. This article is an open access article distributed under the terms and conditions of the Creative Commons Attribution (CC BY) license (https://creativecommons.org/licenses/by/4.0/).