Abstract
Water alternating gas (WAG) flooding is a relatively mature technology for enhanced oil recovery (EOR). It combines the advantages of water flooding and gas flooding to maintain reservoir pressure and effectively mitigate the issues of high mobility ratio and fingering, demonstrating preferable application prospects. However, the evaluation of its development effect faces the challenges of complexity and lack of adaptability attributed to the multiple interactions of various factors involved in WAG flooding. Moreover, there are few studies evaluating the development effect of producers. Therefore, the traditional hierarchical analysis process (AHP) is improved in this study to fill the gap in this technological field. This process is combined with the entropy weight method (EWM) to establish a coupled evaluation model. Subsequently, this study classifies the contribution weights of producers and proposes adjustment suggestions for the primary development contradictions. This study finds that the contribution weight of producers to the well group indicates that the development effect of producers is no longer influenced by a single factor, but is determined by the coupling effect of geological, engineering, and development factors. By constructing a coupled model and fully utilizing on-site data to objectively characterize the underground production situation, the development effect of producers can be more accurately reflected. Finally, a closed-loop optimization system for evaluating the development effect and potential of producers with WAG flooding is established, laying a theoretical foundation for dynamic analysis and development adjustment of on-site engineers.
1. Introduction
Water flooding and gas flooding have long been widely employed as the primary enhanced oil recovery (EOR) technologies in oilfield development. However, it is difficult to satisfy the demand for achieving high recovery rates with the traditional single displacement method [1,2,3]. This is owing to the increasing complexity of development stages and reservoir characteristics, such as high water cut stages [4,5], fractured-cavernous carbonate reservoirs [6,7], and unconventional reservoirs [8]. Generally, injected water preferentially flows through a high permeability region during the process of water flooding, attributed to the reservoir heterogeneity, fluid viscosity difference, and gravity differentiation effect. Then a phenomenon of ‘finger-in’ or ‘tongue-in’ is generated. Consequently, the sweep efficiency in the low-permeability area is relatively low [9,10,11]. Special reservoirs show significant sensitivity to injected water. In high temperature and high pressure (HTHP) reservoirs, the deposition probability of calcium carbonate increases with the increase in formation water volume and temperature, while the increase in pressure has the opposite effect [12]. Additionally, the high viscosity of injected water considerably differs from the flow characteristics of crude oil [13], further restricting the application of water flooding technology in complex reservoirs. Gas flooding has demonstrated excellent performance in improving the sweep efficiency in low-permeability areas [14,15]. Nonetheless, the high mobility and the difference in density with crude oil can induce severe high mobility ratios and viscous fingering phenomena [16,17], such as in ultra-heavy oil reservoirs with strong heterogeneity and natural fracture development [18,19]. As a result, uneven displacement appears, affecting displacement efficiency and EOR [20].
WAG flooding, as a mature technology to improve recovery, remarkably improves the final recovery [21,22,23] while maintaining the reservoir pressure [24] and effectively alleviating headaches of high mobility ratio and fingering [25] by combining the advantages of water flooding and gas flooding [26]. Simultaneously, it lowers gas injection volume and possesses favorable economic prospects compared to gas flooding, which exhibits great potential for the development of complex reservoirs [27]. Wang et al. [28] conducted experimental and modeling studies following continuous CO2 injection. The research showed that the application of mixed CO2-WAG injection could significantly enhance oil recovery. It was also identified that asphaltene deposition and inorganic scaling were the primary factors contributing to the reduction in porosity. Majidaie et al. [29] employed chemical slug injection during the WAG process to diminish oil–water interfacial tension. This approach led to a 26 percent enhancement in oil recovery when compared to traditional WAG flooding methods. Wang et al. [30] explored an innovative approach utilizing flue gas–water-alternating flue gas (flue Gas-WAG) injection technology after water flooding to achieve multi-component flue gas storage. This enhanced both the ultimate oil recovery rate and flue gas storage capacity of the reservoir. However, because of the multiple interactions of dynamic and static factors involved in WAG flooding, the evaluation of its development effect is encountering the challenges of complexity and lack of adaptability. A systematic and comprehensive evaluation system and methodology for this technology has yet to be established.
The evaluation system consists of the model and the method, as illustrated in Figure 1. It plays a crucial role in the accuracy and reliability of the evaluation results. Early evaluation systems majorly include the experimental method [31], the Delphi method [32,33,34], and the analogy method [35]. Nonetheless, these methods only belong to qualitative analysis and cannot be quantitatively characterized. The advantages and disadvantages of these systems are detailed in Table 1. Among them, the experimental method is time-consuming and expensive and cannot promptly meet the application needs on site. The Delphi method is too subjective, rendering it difficult to guarantee the accuracy and reliability of the results, and the analogical method has a restricted scope of application. Multi-criteria decision-making issues are evaluated by mathematical methods based on known dynamic and static parameters and dynamic development indexes to achieve efficient, accurate quantitative evaluation [36,37].
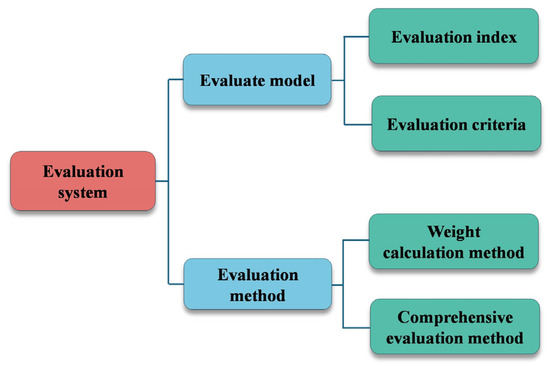
Figure 1.
The structure of the evaluation system.

Table 1.
Characteristics of the early evaluation system.
The evaluation model consists of indexes and criteria. The evaluation criteria are clear regulations based on the specific requirements and determination scales of the evaluation indexes. Concerning water flooding development, Liu et al. [38] proposed a development index system based on parameters such as effective porosity, air permeability, and producer/injector ratio, and conducted qualitative analysis. Factor analysis was performed to simplify indexes and revealed the internal structure, so as to accurately evaluate the effect of water flooding development and the scientific formulation of the development strategy. Huang et al. [39] employed recoverable reserves, recovery degree, and cumulative water storage rate to build a quantitative reference standard for the effect of water flooding development. Wen et al. [40] constructed a system of indexes such as water cut growth rate, injection–production ratio, recoverable reserves and EOR. Their results lay a foundation for evaluating the development effect of water flooding in the ultra-high water cut stage and optimizing the development strategy. Regarding the development of unconventional oil and gas reservoirs, especially shale gas reservoirs in the ocean, Jiang et al. [41] conducted an adaptive analysis of evaluation criteria based on crucial indexes such as reservoir thickness, porosity, single well gas production, and net cash flow. It contributes to promoting the advancement of the marine shale gas development technology. With factors such as the relative density of crude oil, original oil saturation, porosity, reservoir temperature, and average formation pressure, Zheng et al. [42] compared the importance of each factor and established evaluation criteria. Nonetheless, the evaluation model failed to consider the influence of formation thickness. Rui et al. [43] tackled the lack of a quantitative evaluation system for oil and gas reservoir development and established a comprehensive quantitative evaluation system with vital indexes such as porosity, permeability, and cumulative production. It aims to improve the design accuracy of the development plan. In the current research, qualitative, quantitative, and comprehensive development effect evaluations of different development methods or development stages have been conducted based on reservoir characteristic indexes, development dynamic indexes, and economic evaluation indexes.
Evaluation methods primarily include weight calculation methods and comprehensive evaluation methods. Generally, weight calculation methods can be divided into subjective weight methods and objective weight methods. Subjective weight methods assign weights to indexes following the experience or judgment of experts. Objective weight methods are based on the objective information reflected by index values themselves. In the research of subjective weights, Fu et al. [44] established an evaluation system for water flooding reservoirs based on the division of development stages and optimized the water injection development strategy. Fuzzy comprehensive evaluation, a quantitative evaluation method based on fuzzy mathematics, essentially quantifies the uncertainty and fuzziness in complex systems through affiliation functions and evaluation models. It combined with multiple index weights to ultimately achieve a comprehensive evaluation of the system or object. Practical research has revealed [45,46,47] that this method can decompose the complex water injection effect into specific quantifiable indexes for quantitative evaluation by constructing a multi-level index system. Hence, it can effectively overcome the limitations of traditional evaluation methods in multi-factor processing. Lu et al. [48] evaluated the application effect of CO2 flooding technology by constructing a fuzzy mathematical method under the consideration of both the technical economy and environmental friendliness. In the research of objective weights, Geng et al. [49] adopted principal component analysis (PCA) to simplify complex indexes and extract crucial indexes to comprehensively evaluate the water injection effect of the edge and bottom water reservoir. Ju et al. [50] introduced the entropy weight method (EWM) to establish an evaluation model through the analysis of six influencing factors and quantify the brittleness and ductility of tight reservoir rocks. Su et al. [51] scientifically assessed the water injection development effect for the carbonate fracture–vuggy reservoir through Fuzzy Measure Theory and Martens distance method.
For more accurate and reliable evaluation results, more researchers have investigated comprehensive evaluation methods. Gu et al. [52] considered the reservoir fracture characteristics comprehensively through a combination of qualitative and quantitative evaluation methods, supporting decision-making for the water injection in this type of reservoir. The hierarchical analysis method (AHP), a multi-objective weighting method combining qualitative and quantitative methods, has been proposed and widely applied to some evaluations, such as estimating the permeability of fault zones [53] and improving the decision-making of heavy oil projects [54]. Wang et al. [55] performed AHP and fuzzy comprehensive judgment to determine the subjective and objective weights of each index. They presented a simple and fast evaluation method suitable for the effect of water flooding of ultra-high water cut reservoirs in the later stage, guiding the adjustment of the oilfield development. With the Overlapping Advantage Method and PCA, Li et al. [56] quantified the weights of five influencing factors, unveiling that the thickness of carbonate rocks in the study area determines the development of high-quality reservoirs. The brittleness index and fracture density can significantly elevate the development efficiency of the reservoir. Song et al. [57] quantified the correlation between initial production capacity and high-pressure mercury injection parameters (Q1) and pore morphology parameters (Q2) through gray correlation analysis. They constructed a comprehensive weight model by integrating subjective weights of AHP and objective weights of EWM and built a double-coupled quantitative classification system based on the micro-pore structure to specify that the Northwestern underwater distributary channel area is the favorable zone for high-quality reservoir development.
At present, the evaluation of the development effect of producers for WAG flooding is missing. Under this consideration, a closed-loop optimization system is established in this study to evaluate the development effect and potential of producers in the existing research block, the WAG pilot area. It aims to fill the gap in the field of evaluating the development effect of producers for WAG flooding and provide the theoretical foundation and practical paradigm for relevant operations in the field. Specifically, various kinds of dynamic and static data are collected and collated upon the actual situation in the field. New evaluation criteria are defined with the proposed evaluation method to form an evaluation model with independent and reasonable evaluation indexes. Then, it is necessary to determine the contribution weight of each producer to the production of the well group in the process of development effect evaluation. Hence, the EWM is used to determine its weight. Meanwhile, the traditional AHP is innovatively improved to enhance the objectivity of its method, namely, IAHP. Additionally, the EWM–IAHP coupled evaluation model is constructed by combining the weights to obtain coupled weights that are more in line with the actual development effect to attenuate the dominant index effect. Finally, producers with different development effects are categorized, and targeted development adjustment measures are proposed under the principle of technical economy. In this way, a closed-loop optimization system is formed based on the evaluation of the development effect and potential of producers with WAG flooding.
2. Methodology
2.1. Data Pre-Processing
Positive, negative, and extreme indexes usually coexist in the process of constructing an evaluation index system. The data of various types of indexes considerably differ in scale and order of magnitude, and each has a clear data range. Consequently, they may be improperly influenced by the data size itself in the evaluation process, affecting the accuracy of the evaluation results. With the purpose of managing this headache, the data are standardized with respect to extreme deviation. The value range of the data will be standardized in the interval [0, 1] through this treatment, thereby unifying scales and eliminating biases caused by different scales and orders of magnitude. This improves the rationality of the role of indexes in the evaluation process while further strengthening the scientificity and reliability of the entire evaluation system. Thus, it can be guaranteed that evaluation results accurately reflect the actual situation and lay a solid foundation for subsequent research and decision-making.
The formula for the positive index is
The formula for the negative index is
The formula for the extreme index is
where Xij denotes the normalized data, xij represents the original data for a particular index, x0 indicates the best value for the extreme index, xmin embodies the minimum value in the original data, and xmax designates the maximum value in the original data.
2.2. Entropy Weight Method (EWM)
Information entropy, an index of the degree of chaos in information systems, is a crucial metric for quantifying the uncertainty of random variables and has been widely applied in many fields. Since its concept was proposed, it has essentially functioned in the assessment of suitability or risks such as engineering disasters and multi-criteria decision analysis. The reason lies in that it can objectively evaluate the distribution of each evaluation factor and to some extent exclude the interference of evaluator’s subjective factors on evaluation results. In this study, the information entropy theory is introduced to reflect the development effect of each producer by evaluating the degree of disorder of its evaluation indexes and selecting indexes such as injection–production ratio as the basis for measuring the development effect. When these indexes are more dispersed, the information entropy value is smaller, and the corresponding weight is larger, and vice versa. Therefore, the contribution weights of producers in the well group can be determined by analyzing the degree of dispersion in indexes of each producer. Specifically, the EWM is employed to derive the entropy weight of each evaluation index based on the degree of differentiation of evaluation index values for each producer. Subsequently, the entropy weight of each evaluation index is weighted for all producers to obtain objective evaluation results. The evaluation process is depicted in Figure 2. The basic steps of the EWM are described as follows:
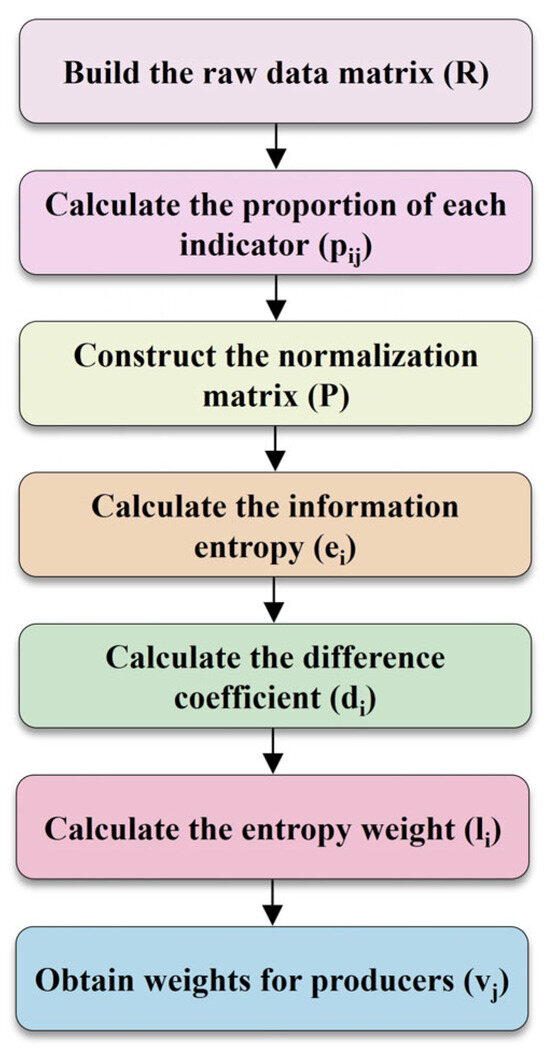
Figure 2.
The EWM evaluation process.
Assuming that there are m producers and n evaluation indexes, the raw data matrix R = (rij)n×m of the corresponding evaluation indexes of producers is formed as
where rij denotes the index value of jth producer under ith evaluation index.
The proportion pij of the index value for jth producer is calculated under ith evaluation index:
Thus, the normalization matrix P = (pij)n×m is constructed for each producer.
The information entropy ei for ith index is calculated:
where ei embodies the information entropy of the index, ei > 0. If pij = 0, define ei = 0.
The difference coefficient di for ith index is calculated:
The entropy weight li for ith index is calculated:
The contribution weight of each producer to the well group is calculated:
2.3. Improved Analytic Hierarchy Process (IAHP)
Analytic Hierarchy Process (AHP), proposed in 1971 by Thomas L. Satie, is a multi-criteria decision-making tool. It transforms subjective judgments of decision-makers into quantitative analyses through an ordered hierarchical structure and thus effectively integrates qualitative and quantitative indexes in complex system evaluations. The universality of the method is reflected in three aspects as follows. First, the structured characterization of complex systems is achieved by constructing a hierarchical model with a strict mathematical foundation. Second, the pairwise comparison method is adopted to convert expert experience into a computable judgment matrix. Third, the weighting system based on the eigenvector method is equipped with a strict consistency-checking mechanism. Consequently, the AHP method has demonstrated strong decision support capabilities in over 30 disciplines, primarily involving resource allocation, risk evaluation, and engineering preference.
The core of the AHP evaluation model follows a three-stage systematic process. First, a structured analysis is conducted based on the intrinsic logical relationship of decision-making objectives to construct a multi-level architecture consisting of the objective layer, the criterion layer and the solution layer. Concerning complex decision-making issues, the key elements are decomposed, and the hierarchical relationships are reorganized, so as to form an evaluation system with a tree structure. This ensures that the dominant relationships between elements are consistent with the logical hierarchy. In concrete implementation, the decision-making problem is disassembled into non-overlapping sets of elements, which are hierarchically categorized in accordance with their affiliation to form a top-down control chain structure. Second, the proportional scaling method is employed to compare elements at the same level pairwise. Meanwhile, the weight coefficients of each element relative to the upper factors are derived by constructing a judgment matrix that satisfies the mathematical requirements. Finally, the weights of each layer are progressively synthesized by the recursive algorithm to obtain the global priority of the bottom layer scheme relative to the top layer target.
The standard implementation procedure of the method comprises four key steps: (1) designing the hierarchical architecture; (2) constructing the judgment matrix; (3) performing hierarchical single ranking and consistency validation to solve the eigenvector and calculate the maximum eigenvalue; (4) hierarchical total ranking and consistency validation. The evaluation flow is exhibited in Figure 3. The steps are described in detail as follows.
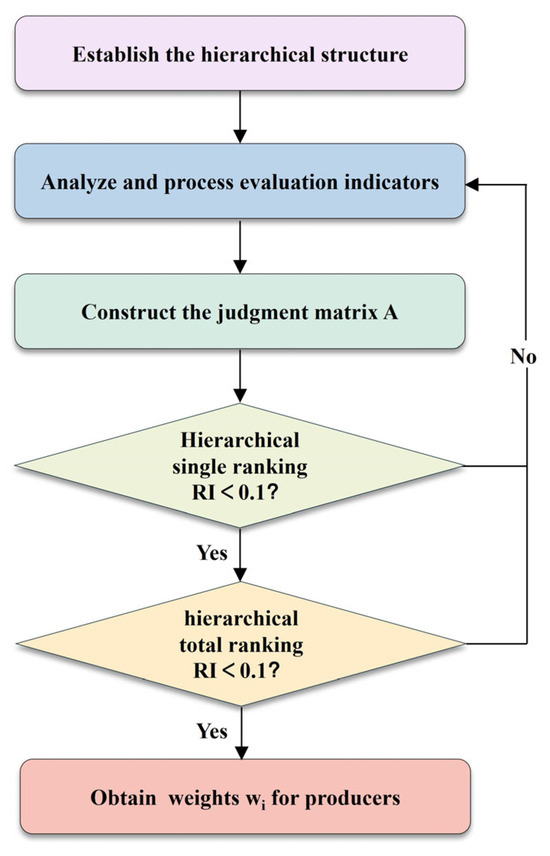
Figure 3.
The improved AHP evaluation process.
2.3.1. Design the Hierarchical Architecture
After an in-depth and comprehensive analysis of the specific problem, various elements of the problem are accurately decomposed and categorized into a hierarchical architecture with strict affiliation upon their intrinsic logical connections and hierarchical attributes, including the objective layer, the criterion layer, and the solution layer. The hierarchical architecture of the hierarchies and relationships between elements is accurately visualized and depicted by a block diagram. If the number of elements in a particular layer is large, it will be decomposed into several sub-layers to optimize the clarity and logical coherence of the hierarchical architecture. In the constructed hierarchical model, the elements of the same layer are both dominated and constrained by the elements at the previous layer. Meanwhile, they exert influence and regulation on elements at the next layer. The top of the hierarchical architecture is the objective layer, which generally contains only one core element, and the bottom of the architecture is the solution layer. Between the objective and solution layers are one or more criterion layers, which are essentially composed of indexes or guideline layers, as exhibited in Figure 4.
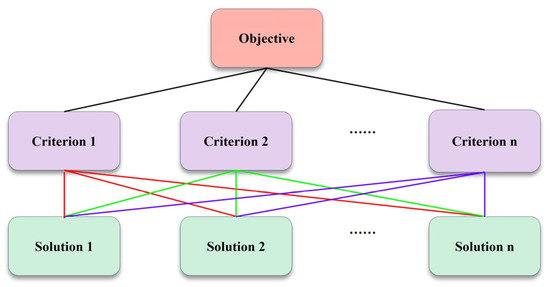
Figure 4.
The hierarchical model of AHP.
2.3.2. Construct the Judgment Matrix
After the establishment of the hierarchical model, the affiliation between the upper and lower layers is determined. Concurrently, a judgment matrix is constructed by comparing the importance of each factor in the same layer relative to the previous layer pairwise with the 1–9 scale method (Table 2). If factor A in the previous layer is taken as the criterion, b1, b2, …, bn are the factors in the next layer dominated by A, and the importance of bi and bj are evaluated relative to the criterion A. The nth order matrix A = (aij)n×n, where aij represents the degree of importance (or unimportance) of the factor bi over bj relative to criterion A.

Table 2.
The judgment matrix.
Considering that comparisons and judgments between two factors commonly depend on the experience of experts, they involve more human factors and are highly subjective. In this study, the intrinsic attributes of factors are first determined, and different factors are classified according to positive, negative, and extreme indexes. Following the size of the data range, the dynamic nine-level scaling algorithm is innovatively used for splitting (Equation (10)), and measurements and comparisons are based on the distance between factors. This method realizes the precise quantification of the differences between factors while establishing robust theoretical support for AHP through data-driven objective comparison. Thus, it effectively improves the objectivity and scientificity of the decision-making process, offering a new perspective and methodology for related research fields.
All judgment matrices must satisfy aii = 1, aii = 1/aji (where i, j = 1, 2, …, n). The meanings of the judgment matrix scales are presented in Table 3.

Table 3.
Scale 1–9 and meaning.
2.3.3. Hierarchical Single Ranking and Consistency Validation
The hierarchical single ranking aims to determine the weight of the importance order of a factor in the previous layer to factors in the next layer that it dominates. First of all, the eigenvector and the maximum eigenvalue of the judgment matrix A are calculated, namely, the equation AW = λmaxW. Among them, W represents the regularized eigenvector corresponding to λmax, λmax denotes the maximum eigenvalue of the judgment matrix A, and the component Wi of W embodies the single ranking weight value of the corresponding factor, reflecting the ranking weights of factors at the same layer regarding their importance to a certain factor at the previous layer.
Each column of the judgment matrix is normalized:
The normalized judgment matrix is summed by row:
The vector is normalized:
Then is the desired eigenvector.
The maximum eigenvalue of the judgment matrix is computed:
where (AW)i denotes the ith component of the vector AW.
If the judgment matrix A has full consistency, then λmax = n. However, this situation is relatively rare. Thus, the consistency index CI = (λmax − n)/(n − 1) must be calculated to perform consistency validation for hierarchical single ranking. When CI = 0, the judgment matrix has full consistency; the smaller the value of CI, the better the consistency of the judgment matrix. Additionally, the random consistency ratio CR = CI/RI of the judgment matrix, that is, the ratio of CI to the average random consistency index RI of the same order, should be calculated to judge whether the consistency of the matrix is satisfactory or not. If CR < 0.10, the result of hierarchical single ranking has satisfactory consistency, otherwise it is necessary to adjust the value of the judgment matrix factors. The values of the average random consistency index RI are listed in Table 4.

Table 4.
The value of RI.
2.3.4. Hierarchical Total Ranking and Consistency Validation
The hierarchical total ranking is performed to quantify the relative importance ranking weights of factors at the same layer relative to the highest layer. The process follows the principle of progressive calculation from the highest to the lowest layer. Notably, the hierarchical single ranking result of the highest layer is equivalent to its hierarchical total ranking result. With the purpose of ensuring the reliability of the total hierarchical ranking result, consistency validation is conducted to verify the consistency of its result. Therefore, the random consistency ratio of hierarchical total ranking is calculated, where CI denotes the consistency index of hierarchical total ranking , CIj represents the consistency index of the judgment matrix of the B layer corresponding to aj; RI indicates the random consistency index of hierarchical total sorting ; RIj embodies the random consistency index of the judgment matrix of B layer corresponding to aj. If CR < 0.10, the hierarchical total ranking has satisfactory consistency calculation results; if CR ≥ 0.10, each judgment matrix must be adjusted until the random consistency ratio CR of the hierarchical total ranking is less than 0.10.
2.4. Coupled EWM–IAHP Evaluation Model
AHP and EWM are two common methods of determining weights in the field of multi-index comprehensive evaluation. By constructing a structured hierarchical model, AHP assigns weights to the evaluation indexes based on the subjective judgment of experts on the relative importance of indexes. From another perspective, the EWM is determined by the entropy value of the index data. It objectively reflects the information contained in indexes, mines inherent rules of the data, and makes the evaluation more objective. However, it fails to incorporate the experience of experts and opinions of decision-makers, and the weight values sometimes deviate from the actual importance of indexes.
The single use of AHP or EWM can easily induce a preference for a certain method in the evaluation results. Evaluation results should converge to create a unified method to be more in line with the actual situation. Innovatively, weights vi obtained by EWM are coupled with weights wi obtained by IAHP in this study to construct coupled weights ui, expressed as
where 0 ≤ ≤ 1.
This coupling approach aims to integrate the advantages of the two methods, balance the effects of dominant indexes, and enhance the objectivity of the weight determination.
Specifically, vi and wi represent weights of the EWM and IAHP model, respectively, and α denotes the proportional coefficient. This study takes α = 0.5, which is the arithmetic mean of weights of two models [58], to objectively present the respective advantages of the two methods and provide strong support for accurate evaluation.
3. Case Study
In this section, high-quality dynamic and static data are collected and screened for the WAG development test area in a low-permeability carbonate reservoir in the Middle East. Based on the processed field data, an evaluation system for the effect and potential of WAG development of producers is established from the EWM evaluation process, the IAHP evaluation process, and lastly the coupled model evaluation process.
3.1. Raw Data Description
The object of this study is a short-axis anticline and low-amplitude structural reservoir located in the Middle East. The pore type of this reservoir is medium-high porosity (4–28%) and the permeability is 0.1–16 mD. It is a typical low-permeability reservoir. Following rock type classification, the reservoir is divided into three categories: gas top zone at the top, pure oil zone at the waist, and oil–water transition zone at the edge.
The reservoir is developed with gas injection and area well patterns. Due to the long-term injection of a large amount of hydrocarbon gas and some CO2, the field development benefits are constrained by high GOR and declining production. Therefore, a WAG pilot test area (four injectors and four producers) is performed in the region to evaluate the field production effect and demonstrate the feasibility of its implementation to develop the oil–water transition zone at scale. In order to save economic costs, the extracted hydrocarbon gas and CO2 are reinjected as the injection gas for the development of the pilot test area.
Additionally, static and dynamic data of the well group are collected and collated from the oilfield site with various factors taken into account to fully characterize the WAG development effect of producers in the test area. Attributed to the short production time and in the experimental stage, the dataset contains information collected from four horizontal producers at the oilfield site one year before and six months after the test, including well ID, porosity (φ), permeability (K), horizontal length of the producer (L), average monthly oil production (AMOP), gas–oil ratio (GOR), water cut (WCT), and injection–production ratio (VRR). Specifically, there are signs of gas breakthrough, and GOR is high, owing to the injection of a large amount of gas before the implementation of the test area. Hence, the data after six months of the test are screened to weaken the residual effect of gas injection. After logical analysis from three dimensions of geology, engineering, and development, redundant parameters or indexes are eliminated. Meanwhile, we select evaluation indexes that can accurately reflect the development effect of producers with WAG flooding by combining the actual data sources in the field, as detailed in Table 5 and Table 6.

Table 5.
Status of production before the implementation of the pilot area.

Table 6.
Status of production after the implementation of the pilot area.
3.2. Evaluation of Development Effect Using EWM
Following the EWM process in Section 2.2, the standardized data are input into corresponding Equations (5)–(7) to calculate evaluation index values of producers (Table 7). GOR has the greatest influence on the development effect of producers, accounting for 28.9% among seven categories of indexes; the porosity is second, accounting for 16.1%; and the influence of VRR is the smallest, with a value of only 2.7%, as illustrated in Figure 5. The weights of other indexes are not significantly different, suggesting that development indexes have the greatest influence, followed by geology indexes and engineering indexes have the smallest influence. This result is consistent with the empirical knowledge during the development process.

Table 7.
Index information for EWM.
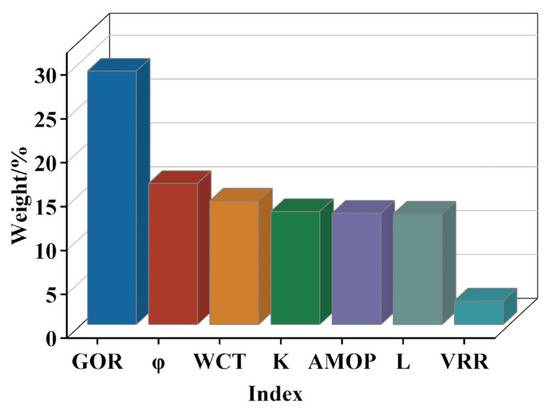
Figure 5.
Entropy ranking of indexes.
As revealed by comparing the actual situation of the current field development, high GOR is the primary constraint at present, and the development should be adjusted based on the main controlling factor; a large amount of gas is injected before the implementation of WAG development, resulting in gas channeling or potential risks. The high GOR has consistently been the main factor restricting producer production, in good agreement with the current on-site problems and reflecting the retention effect of previously injected gas in the subsurface. Simultaneously, weights of various indexes are favorable references for reservoir engineers’ later dynamic analysis and development adjustment, allowing for the timely discovery of problems and prevention of hidden risks.
Producers are calculated by Equations (8) and (9) to obtain their respective production contribution weights in the well group. Specifically, the P-89 producer has the largest contribution to the production of the well group (32.4%) and exhibits the best production effect. The P-119 producer has the smallest contribution to the production of the well group (11.3%) and demonstrates the worst production effect, as depicted in Figure 6. The results are different from those obtained by measuring the production effect of a producer based on the single production index. The development effect of producers, influenced by various factors, is analyzed and judged from geology, development and engineering dimensions to objectively and quantitatively reflect the real production status of producers.
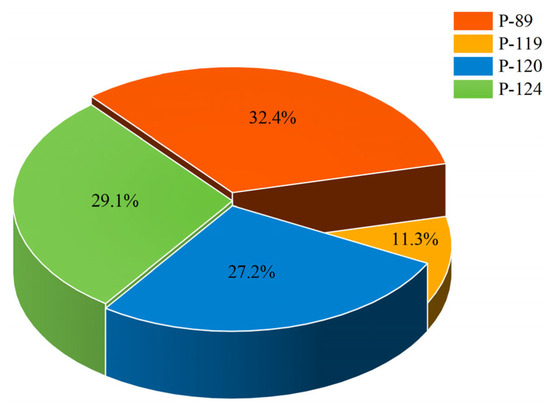
Figure 6.
Contribution weights vj of producers.
3.3. Evaluation of Development Effect Using IAHP
The hierarchical architecture of this study does not involve sub-layers in the criterion layer. This belongs to the problem of hierarchical single ranking and consistency validation. The framework of the evaluation of the WAG development effect of producers is illustrated in Figure 7. Following the IAHP in Section 2.3, the field data collected after the implementation of WAG development in the pilot test area (2024.01–2024.12) are adopted for the preliminary evaluation of the development effect, and scores are calculated, as listed in Table 8. As revealed from scores, the P-119 producer has the lowest score, implying that the production effect is still the worst. Upon scores of each producer, the dynamic nine-level scale method is performed to finely classify and accurately evaluate the difference in the level of development effect of producers (Figure 8). The judgment matrix is constructed, as detailed in Table 9.
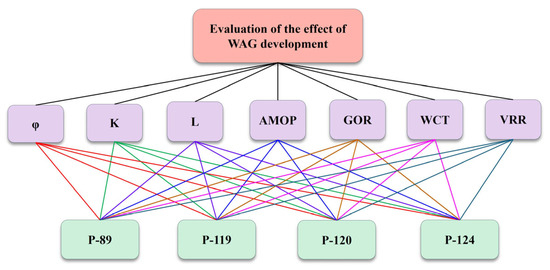
Figure 7.
The framework of WAG development effect evaluation.

Table 8.
Preliminary evaluation.

Figure 8.
The schematic diagram of production effect differences.

Table 9.
The judgment matrix for producers.
After the judgment matrix is normalized by Equations (11) and (12), the eigenvector and the maximum eigenvalue of producers are obtained according to Equations (13) and (14). In addition, the eigenvector (namely, weight values) and the weight wi of each producer’s contribution to the production of the well group are obtained, as presented in Table 10:

Table 10.
Results of IAHP calculations.
Through the consistency validation and referencing Table 4, the average random consistency index RI of the judgment matrix is 0.90 and CR = 0.088 < 0.10 considering 4 producers in the well group, n = 4. In other words, the consistency validation is passed, validating the rationality and reliability of IAHP proposed in this study.
According to IAHP calculation, among the production contribution weights of each producer in the well group, the P-120 producer has the largest contribution to the production of the well group (54.3%) and exhibits the best production effect; the P-119 producer has the smallest contribution to the production of the well group (5.3%) and reveals the worst production effect, as illustrated in Figure 9. The analysis unveils that the P-120 producer has the highest score in the preliminary evaluation, benefitting from the best performance of K, L, AMOP, WCT, and VRR. Many indexes of 5/7 rank first, and production and engineering factors exert a significant impact on its development. Thus, its production contribution weight is over 50% in the evaluation of the method, with a large potential for development. The scores of φ, K, and WCT of the P-119 producer are the lowest, and GOR and VRR are high. Most of the indexes perform poorly, while geology and development factors have a greater impact on it. Its evaluation results are consistent with the weight in Section 3.2, the lowest in the well group. This further confirms that the well condition is very poor and it is difficult to develop it effectively.
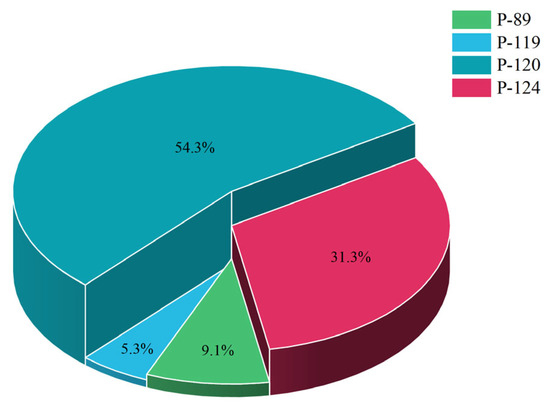
Figure 9.
Contribution weights wi for producers.
3.4. Evaluation of Development Effect Using Coupled Model
The two methods mentioned above have different ways of analyzing and processing the data, as well as capturing the main controlling factors affecting the development effect of producers in different directions. Therefore, the calculated weights of the two types above are weighted to obtain the evaluation results most in line with real well conditions. This contributes to further reducing the errors caused by the two methods themselves, balancing their dominant indexes, and achieving a more accurate evaluation of the production effect of each producer in the well group.
Coupled weights that best match the real well conditions for each producer are obtained by bringing vi and wi into the coupled weights Equation (15), as illustrated in Figure 10.
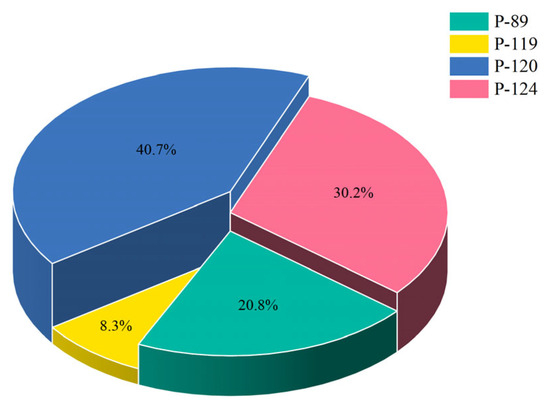
Figure 10.
Contribution weights ui for producers.
Lastly, the P-120 producer has the largest contribution weight to the well group (40.7%) and the best development effect. The P-119 producer has the smallest contribution weight to the well group (11.3%) and the worst development effect. Particularly, producers with better production effects should maintain the status quo or make local adjustments upon the concept of maximizing the whole life cycle to develop the residual oil in the reservoir in a balanced way while lessening the heterogeneity caused by the development. Meanwhile, producers with poorer development effects improve the reservoir condition and elevate the development efficiency by changing the well working system under the principle of engineering economy and considering the reservoir modification measures if necessary.
4. Results
In this study, production contribution weights of the well group are divided into five levels to provide clearer feedback to field reservoir engineers and other staff about the current production status of producers. There are four producers in this well group, and the ideal production contribution weight for each producer should be 25%. However, the actual production performance is different attributed to different geology, development, and engineering factors of each producer, as well as the existence of inter-well interferences. Under the consideration of development effect and exploitation potential it is divided into five classification levels of high-efficiency well, medium-high-efficiency well, medium-efficiency well, low-efficiency well, and ultra-low-efficiency well with the threshold value of 25% as the boundary. This facilitates on-site staff in quickly analyzing and judging the current situation based on the historical production information of the well group, quantifying the degree of challenges faced by producers, and making dynamic adjustments to production systems promptly to avoid potential risks. The classification levels can be employed for early warning, elimination of risks and development optimization.
With the purpose of further assisting in guiding the practical development work, different development adjustment plans and engineering interventions for reservoir modification are provided for the potential issues of each class of producers. They are of reference and significance for engineers engaged in reservoir dynamic analysis and development adjustment. To date, the whole process of evaluating the effect of WAG development has formed a complete closed-loop optimization system, as depicted in Figure 11.
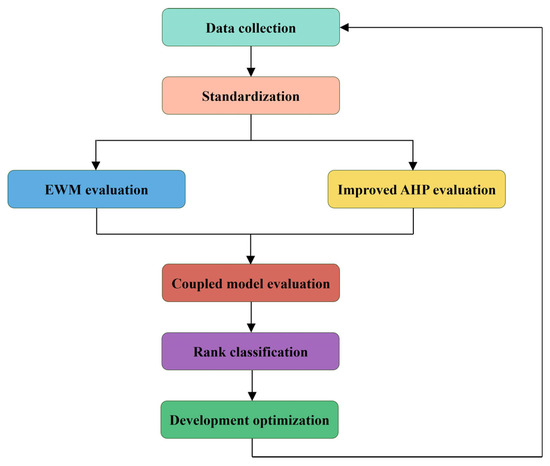
Figure 11.
The closed-loop optimization system for evaluating WAG development effect and potential of producers.
We conducted a systematic analysis on the current situation in the early stage of the WAG development in such low-permeability complex carbonate reservoirs in the Middle East, where the production capacity of producers varies greatly, the stable production period is short, and the injection and production response is poor. Considering the economic feasibility of the development, the development effects of producers in the well group are classified into different levels based on the actual situation on site. Reasonable development adjustment suggestions are proposed, as presented in Table 11.

Table 11.
Classification level of development effect and adjustment measures.
Given coupled weights calculated in Section 3.4 and the principle of development economy, the following development adjustment measures are provided for the pilot test area (Table 12); these measures are employed to optimize the current production situation, make producers in a healthy and virtuous full-life development cycle, and ultimately form a closed-loop optimization system for evaluating the effect and potential of WAG development.

Table 12.
Proposed adjustment measures for producers in the pilot test area.
5. Discussion
There are still practical challenges and difficulties concerning this study, which require further improvement. First, the data sources collected from the field are partially limited. For example, the monitoring data of reservoir pressure and bottom hole flowing pressure have been scarce since producers are horizontal wells, triggering the difficulty of collection and the long interval between data points. The introduction of them into the evaluation model cannot effectively reflect the real well conditions of producers but rather increases the error. Second, the pilot test area has been encountering the headache of high GOR before implementation. There is the influence of the residual effect of the previous gas injection and the complexity of the development situation. Under the controlling of gas and stabilizing of oil, the periodicity of WAG is uncertain, and some of the characteristic indexes characterizing WAG development have not been introduced into the evaluation model. Finally, this research object at present is in the experimental exploration stage of WAG. The pilot test area size limits the diversity of the sample size, and the integration of more producers and multiple parameters is needed to continuously enrich the data system.
The next research work will focus on two aspects. On the one hand, the dynamic database will be updated in real time, more development indexes representing the characteristics of WAG development will be collected, and the key missing indexes will be reasonably processed by using the missing value interpolation method. The data system will be continuously enriched to evaluate the development effect more comprehensively and facilitate the rapid scale development of the pilot test area. On the other hand, the intelligent agent model has the advantages of high efficiency and is timesaving. Embedding the evaluation process into the agent model will improve the efficiency of the evaluation work. After the further promotion of the pilot test area with continuous exploration and research, the establishment of a large-scale intelligent evaluation and optimization system will significantly save manpower, material, and financial resources while reinforcing the efficiency of oilfield development.
6. Conclusions
This study established a closed-loop optimization system for low-permeability carbonate reservoirs to evaluate the production effect and potential of WAG flooding. Our research team conducted a field case study using the evaluation system developed, achieving a comprehensive quantitative evaluation of the development effect and potential of producers. Finally, rationalized development adjustment measures for the next step were given based on the development effects of different producers. The conclusions of this study are drawn as follows.
- (1)
- The improved AHP, which is based on intrinsic attributes of the factor data and does not rely on the opinions of experts, has been enhanced through innovative improvements to strengthen the objectivity and reliability of the method itself.
- (2)
- The two evaluation methods demonstrate different focuses. The weights of producers are obtained through the coupled evaluation model to weaken the dominant index effect and make evaluation results more consistent with the real situation of production.
- (3)
- Based on the contribution degree and classification levels of producers, the field staff have a clear understanding of the development situation and analyze possible risks faced by producers.
- (4)
- Reasonable development adjustments are proposed to address the main development challenges combined with the principle of development and engineering economy to form a closed-loop optimization system. This system ensures that the condition of producers is always in a healthy and virtuous cycle, prolonging the entire life cycle of producers.
Author Contributions
Conceptualization, H.Z.; methodology, H.Z.; validation, Z.W.; formal analysis, M.G.; investigation, J.C.; resources, C.W.; data curation, J.Y.; writing—original draft, H.Z.; writing—review and editing, L.S.; visualization, G.Z.; supervision, G.Z.; project administration, C.W.; funding acquisition, C.W. All authors have read and agreed to the published version of the manuscript.
Funding
This research was funded by Major Science and Technology Special Project of the China National Petroleum Corporation (Grant No. 2023ZZ19-03).
Data Availability Statement
The original contributions presented in this study are included in the article. Further inquiries can be directed to the corresponding author.
Conflicts of Interest
Authors Han Zhang, Chenji Wei, Guangya Zhu, Meng Gao, Jian Yang, Liang Sun, Jiaheng Chen were employed by the Research Institute of Petroleum Exploration and Development, PetroChina. The remaining authors declare that the research was conducted in the absence of any commercial or financial relationships that could be construed as a potential conflict of interest. The PetroChina had no role in the design of the study; in the collection, analyses, or interpretation of data; in the writing of the manuscript, or in the decision to publish the results.
References
- Qu, M.; Hou, J.; Zhao, F.; Song, Z.; Ma, S.; Wang, Q.; Li, M.; Yang, M. 3-D Visual Experiments on Fluid Flow Behavior of Water Flooding and Gas Flooding in Fractured-Vuggy Carbonate Reservoir. In Proceedings of the SPE Annual Technical Conference and Exhibition, San Antonio, TX, USA, 9–11 October 2017. [Google Scholar] [CrossRef]
- Xu, Z.; Li, S.; Li, B.; Chen, D.; Liu, Z.; Li, Z. A Review of Development Methods and EOR Technologies for Carbonate Reservoirs. Pet. Sci. 2020, 17, 990–1013. [Google Scholar] [CrossRef]
- Gorelkina, E.I.; Mugisho, J.B.; Kouadio, K.S. Waterflooding, Water-Gas Method and Generation of Carbon Dioxide in the Reservoir—Methods of Enhanced Oil Recovery and Technology Development. IOP Conf. Ser. Earth Environ. Sci. 2023, 1212, 012038. [Google Scholar] [CrossRef]
- Yang, R.; Jiang, R.; Guo, S.; Chen, H.; Tang, S.; Duan, R. Analytical Study on the Critical Water Cut for Water Plugging: Water Cut Increasing Control and Production Enhancement. Energy 2021, 214, 119012. [Google Scholar] [CrossRef]
- Bai, Y.; Pu, W.; Jin, X.; Shen, C.; Ren, H. Review of the Micro and Macro Mechanisms of Gel-Based Plugging Agents for Enhancing Oil Recovery of Unconventional Water Flooding Oil Reservoirs. J. Mol. Liq. 2024, 399, 124318. [Google Scholar] [CrossRef]
- Shedid, S.A. Influences of Fracture Orientation on Oil Recovery by Water and Polymer Flooding Processes: An Experimental Approach. J. Pet. Sci. Eng. 2006, 50, 285–292. [Google Scholar] [CrossRef]
- Wang, D.; Li, Y.; Hu, Y.; Li, B.; Deng, X.; Liu, Z. Integrated Dynamic Evaluation of Depletion-Drive Performance in Naturally Fractured-Vuggy Carbonate Reservoirs Using DPSO–FCM Clustering. Fuel 2016, 181, 996–1010. [Google Scholar] [CrossRef]
- Cheng, L.; Wang, D.; Cao, R.; Xia, R. The Influence of Hydraulic Fractures on Oil Recovery by Water Flooding Processes in Tight Oil Reservoirs: An Experimental and Numerical Approach. J. Pet. Sci. Eng. 2020, 185, 106572. [Google Scholar] [CrossRef]
- Liu, Y.; Dai, C.; Wang, K.; Zou, C.; Gao, M.; Fang, Y.; Zhao, M.; Wu, Y.; You, Q. Study on a Novel Crosslinked Polymer Gel Strengthened with Silica Nanoparticles. Energy Fuels 2017, 31, 9152–9161. [Google Scholar] [CrossRef]
- Kargozarfard, Z.; Riazi, M.; Ayatollahi, S. Viscous fingering and its effect on areal sweep efficiency during waterflooding: An experimental study. Pet. Sci. 2019, 16, 105–116. [Google Scholar] [CrossRef]
- Rini, D.; Latuan; Klea, F.; Prajanji, I.G.O.S. Waterflooding Management: Challenges and Solutions During the Injection Process to Obtain Effectively and Environmentally Based Oil Recovery in Oil and Gas Industry. IOP Conf. Ser. Earth Environ. Sci. 2021, 690, 012037. [Google Scholar] [CrossRef]
- Khormali, A.; Petrakov, D.G.; Lamidi, A.-L.B.; Rastegar, R. Prevention of Calcium Carbonate Precipitation during Water Injection into High-Pressure High-Temperature Wells. In Proceedings of the SPE European Formation Damage Conference and Exhibition, Budapest, Hungary, 3–5 June 2015. [Google Scholar] [CrossRef]
- Pal, S.; Mushtaq, M.; Banat, F.; Al Sumaiti, A. Review of surfactant-assisted chemical enhanced oil recovery for carbonate reservoirs: Challenges and future perspectives. Pet. Sci. 2018, 15, 77–102. [Google Scholar] [CrossRef]
- Tang, W.; Sheng, J. Huff-n-Puff Gas Injection or Gas Flooding in Tight Oil Reservoirs? J. Pet. Sci. Eng. 2022, 208, 109725. [Google Scholar] [CrossRef]
- Liang, B.; Chen, C.; Jia, C.; Wang, C.; Wang, X.; Zha, Y.; Wang, R.; Meng, Z.; Wang, H. Carbon Capture, Utilization and Storage (CCUS) in Oil and Gas Reservoirs in China: Status, Opportunities and Challenges. Fuel 2024, 375, 132353. [Google Scholar] [CrossRef]
- Mogensen, K.; Masalmeh, S. A Review of EOR Techniques for Carbonate Reservoirs in Challenging Geological Settings. J. Pet. Sci. Eng. 2020, 195, 107889. [Google Scholar] [CrossRef]
- Kang, W.; Zhou, B.; Issakhov, M.; Gabdullin, M. Advances in Enhanced Oil Recovery Technologies for Low Permeability Reservoirs. Pet. Sci. 2022, 19, 1622–1640. [Google Scholar] [CrossRef]
- Guo, K.; Li, H.; Yu, Z. In-situ heavy and extra-heavy oil recovery: A review. Fuel 2016, 185, 886–902. [Google Scholar] [CrossRef]
- Tran, T.Q.; Neogi, P.; Bai, B. Stability of CO2 Displacement of an Immiscible Heavy Oil in a Reservoir. SPE J. 2017, 22, 539–547. [Google Scholar] [CrossRef]
- Wang, Z.; Bai, B.; Long, Y.; Wang, L. An Investigation of CO2-Responsive Preformed Particle Gel for Conformance Control of CO2 Flooding in Reservoirs with Fractures or Fracture-Like Channels. SPE J. 2019, 24, 2398–2408. [Google Scholar] [CrossRef]
- Afzali, S.; Rezaei, N.; Zendehboudi, S. A Comprehensive Review on Enhanced Oil Recovery by Water Alternating Gas (WAG) Injection. Fuel 2018, 227, 218–246. [Google Scholar] [CrossRef]
- Fatemi, S.M.; Sohrabi, M. Mechanistic Study of the Effect of Gas/Oil IFT on the Performance of Gas, WAG and SWAG Injections in Mixed-Wet Systems. In Proceedings of the SPE Annual Technical Conference and Exhibition, Houston, TX, USA, 28–30 September 2015; SPE-Society of Petroleum Engineer. [Google Scholar] [CrossRef]
- Panda, M.N.; Ambrose, J.G.; Beuhler, G.; McGuire, P.L. Optimized EOR Design for the Eileen West End Area, Greater Prudhoe Bay. SPE Reserv. Eval. Eng. 2009, 12, 25–32. [Google Scholar] [CrossRef]
- Han, L.; Gu, Y. Optimization of Miscible CO2 Water-Alternating-Gas Injection in the Bakken Formation. Energy Fuels 2014, 28, 6811–6819. [Google Scholar] [CrossRef]
- Moradpour, N.; Pourafshary, P.; Zivar, D. Experimental Analysis of Hybrid Low Salinity Water Alternating Gas Injection and the Underlying Mechanisms in Carbonates. J. Pet. Sci. Eng. 2021, 202, 108562. [Google Scholar] [CrossRef]
- Ahmadi, Y.; Eshraghi, S.E.; Bahrami, P.; Hasanbeygi, M.; Kazemzadeh, Y.; Vahedian, A. Comprehensive Water–Alternating-Gas (WAG) Injection Study to Evaluate the Most Effective Method Based on Heavy Oil Recovery and Asphaltene Precipitation Tests. J. Pet. Sci. Eng. 2015, 133, 123–129. [Google Scholar] [CrossRef]
- Liao, C.; Liao, X.; Zhao, X.; Lu, N.; Ding, H.; Wang, H.; Liu, Y. Study on Enhanced Oil Recovery Technology in Low Permeability Heterogeneous Reservoir by Water-Alternate-Gas of CO2 Flooding. In Proceedings of the SPE Asia Pacific Oil and Gas Conference and Exhibition, Jakarta, Indonesia, 22–24 October 2013; SPE-165907-MS. [Google Scholar] [CrossRef]
- Wang, Z.; Yang, S.; Lei, H.; Yang, M.; Li, L.; Yang, S. Oil Recovery Performance and Permeability Reduction Mechanisms in Miscible CO2 Water-Alternative-Gas (WAG) Injection after Continuous CO2 Injection: An Experimental Investigation and Modeling Approach. J. Pet. Sci. Eng. 2017, 150, 376–385. [Google Scholar] [CrossRef]
- Majidaie, S.; Onur, M.; Tan, I.M. An Experimental and Numerical Study of Chemically Enhanced Water Alternating Gas Injection. Pet. Sci. 2015, 12, 470–482. [Google Scholar] [CrossRef]
- Wang, Z.; Sun, B.; Guo, P.; Wang, S.; Liu, H.; Liu, Y.; Zhou, D.; Zhou, B. Investigation of Flue Gas Water-Alternating Gas (Flue Gas–WAG) Injection for Enhanced Oil Recovery and Multicomponent Flue Gas Storage in the Post-Waterflooding Reservoir. Pet. Sci. 2021, 18, 870–882. [Google Scholar] [CrossRef]
- Shokoya, O.S.; Mehta, S.A.; Moore, R.G.; Maini, B.B.; Pooladi-Darvish, M.; Chakma, A.K. Evaluation of the Miscibility and Contribution of Flue Gas to Oil Recovery Under High Pressure Air Injection. J. Can. Pet. Technol. 2002, 41, PETSOC-02-10-03. [Google Scholar] [CrossRef]
- Powell, C. The Delphi Technique: Myths and Realities. J. Adv. Nurs. 2003, 41, 376–382. [Google Scholar] [CrossRef] [PubMed]
- Hsu, Y.; Lee, C.; Kreng, V. The Application of Fuzzy Delphi Method and Fuzzy AHP in Lubricant Regenerative Technology Selection. Expert Syst. Appl. 2010, 37, 419–425. [Google Scholar] [CrossRef]
- Ahlbrandt, T.S.; Klett, T.R. Comparison of Methods Used to Estimate Conventional Undiscovered Petroleum Resources: World Examples. Nat. Resour. Res. 2005, 14, 187–210. [Google Scholar] [CrossRef]
- Galtier, O.; Abbas, O.; Le Dréau, Y.; Rebufa, C.; Kister, J.; Artaud, J.; Dupuy, N. Comparison of PLS1-DA, PLS2-DA and SIMCA for Classification by Origin of Crude Petroleum Oils by MIR and Virgin Olive Oils by NIR for Different Spectral Regions. Vib. Spectrosc. 2011, 55, 132–140. [Google Scholar] [CrossRef]
- Fu, G. A Fuzzy Optimization Method for Multicriteria Decision Making: An Application to Reservoir FLood Control Operation. Expert Syst. Appl. 2008, 34, 145–149. [Google Scholar] [CrossRef]
- Abo-Sinna, M.A.; Amer, A.H. Extensions of TOPSIS for multi-objective large-scale nonlinear programming problems. Appl. Math. Comput. 2005, 162, 243–256. [Google Scholar] [CrossRef]
- Liu, C.; Xiao, W. Index System of the Water Flooding Development of Oil Fields and Its Structural Analysis. Pet. Explor. Dev. 2010, 37, 344–348. [Google Scholar] [CrossRef]
- Huang, L. Evaluation of Waterflood Development Effect by Using Recovery Degree of Recoverable Reserves and Cumulative Water Storage Rate. E3S Web of Conferences. EDP Sci. 2020, 165, 06047. [Google Scholar] [CrossRef]
- Wen, H.; Sun, N.; Liu, Y. Index System Evaluating Water Flooding Development Effect of Oilfield at Ultra-High Water Cut Stage. J. Pet. Explor. Prod. Technol. 2017, 7, 111–123. [Google Scholar] [CrossRef][Green Version]
- Jiang, Y.; Fu, Y.; Xie, J.; Dong, D.; Zhou, K.; Cheng, X.; Qi, L.; Zhang, H.; Chen, C.; Ma, T.; et al. Development Trend of Marine Shale Gas Reservoir Evaluation and a Suitable Comprehensive Evaluation System. Nat. Gas Ind. B 2020, 7, 205–214. [Google Scholar] [CrossRef]
- Zheng, Y.; Xiong, Y.; Hou, T.; Sun, L. Screening method based on fuzzy optimum for gas injection in candidate reservoir. J. Southwest. Pet. Inst. 2005, 27, 44–47. [Google Scholar] [CrossRef]
- Rui, Z.; Lu, J.; Zhang, Z.; Guo, R.; Ling, K.; Zhang, R.; Patil, S. A Quantitative Oil and Gas Reservoir Evaluation System for Development. J. Nat. Gas Sci. Eng. 2017, 42, 31–39. [Google Scholar] [CrossRef]
- Fu, L.; Ni, J.; Fan, Z.; Li, X. Evaluation Method and Application of Different Development Stages in Waterflooding Reservoirs. In Proceedings of the SPE Kuwait Oil and Gas Show and Conference, Kuwait City, Kuwait, 15–18 October 2017; D031S011R002. [Google Scholar] [CrossRef]
- Zhang, P.; Feng, G. Application of Fuzzy Comprehensive Evaluation to Evaluate the Effect of Water Flooding Development. J. Pet. Explor. Prod. Technol. 2018, 8, 1455–1463. [Google Scholar] [CrossRef]
- Xiao, W.; Liang, Y. Fuzzy Comprehensive Evaluation of Oil Field Waterflooding Effect. Int. J. Geosci. 2021, 12, 560–571. [Google Scholar] [CrossRef]
- Li, H. Prediction Method of Oilfield Index for Water Flooding Development Based on Fuzzy Comprehensive Evaluation Algorithm. In Proceedings of the 2021 3rd International Conference on Artificial Intelligence and Advanced Manufacture 2021, Manchester, UK, 23–25 October 2021; pp. 1979–1984. [Google Scholar] [CrossRef]
- Lu, Y.; Liu, R.; Wang, K.; Tang, Y.; Cao, Y. A Study on the Fuzzy Evaluation System of Carbon Dioxide Flooding Technology. Energy Sci. Eng. 2021, 9, 239–255. [Google Scholar] [CrossRef]
- Geng, X.; Qi, M.; Liu, J.; He, C.; Li, Y. Application of Principal Component Analysis on Water Flooding Effect Evaluation in Natural Edge-Bottom Water Reservoir. J. Pet. Explor. Prod. Technol. 2021, 11, 439–449. [Google Scholar] [CrossRef]
- Ju, Y.; Wu, G.; Wang, Y.; Liu, P.; Yang, Y. 3D Numerical Model for Hydraulic Fracture Propagation in Tight Ductile Reservoirs, Considering Multiple Influencing Factors via the Entropy Weight Method. SPE J. 2021, 26, 2685–2702. [Google Scholar] [CrossRef]
- Su, Z.; Gao, S.; Li, Z.; Li, T.; Kang, N. Integrated Waterflooding Effect Evaluation Methodology for Carbonate Fractured–Vuggy Reservoirs Based on the Unascertained Measure–Mahalanobis Distance Theory. Processes 2024, 12, 274. [Google Scholar] [CrossRef]
- Gu, S.; Liu, Y.; Chen, Z.; Ma, C. A Method for Evaluation of Water Flooding Performance in Fractured Reservoirs. J. Pet. Sci. Eng. 2014, 120, 130–140. [Google Scholar] [CrossRef]
- Anvari, A.A.; Katibeh, H.; Sharifzadeh, M.; Farhadian, H. Estimation of Fault Zone Permeability with Fuzzy-Delphi AHP (FDAHP) Method. In Rock Mechanics in Civil and Environmental Engineering; CRC Press: London, UK, 2010. [Google Scholar] [CrossRef]
- Passalacqua, H.; Qubian, A. Improving the Decision Making for Heavy Oil Field Development Projects Using the Fuzzy Analytical Hierarchy Process FAHP. In Proceedings of the SPE International Heavy Oil Conference and Exhibition, Kuwait City, Kuwait, 10–12 December 2018. [Google Scholar] [CrossRef]
- Wang, C.; Kong, L.; Yuan, K.; Du, D.; Bing, S.; Li, M. Evaluation method of water flooding effect in reservoirs with ultra-high water cut. Pet. Drill. Tech. 2020, 48, 108–113. [Google Scholar] [CrossRef]
- Li, Y.; Zhang, T.; Dai, Z.; Huang, L.; Xu, Y.; Wang, X.; Fang, R.; Zhang, X.; Li, T. Quantitative Evaluation Methods of Tight Reservoirs Based on Multi-Feature Fusion: A Case Study of the Fourth Member of Shahejie Formation in Liaohe Depression. J. Pet. Sci. Eng. 2021, 198, 108090. [Google Scholar] [CrossRef]
- Song, X.; Feng, C.; Li, T.; Zhang, Q.; Pan, X.; Sun, M.; Ge, Y. Quantitative Classification Evaluation Model for Tight Sandstone Reservoirs Based on Machine Learning. Sci. Rep. 2024, 14, 20712. [Google Scholar] [CrossRef] [PubMed]
- Wen, Z. Study on AHP-EWM coupling model Evaluation of Heterogeneity in Deformed Coal Reservoirs—Taking Panguan Syncline as an Example. Ph.D. Thesis, China University of Mining and Technology, Xuzhou, China, 2022. [Google Scholar] [CrossRef]
Disclaimer/Publisher’s Note: The statements, opinions and data contained in all publications are solely those of the individual author(s) and contributor(s) and not of MDPI and/or the editor(s). MDPI and/or the editor(s) disclaim responsibility for any injury to people or property resulting from any ideas, methods, instructions or products referred to in the content. |
© 2025 by the authors. Licensee MDPI, Basel, Switzerland. This article is an open access article distributed under the terms and conditions of the Creative Commons Attribution (CC BY) license (https://creativecommons.org/licenses/by/4.0/).