
An Experimental Investigation of the Effect of Pressure and Salinity on IFT in Live Oil/Brine Systems

 , , and
Abstract
1. Introduction
2. Experimental Method
2.1. Fluid Properties
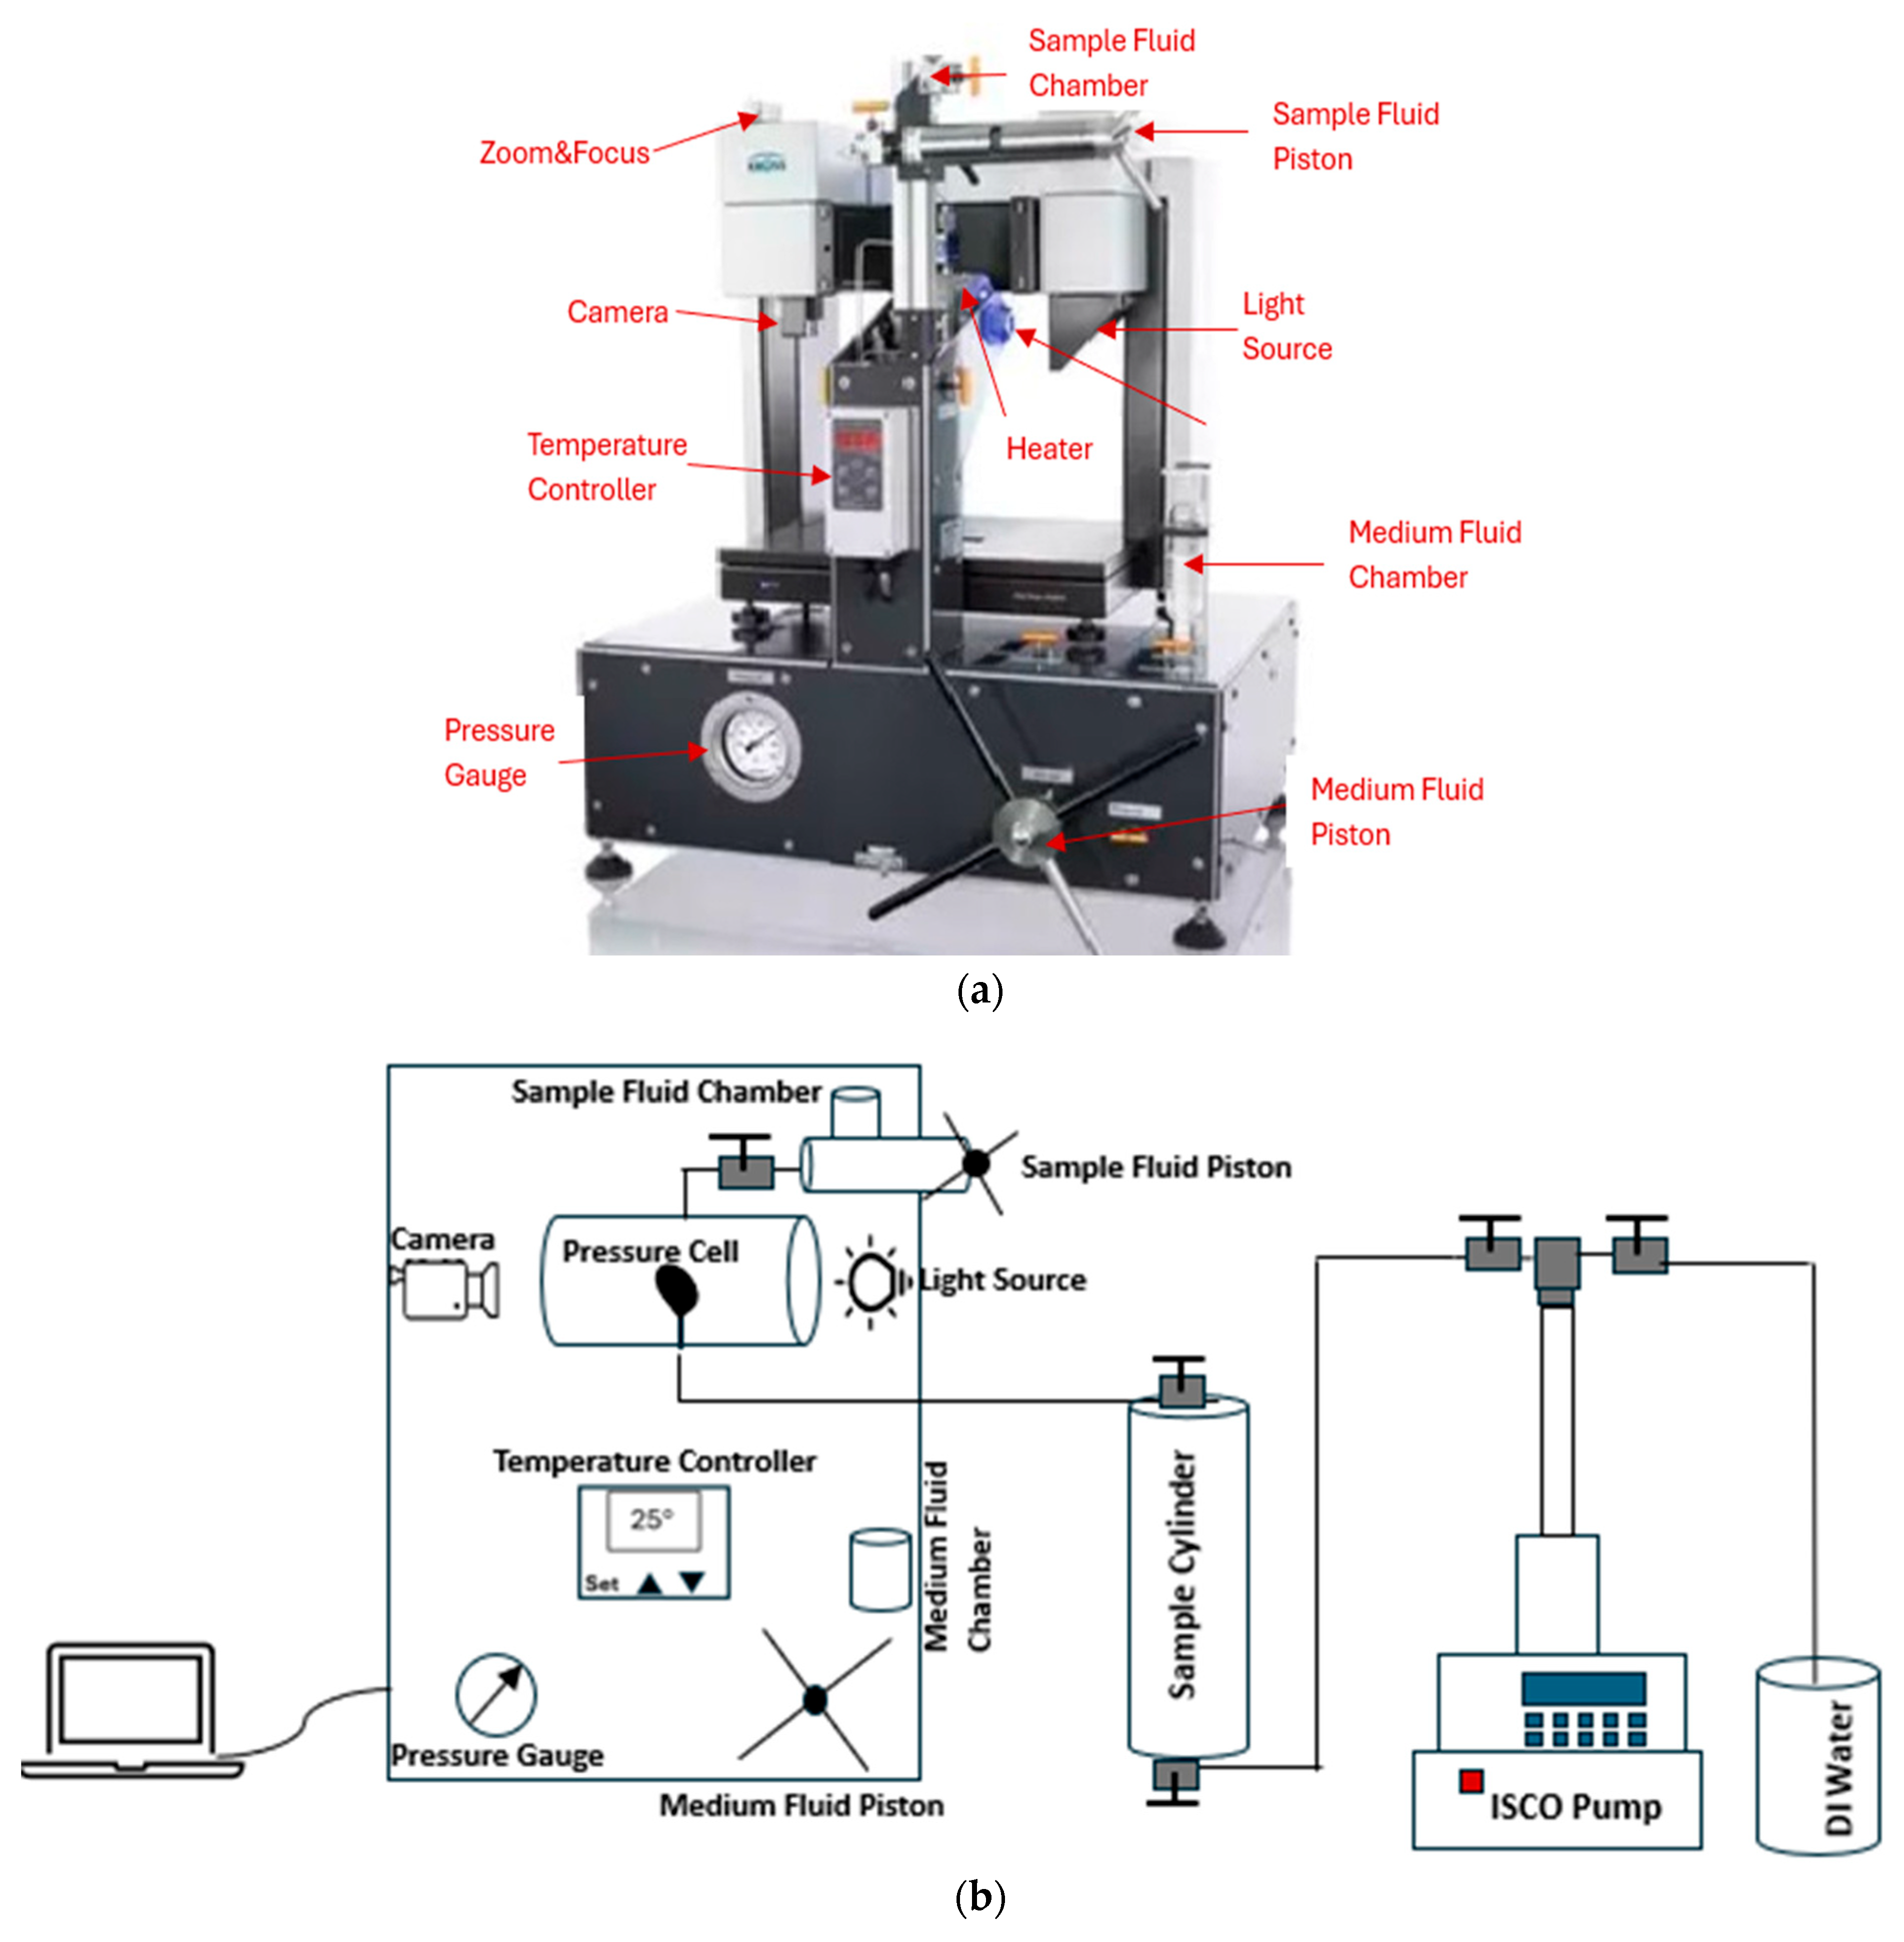
2.2. Equipment
2.3. Procedure
2.4. Methodology
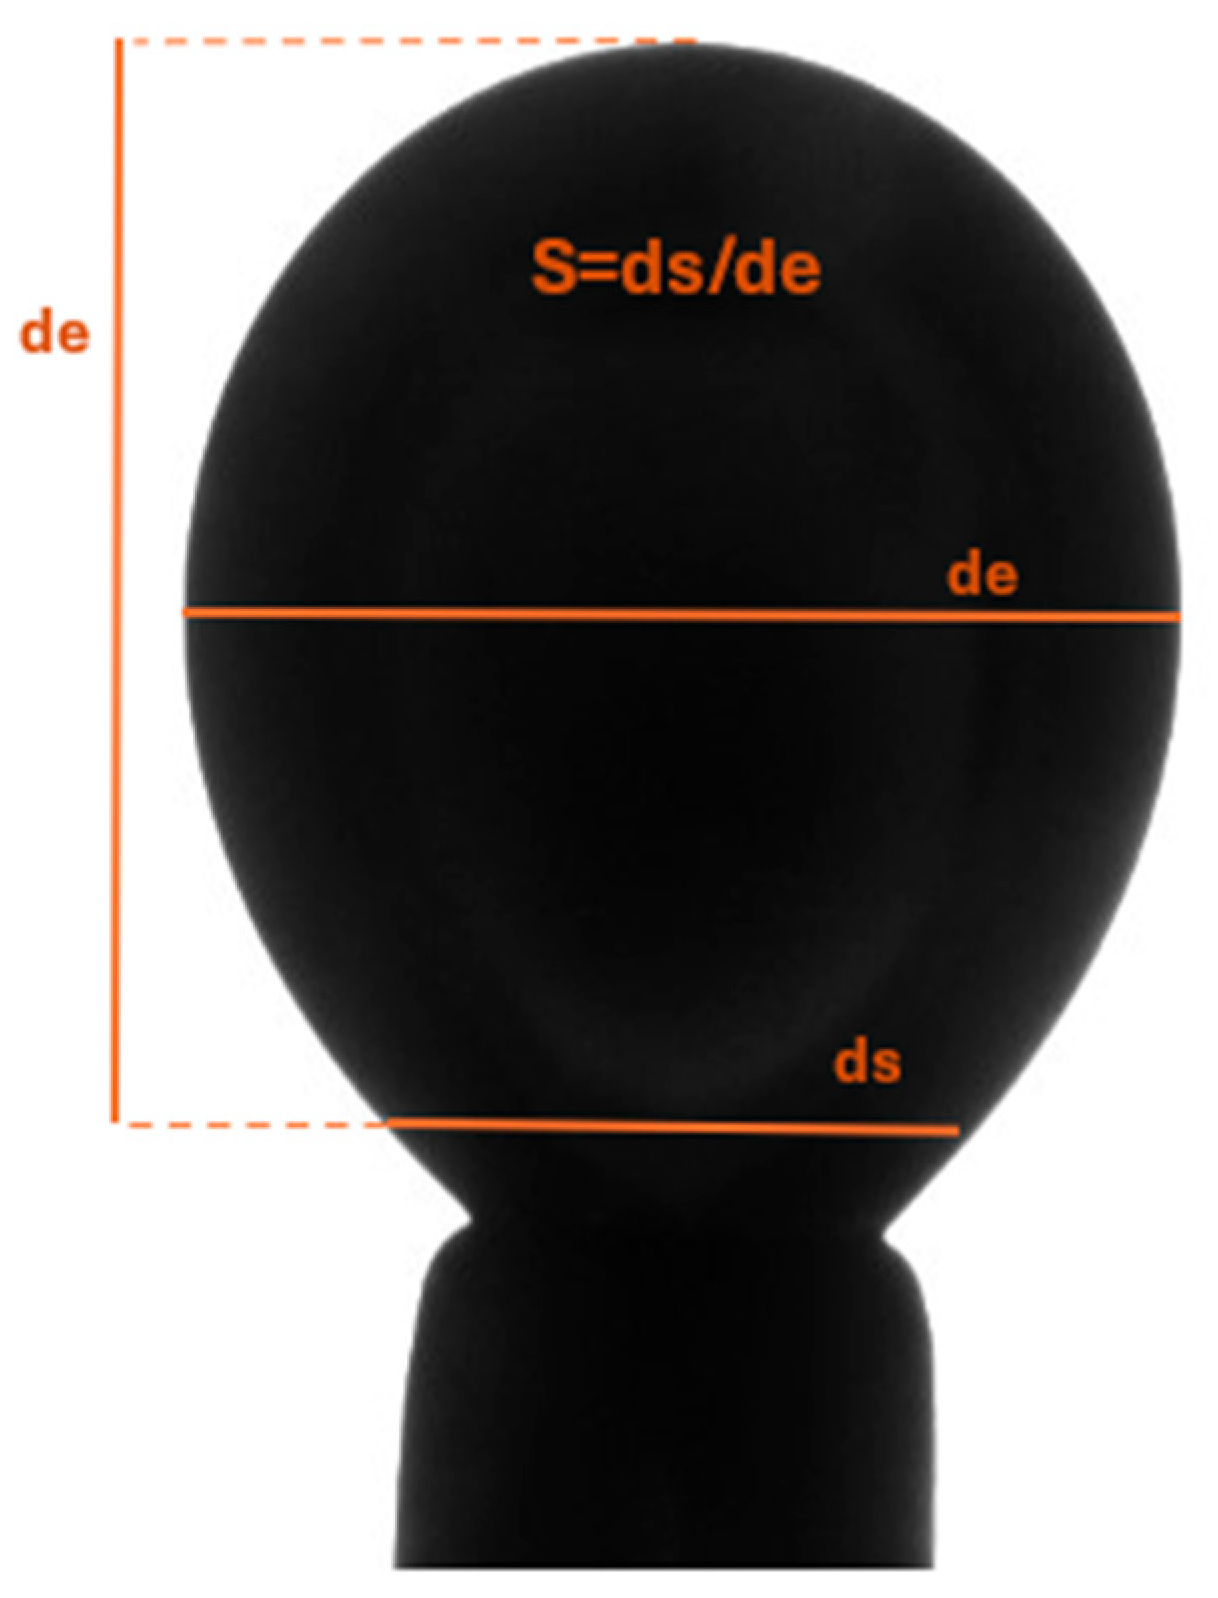
2.5. Measurement of Interfacial Tension
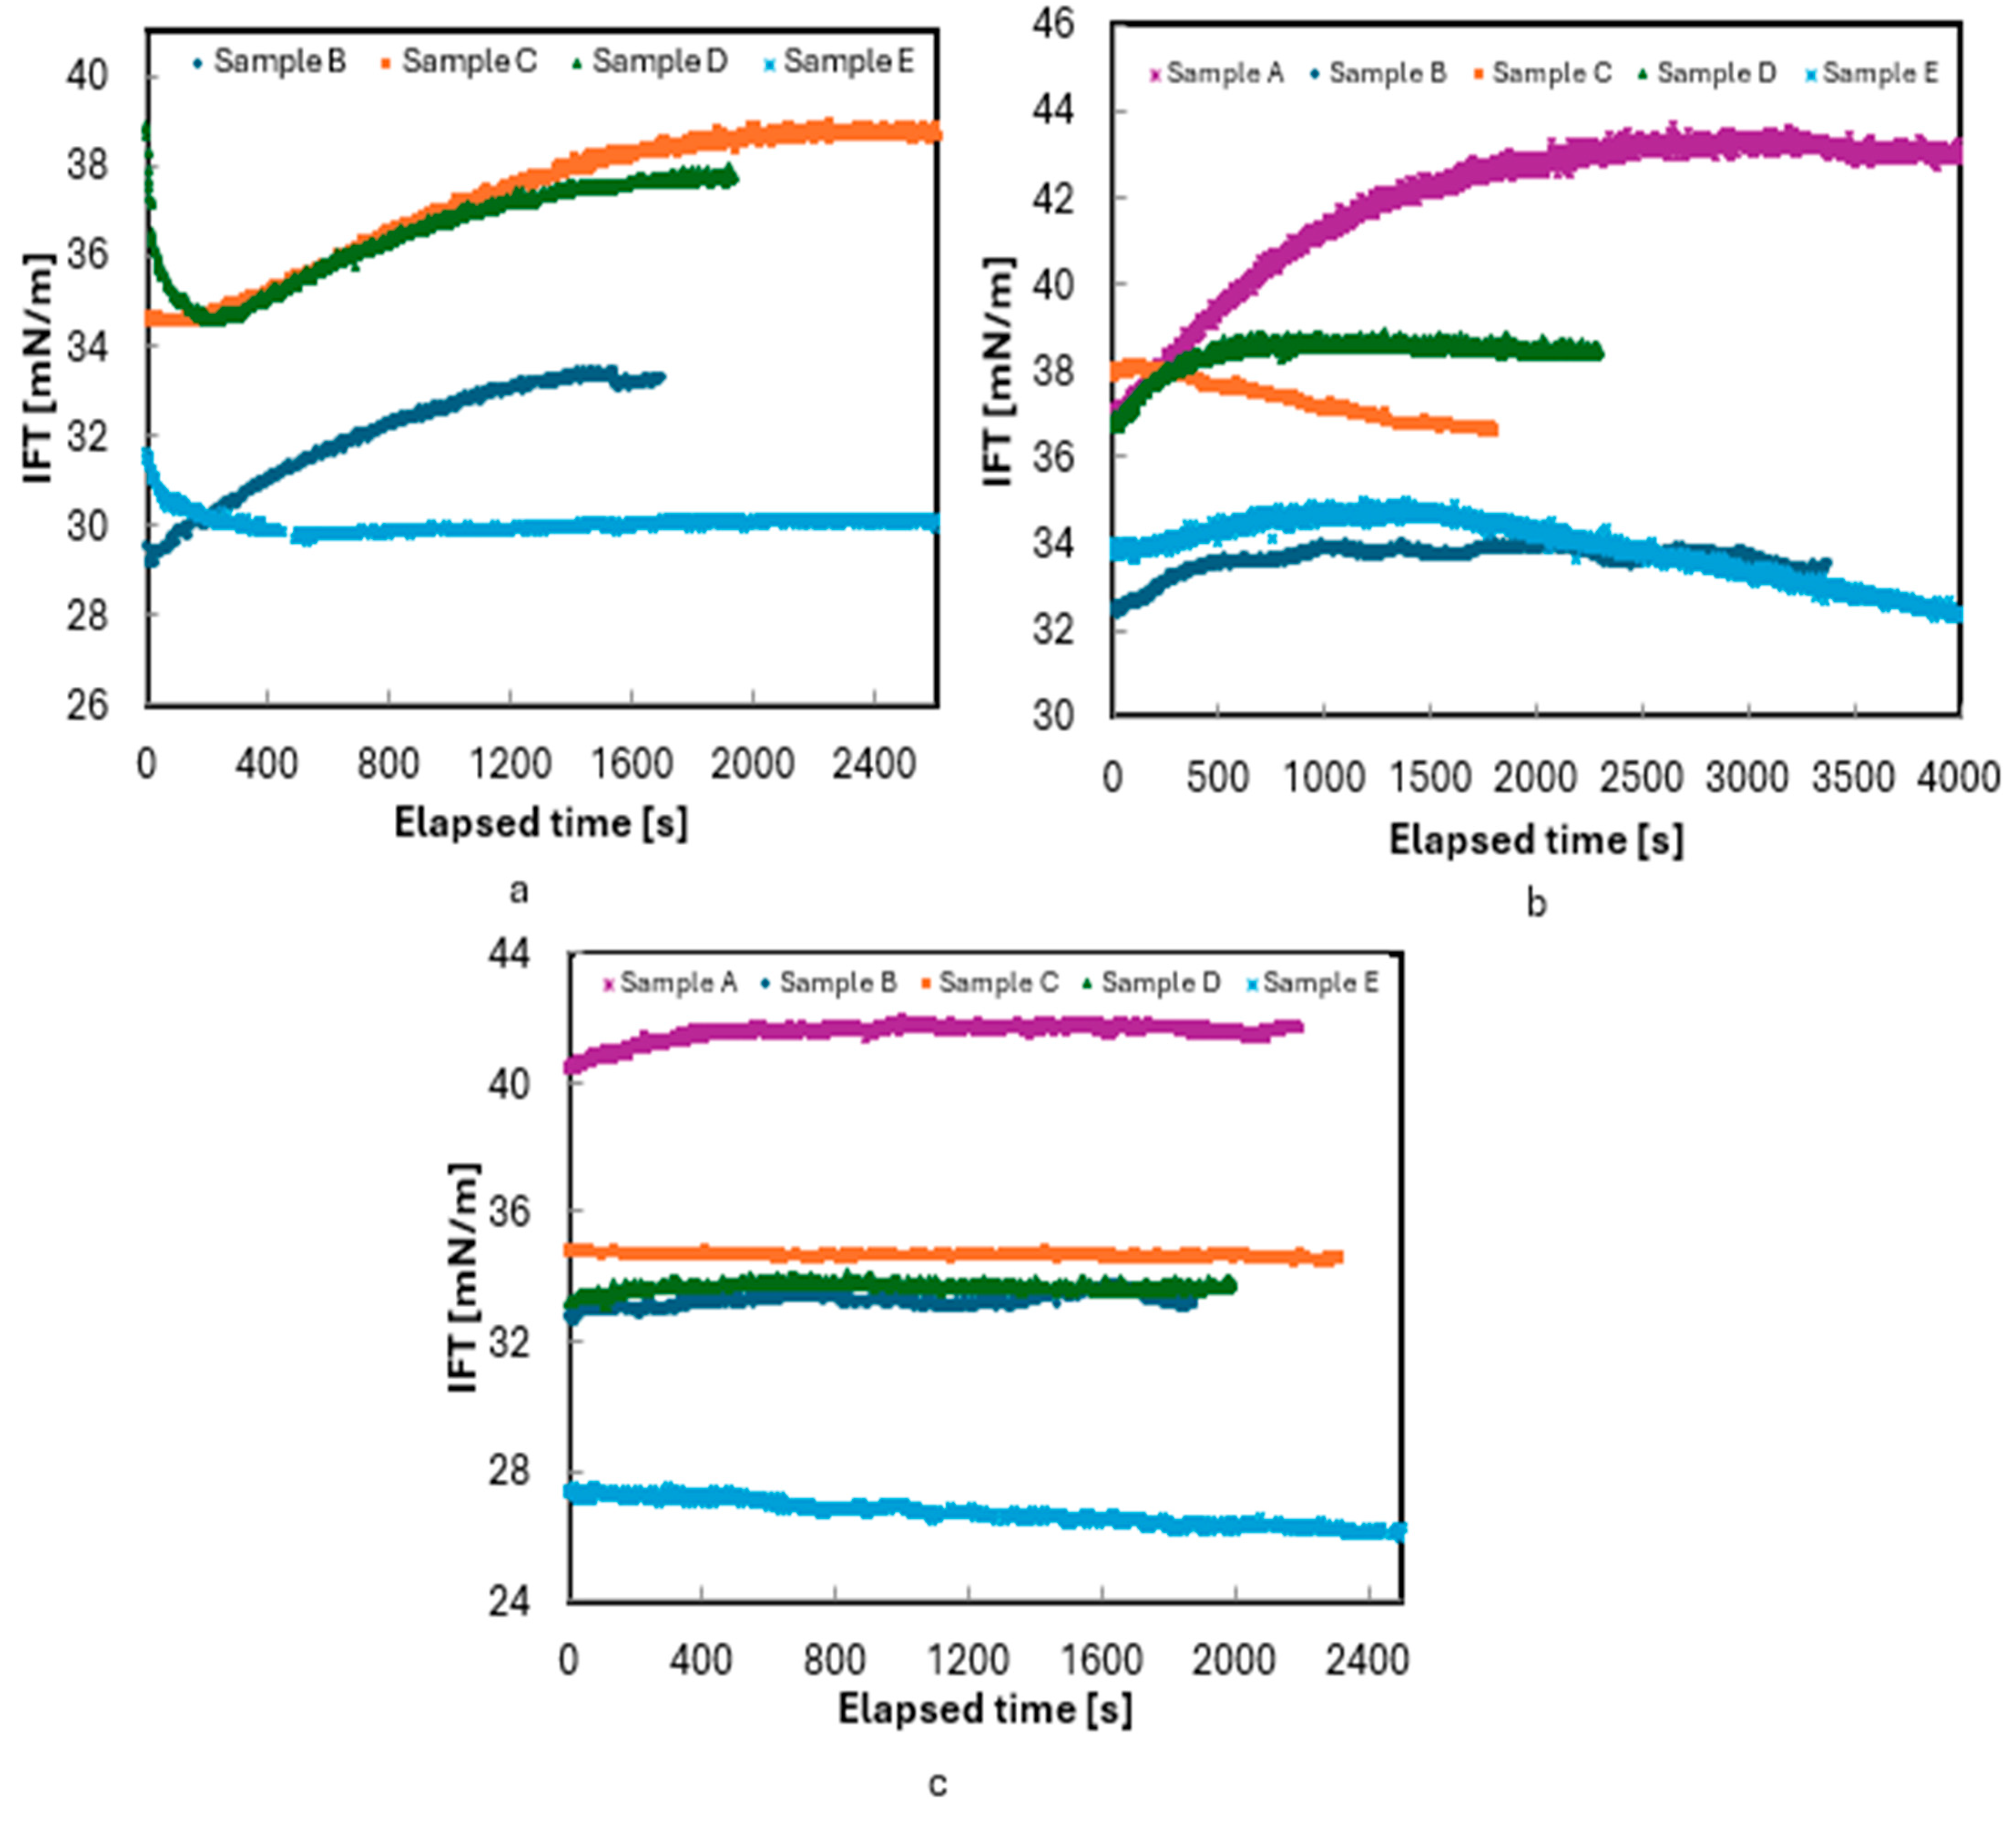
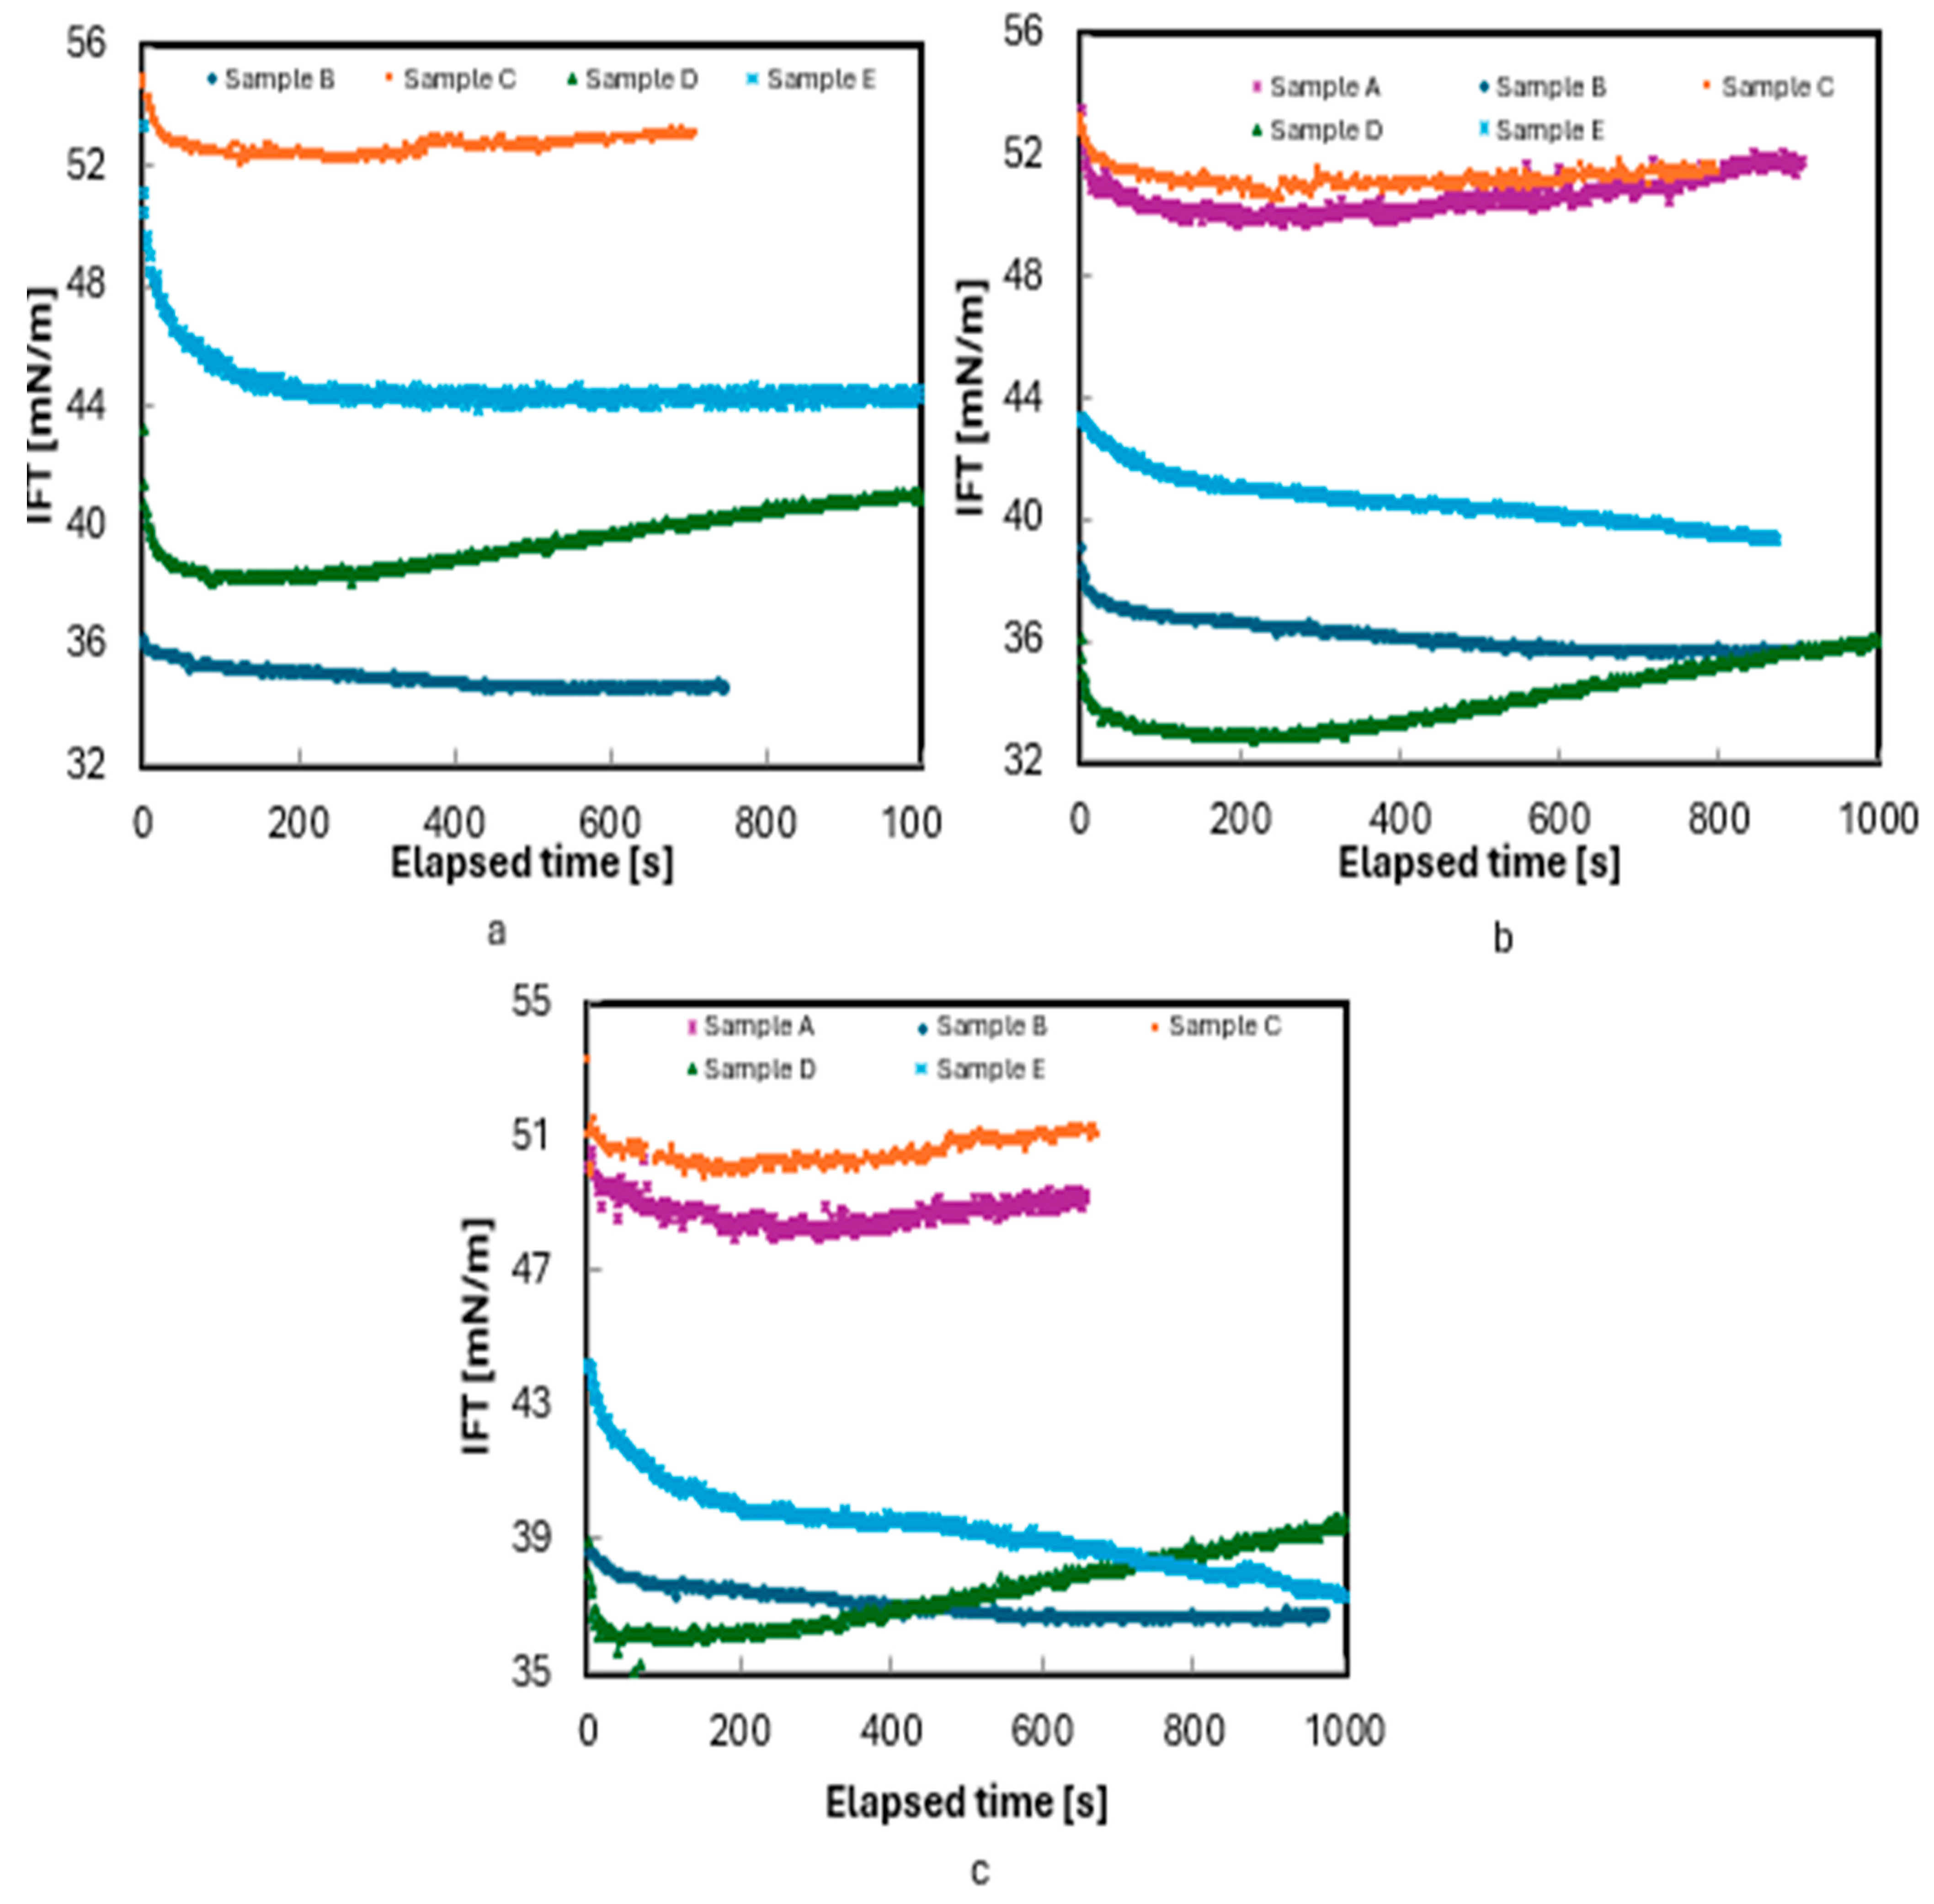
3. Results and Discussion
4. Conclusions
Author Contributions
Funding
Data Availability Statement
Acknowledgments
Conflicts of Interest
References
- Ferer, M.; Anna, S.L.; Kadambi, J.R.; Oliver, M.; Bromhal, G.S.; Smith, D.H. Two-Phase Flow in Porous Media: Predicting Its Dependence on Capillary Number and Viscosity Ratio. Transp. Porous Med. 2011, 86, 243–259. [Google Scholar] [CrossRef]
- Green, D.W.; Willhite, G.P. Enhanced Oil Recovery; Henry L. Doherty Memorial Fund of AIME, Society of Petroleum Engineers: Richardson, TX, USA, 1998. [Google Scholar]
- Lake, L.W. Enhanced Oil Recovery; Prentice Hall: Hoboken, NJ, USA, 1989; ISBN 0132816016. [Google Scholar]
- Lake, L.W.; Johns, R.T.; Rossen, W.R.; Pope, G.A. Fundamentals of Enhanced Oil Recovery; Society of Petroleum Engineers: Richardson, TX, USA, 2014; ISBN 978-1-61399-885-4. [Google Scholar] [CrossRef]
- Buckley, J.S.; Morrow, N.R. Characterization of Crude Oil Wetting Behavior by Adhesion Tests. In Proceedings of the SPE/DOE Improved Oil Recovery Symposium, Tulsa, OK, USA, 22–25 April 1990. [Google Scholar] [CrossRef]
- Chattopadhyay, S.; Jain, V.; Sharma, M.M. Effect of Capillary Pressure, Salinity, and Aging on Wettability Alteration in Sandstones and Limestones. In Proceedings of the SPE/DOE Improved Oil Recovery Symposium, Tulsa, OK, USA, 13–17 April 2002. [Google Scholar] [CrossRef]
- Ahmadyar, S.; Samara, H. The effect of gas and liquid phase composition on miscibility through interfacial tension measurements of model oils in compressed CO2. J. Petrol. Explor. Prod. Technol. 2025, 15, 31. [Google Scholar] [CrossRef]
- Moore, T.F.; Slobod, R.L. Displacement of oil by water-effect of wettability, rate, and viscosity on recovery. In Proceedings of the Fall Meeting of the Petroleum Branch of AIME, New Orleans, LA, USA, 2–5 October 1955; p. SPE-502-G. [Google Scholar] [CrossRef]
- Stern, D. Mechanisms of Miscible Oil Recovery: Effects of Pore-Level Fluid Distribution. In Proceedings of the SPE Annual Technical Conference and Exhibition, Dallas, TX, USA, 6–9 October 1991. [Google Scholar] [CrossRef]
- Taber, J.J. Dynamic and Static Forces Required to Remove a Discontinuous Oil Phase from Porous Media Containing Both Oil and Water. SPE J. 1969, 9, 3–12. [Google Scholar] [CrossRef]
- Benson, S.; Pini, R.; Reynolds, C.; Krevor, S. Relative Permeability Analyses to describe Multi-Phase Flow in CO2 Storage Reservoirs. Glob. CCS Inst. 2015, 1–49. [Google Scholar]
- Ratnakar, R.R.; Mantilla, C.A.; Dindoruk, B. Experimental and Numerical Investigation of the Impact of Asphaltene Stability on Interfacial Properties and the Hysteresis Behavior at the Interfaces. In Proceedings of the SPE EOR Conference at Oil and Gas West Asia, Muscat, Oman, 26–28 March 2018; p. SPE-190385-MS. [Google Scholar] [CrossRef]
- Yildiz, H.O.; Valat, M.; Morrow, N.R. Effect of Brine Composition on Wettability and Oil Recovery of a Prudhoe Bay Crude Oil. J. Can. Pet. Technol. 1999, 38. [Google Scholar] [CrossRef]
- Buckley, J.S.; Fan, T. Crude Oil/Brine Interfacial Tensions1. Petrophysics 2007, 48, SPWLA-2007-v48n3a1. [Google Scholar]
- Jaeger, P.T.; Schnitzler, J.V.; Eggers, R. Interfacial tension of fluid system considering the nonstationary case with respect of mass transfer. Chem. Eng. Technol. 1996, 19, 197–202. [Google Scholar] [CrossRef]
- Hjelmeland, O.S.; Larrondo, L.E. Experimental Investigation of the Effects of Temperature, Pressure, and Crude Oil Composition on Interfacial Properties. SPE Reserv. Eng. 1986, 1, 321–328. [Google Scholar] [CrossRef]
- Kumar, B. Effect of Salinity on the Interfacial Tension of Model and Crude Oil Systems. Master’s Thesis, University of Calgary, Department of Chemical and Petroleum Engineering, Calgary, AB, USA, 2012. [Google Scholar]
- Lashkarbolooki, M.; Riazi, M.; Ayatollahi, S.; Zeinolabedini, H.A. Synergy effects of ions, resin, and asphaltene on interfacial tension of acidic crude oil and low–high salinity brines. Fuel 2016, 165, 75–85. [Google Scholar] [CrossRef]
- Okasha, T.; Al-Shiwaish, A.J. Effect of Brine Salinity on Interfacial Tension in Arab-D Carbonate Reservoir, Saudi Arabia. In Proceedings of the 2009 SPE Middle East Oil & Gas Show and Conference held in the Bahrain International Exhibition Centre, Manama, Bahrain, 15–18 March 2009; p. SPE-119600-MS. [Google Scholar]
- Alotaibi, M.B.; Nasr-El-Din, H.A. Effect of Brine Salinity on Reservoir Fluids Interfacial Tension. In Proceedings of the 2009 SPE EUROPEC/EAGE Annual Conference and Exhibition, Amsterdam, The Netherlands, 8–11 June 2009. [Google Scholar] [CrossRef]
- Vijapurapu, C.S.; Rao, D.N. Effect of Brine Dilution and Surfactant Concentration on Spreading and Wettability. In Proceedings of the International Symposium on Oilfield Chemistry, Houston, TX, USA, 5–7 February 2003. [Google Scholar] [CrossRef]
- Drelich, J.; Fang, C.; White, C.L. Measurement of Interfacial Tension in Fluid-Fluid Systems. Encycl. Surf. Colloid Sci. 2002, 3, 3158–3163. [Google Scholar]
- Andreas, J.M.; Hauser, E.A.; Tucker, W.B. Boundary Tension by Pendant Drops. J. Phys. Chem. 1938, 42, 1001–1019. [Google Scholar] [CrossRef]
- Ratnakar, R.R.; Mantilla, C.A.; Dindoruk, B. Experimental Investigation of the Effects of Asphaltene Stability on Interfacial Behavior of Live-Reservoir-Fluid Systems. SPE J. 2019, 24, 21–31. [Google Scholar] [CrossRef]
- Firoozabadi, A.; Ramey, H.J., Jr. Surface Tension of Water-Hydrocarbon Systems at Reservoir Conditions. J. Can. Pet. Technol. 1988, 27. [Google Scholar] [CrossRef]
- Cai, B.Y.; Yang, J.T.; Guo, T.M. Interfacial Tension of Hydrocarbon + water/brine Systems under High Pressure. J. Chem. Eng Data 1996, 41, 493–496. [Google Scholar] [CrossRef]
- Serrona-Saldana, E.; Dominguez-Ortiz, A.; Perez-Aguilar, H.; Kornhauser-Strauss, I.; Rojas-Gonzales, F. Wettability of solid/brine/n-dodecane systems: Experimental study of the effects of ionic strength and surfactant concentration. Colloids Surf. A Physicochem. Eng. Aspects 2004, 241, 343–349. [Google Scholar] [CrossRef]
- Xu, W. Experimental Investigation of Dynamic Interfacial Interactions at Reservoir Conditions. Master’s Thesis, Louisiana State University and Agricultural and Mechanical College, Baton Rouge, LA, USA, 2005. Available online: https://repository.lsu.edu/gradschool_theses/968 (accessed on 18 August 2024).
- Sauerer, B.; Stukan, M.; Abdallah, W.; Buiting, J. Toward Determining Interfacial Tension at Reservoir Conditions Based on Dead Oil Measurements. In Proceedings of the SPE Middle East Oil & Gas Show and Conference, Manama, Bahrain, 6–9 March 2017. [Google Scholar] [CrossRef]
- Okasha, T.; Al-Hamad, M.; Sauerer, B.; Abdallah, W. Accurate Live Interfacial Tension for Improved Reservoir Engineering Practices. In Proceedings of the SPE Middle East Oil & Gas Show and Conference, Manama, Bahrain, 28 November–1 December 2021; p. SPE-204615-MS. [Google Scholar]
- Soleymanzadeh, A.; Rahmati, A.; Yoisefi, M.; Roshani, B. Theoretical and experimental investigation of effect of salinity and asphaltene on IFT of brine and live oil samples. J. Pet. Explor. Prod. Technol. 2021, 11, 769–781. [Google Scholar] [CrossRef]
- PHREEQC Version 3. USGS Asset Identifier Service (AIS). 2021. Available online: https://www.usgs.gov/software/phreeqc-version-3 (accessed on 5 April 2024).
- Kruss-Scientific. Drop Shape Anlayzer-DSA100HP690. 2024. Available online: https://www.kruss-scientific.com/en/products-services/products/dsa100hp690?_gl=1*180h4qp*_up*MQ..*_gs*MQ..&gclid=Cj0KCQiAgJa6BhCOARIsAMiL7V-oC9nbLBelnbxSl2rnaMKfoZEPFJrLXGryurxqtu_xOYznEOM0xW8aAoDeEALw_wcB (accessed on 15 April 2024).
- Herd, M.D.; Lassahn, G.D.; Thomas, C.P.; Bala, G.A.; Eastman, S.L. Interfacial Tension of Microbial Surfactants Determined by Real-Time Video Imaging of Pendant Drops. In Proceedings of the SPE/DOE Eight Symposium on EOR, Tulsa, OK, USA, 22–24 April 1992; p. SPE-24206-MS. [Google Scholar] [CrossRef]
- Saad, A.M.; Aime, S.; Mahavadi, S.C.; Song, Y.; Yutkin, M.P.; Weitz, D.; Patzek, T.W. Adsorption of Polar Species at Crude Oil–Water Interfaces: The Chemoelastic Behavior. Langmuir 2022, 38, 6523–6530. [Google Scholar] [CrossRef] [PubMed]
- Nasr-El-Din, H.A.; Taylor, K.C. Dynamic interfacial tension of crude oil/alkali/surfactant systems. Colloids Surf. 1992, 66, 23–37. [Google Scholar] [CrossRef]


| Sample ID | Pbp, psi @180 °F | API, ° | GOR, scf/stb | Density, g/cc (@ psi) | ||
|---|---|---|---|---|---|---|
| 4000 | 6000 | 8000 | ||||
| A | 5333 | 24.3 | 789 | - | 0.763 | 0.774 |
| B | 3221 | 18.7 | 338 | 0.855 | 0.864 | 0.872 |
| C | 3736 | 16.7 | 379 | 0.858 | 0.868 | 0.876 |
| D | 2110 | 29.8 | 404 | 0.788 | 0.799 | 0.808 |
| E | 2589 | 33.1 | 748 | 0.721 | 0.736 | 0.747 |
| Brine (NaCl) Concentration, ppm | Density, g/cc (180 °F, @ psi) | ||
|---|---|---|---|
| 4000 | 6000 | 8000 | |
| 30,000 | 1.002 | 1.008 | 1.013 |
| 100,000 | 1.050 | 1.055 | 1.060 |
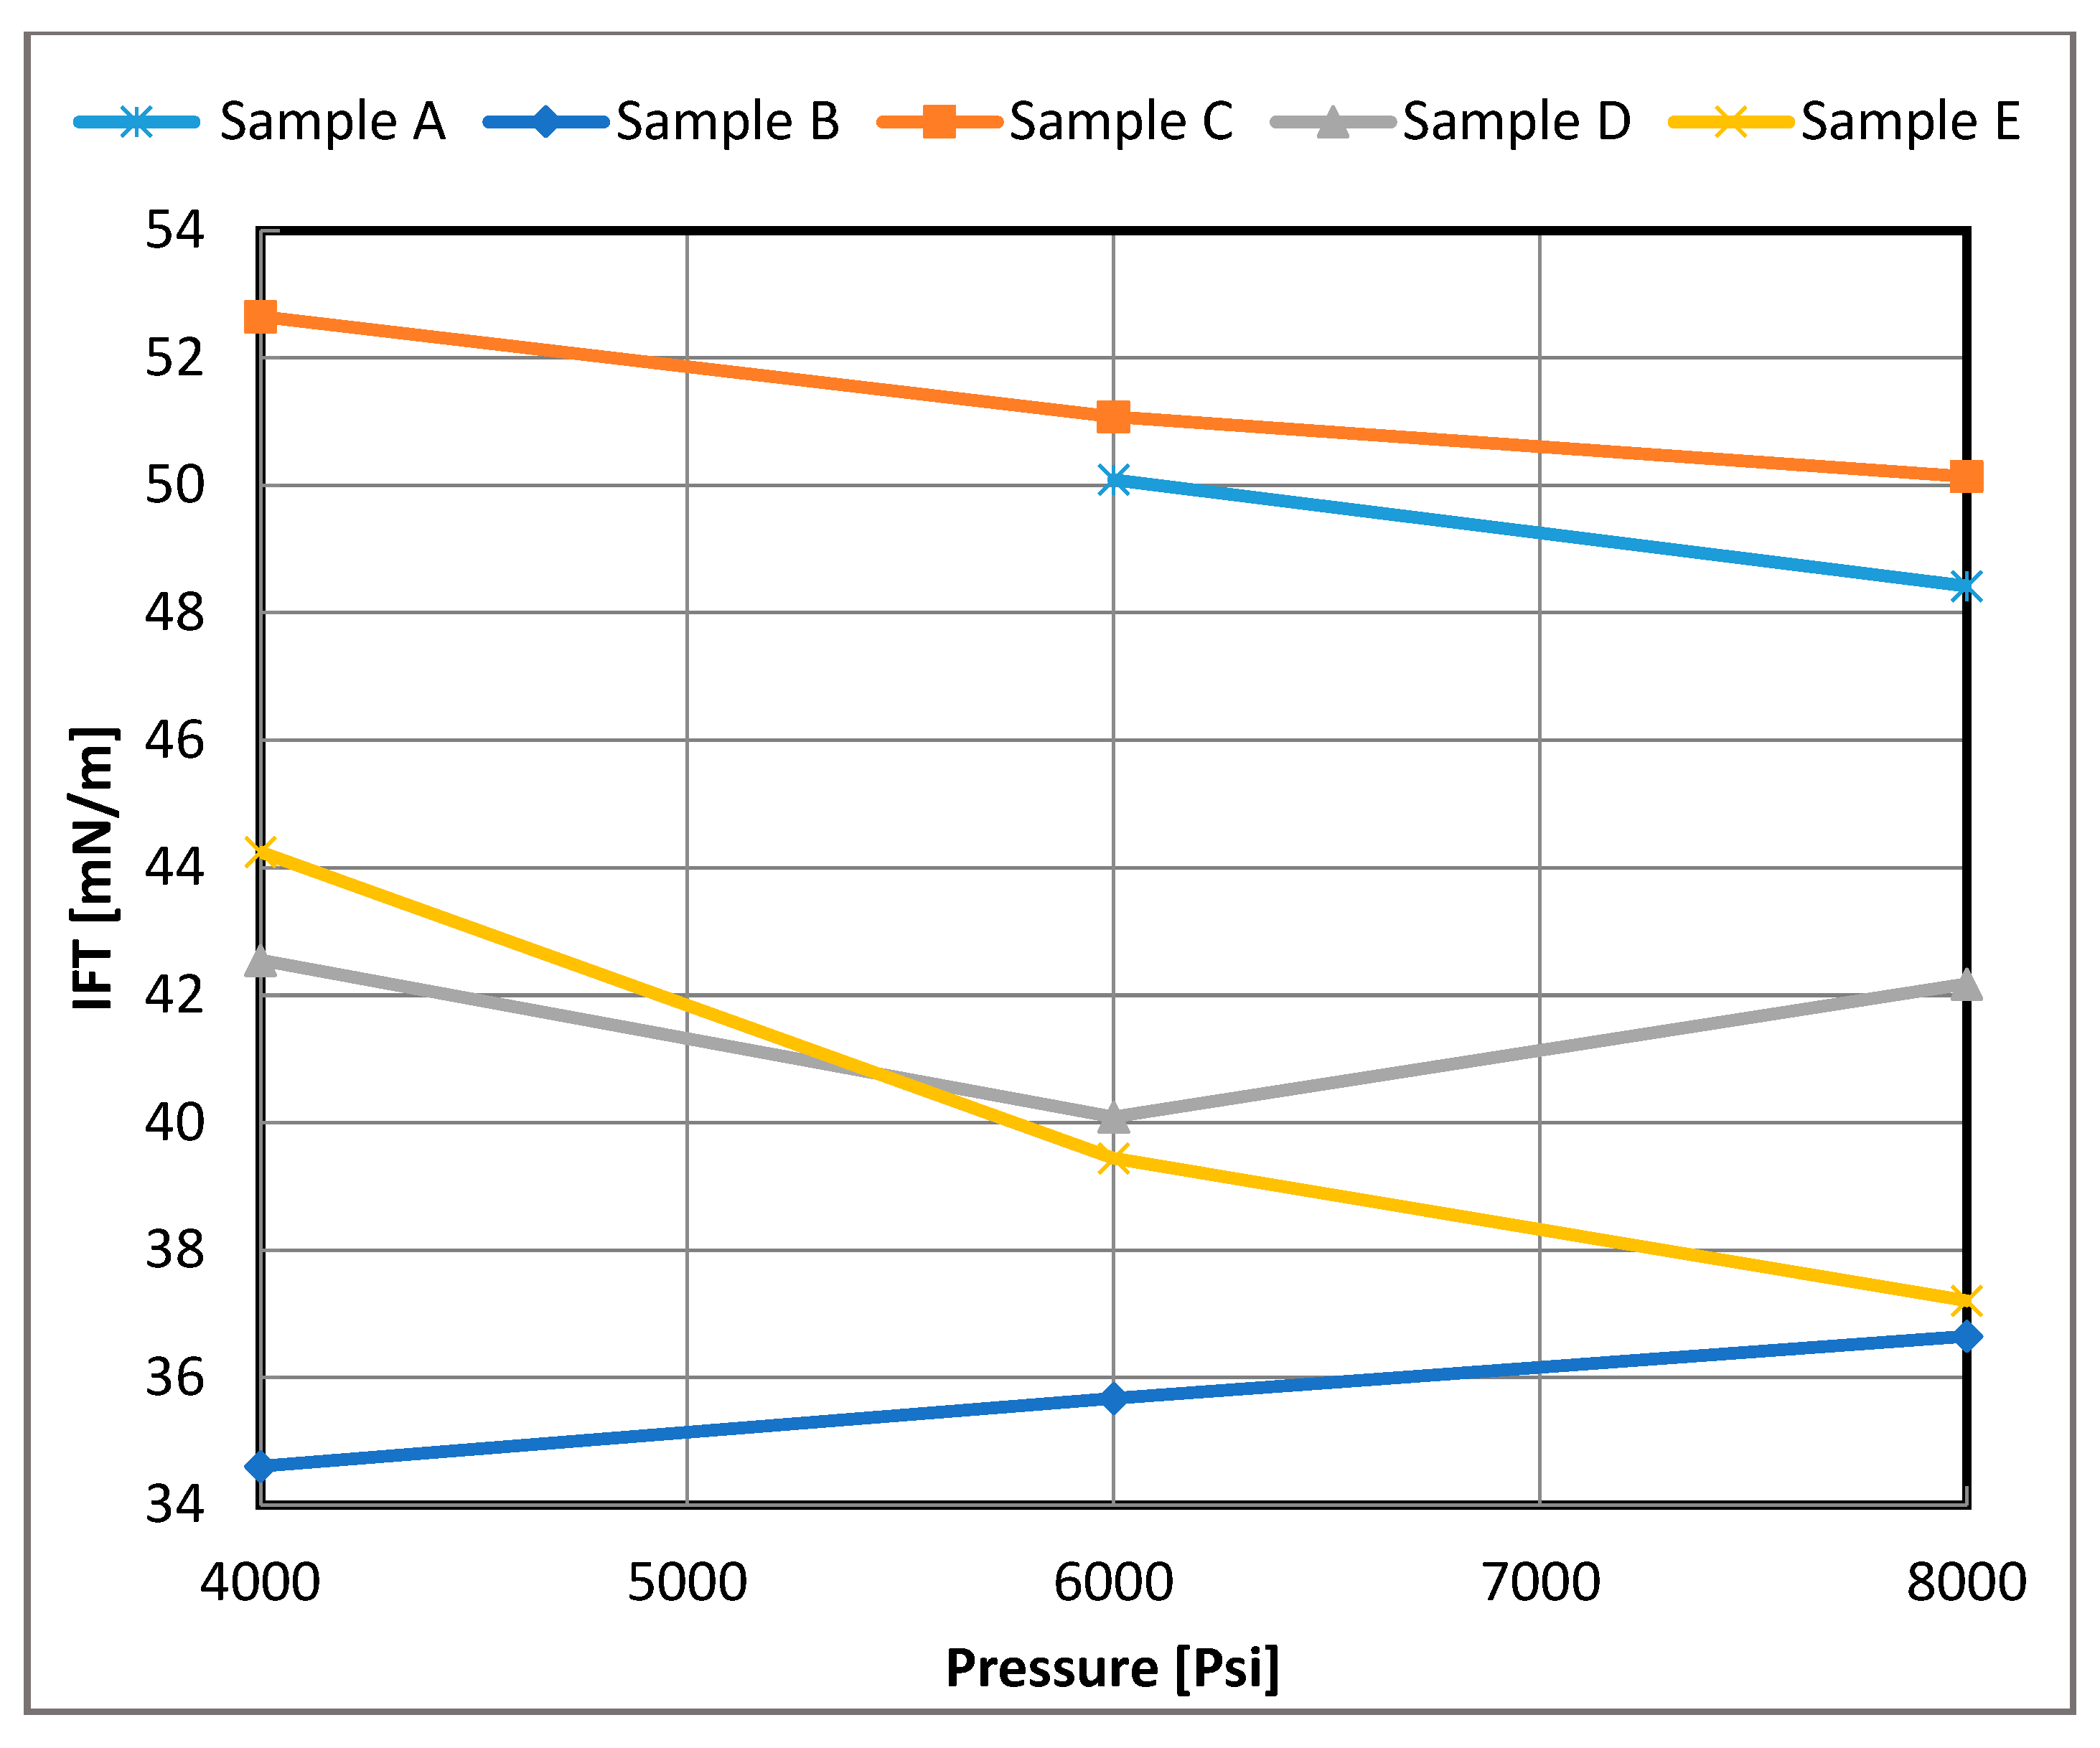
| ID | Pressure, psi | Bubble Point, psi | API, ° | Density, g/cc | IFT, mN/m | |
|---|---|---|---|---|---|---|
| 3 wt.% | 10 wt.% | |||||
| Sample A | 6000 | 5333 | 24.3 | 0.763 | 43.11 | 50.09 |
| 8000 | 0.774 | 41.68 | 48.42 | |||
| Sample B | 4000 | 3221 | 18.7 | 0.855 | 33.21 | 34.61 |
| 6000 | 0.864 | 33.82 | 35.67 | |||
| 8000 | 0.872 | 33.23 | 36.65 | |||
| Sample C | 4000 | 3736 | 16.7 | 0.858 | 38.45 | 52.65 |
| 6000 | 0.868 | 35.89 | 51.08 | |||
| 8000 | 0.876 | 34.68 | 50.14 | |||
| Sample D | 4000 | 2110 | 29.8 | 0.788 | 37.72 | 42.55 |
| 6000 | 0.799 | 38.5 | 40.09 | |||
| 8000 | 0.808 | 33.71 | 42.18 | |||
| Sample E | 4000 | 2589 | 33.1 | 0.721 | 30.03 | 44.25 |
| 6000 | 0.736 | 30.12 | 39.44 | |||
| 8000 | 0.747 | 26.82 | 37.21 | |||
Disclaimer/Publisher’s Note: The statements, opinions and data contained in all publications are solely those of the individual author(s) and contributor(s) and not of MDPI and/or the editor(s). MDPI and/or the editor(s) disclaim responsibility for any injury to people or property resulting from any ideas, methods, instructions or products referred to in the content. |
© 2025 by the authors. Licensee MDPI, Basel, Switzerland. This article is an open access article distributed under the terms and conditions of the Creative Commons Attribution (CC BY) license (https://creativecommons.org/licenses/by/4.0/).
Share and Cite
Paker, D.M.; Dindoruk, B.; Sagar, S.; Baksmaty, L.; Ratnakar, R.R.; Samara, H.; Jaeger, P. An Experimental Investigation of the Effect of Pressure and Salinity on IFT in Live Oil/Brine Systems. Processes 2025, 13, 1843. https://doi.org/10.3390/pr13061843
Paker DM, Dindoruk B, Sagar S, Baksmaty L, Ratnakar RR, Samara H, Jaeger P. An Experimental Investigation of the Effect of Pressure and Salinity on IFT in Live Oil/Brine Systems. Processes. 2025; 13(6):1843. https://doi.org/10.3390/pr13061843
Chicago/Turabian StylePaker, Deniz M., Birol Dindoruk, Swati Sagar, Leslie Baksmaty, Ram R. Ratnakar, Hanin Samara, and Philip Jaeger. 2025. "An Experimental Investigation of the Effect of Pressure and Salinity on IFT in Live Oil/Brine Systems" Processes 13, no. 6: 1843. https://doi.org/10.3390/pr13061843
APA StylePaker, D. M., Dindoruk, B., Sagar, S., Baksmaty, L., Ratnakar, R. R., Samara, H., & Jaeger, P. (2025). An Experimental Investigation of the Effect of Pressure and Salinity on IFT in Live Oil/Brine Systems. Processes, 13(6), 1843. https://doi.org/10.3390/pr13061843