Article

Stress Analysis of High-Pressure Natural Gas Pipe with Flowmeter Clamping Apparatus Made of Steel Material

1
Northeast Branch of National Petroleum and Natural Gas Pipe Network Group Co., Ltd., Shenyang 110167, China
2
School of Mechanical Engineering and Automation, Northeastern University, Shenyang 110819, China
*
Author to whom correspondence should be addressed.
Processes 2025, 13(6), 1841; https://doi.org/10.3390/pr13061841
Submission received: 7 May 2025 / Revised: 3 June 2025 / Accepted: 10 June 2025 / Published: 11 June 2025
(This article belongs to the Topic Clean and Low Carbon Energy, 2nd Edition)

Abstract

Natural gas is one of the major sources of energy supply, where the measurement of natural gas is very crucial. The flowmeter fastening apparatus typically used tightened screw nuts for clamping. This study designed a clamping device for a DN300 specification gas pipe, which directly clamped the flowmeter with the flange by external force. This clamping method is more efficient compared to previous methods. Based on the fabricated flowmeter clamping experimental device, a simplified numerical model was established. A detailed analysis was conducted on several key components, including the screw nuts, flange, flowmeter, and pipe. The results indicate that the designed clamping devices can operate safely and reliably. The stress distribution is reasonable in the entire clamping device. The average stress in the flowmeter flange is significantly greater than the pressure of gas within the pipe. The stress distribution on the screw nuts generally shows a pattern of higher stress in the central area and lower stress in the surroundings. The maximum stress of the flowmeter clamping device is located on the flowmeter flange, reaching 146 MPa. The maximum stress value of the nut is the smallest, which is 117 MPa.

1. Introduction

Natural gas is one of the important fossil fuels in today’s industry and daily life. Pipe transportation is a significant method for transferring natural gas [1,2]. Therefore, accurate measurement of natural gas flow in pipes is of great importance [3,4]. Flowmeters are commonly used for measuring natural gas [5,6,7]. In the past, flowmeters were installed using bolts for direct connection [8,9,10]. This method is inefficient and time-consuming. So, it is necessary to design a device with high quasi efficiency. When the flowmeter is clamped, various components of the device will experience different stresses [11,12,13]. If the applied force is too small, the flowmeter will not be securely clamped, potentially leading to leaks or even explosions [14]. Conversely, if the applied force is too large, it can exceed the allowable stress of the steel material, resulting in material failure or fracture [15].
In the past few decades, extensive research has been conducted on stress analysis of flowmeter pipes. Guzzini et al. [7] found that the impact of hydrogen on flowmeter materials mainly focuses on hydrogen embrittlement, permeability, and material compatibility. It is necessary to select hydrogen-resistant materials based on specific flowmeter types and application scenarios, and ensure reliability through strict testing and certification. Mehmanparast et al. [8] studied the connection method of bolted flanges in the offshore wind power industry, including material selection, short-term relaxation of bolts, load distribution in threads, and static failure of bolted flanges. They provided the best guidance for the installation and use of bolted flanges in the offshore wind power industry. Compared to these previous studies, the present work focuses on natural gas pipes with ultra-high pressure, and meanwhile aims to provide a different fixing method for flowmeters with higher work efficiency. Liao et al. [16] analyzed the stress relaxation characteristics of metal C-ring flange joints using numerical models. This model can also accurately predict the effective usage time of flange joints. The bolted flange joint is considered as a whole, and the bolt and flange are calculated using the element method. Explaining how these parameters affect stress relaxation characteristics can aid in the design, assembly, and maintenance requirements of bolted flange joints for long-term use. Peng et al. [17] conducted uniaxial tensile tests using X80 steel pipes. They also studied the fracture modes and loads of pipelines by combining them with numerical simulations. Yu et al. [18] established a steel pipe model with circular welds. This model was used to simulate the shape of the welding pool and analyze the axial and radial residual stresses on the pipeline, and was validated through experimental methods and simulation results. In addition, the sequence of high-temperature processes for the melt pool has also been determined. Qin and Cheng [19] analyzed the cyclic loads from operational vibrations and their impact on stress and pressure from the corrosion-related flaws of the X80 pipe. And they also clarified the reliability of online monitoring work in corrosion defects. Khater et al. [20] studied the buckling resistance of X60 steel pipes under axial compression loads. Their work found that experimental combinations such as outer diameter, wall thickness, and material have a profound impact on the buckling mode and flexural resistance. Xiang et al. [21] conducted finite element simulations of lateral landslide conditions on X80 pipelines. This investigation explored the mechanical behaviors linked to pipeline geometry (diameter and wall thickness) and examined the effect of landslide dimensions (width) and movement (displacement) on pipeline strain. It is evident from the analysis that bending moments act as the primary load source for pipeline strain in lateral landslides, where axial strain constitutes the major component.
The literature survey indicates that while there are numerous reports on the analysis of pipe stress, research on the stress distribution of flowmeter fastening apparatus has not been conducted yet. Therefore, this study designed a flowmeter fastening apparatus for a natural gas pipe with a DN300 mm diameter. The designed direct clamping device directly clamps the flowmeter flange by applying an external force on the nut, omitting the process of aligning the nut hole and tightening, and the clamping efficiency is better than traditional clamping methods. Employing the developed flowmeter clamping test apparatus, a simplified model was constructed to examine the distribution of stress in critical components: the nuts, flange plate, flowmeter, and pipe. Based on the simulation results, the structural strength and design rationality of the clamping device were analyzed.

2. Model Description
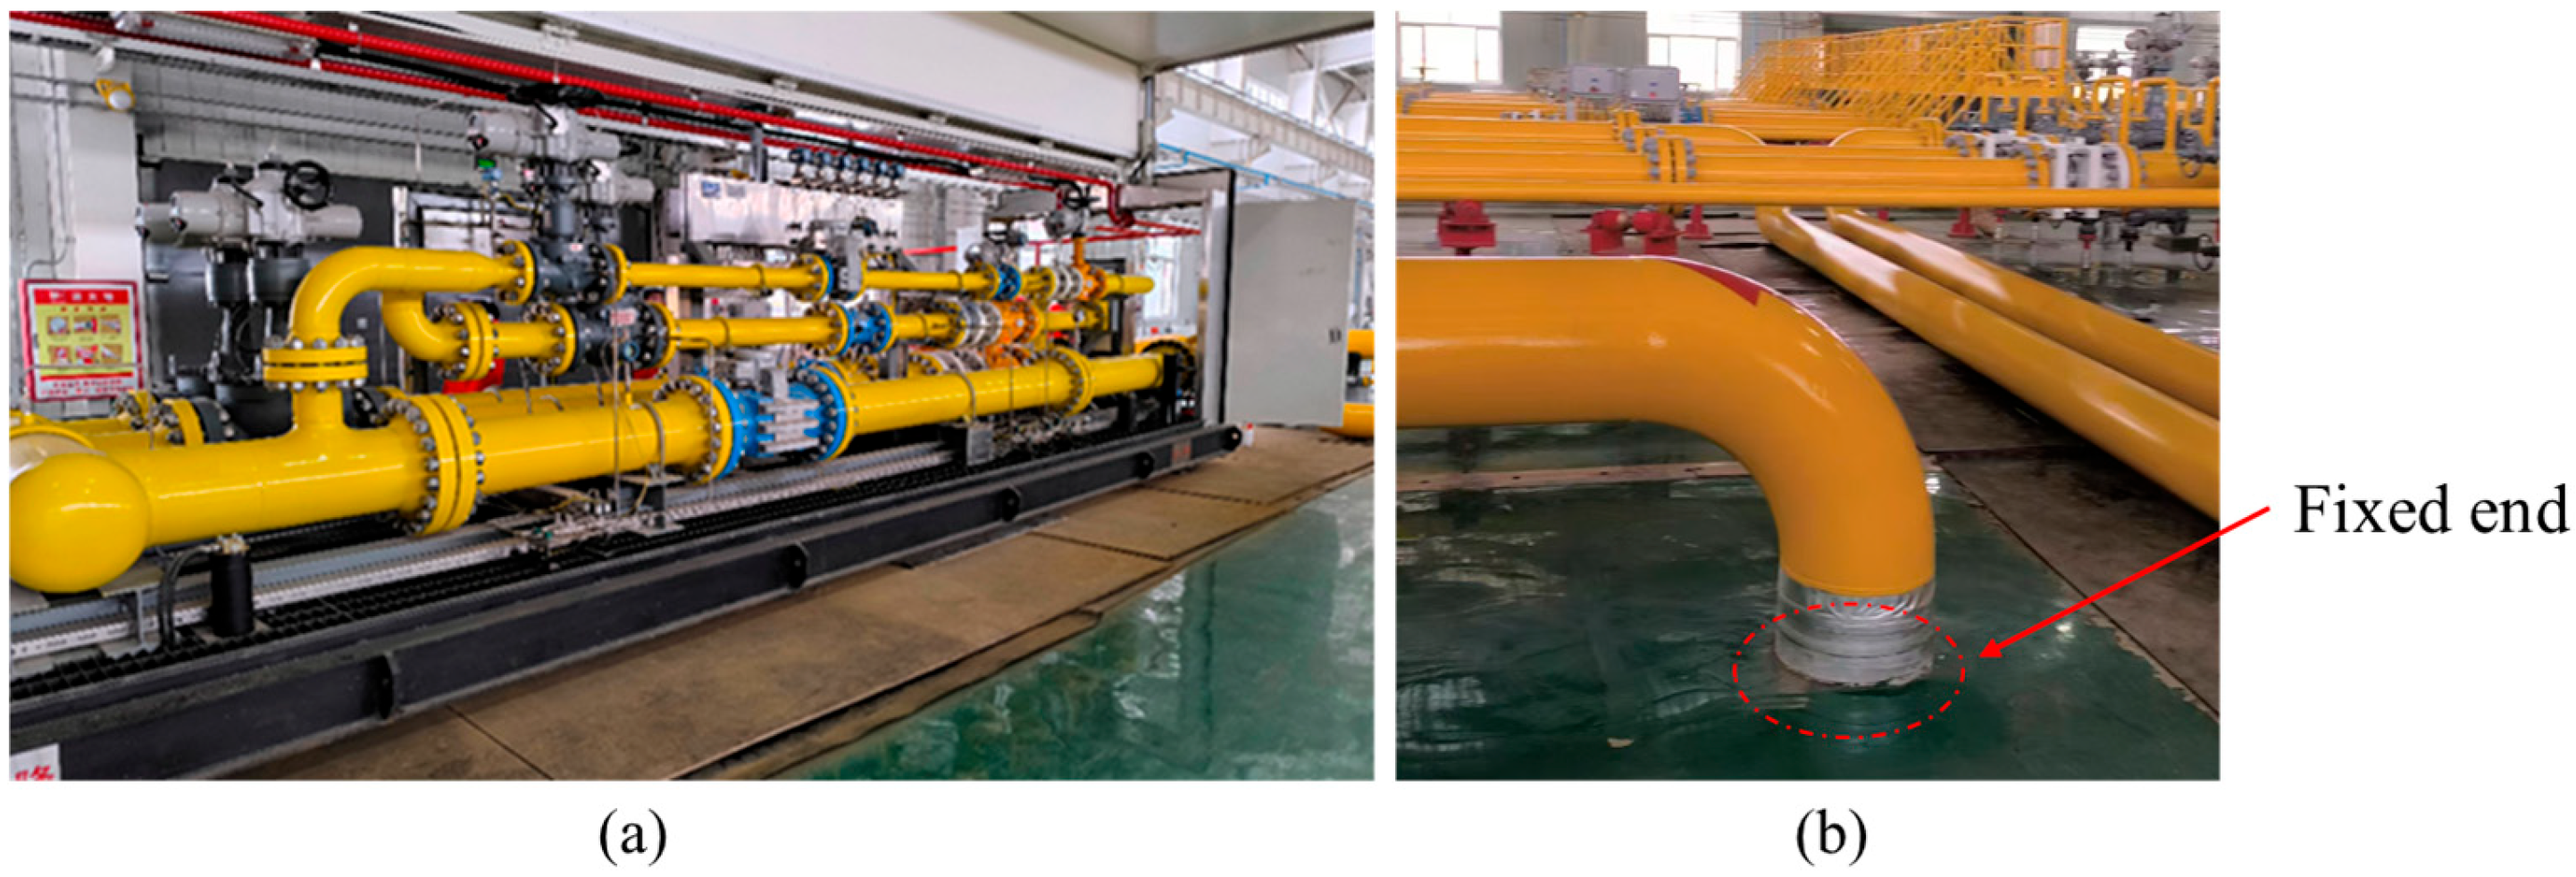
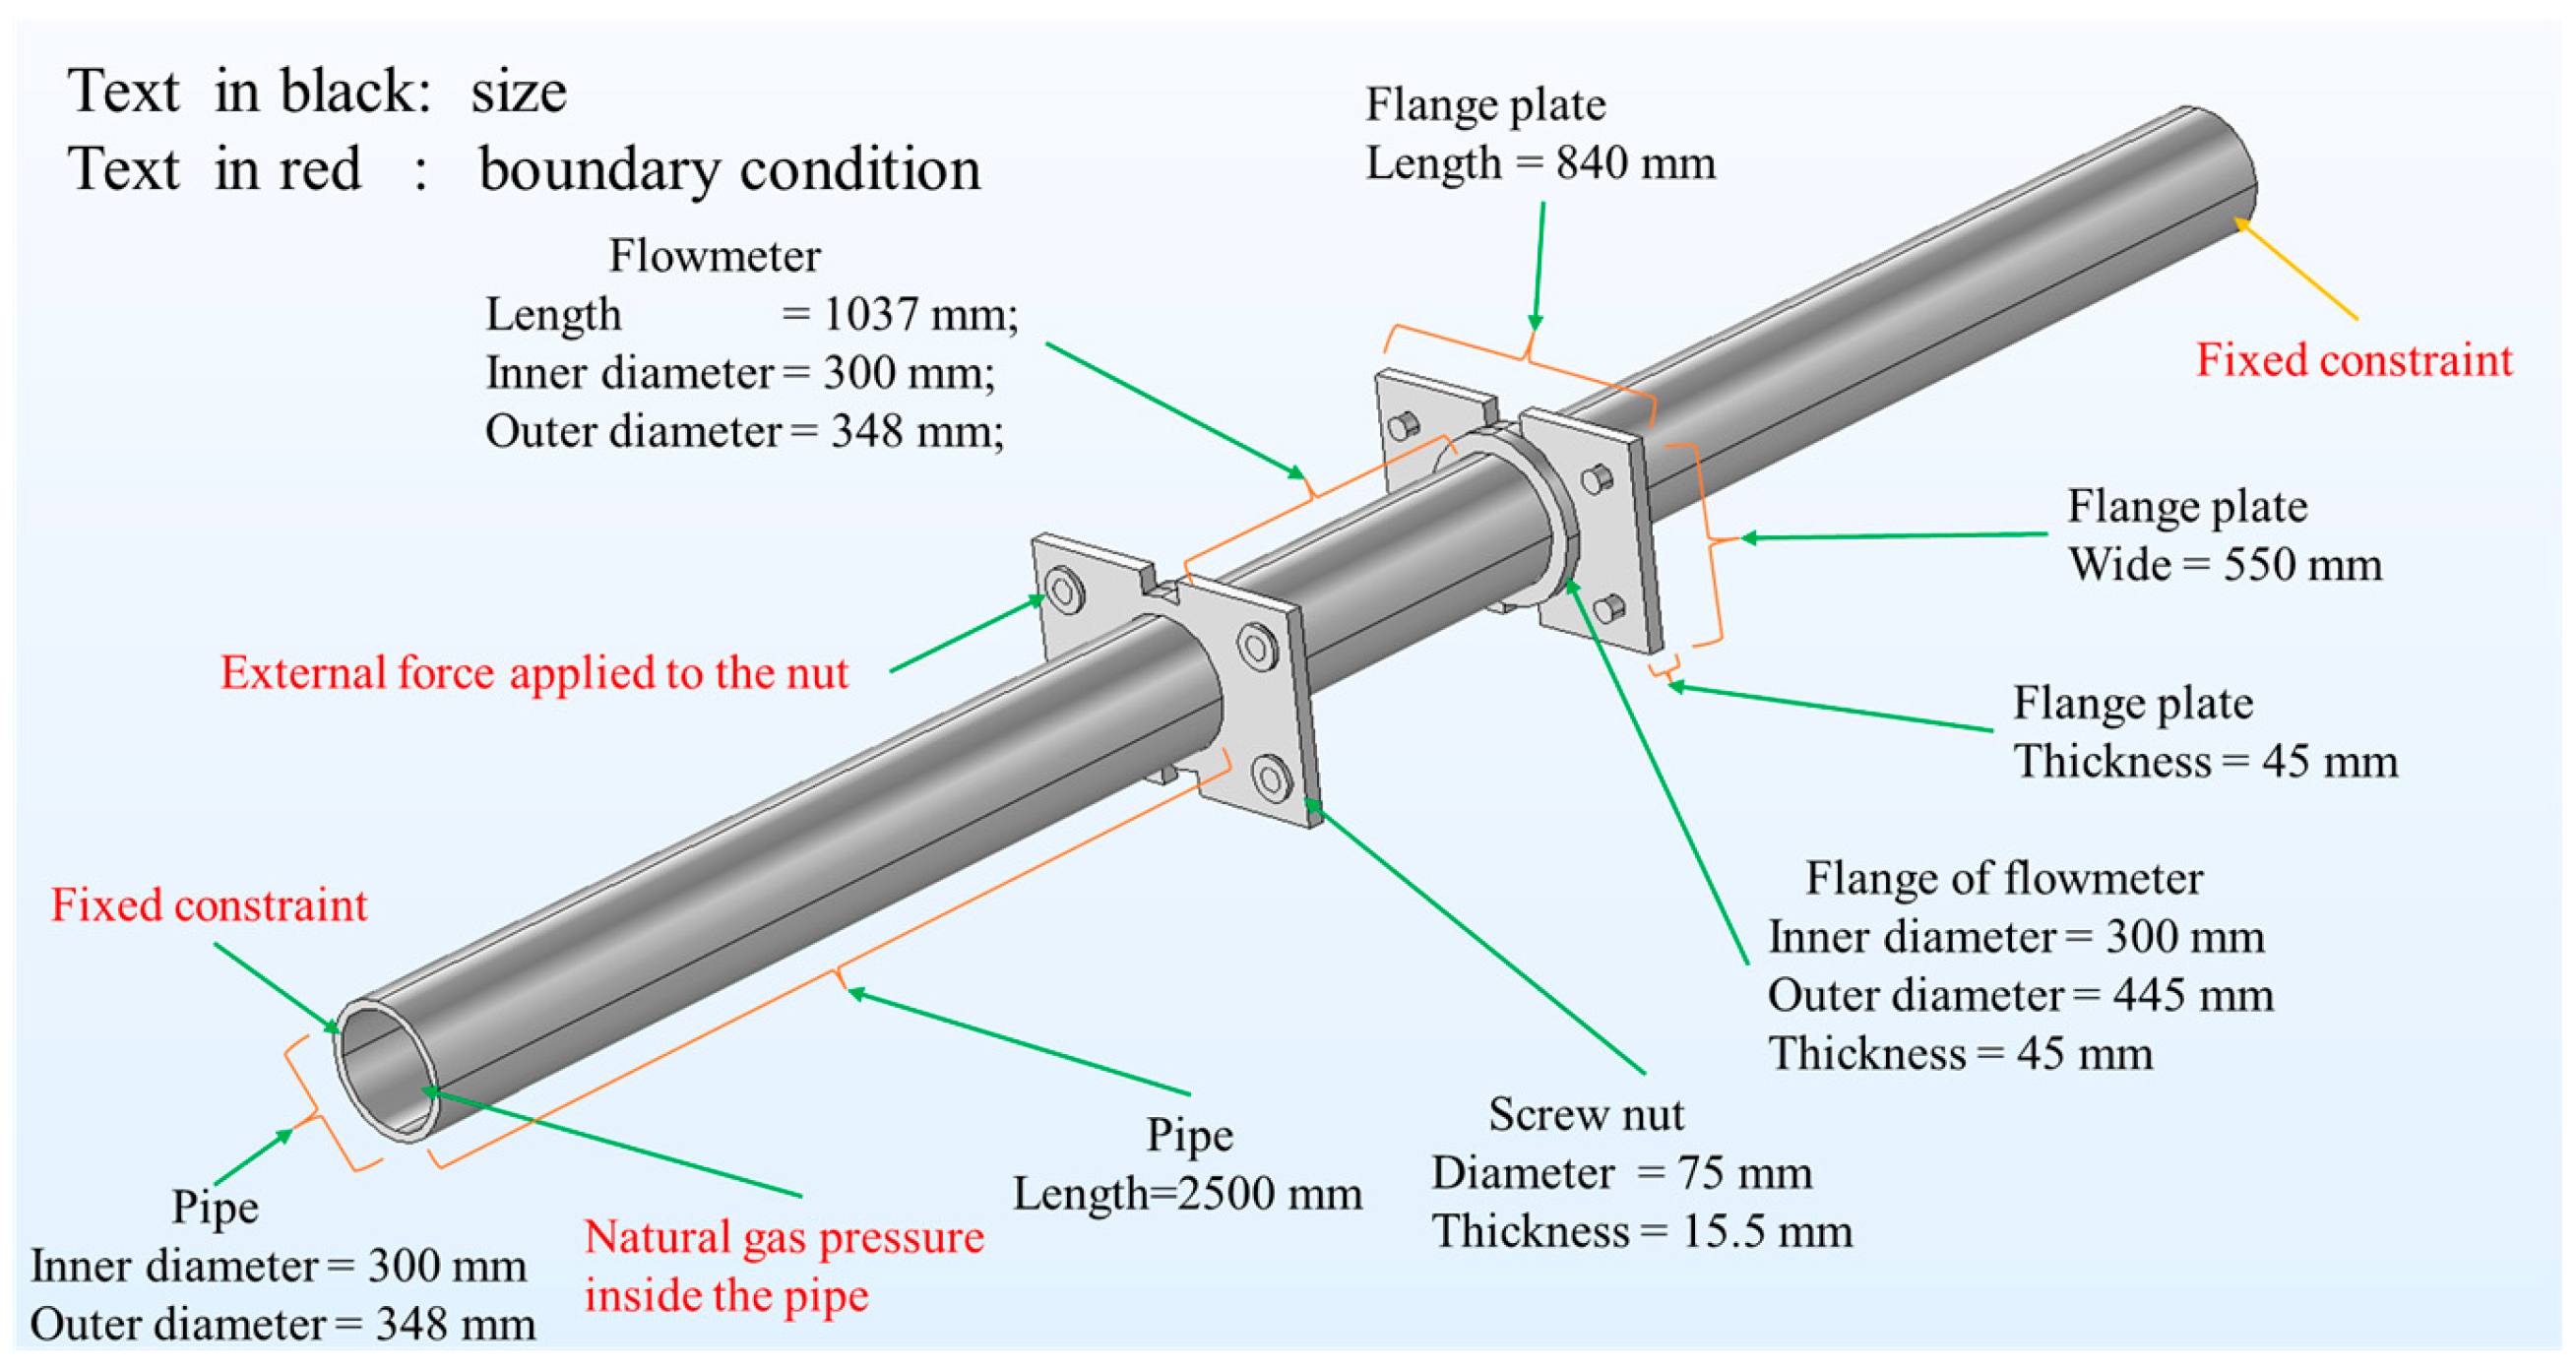
2.1. Physical Model

During transportation, real-time monitoring of the gas flow within pipelines is achieved via a flowmeter. Traditional methods often involve directly connecting the flowmeter to the pipe using screw nuts. This type of flowmeter clamping device was first proposed by the China National Petroleum and Natural Gas Pipe Network Group Co., Ltd. in 2024, as shown in Figure 1, Figure 2 and Figure 3. It has not been publicly disclosed before. Based on feedback from on-site operations, the time required by clamping once is about 1–2 h, including all the time for the flow meter to be transported to the platform for alignment and then flow calibration. The previous bolt-tightening method required 4–6 h for the same process. Therefore, compared to before, the single calibration time has been reduced by 66–75%. Figure 1 depicts the on-site situation of a gas pipe with a flowmeter (color in blue). Figure 1a shows a panoramic view of the flowmeter clamping device, and Figure 1b shows the two ends of the clamping device pipeline fixed to the ground. This work proposes a structural solution that clamps the pipe flange and flowmeter flange together through contact by applying external force. The flowmeter’s inner diameter matches that of the pipe. External force is applied via screw nuts to clamp the flowmeter by connecting these two flanges.
Figure 2 shows the on-site flowmeter clamping experimental apparatus developed in this study. Figure 3 shows a schematic diagram of the simplified flowmeter fastening apparatus, including geometric parameters and boundary conditions. Below the clamping mechanism sits a movable workbench, with the centrally positioned flowmeter suspended above its base. Clamping plates on either side are secured by screws, while the flowmeter connects to the pipeline via a clamped flange. To streamline calculations, the device was simplified, yet it retains four essential components: the pipe, flange plate, flowmeter, and screw nuts. Table 1 tabulates the physical properties of the employed steel materials. Table 2 lists the geometric parameters of each component of the flowmeter clamping device. This work examines the von Mises stress of the clamping device and determines whether the strength of the device is sufficient by comparing the magnitude of the stress it is subjected to with its yield strength. Thus, the density, Young’s modulus, Poisson’s ratio, and yield strength of the X80 steel in the device are necessary for its mechanical analysis. The pipe is united with the flange plate, while the flange plate is in touch with both the screw nuts and the flowmeter. The two touched surfaces between the flange and the flowmeter flange in the on-site experimental device have undergone slight deformation. These two surfaces maintain the same displacement with almost no relative motion. So, these two touched surfaces are simplified to a connected and integrated state. Simulation is a static study, with fixed constraints at both ends of the pipeline in the initial state, and the flange initially only in contact, not under compression, and not under stress.

2.2. Governing Equation

After establishing the physical model in Section 2.1, the mathematical model for stress analysis should now be developed. The correlation between the external force exerted on the model and stress can be expressed as [22]
0 = σ + F
where σ denotes the stress experienced in the device (N·m⁻2) and F denotes the externally applied force along the deformation direction (N).
The flowmeter fastening apparatus studied in this work is made of steel, which is a typical linearly elastic material. For materials exhibiting linear elasticity, Hooke’s Law defines the stress–strain relationship such that stress varies directly with strain. The Hooke’s Law can be expressed by [22]
σ = C ε
where C denotes the elastic parameter matrix of force and ε denotes the strain of the device steel.
Strain refers to the relative deformation of a material’s local region caused by applied external forces and non-uniform temperature variations. The strain of the steel material is determined by its deformations in all directions, which can be expressed by [22]
ε = 1 2 [ ( u ) T + u ]
where u represents the material deformation (m) and T denotes the transpose operation of the matrix.
The elastic parameter matrix is a crucial parameter matrix that describes the mechanical properties of materials. The term described in the sentence is a stress–strain curve. The elastic parameter matrix of steel materials can be expressed as [22]
C = E ( 1 + ν ) ( 1 2 ν ) ( 1 v ) v v 0 0 0 v ( 1 v ) ( 1 v ) 0 0 0 v v ( 1 v ) 0 0 0 0 0 0 1 2 ( 1 2 v ) 0 0 0 1 2 ( 1 2 v ) 0 0 0 1 2 ( 1 2 v )
where E represents Young’s modulus (Pa) and v represents Poisson’s ratio.

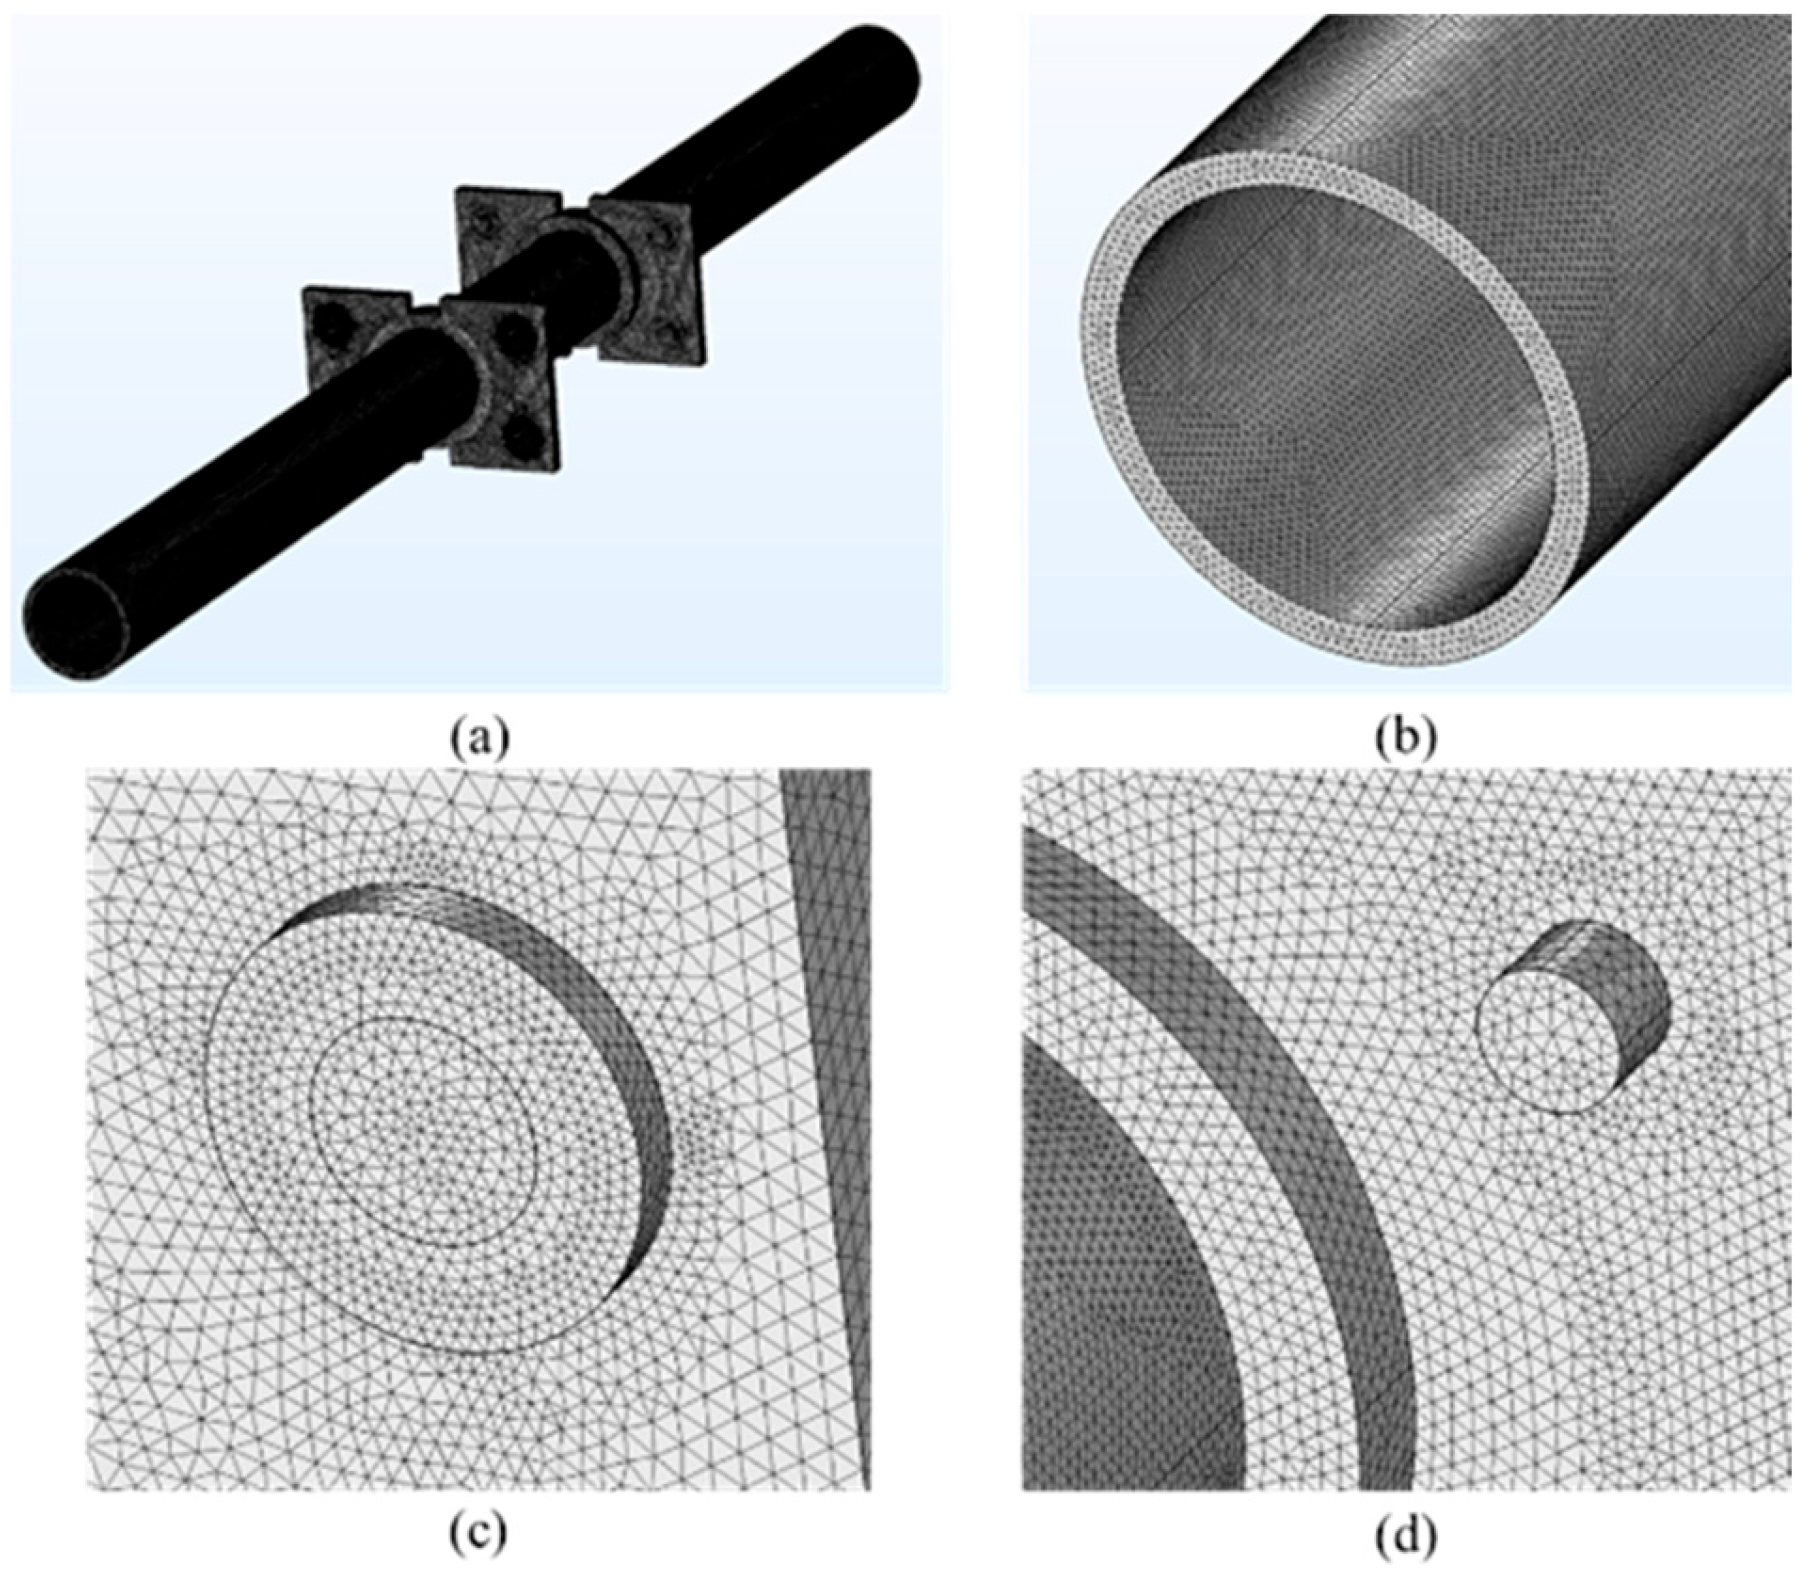
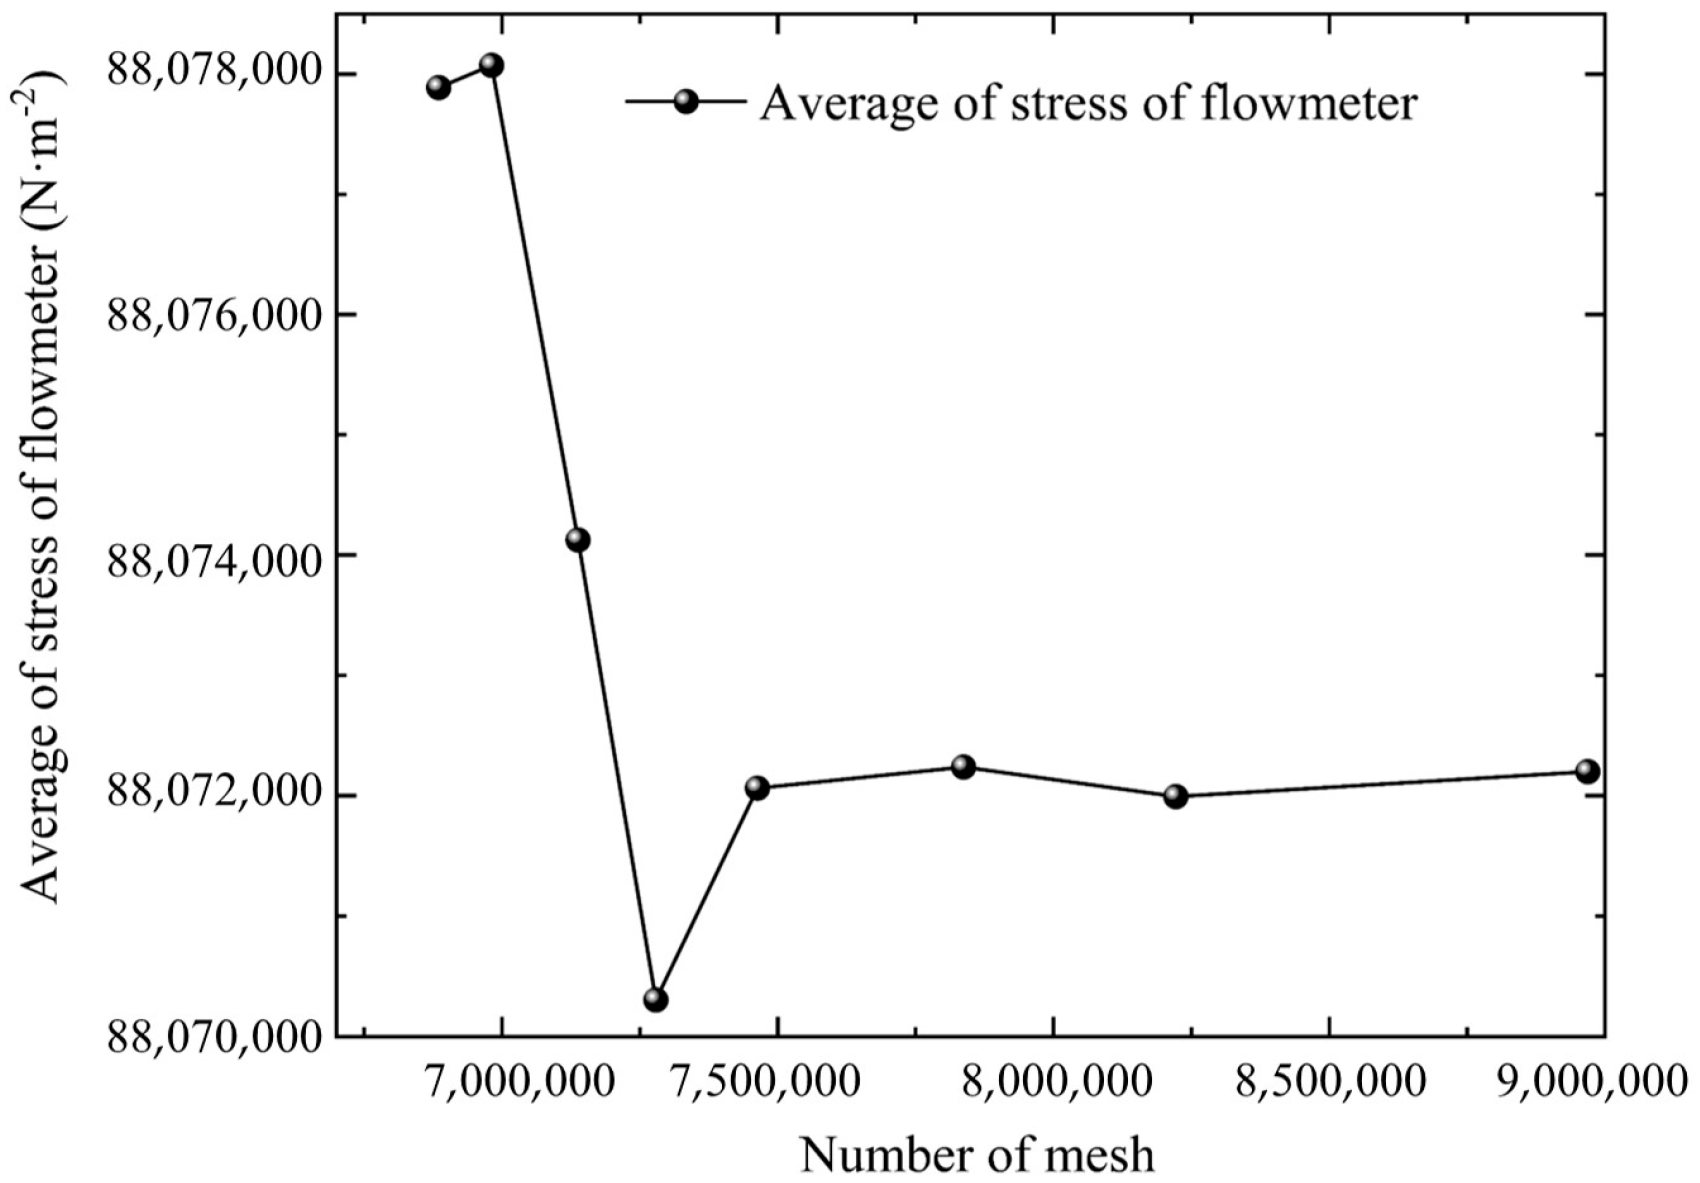
2.3. Mesh Generation

The flowmeter clamping apparatus exhibits substantial size discrepancies among its component parts. To ensure more accurate and reliable computational results while also considering computational efficiency, it is necessary to separately mesh the components of the device. The structural models are manufactured first on SolidWorks2023 and then imported into COMSOL5.6. The mesh partitioning and numerical simulation in this work were completed in COMSOL software. The flowmeter fastening apparatus model is meshed using free tetrahedrons, due to its adaptability to complex structures, without the need for strict boundary alignment. The screw nuts have a much smaller form factor when compared to the flowmeter and pipe, and they are also locations where stress is concentrated. Therefore, the mesh for the screw nuts needs to be refined. The clamping device model in this study is relatively regular and the deformation generated by the model is very small. So, in order to ensure the efficiency of simulation calculations, the mesh is divided into first-order free tetrahedra. Figure 4 shows the mesh generation result of the model. As illustrated in Figure 4, the current mesh is sufficiently fine for all irregular and thin-thickness areas to achieve reliable computations. Figure 5 shows the mesh independence verification of the clamping device, which illustrates the variation of the average stress magnitude of the flowmeter with the number of meshes. The verification of mesh independence shows that when the total number of mesh cells is 7,462,800, the stress distribution reaches a stable state, and the difference in average stress magnitude does not exceed 0.003%, which can achieve reliable calculation.

3. Results and Discussion

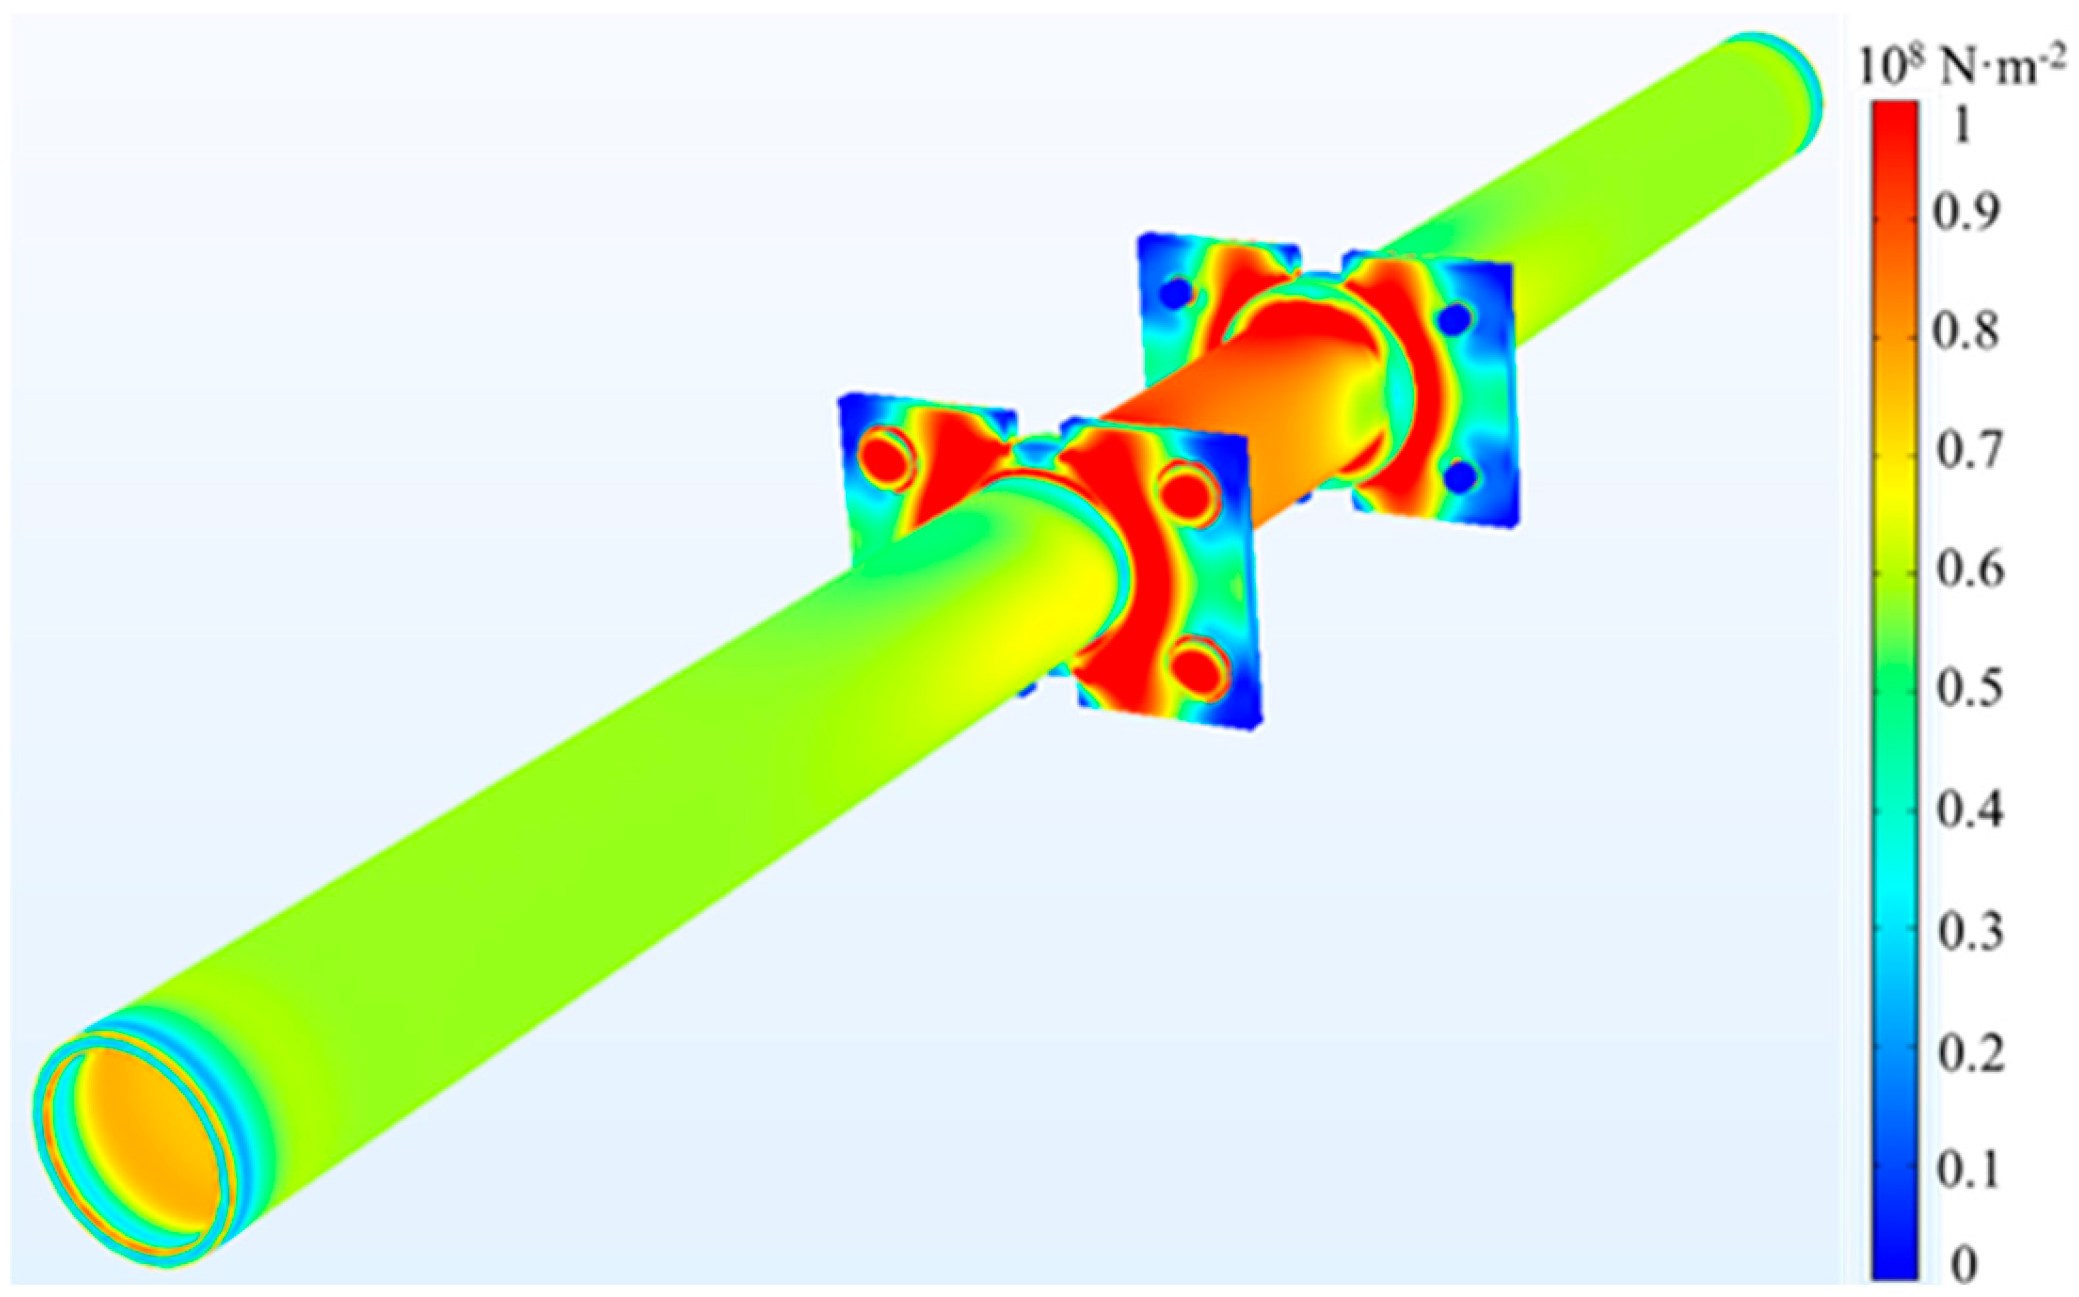
3.1. Stress Distribution of the Flowmeter Clamping Apparatus

In this study, the flowmeter flange is connected to the flange plates of the pipes on both sides through the tightening force applied by screw nuts. This connection ensures that the flowmeter flange is tightly in contact with the flange plates of the pipes. Both side flange plates each have eight screw nuts evenly arranged. According to the calculation of force balance, the clamping force on each nut needs to be at least 10.4 MPa. Thus, 11 MPa is set for each nut in this work. The tightening forces are all directed towards the flowmeter, clamping it tightly between the flange plates. The inner wall of the pipe is subjected to a 10 MPa pressure from the natural gas within. For the complete flowmeter clamping apparatus, fixed constraints are imposed on the extreme end faces of the pipes located on both sides. This research utilizes a steady-state solver to conduct the computation.
Figure 6 illustrates the distribution of total stress within the flowmeter clamping mechanism. As observed in the figure, the locations with higher stress are found in the screw nuts, the arcuate regions where the flange plates connect to the pipes, and the area where the flowmeter connects to its flange. The maximum stresses in these three regions are 139 MPa, 133 MPa, and 146 MPa, respectively. Stress concentration in the nuts occurs at their surfaces and the contact area with the flange plates. The maximum stress on the nut surface is 117 MPa. The peak stress in the contact area between the nuts and the flange plates is 139 MPa. The primary stress concentration on the flange plates occurs at the regions where they join with the pipes. The stress on the flange plates is close to a circular distribution, and the stress distribution is symmetrical along the geometric axis of the flange plates. The average and maximum stresses on the flange plates are 75 MPa and 133 MPa, respectively. The stress distribution on the flowmeter flange is mainly concentrated in the outer ring where it contacts the flange plate and the inner ring, where it contacts the pipe. The flowmeter’s overall stress exhibits higher stress concentrations at both ends and lower stress in the central region. The peak stress on the flowmeter is recorded as 146 MPa. The flowmeter flange exhibits higher stress on its outer and inner surfaces, with lower stress in the central region. This stress distribution results from the rigid contact between the flowmeter flange’s outer surface and the clamping flange. The minimum and maximum stresses on the flowmeter flange are 31 MPa and 146 MPa, respectively. The mean stress on the flowmeter flange is 55 MPa, which is significantly higher than the pipe of the natural gas pressure (10 MPa). This indicates that the flowmeter fastening apparatus designed in this study can operate safely and reliably. The stress on the pipes is generally lower than that on the flange plates and the flowmeter, and the distribution of stress on the pipes is relatively uniform.

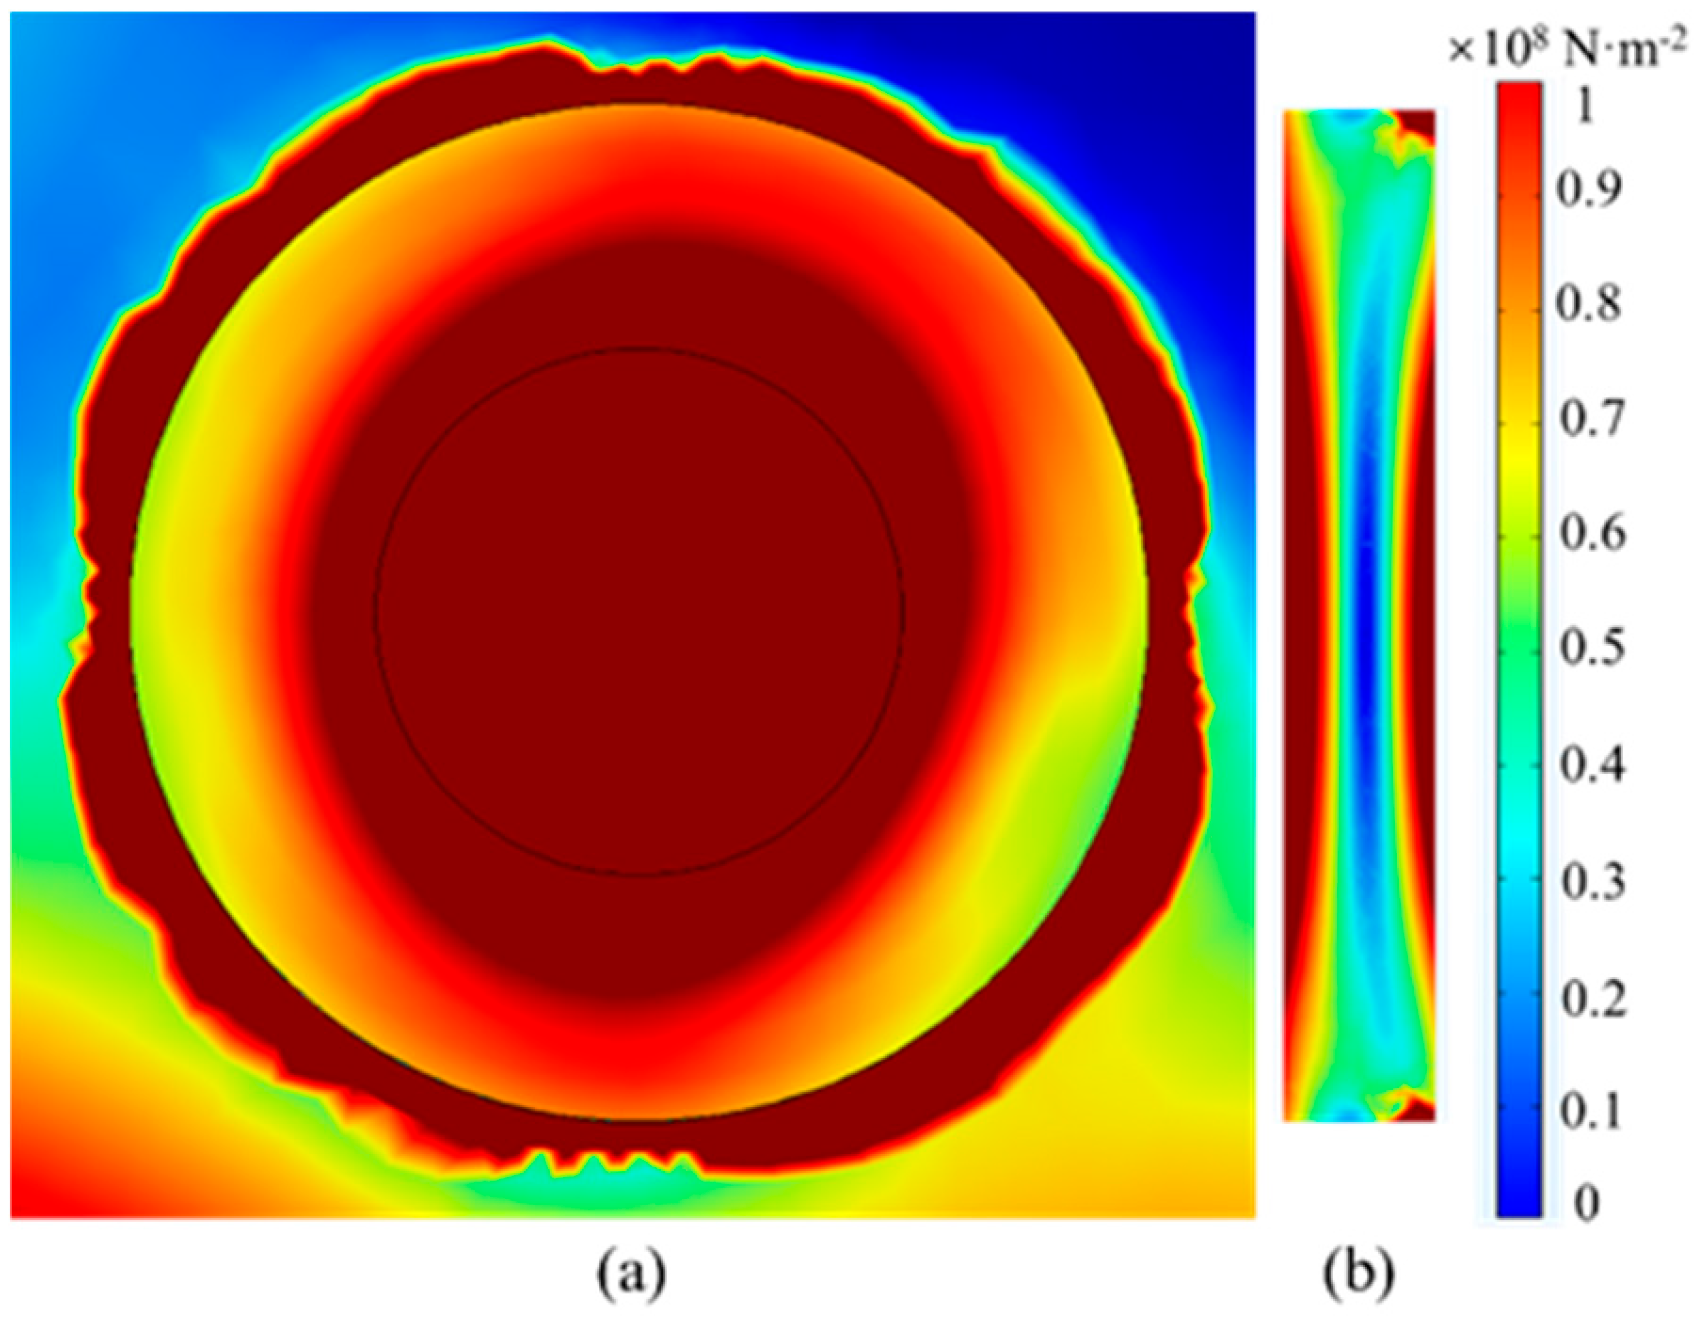
3.2. Stress Analysis Around Screw Nut

Figure 7a displays the stress distribution of the screw nut and its surrounding area where it contacts the flange plate. Figure 7b displays the distribution of stress across the nut’s cross-sectional area obtained from the analysis. As observed in Figure 7a, the distribution of stress in the screw nut generally features higher stress in the central area and lower stress in the outer peripheral region. This distribution is attributed to the screw nut being directly loaded by external force. Within the screw nut, the central part registers a peak stress of 117 MPa in contrast to the outer part’s minimum stress of 52 MPa. The area where the nut contacts the flange plate experiences stress due to the compression exerted by the nut, resulting in a nearly annular stress distribution. The highest stress is 139 MPa in the contact region of the screw nut and flange plate. Figure 7b reveals that the stress distribution of the nut cross-section progressively increases from the inside outwards. The average stress of the screw nut is 84 MPa.

3.3. Stress Analysis of Flange Plate

Figure 8a illustrates the global stress distribution within both flange plates of the flowmeter clamping mechanism. Figure 8b shows the stress state in the connection area between a single flange plate and the pipe. Figure 8c is a stress profile view of the middle section in the vertical direction from Figure 8b. The contact region of the stress state between the flange plate and flowmeter flange, as shown in Figure 8a, exhibits intensified stress in the inner ring and diminished stress in the outer ring. The peak stress in this contact interface measures 103 MPa, with the trough stress registering 29 MPa. However, the stress in the flange–pipe connection’s annular area shows lower stress in the middle and higher stress at the edges. In this connection region, the peak stress measures 133 MPa, while the trough stress is 18 MPa. Except for the nut area, the stress pattern on either side of the flange plate exhibits nearly identical characteristics. As depicted in Figure 8b, the stress distribution within the flange plate exhibits geometric symmetry. Low-stress regions in the flange plate are predominantly located in the peripheral areas, whereas high-stress regions primarily occur in pipe-adjacent zones. The flange plate exhibits an average stress of 75 MPa. The non-uniform stress distribution inside the flange plate, as shown in Figure 8c, is characterized by higher stress at the outer edges and lower stress in the mid-region.
Figure 9 displays the stress variation along the symmetry axis of the flange plate surface. As seen in Figure 9, there are significant peaks and valleys in the stress along the symmetry axis. The peak stress along the axis of symmetry is fourteenfold the minimum stress. Such distribution makes the flange plate more prone to deformation failure. Therefore, the force conditions of the flange plate should be particularly monitored during practical operation.

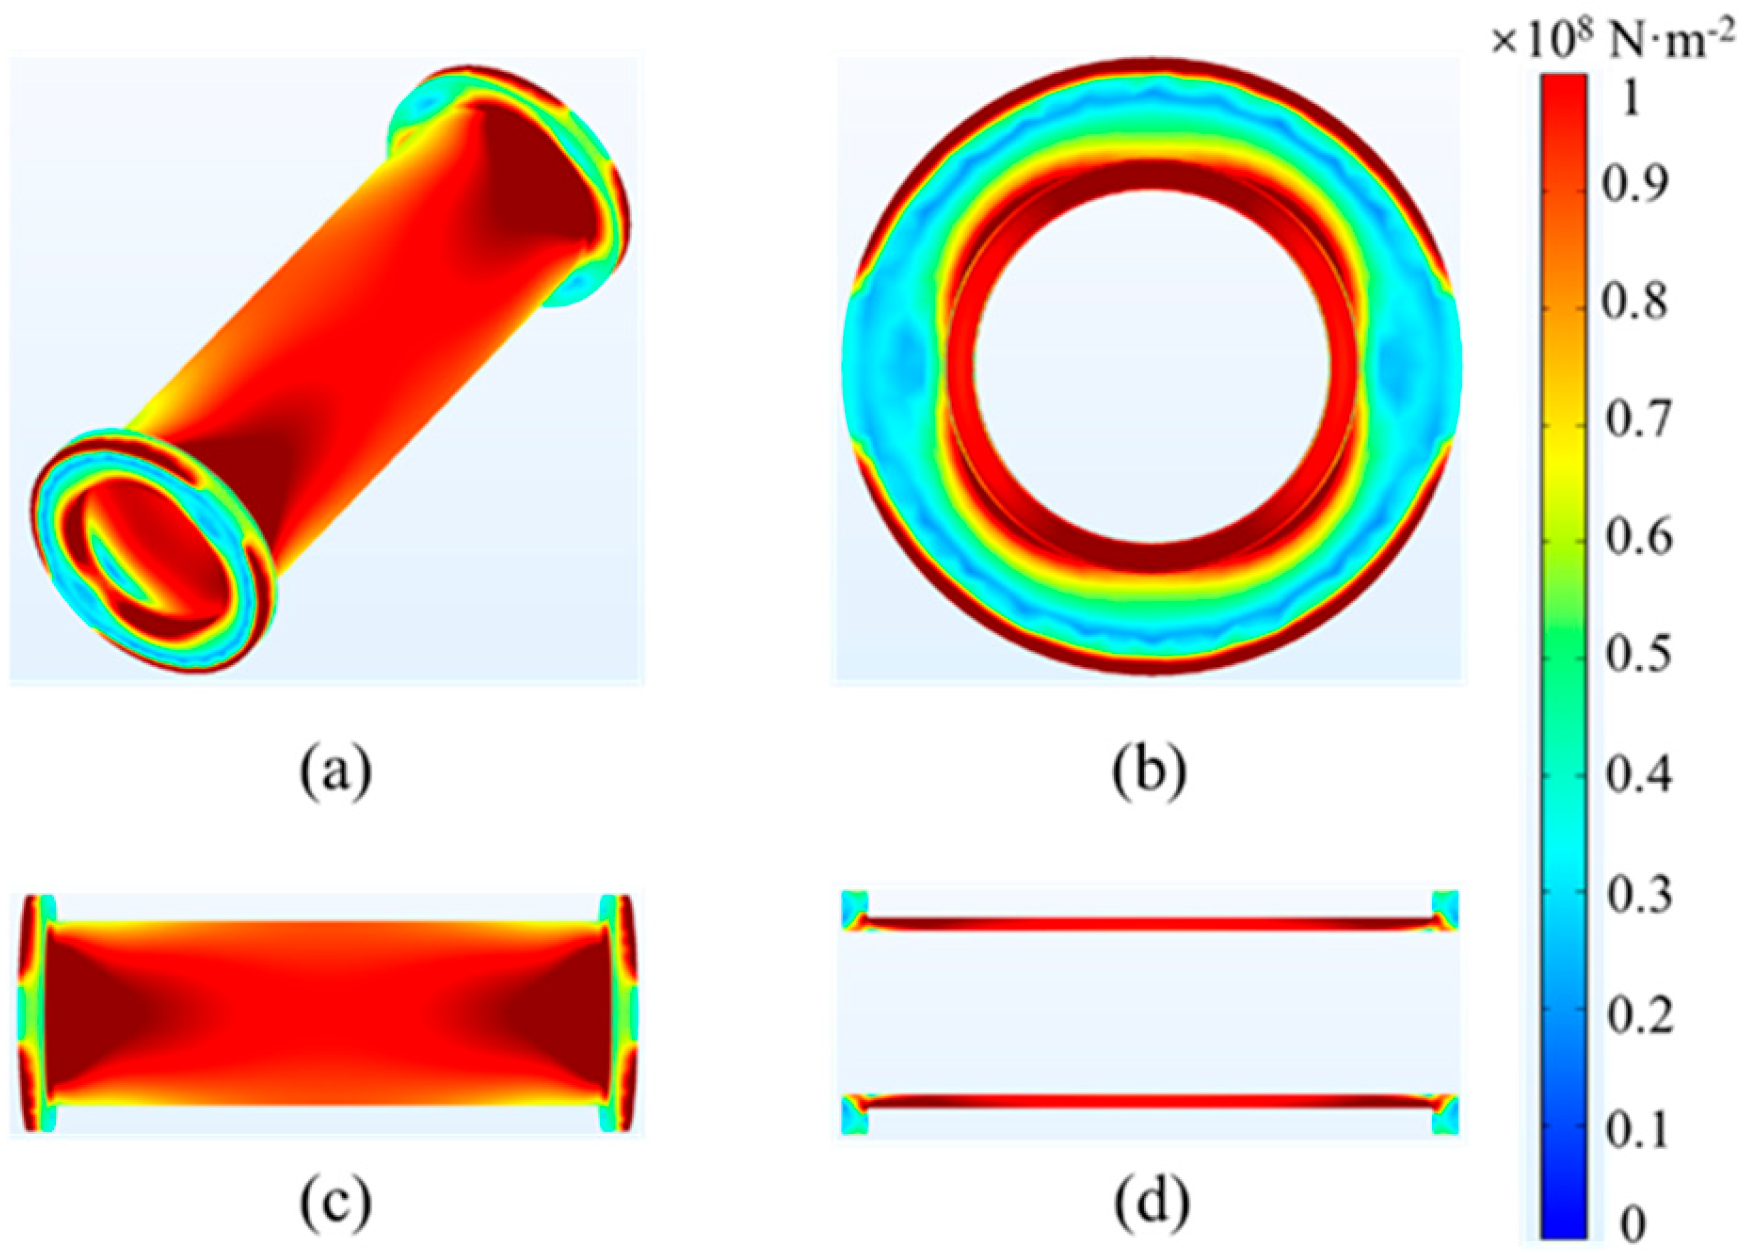
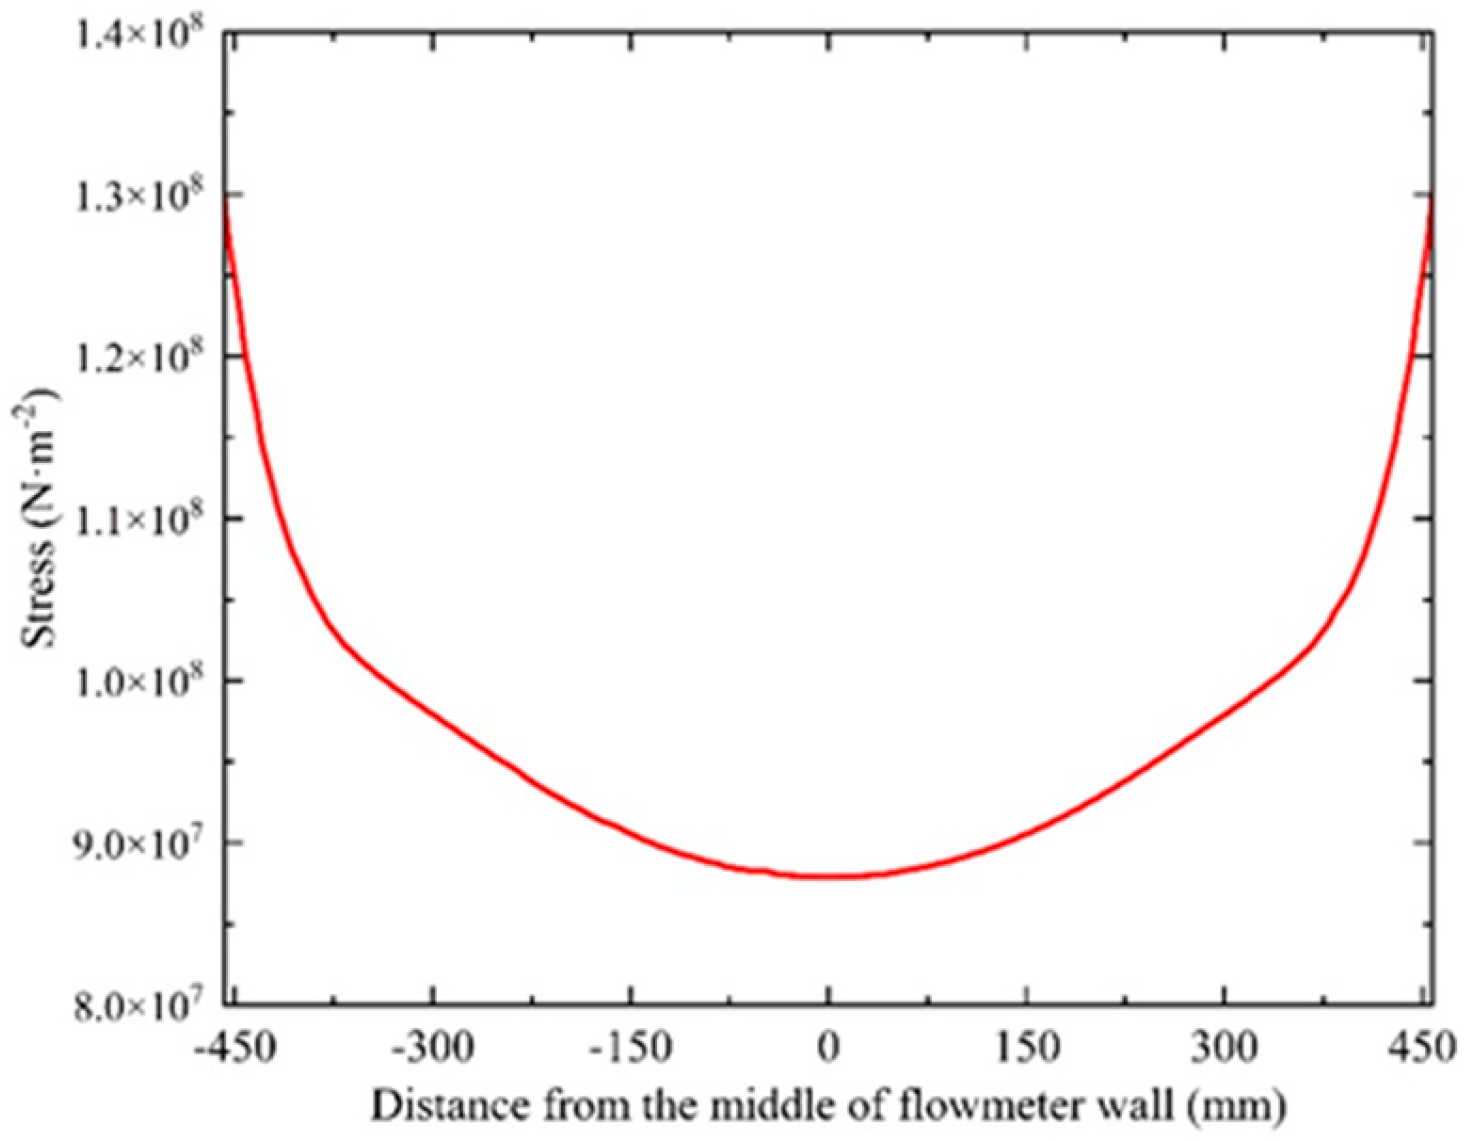
3.4. Stress Analysis of Flowmeter

Figure 10 displays the flowmeter’s overall and local stress distribution. The distribution of stress across the flowmeter’s surface is characterized by significantly higher stress at the two ends and notably lower stress in the central region. The stress gradually decreases from the ends toward the center of the flowmeter. Figure 11 shows the stress variation curve along the axial direction on the flowmeter surface. The peak stress across the flowmeter surface measures 130 MPa, while the mean stress stands at 86 MPa. The stress on the face of the flowmeter flange is characterized by lower stress in the middle and higher stress on both sides. The stress on the outer side of the flange end face is four times that in the middle. Analysis of the flowmeter’s stress distribution reveals significantly elevated stress levels throughout the structure, primarily due to its critical role as the clamped component. This component simultaneously experiences flange-induced clamping forces and internal pipeline pressure from natural gas.

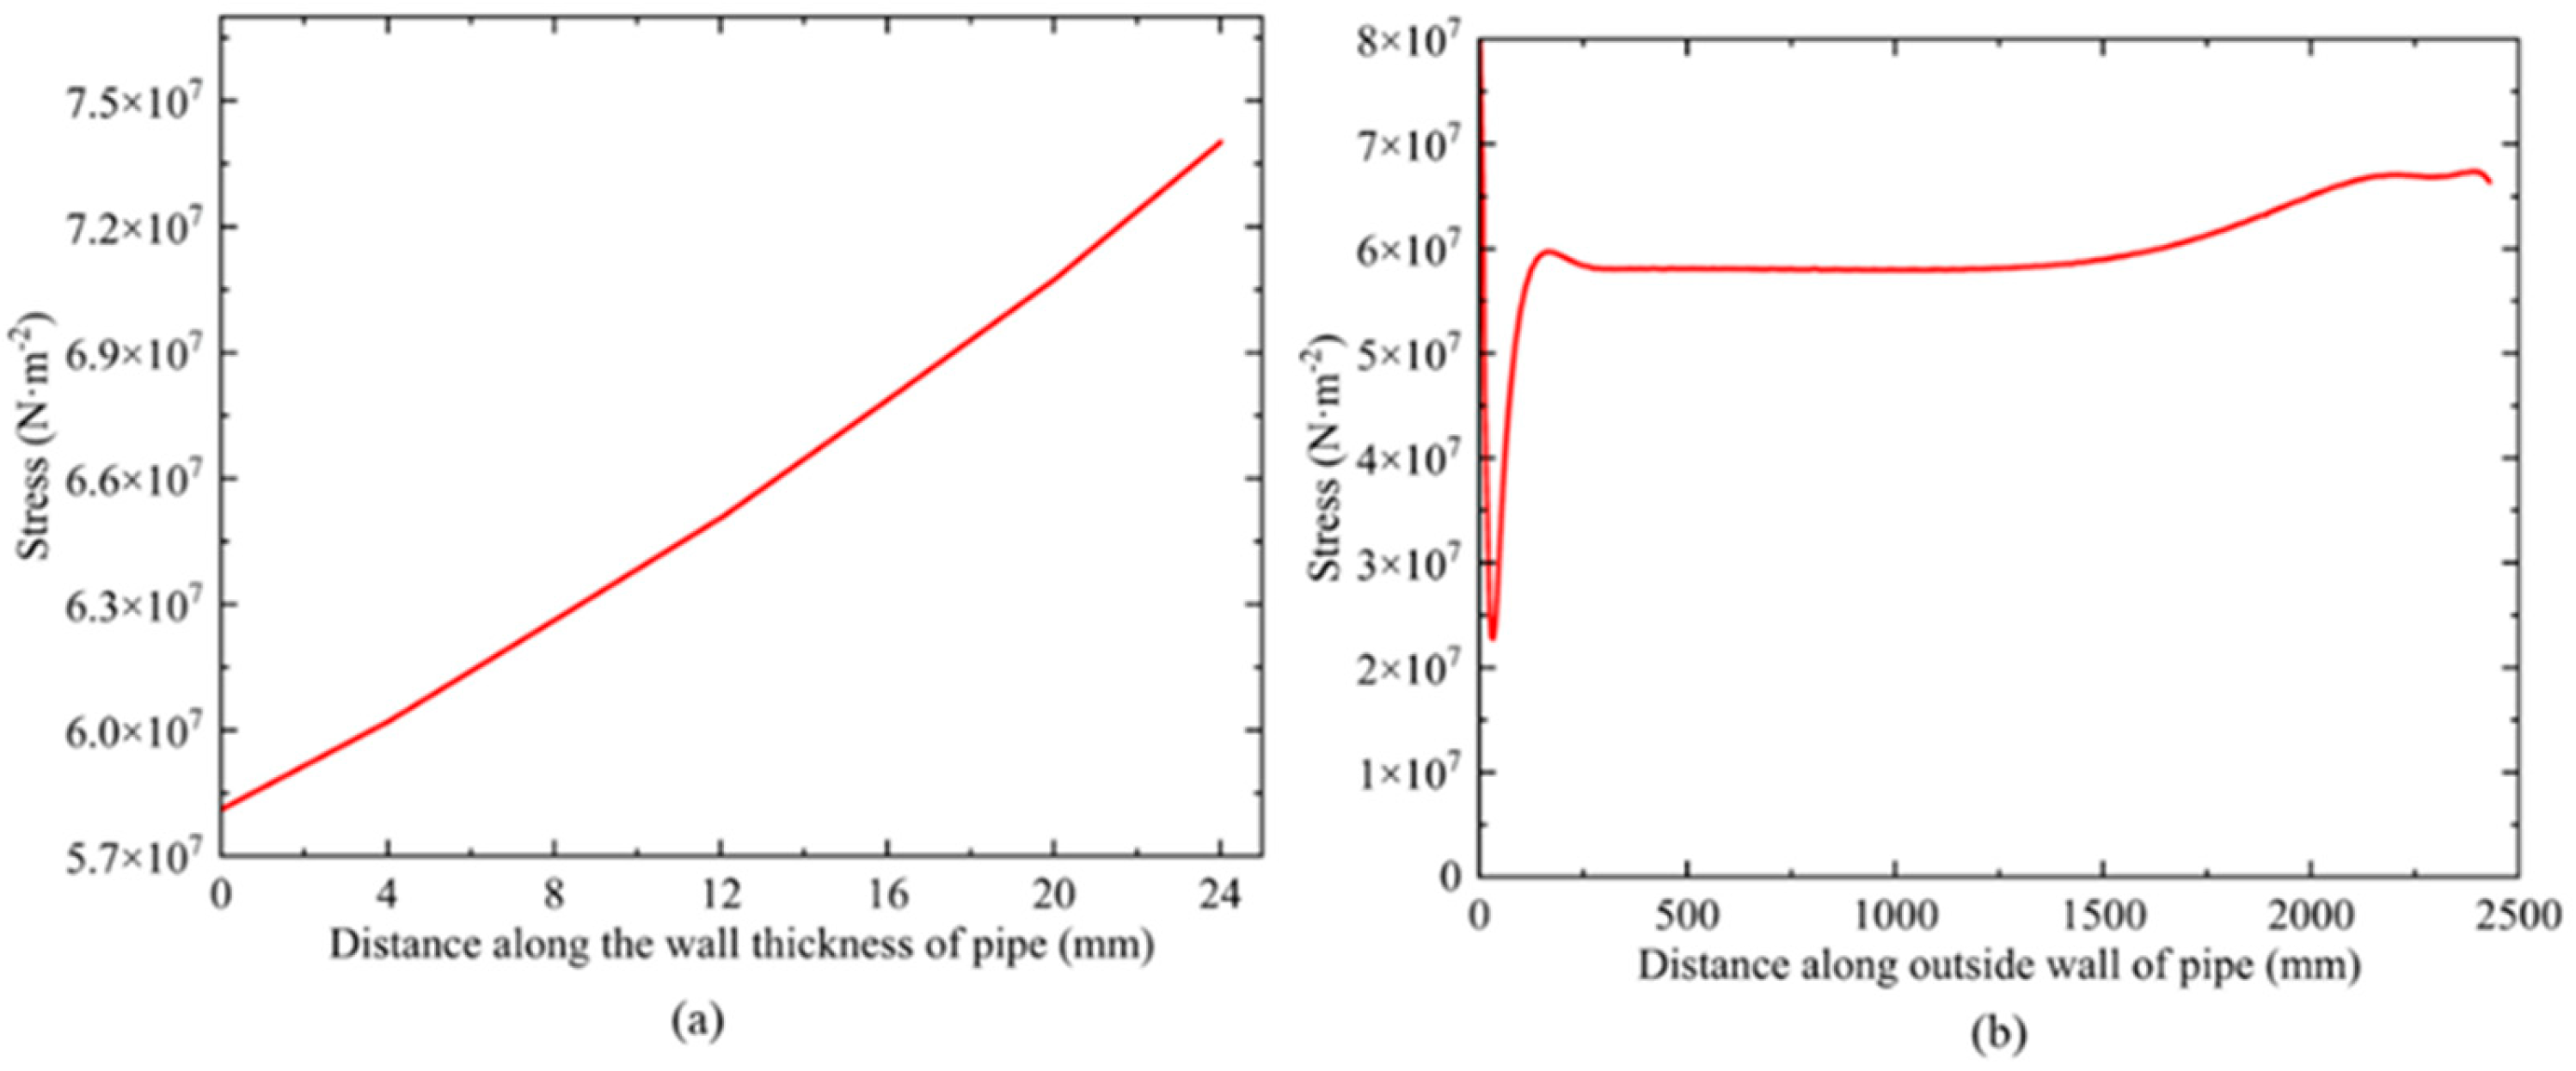
3.5. Stress Analysis of Pipe

Figure 12 displays the overall and cross-sectional stress distributions of a single-sided pipe. Figure 13 showcases the distribution of stress across the pipe wall and outside surface. The stress on the pipe surface first decreases sharply and then increases gradually. The sharp decline is due to setting the distal end of the pipeline as a fixed constraint. The two sides of the pipe are simultaneously subjected to the interaction of pulling force towards the middle direction of the flowmeter and pulling force towards the outer side of the pipe edge. These two pulling forces are directed along the pipe but in opposite directions, resulting in a certain degree of cancellation. Within the pipe wall, the stress distribution gradually increases from the outer layer to the inner layer. This distribution is jointly caused by the high pressure inside the pipe and the low pressure (atmospheric pressure) outside. The stress magnitudes across the cross-section range from 58 MPa (minimum) to 73 MPa (maximum) on the pipe.

4. Discussion

This study presents a clamping device designed for a natural gas pipe flowmeter. A finite element model was constructed to evaluate the distribution of stress inside the flowmeter fastening apparatus under applied external loads. Key components including screw nuts, flange plates, the flowmeter, and the pipeline were thoroughly analyzed. The analyses outlined above lead to the following conclusions:
(1)
The peak stress of the device is significantly lower than 50% of the material’s yield strength. So, the flowmeter fastening mechanism, as designed, operates in a safe and reliable manner, and the design of the entire device is reasonable.
(2)
The stress distribution on nuts usually has the characteristic of higher stress in the central area and lower stress in the surrounding area. The flowmeter’s surface stress shows greater stress at its two extremities and lower stress in the central zone.
(3)
A peak stress of 146 MPa is exhibited at the flowmeter flange within the clamping device. And the nut has the smallest maximum stress value among the four components, with a value of 117 MPa.
Future work will focus on bridging the complexity gap between model structures and actual experiments. After the experimental equipment is built, we will conduct strain measurement and pressure testing verification.

Author Contributions

Conceptualization, Z.-Y.S. and Y.-X.Y.; methodology, C.-Y.M.; software, Z.-Q.Y.; validation, Z.-Q.Y., M.Z., and Z.-Y.S.; formal analysis, Z.-Y.S.; investigation, Y.-X.Y.; resources, J.-Z.L.; data curation, C.-Y.M.; writing—original draft preparation, M.Z.; writing—review and editing, M.Z.; visualization, Y.-X.Y.; supervision, J.-Z.L.; project administration, J.-Z.L.; funding acquisition, Y.-X.Y. All authors have read and agreed to the published version of the manuscript.

Funding

This research was funded by the Northeast Branch of National Petroleum and Natural Gas Pipe Network Group Co., Ltd., Grant number No. DBGS-SZZN202401.

Data Availability Statement

The data presented in this study are available on request from the corresponding author.

Conflicts of Interest

Authors Zhao-Yong Song, Yu-Xing Yang, Man Zhang, Zhi-Qiang Yao, and Chao-Yi Mu were employed by the company Northeast Branch of National Petroleum and Natural Gas Pipe Network Group Co., Ltd. The remaining authors declare that the research was conducted in the absence of any commercial or financial relationships that could be construed as a potential conflict of interest.

References

  1. Wu, X.; Lu, H.; Wu, S. Stress analysis of parallel oil and gas steel pipelines in inclined tunnels. SpringerPlus 2015, 4, 659. [Google Scholar] [CrossRef] [PubMed]
  2. Qiu, G.; Sun, M. Interaction Mechanism of Inter-Pipes in Double-Layer Pipelines and a Mechanical Model with Differential Thermal Deformation. Processes 2025, 13, 762. [Google Scholar] [CrossRef]
  3. Cho, Y.; Ulrich, B.A.; Zimmerle, D.J.; Smits, K.M. Estimating natural gas emissions from underground pipelines using surface concentration measurements. Environ. Pollut. 2020, 267, 115514. [Google Scholar] [CrossRef]
  4. Ulrich, B.A.; Mitton, M.; Lachenmeyer, E.; Hecobian, A.; Zimmerle, D.; Smits, K.M. Natural gas emissions from underground pipelines and implications for leak detection. Environ. Sci. Technol. Lett. 2019, 6, 401–406. [Google Scholar] [CrossRef]
  5. Li, L.; Zhu, L.; Yan, X.; Jia, H.; Xie, S.; Zou, Y. The impact of weld repairs on the microstructure and mechanical integrity of X80 pipelines in oil and gas transmission. Processes 2025, 13, 512. [Google Scholar] [CrossRef]
  6. Dong, J.; Jing, C.; Peng, Y.; Liu, Y.; Ren, H.; Liu, X. Study on the measurement accuracy of an improved cemented carbide orifice flowmeter in natural gas pipeline. Flow Meas. Instrum. 2018, 59, 52–62. [Google Scholar] [CrossRef]
  7. Guzzini, A.; Pellegrini, M.; Saccani, C.; Dudek, A.; Gajec, M.; Kr’ol, A.; Kulaga, P.; Gislon, P.; Cigolotti, V.; Robino, M.; et al. Hydrogen in natural gas grids: Prospects and recommendations about gas flow meters. Int. J. Hydrog. Energy 2024, 86, 343–362. [Google Scholar] [CrossRef]
  8. Mehmanparast, A.; Lotfian, S.; Vipin, S.P. A review of challenges and opportunities associated with bolted flange connections in the offshore wind industry. Metals 2020, 10, 732. [Google Scholar] [CrossRef]
  9. Łaciak, M.; Włodek, T.; Kozakiewicz, T.; Krystian, L. Impact of flood water on the technical condition of natural gas transmission pipeline valves. J. Loss Prev. Process Ind. 2020, 63, 103998. [Google Scholar] [CrossRef]
  10. Zhang, Z.; Guo, Y.; Wang, D.; Li, G.; Peng, D. A Noisy-OR gate based fuzzy fault tree approach for micro-leakage evaluation of bolt-gasket-flange connection (BGFC). J. Loss Prev. Process Ind. 2021, 71, 104521. [Google Scholar] [CrossRef]
  11. Sabokrouh, M.; Farahani, M. Experimental study of the residual stresses in girth weld of natural gas transmission pipeline. J. Appl. Comput. Mech. 2019, 5, 199–206. [Google Scholar] [CrossRef]
  12. Gu, X.; Zhang, Y.; Huang, C.; Luo, X.; Zhang, H.; Zhou, R.; Qiu, Y. Sensitivity analysis of influencing factors of gas pipelines with corrosion defects under the action of landslides. Energies 2022, 15, 6640. [Google Scholar] [CrossRef]
  13. Pourazizi, R.; Mohtadi-Bonab, M.A.; Szpunar, J.A. Investigation of different failure modes in oil and natural gas pipeline steels. Eng. Fail. Anal. 2020, 109, 104400. [Google Scholar] [CrossRef]
  14. Eames, I.; Austin, M.; Wojcik, A. Injection of gaseous hydrogen into a natural gas pipeline. Int. J. Hydrog. Energy 2022, 47, 25745–25754. [Google Scholar] [CrossRef]
  15. Cerniauskas, S.; Junco, A.J.C.; Grube, T.; Robinius, M.; Stolten, D. Options of natural gas pipeline reassignment for hydrogen: Cost assessment for a Germany case study. Int. J. Hydrog. Energy 2020, 45, 12095–12107. [Google Scholar] [CrossRef]
  16. Liao, C.; Lu, H.; Fan, S.; Chang, X.; Sun, H. Study on stress relaxation characteristics of bolted flanged joints with metal C-rings. Int. J. Press. Vessel. Pip. 2019, 171, 207–216. [Google Scholar] [CrossRef]
  17. Peng, Z.; Zhao, H.; Li, X.; Yuan, L.; Zhu, T. Ductile fracture of X80 pipeline steel over a wide range of stress triaxialities and Lode angles. Eng. Fract. Mech. 2023, 289, 109470. [Google Scholar] [CrossRef]
  18. Yu, D.; Yang, C.; Sun, Q.; Dai, L.; Wang, A.; Xuan, H. Impact of process parameters on temperature and residual stress distribution of X80 pipe girth welds. Int. J. Press. Vessel. Pip. 2023, 203, 104939. [Google Scholar] [CrossRef]
  19. Qin, G.; Cheng, Y.F. Failure pressure prediction by defect assessment and finite element modelling on natural gas pipelines under cyclic loading. J. Nat. Gas Sci. Eng. 2020, 81, 103445. [Google Scholar] [CrossRef]
  20. Khater, M.A.; Arroussi, C.; Memchout, S.A. Finite element analyses of buckling behavior in x60 steel pipelines under axial compression load. Stud. Eng. Exact Sci. 2024, 5, e6708. [Google Scholar] [CrossRef]
  21. Xiang, Y.; Zhu, L.; Jia, B.; Zhao, L.; Li, N.; Gu, Y.; Ren, P. Sensitivity analysis and failure prediction of X80 pipeline under transverse landslide. J. Constr. Steel Res. 2025, 224, 109090. [Google Scholar] [CrossRef]
  22. Jafari, A.; Broumand, P.; Vahab, M.; Khalili, N. An eXtended finite element method implementation in COMSOL multiphysics: Solid mechanics. Finite Elem. Anal. Des. 2022, 202, 103707. [Google Scholar] [CrossRef]
Figure 1. The on-site situation of gas pipe with a flowmeter (color in blue): (a) the middle section; (b) the end of the pipeline.
Processes 13 01841 g001
Figure 2. On-site physical picture of the flowmeter fastening apparatus.
Processes 13 01841 g002
Figure 3. Simplified structure of the flowmeter fastening apparatus used for calculation.
Processes 13 01841 g003
Figure 4. Mesh of the flowmeter fastening apparatus: (a) total, (b) pipe, (c) screw nut, (d) flange.
Processes 13 01841 g004
Figure 5. Mesh independence verification.
Processes 13 01841 g005
Figure 6. Overall stress distribution of the flowmeter fastening apparatus.
Processes 13 01841 g006
Figure 7. Stress distribution of (a) screw nut and its surrounding and (b) cross-section of screw nut.
Processes 13 01841 g007
Figure 8. Stress distribution of flange plate: (a) both, (b) single, (c) sectional view.
Processes 13 01841 g008
Figure 9. Stress variation on the symmetry axis of the flange plate surface.
Processes 13 01841 g009
Figure 10. Stress distribution of flowmeter: (a) whole, (b) flange, (c) surface, (d) cross section.
Processes 13 01841 g010
Figure 11. Stress variation along the flowmeter surface.
Processes 13 01841 g011
Figure 12. Stress distribution of single-sided pipe of clamping device: (a) overall and (b) cross-section.
Processes 13 01841 g012
Figure 13. Stress variation: (a) inside pipe wall and (b) on pipe surface.
Processes 13 01841 g013
Table 1. Property parameters of steel material for the flowmeter fastening apparatus [17,21].
Young’s ModulusPoisson’s RatioDensityYield Strength
200 MPa0.37850 kg·m−3552 MPa
Table 2. Geometric parameters of the flowmeter clamping device.
ComponentValue (mm)
PipeLength (one side)2500
Inner diameter300
Outer diameter348
Flange plateLength840
Wide550
Thickness45
FlowmeterLength1037
Inner diameter300
Outer diameter348
Flange of flowmeterInner diameter300
Outer diameter445
Thickness45
Screw nutDiameter75
Thickness15.5
Disclaimer/Publisher’s Note: The statements, opinions and data contained in all publications are solely those of the individual author(s) and contributor(s) and not of MDPI and/or the editor(s). MDPI and/or the editor(s) disclaim responsibility for any injury to people or property resulting from any ideas, methods, instructions or products referred to in the content.

