Article

The Effect of Storage on the Absorption and Fluorescence Spectra of Petal Extracts of Selected Anthocyanin-Containing Flowers

Laboratory of Analytical Biochemistry, Institute of Food Science and Nutrition, Faculty of Technology and Life Sciences, University of Rzeszow, 4 Zelwerowicza Street, 35-601 Rzeszow, Poland
*
Author to whom correspondence should be addressed.
Processes 2025, 13(6), 1826; https://doi.org/10.3390/pr13061826
Submission received: 3 May 2025 / Revised: 31 May 2025 / Accepted: 4 June 2025 / Published: 9 June 2025
(This article belongs to the Section Biological Processes and Systems)

Abstract

:
The biological role of the fluorescence of flowers is a matter of debate. Anthocyanins are a group of compounds that are weakly fluorescent; their fluorescence in flowers has been rarely studied. This study aimed to compare the absorption and fluorescence spectra of anthocyanins extracted from several anthocyanin-containing autumn flowers and examine changes in these spectra during the storage of petals at cold-room and room temperatures and during the storage of dried petals. Petals of red clover Trifolium pratense, pink petunia Petunia × hybrida, Pelargonium horatum, Pelargonium. zonale, Pelargonium. peltatum, red and pink Begonia semperflorens, Buddleja japonica, and purple Chrysanthemum were studied. The results demonstrate that it is possible to distinguish between petals of various flowers based on the absorption spectra of petal extracts and the fluorescence spectra of petal extracts and intact petals. Spectral changes during storage were not always unidirectional and progressive; the most common one was the increase in the intensity of the fluorescence band at 500–560 nm at the excitation wavelength of 460 nm. These results point to the possibility of using fluorescence measurements to identify and estimate the freshness of petal-based material in herbalism, forensic analysis, and the food industry. The measurement of the spectra of whole petals or their fragments by front-face fluorimetry, including common plate readers, may be especially useful due to its simplicity and rapidity.

Graphical Abstract

1. Introduction

Many flowers and other parts of plants owe their color, especially red, purple, and blue, to anthocyanins. These pigments play a protective role in plants, as they absorb visible and UV radiation and are effective antioxidants [1,2,3,4]. In flowers, however, their main function is to attract pollinators and allow them to identify the preferred flower [5,6]. Many flowers exhibit fluorescence. Petals of flowers that are fluorescent may contain various fluorescent compounds, including anthocyanins, chlorophyll, rosmarinic acid, ferulic acid, p-coumaric acid, chlorogenic acid, caffeic acid, betaxanthins, betacyanins, aurones, β-carotene, rhodopin, and spheroidenone [7].
The possible biological role of flower fluorescence has been a matter of debate. Native fluorescence was hypothesized to play the role of an attracting signal, as demonstrated in budgerigars’ plumage [8,9]. A nectar-eating and cactus flower pollinator, the flower bat, Glossophaga soricina, was found to be able to see light with an optimum wavelength of 510 nm (in addition to UV) [10], which corresponds with the maximum fluorescence emission of betaxanthins. The described native fluorescence of betaxanthins (present in the family Cactaceae) enhances the brightness of flowers at this wavelength and may, therefore, enhance their visibility. The existence of a green receptor in bees’ vision, and the fact that bright targets were detected more reliably than dim ones in behavioral experiments [11], suggests that betaxanthin fluorescence may play a physiological role [12]. The fluorescence of the pitcher flytrap Nepenthes khasiana was found to play a role in attracting insect prey [13].
However, although the occurrence of fluorescence is widespread, the fluorescence quantum efficiency of most natural pigments is low, of an order of 1% or less under natural conditions [14]. A comparison of the intensity of reflected light and the fluorescence intensity of a range of flowers leads to the conclusion that fluorescence emission is negligible compared to the light reflected by petals, even for the most fluorescent samples, and can hardly be considered an optical signal in biocommunication [7,15].
Anthocyanins are fluorescent compounds; however, their fluorescence quantum yield is low [16], mainly due to the efficient excited-state proton transfer to water [17]. Apparently, for this reason, the fluorescence of anthocyanins in flowers has been scarcely studied. Thus, it was of interest to examine the fluorescent properties of anthocyanin-containing flowers and their extracts.
For this study, nine autumn flowers known to contain anthocyanins were chosen. The red clover Trifolium pratense was found to contain (in order of decreasing content) malvidin-3-O-galactoside, peonidin-3-O-galactoside, cyanidin-3-O-galactoside, petunidin-3-O-galactoside, delphinidin-3, 5-O-diglucoside, petunidin-3-O-rutinoside, and cyanidin-3-O-glucoside [18]. Three main anthocyanins were present in Petunia exserta: cyanidin 3-O-sophoroside, cyanidin 3-O-glucoside, and peonidin 3-O-glucoside; cyanidin 3-O-rutinoside and cyanidin 3,5-O-diglucoside were also detected [19]. The major anthocyanins identified in the leaves of Mitchell petunia [Petunia axillaris x (Petunia axillaris x Petunia hybrida cv. ‘Rose of Heaven’)] growing under high light were petunidin-3-O-rutinoside-5-O-glucoside acylated with p-coumaric acid, petunidin-3-O-rutinoside-5-O-glucoside, 4-O-glucosyl-p-coumaric acid, and petunidin-3-O-rutinoside-5-O-glucoside acylated with caffeic acid [20]. The major anthocyanins in Pelargonium species were identified as the 3,5-O-diglucosides and 3-O-glucoside-5-(6-O-acetyl)glucosides of pelargonidin, cyanidin, peonidin, delphinidin, petunidin, and malvidin [21]. Pelargonium x domesticum was reported to contain glucosides of pelargonidin, cyanidin, peonidin, delphinidin, petunidin, and malvidin, in different proportions in various cultivars and hybrids [22]. Red petals of Pelargonium zonale were found to contain more anthocyanins than pink petals [23]. Six anthocyanins were identified in different Begonia species, including cyanidin 3-O-(2″-xylosyl,6″-trans caffeoyl)glucoside, cyanidin 3-O-(2″-xylosyl,6″-cis-caffeoyl)glucoside, and cis and trans isomers of cyanidin-3-O-(2″-xylosyl,6″-p-coumaroyl)glucoside and cyanidin 3-O-(2″-glucosyl,6″-p-coumaroyl)glucoside [24]. Fifteen various anthocyanins were detected in the petals of eight cultivars of Rieger begonia. Ten contained peonidin, and three contained cyanidin as the aglycone; malvidin or delphinidin were the aglycones of the remaining anthocyanins. Most of these compounds were acylated. Peonidin-containing anthocyanidins accounted for over 50% of the anthocyanidin pool of red begonia flowers, accounting for more than 50% of total anthocyanins [25]. Malvidin-3,5–O-diglucoside was identified as the main anthocyanin of Begonia malabarica; other anthocyanidins present in this species were glycosides of peonidin, delphinidin, and cyanidin [26]. Colored flowers of Buddleia were reported to contain anthocyanins [27]. Chrysanthemum flowers were extensively studied in the context of elucidation of anthocyanin biosynthesis [28,29,30]. The main anthocyanins identified in the chrysanthemum Dendranthema grandiflorum include cyanidin 3-glucoside and cyanidin 3-(3″-O-malonoyl)glucoside [31].
Apart from this controversy on the importance of flower fluorescence for pollinators, the fluorescence of flowers is interesting from other, more practical points of view, such as the possibility of the rapid identification of plant material or the estimation of the freshness of flower products; both may be useful for forensics, pharmaceutical industry, or the production of flower-based food supplements. This study aimed to (i) compare the fluorescence spectra of intact petals and the absorption and fluorescence spectra of the petal extracts of the chosen autumn anthocyanin-containing flowers, and (ii) examine the effect of the storage of petals under various conditions on the absorption and fluorescence spectra of their extracts. We were particularly interested in the fluorescence emitted at about 500–560 nm upon excitation at 460 nm, which we previously found to be a marker of anthocyanidin and anthocyanin oxidation [32].

2. Materials and Methods

2.1. Reagents and Material

Sodium acetate anhydrous (CAS no. 127-09-3, cat. no. BN60/6191, purity ≥ 99%) was obtained from Avantor Performance Materials Poland (Gliwice, Poland). Acetic acid (CAS no. 64-19-7, cat. no. 425687339, purity 80%) was provided by Chempur (Piekary Śląskie, Poland). Distilled water was purified using a Milli-Q system (Millipore, Bedford, MA, USA). The transparent (cat. no. 655101) and black (cat. no. 655076) flat-bottom 96-well plates were supplied by Greiner (Kremsmünster, Austria).
Flowers were collected in the Podkarpackie region, southeastern Poland, in October 2024, as listed in Table 1.

2.2. Methods

Samples of about 200 mg of flower petals were closed in Eppendorf tubes and stored for various times until the time of extract preparation, either at room temperature (21–23 °C) or in a cold room (3–5 °C), in the dark. A separate set of petal samples was dried in a mushroom drier at a temperature of 60 °C for 4 h and stored in closed vials at room temperature in the dark.
Petal extracts were prepared in 25 mM sodium acetate buffer, pH 5.0, at a ratio of 900 µL of buffer per 100 mg of fresh petals by homogenizing the material in a mortar. The homogenates were centrifuged, and the supernatants were measured immediately or stored at −80 °C until analysis.
Fragments of petals were placed in the wells of a black 96-well plate, and their fluorescence was measured in the top mode in a Spark multimode plate reader (Tecan Group Ltd., Männedorf, Switzerland). Absorption and fluorescence spectra were measured in the same plate reader. Excitation spectra were measured in the range of 230–420 nm (emission measured at 460 nm) and 230–640 nm (emission measured at 680 nm), while emission spectra were measured in the range of 400–800 nm at the excitation wavelength of 350 nm and in the range of 500–800 nm at the excitation wavelength of 460 nm. The excitation wavelength of 350 nm was selected based on prescreening, which indicated maximum excitation in this range for most extracts and petals. The excitation wavelength of 460 nm was chosen based on our earlier results showing the appearance of a new band typical for anthocyanin oxidation upon excitation in the region of 460 nm [32].
To quantitatively characterize changes in the spectra, the ratio of maximal fluorescence intensities at the maxima was preferentially used. In cases when a ratio of maximal fluorescence values was less reliable or only one maximum was present, a sum of fluorescence intensities corresponding to a fluorescence peak or total fluorescence was calculated (the sum of fluorescence intensities measured every 2 nm in the specified range).

3. Results

3.1. Absorption Spectra of Petal Extracts

The absorption spectra of the petal extracts of selected flowers were read in the visible range (400–700 nm). The spectra do not cover the high absorption peak with a maximum below 400 nm and start from its descending part. In some cases, only fragments of the spectra are shown to visualize lower peaks (Figure 1, insets). The storage of petals at a temperature of 4 °C for up to 12 weeks induced changes in the spectra of petal extracts, which were characterized quantitatively by chosen spectral parameters, describing the anthocyanin content and transformations: the maximal absorbance at the absorption peak or the difference between the absorbance at a shoulder and 700 nm. In the case of Petunia × hybrida petal extracts, where no peak or shoulder was found in the visible range, the difference between the absorbance at 400 and 700 nm was determined. While for petals of begonias, Buddleja, Pelargonium zonale, Chrysanthemum, and Trifolium, a progressive decrease in the values of the spectral parameters was noted, apparently reflecting anthocyanin degradation, the changes were non-monotonous and more complex for petals of Pelargonium horatum, Pelargonium peltatum, and Petunia × hybrida (Figure 1).

3.2. Fluorescence Spectra of Petals

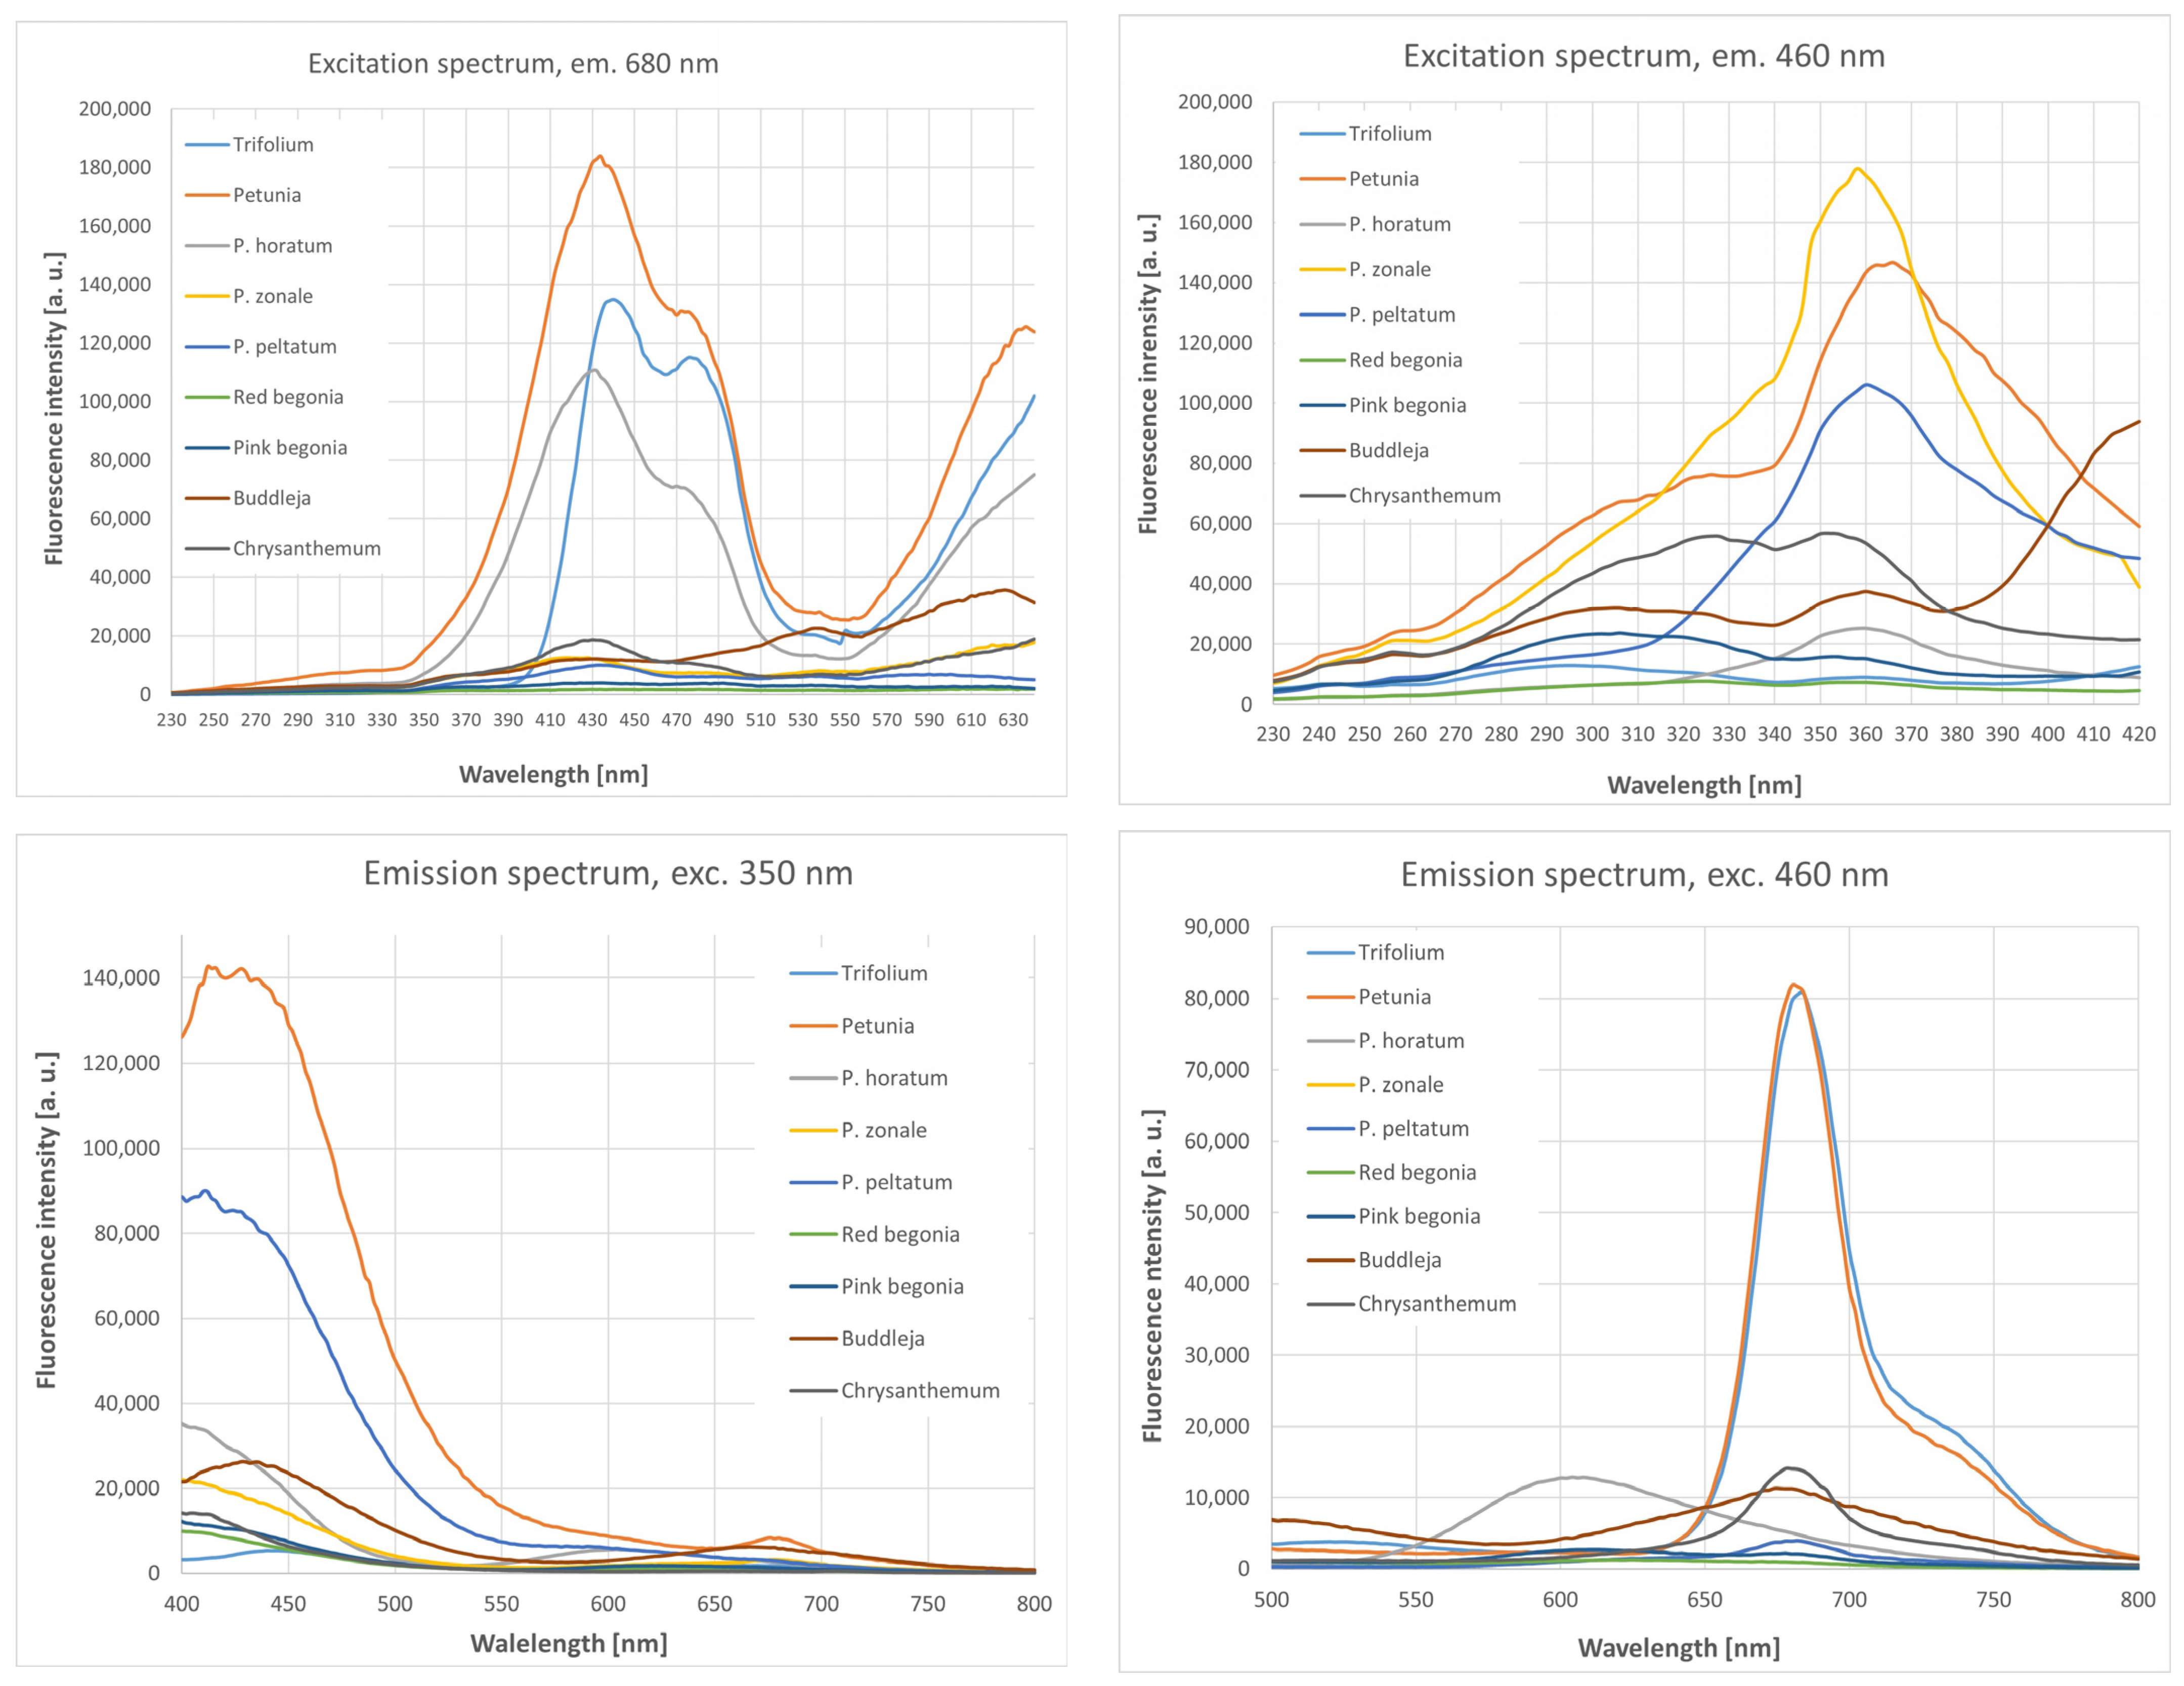
Measurements of the spectra of petal fragments demonstrated significant differences in the presence and positions of maxima and the values of maximal fluorescence between flower petals of different plants (Figure 2, Table 2).

3.3. Fluorescence Spectra of Petal Extracts

Figures S1 and S2 and Tables S1 and S2 present the excitation spectra of petal extracts, positions of maxima, and changes in the selected parameters of these spectra.

3.3.1. Excitation Spectra Measured at the Emission Wavelength of 460 nm

The excitation spectra of the extracts of Trifolium pratense petals measured at the emission wavelength of 460 nm showed two maxima, at 302–308 nm and 356–370 nm. The position of the longer-wavelength excitation maximum showed a bathochromic shift in stored samples, as compared with fresh ones (Figure S1, Table S1), except for dried petals, where this position remained stable. The spectra of the extracts of Petunia × hybrida petals showed the presence of two maxima, one at 256 nm and another at 356–360 nm. There were no systematic changes in the positions of the maxima found in spectra. The spectra of the extracts of Pelargonium horatum petals showed the presence of three maxima, at 254–262 nm, 328–340 nm, and 356–364 nm. The position of the first maximum showed a small bathochromic shift in the case of petals stored at room temperature and in the extracts of petals stored at a cold-room temperature after 12 weeks. The spectra of the extracts of Pelargonium zonale petals showed two maxima, at 330–336 nm and 352–360 nm; no systematic change in the positions of these maxima was found upon incubation up to 4 weeks. The spectra of the extracts of Pelargonium peltatum petals showed two maxima in the wavelength ranges of 250–258 nm and 352–362 nm. No systematic change in the positions of these maxima was found during incubation. The spectra of red Begonia semperflorens petals showed two maxima, one at 324–325 nm and another at 352–360 nm. No general trend in the position of maxima was observed during the storage of petals. The spectra of the extracts of pink Begonia semperflorens petals showed two maxima, one at 286–320 nm and another at 344–366 nm. The position of both maxima showed a bathochromic shift in the extracts of petals stored at the cold-room and room temperatures. The spectra of the extracts of dried petals also showed the presence of a third maximum at 396–400 nm. In the extracts of dried petals, the position of the first maximum showed a hypsochromic shift, and that of the third maximum revealed a small bathochromic shift during storage. The spectra of the petal extracts of Buddleja japonica showed two maxima, at 302–316 nm and 396–414 nm. The position of the second maximum moved slightly toward longer wavelengths, except for petals stored at a cold-room temperature, where the position of the maximum shifted to shorter wavelengths after 1 and 4 weeks. The spectra of the petals of Chrysanthemum showed two maxima, at 322–326 nm and 360 nm. The position of the first maximum moved slightly toward longer wavelengths for petals stored at cold-room and room temperatures for 12 weeks.
The ratio of fluorescence intensities at the two excitation maxima did not reveal consistent changes for the petals of Buddleja japonica (Figure S2). The sums of fluorescence intensities in the ranges specified in the legend of Figure S2 generally did not reveal consistent changes with time, but for Pelargonium zonale and Chrysanthemum, they increased with increasing incubation time.

3.3.2. Excitation Spectra Measured at the Emission Wavelength of 680 nm

The excitation spectra of the extracts of Trifolium pratense petals measured at the emission wavelength of 680 nm showed two maxima, at 415–453 nm and 582–620 nm (Figure S3, Table S2). The position of the shorter-wavelength excitation maximum showed a hypsochromic shift, as compared with fresh ones (except for 1-week storage), while that of a longer-wavelength maximum exhibited a bathochromic shift in the extracts of petals stored at room and cold-room temperatures. In dried petals, the positions of both maxima remained stable. The spectra of the extracts of Petunia × hybrida petals showed the presence of two maxima, one at 412–416 nm or 482–488 nm and another at 604–620 nm. The position of the first maximum in the excitation spectra showed a hypsochromic shift in the extracts of the stored petals. The spectra of the extracts of Pelargonium horatum petals showed the presence of two maxima, at 412–420 nm and 494–525 nm. The positions of the first maximum showed a bathochromic shift after 12 weeks of storage, especially in the petals stored at cold-room and room temperatures. The spectra of the extracts of Pelargonium zonale petals showed two distinct maxima, at 414–424 nm and 534–540 nm; hypsochromic shifts were observed in both maxima in the extracts of petals stored for 1 and 4 weeks at cold-room and room temperatures. The spectra of the extracts of Pelargonium peltatum petals showed two maxima in the wavelength range of 413–478 nm and 527–542 nm. A hypsochromic shift in the position of the second maximum was observed during the storage of dried petals. The spectra of the extracts of red Begonia semperflorens petals showed two maxima, one at 370–418 nm and another at 454–538 nm. Hypsochromic shifts in the second maxima were observed in the extracts of petals stored at cold-room and room temperatures. The spectra of the extracts of pink Begonia semperflorens petals showed two maxima, at 362–374 nm and 484–490 nm. The positions of these maxima did not reveal any consistent changes during storage. The spectra of the petals of Buddleja japonica showed the presence of a single distinct maximum at 414–458 nm. A second maximum located at 540 nm appeared in the extracts of the stored dried petals. A bathochromic shift in the position of the single maximum was observed in the extracts of petals incubated at room temperature. The spectra of the petals of Chrysanthemum showed one broad peak with its maximum at 481–490 nm. The position of this showed a slight shift toward shorter wavelengths for petals stored for 1 and 4 weeks, increasing again for petals stored for 12 weeks.
The ratio of maximal fluorescence at the two excitation maxima did not show any consistent pattern of changes for the extracts of all the examined species of Pelargonium (Figure S4). Similarly, no consistent changes in the value of the sum of fluorescence intensities were seen for the extracts of Trifolium. pratense, red and pink Begonia semperflorens, and Buddleja japonica during storage. The sum of fluorescence increased progressively in the petal extracts of Petunia × hybrida and decreased progressively in the extracts of Chrysanthemum, except for a small increase in the extracts of dried petals stored for 1 week.

3.3.3. Emission Spectra Measured at the Excitation Wavelength of 350 nm

The fluorescence emission spectra of petal extracts at the excitation wavelength of 350 nm are presented in Figure 3. The spectra of the extracts of all petals showed the presence of a major peak in the range of 400–500 nm (426–452 nm for Trifolium pratense, 454–480 nm for Petunia × hybrida, 412–490 nm for Pelargonium horatum, 406–480 nm for Pelargonium zonale, 400–491 nm for Pelargonium peltatum, 394–448 nm for Begonia semperflorens red, 394–430 for Begonia semperflorens pink, 444–470 nm for Buddleja japonica, and 428–448 nm for Chrysanthemum). The position of the main maximum showed bathochromic shifts in the petal extracts of Trifolium pratense stored at cold-room and room temperatures, extracts of Petunia × hybrida petals stored at cold-room and room temperatures for 1 and 4 weeks, the extracts of Pelargonium horatum petals stored at room temperature for 1 and 4 weeks, the extracts of Pelargonium zonale and Pelargonium peltatum petals stored at cold-room and room temperatures, the extracts of dried petals stored for 1 and 4 weeks, and the petal extracts of Buddleja japonica (except for dried petals stored for 12 weeks). Hypsochromic shifts in the main maximum were observed for the extracts of the dried petals of Trifolium pratense, Pelargonium horatum, and Chrysanthemum.
The main maxima were accompanied by smaller emission maxima, not always visible in the spectra of the extracts of stored petals. Such a second maximum was seen at 673–680 nm in the spectra of the petal extracts of Trifolium pratense, 674–770 nm for Petunia × hybrida, 674–680 nm for Pelargonium horatum, 632–678 nm for Pelargonium zonale, 678–714 nm for Pelargonium peltatum, 678–714 nm for red Begonia semperflorens, 708–712 nm for pink Begonia semperflorens, and 674–714 nm for Buddleja japonica; two small maxima, at 510–590 nm and 714 nm, were present in the spectra of the extracts of Chrysanthemum petals (Table S3).
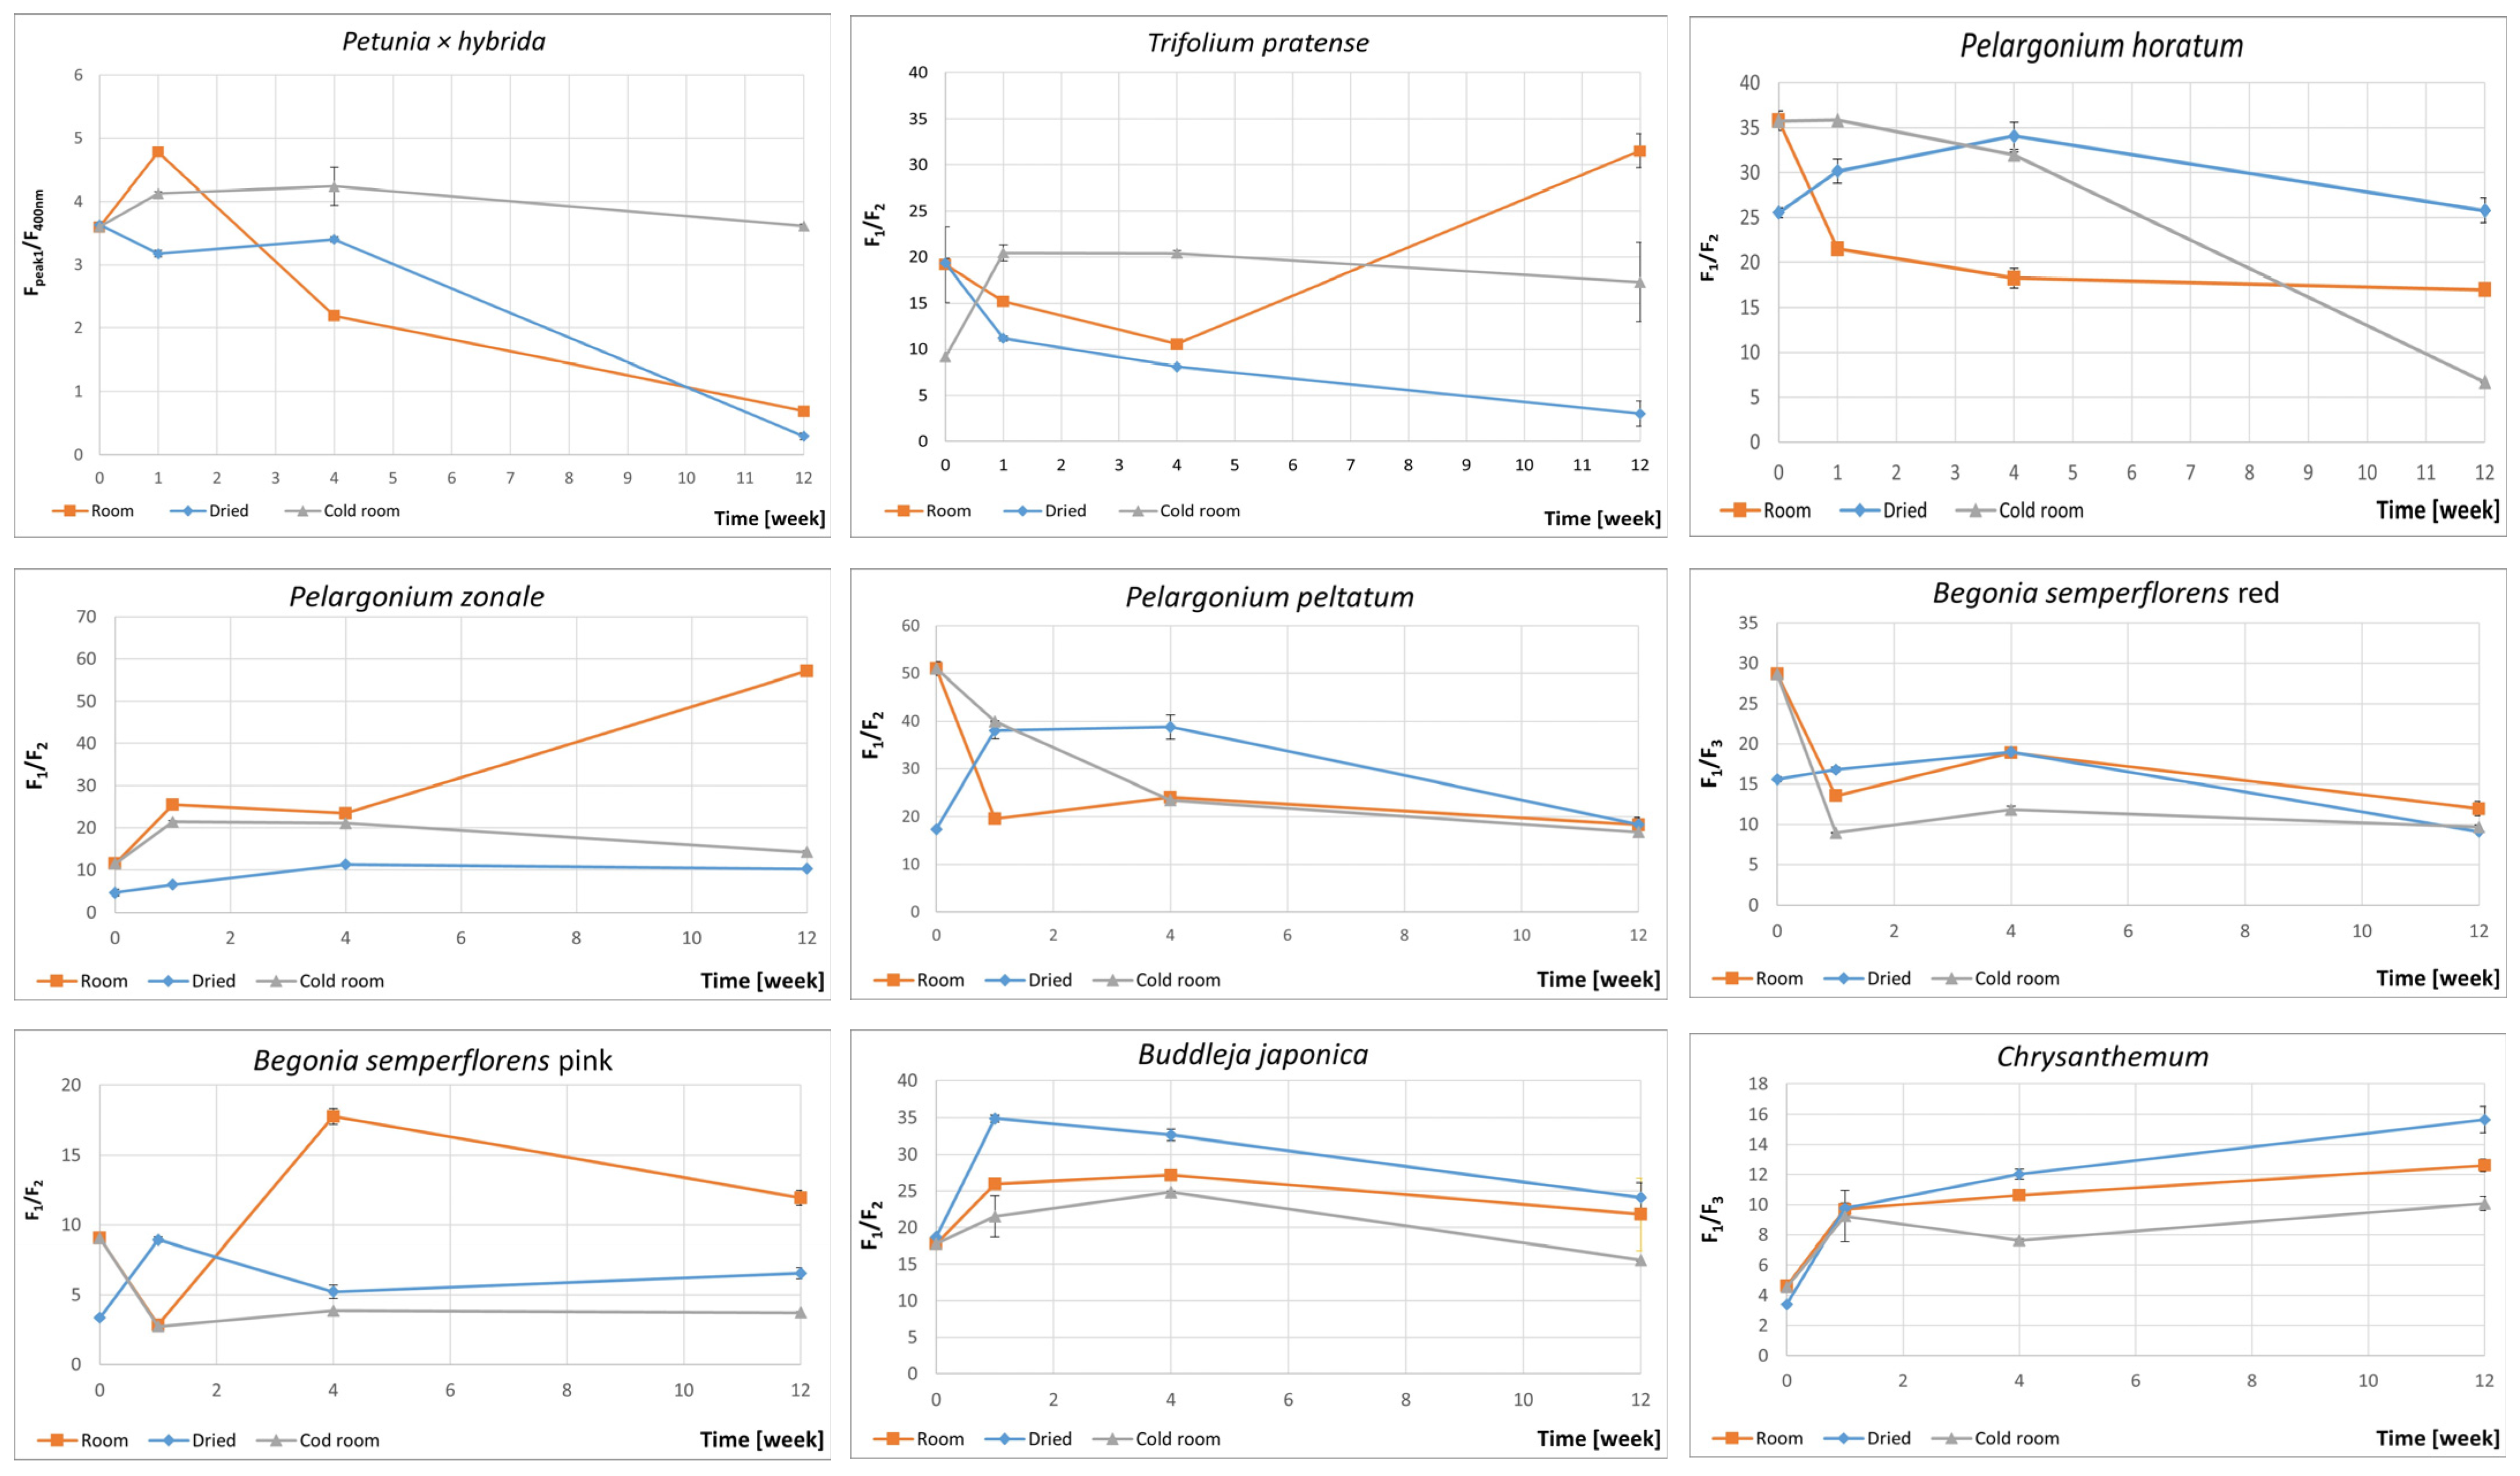
No consistent pattern was observed for the changes in the fluorescence intensity ratio at the emission maxima during incubation for the extracts of Trifolium pratense and pink Begonia semperflorens (Figure 4). In the case of the extracts of Petunia × hybrida, an initial increase in the peak fluorescence intensity ratio to that at 400 nm was followed by a decrease in the extracts of petals stored at cold-room and room temperatures; this ratio decreased in the extracts of dried petals during incubation. For Pelargonium horatum, the intensity ratio decreased in the extracts of petals incubated at cold-room and room temperatures but increased in the extracts of dried petals during incubation. For Pelargonium zonale and Chrysanthemum, the intensity ratio increased during storage. For Buddleja japonica, an initial increase in the ratio of fluorescence intensities was followed by a decrease for longer storage time(s). For Pelargonium peltatum and red Begonia semperflorens, the fluorescence intensity ratio decreased in the extracts of petals stored at cold-room and room temperatures, and increased in the extracts of dried petals.

3.3.4. Emission Spectra Measured at the Excitation Wavelength of 460 nm

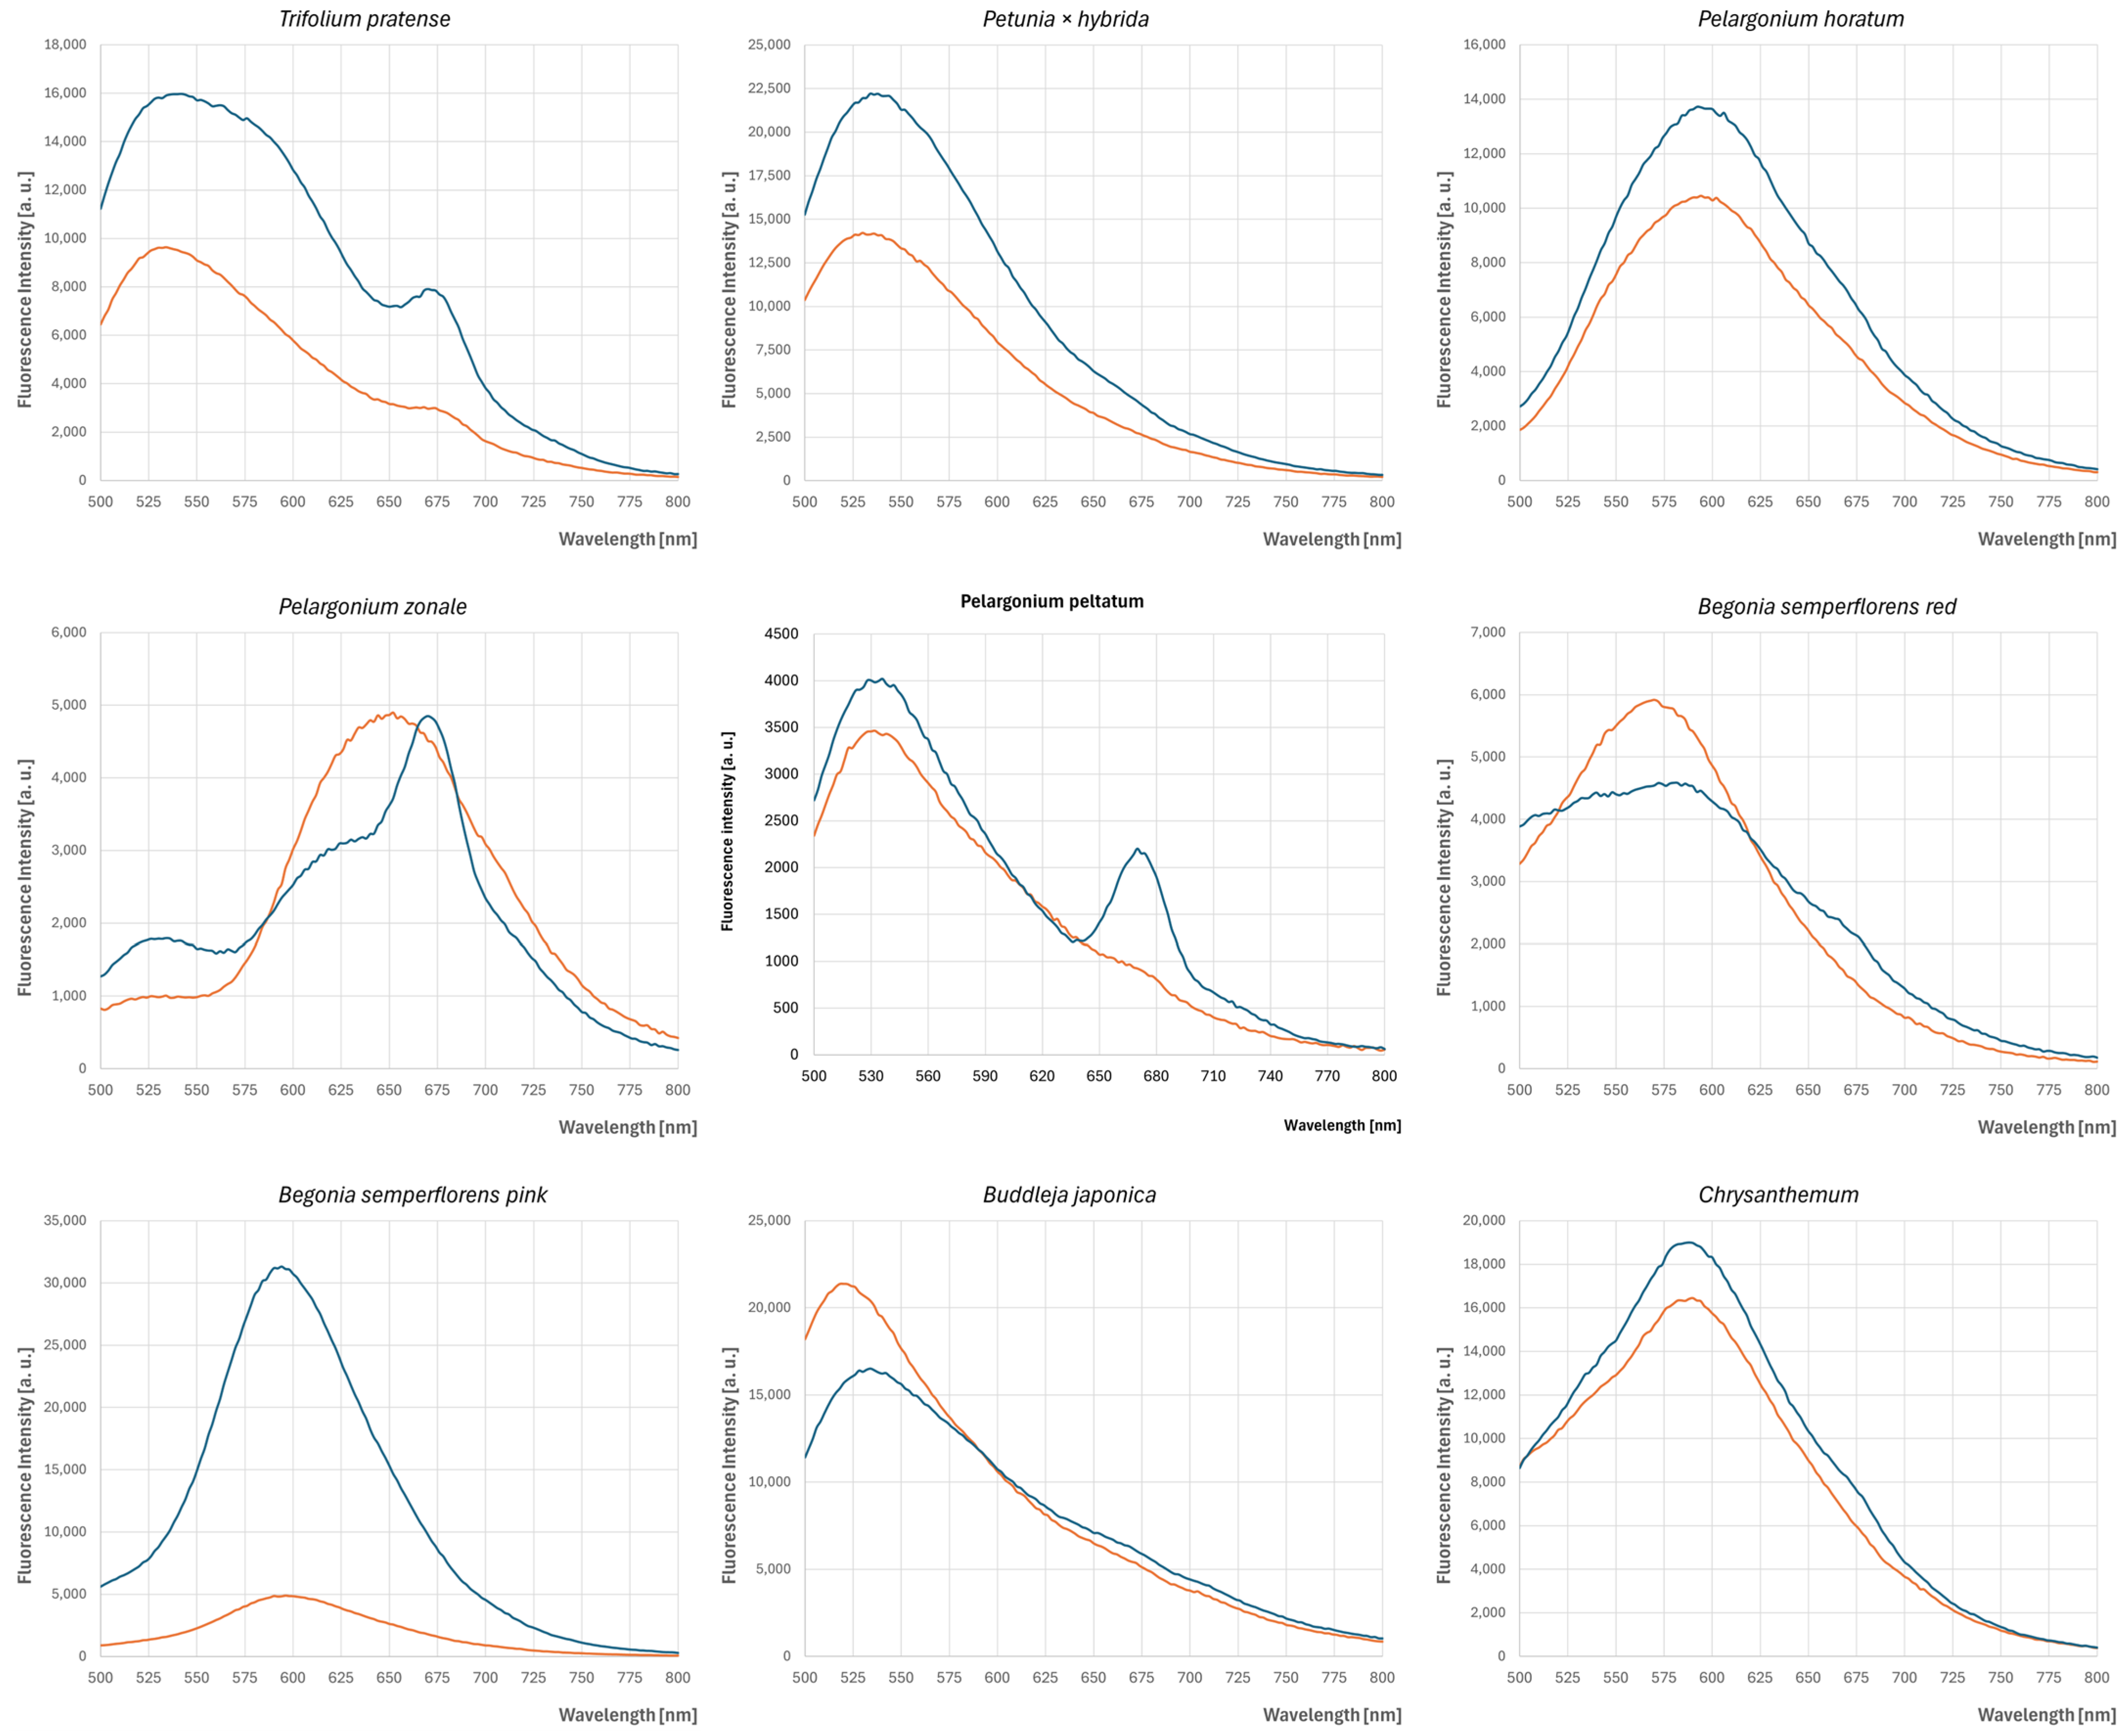
The fluorescence emission spectra of the petal extracts at the excitation wavelength of 350 nm are presented in Figure 5. In all cases, the main maximum of emission was observed, located at 528–543 nm for Trifolium pratense, 531–543 nm for Petunia × hybrida, 520–592 nm for Pelargonium horatum, 524–674 nm for Pelargonium zonale, 520–538 nm for Pelargonium peltatum, 504–512 nm for red Begonia semperflorens, 540–646 nm for pink Begonia semperflorens, 510–534 nm for Buddleja japonica, and 518–588 nm for Chrysanthemum. Hypsochromic shifts in the position of the main maximum were observed upon the storage of the dried petals of Trifolium pratense; the petals of Pelargonium horatum and Chrysanthemum; the petals of Pelargonium zonale stored at cold-room and room temperatures; and the dried petals of Pelargonium peltatum, pink Begonia semperflorens, and Buddleja japonica. Bathochromic shifts were observed for the petals of Buddleja japonica stored at cold-room and room temperatures.
Additional emission peaks were observed in the spectra of the extracts of Trifolium pratense (at 666–680 nm), Petunia × hybrida (at 574—674 nm), Pelargonium peltatum (at 662–680 nm), and red Begonia semperflorens (at 532–584 nm). No systematic shifts in the positions of the second maxima were found (Table S4).
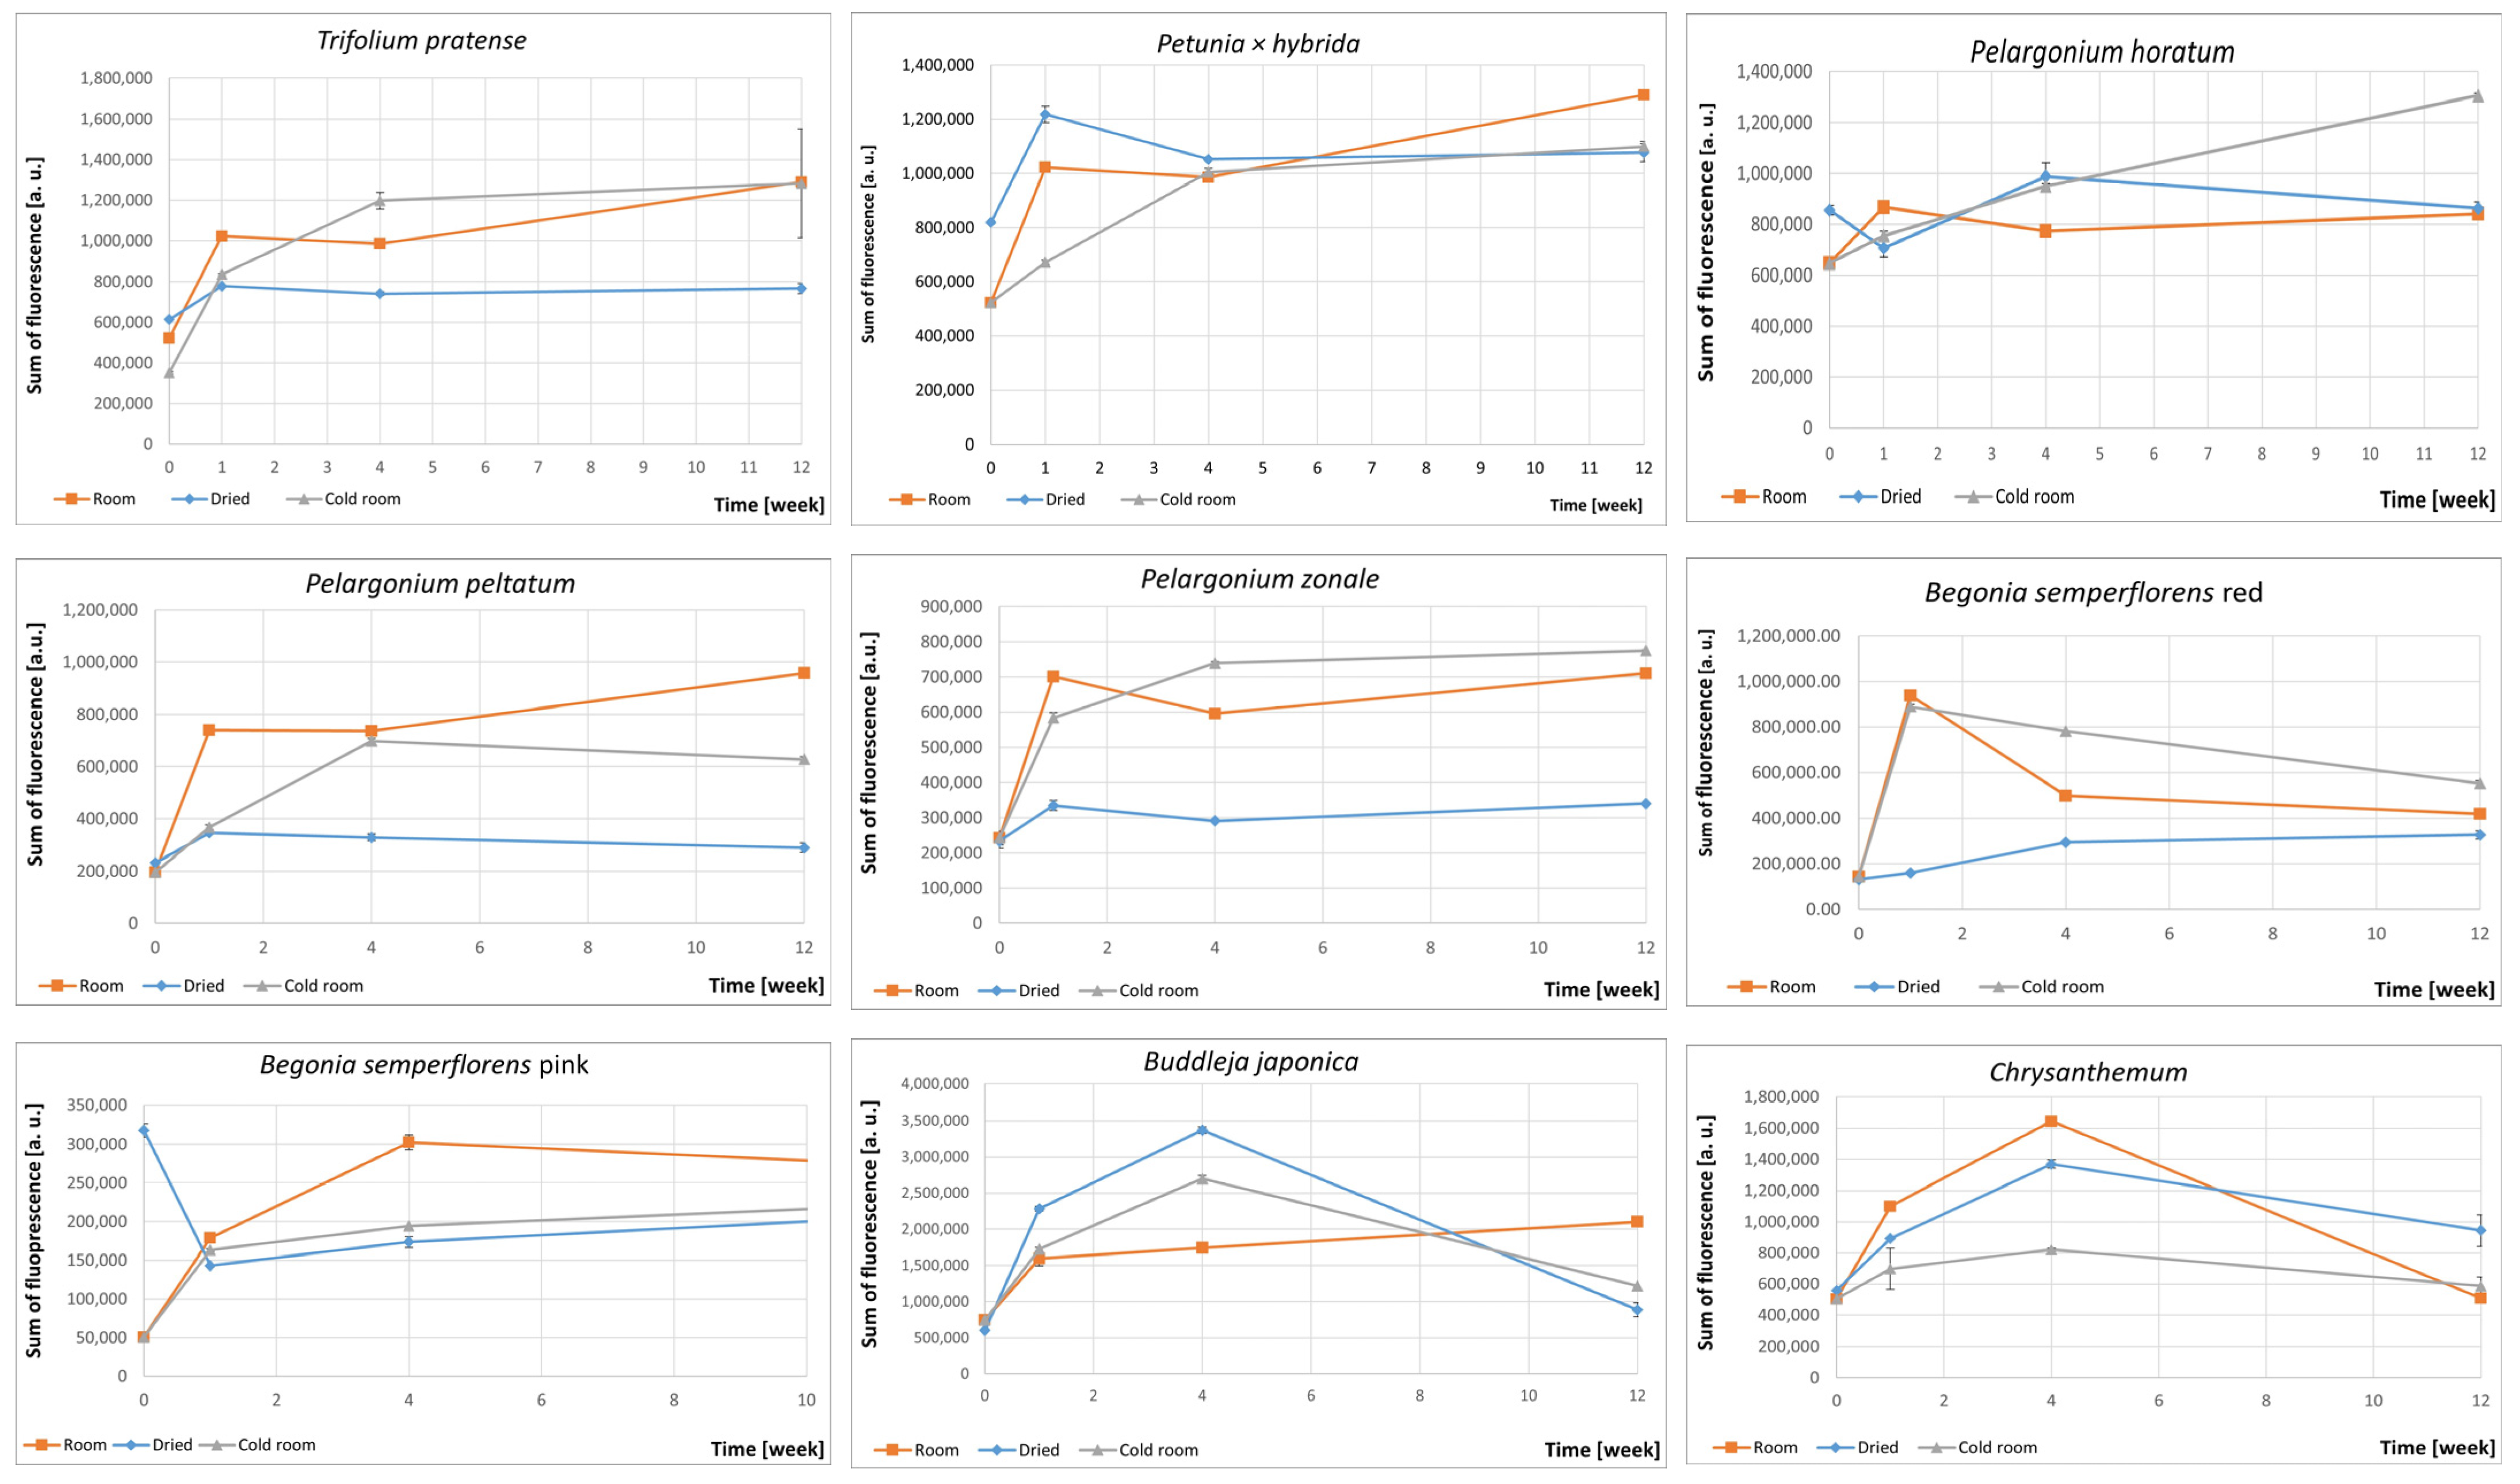
In most cases, the sum of fluorescence intensities increased with increasing storage time, although there were some exceptions. An initial decrease in the sum of fluorescence intensities was observed for the petals of Chrysanthemum, the dried petals of Buddleja japonica, and the petals of Buddleja stored at a cold-room temperature after 12 weeks of storage, as well as for the dried and stored-at-room-temperature petals of red Begonia semperflorens starting from 4 weeks; in pink Begonia semperflorens, an initial decrease followed by a gradual increase was seen for dried petals and petals stored at a cold-room temperature (Figure 6).

4. Discussion

In this study, the fluorescence of anthocyanins in the petals of several autumn flowers, owing their color to anthocyanins, was compared in fresh petals and in the extracts of petals stored under different conditions for up to 12 weeks. The extracts were prepared in a buffer of pH 5.0, to imitate conditions prevailing within vacuoles. Changes in pH would alter the spectra of anthocyanins [33,34].
The presence of complex mixtures of anthocyanidins in plants and their flowers [18,19,20,21,22,23,24,25,26,27,28,29,30,31] and the similarity of the absorption and fluorescence spectra of pure anthocyanidins (manuscript in preparation) do not allow for the estimation of anthocyanidin composition based on the spectral analysis of petals or their extracts. However, the present results demonstrate that it is possible to distinguish between the petals of various flowers from their absorption spectra. A comparison of the absorption spectra of petal extracts may be useful for the rapid confirmation of plant species identification.
Absorbance at the maxima of petal extracts incubated at a cold-room temperature showed a regular decrease in most cases but not in the petals of Petunia × hybrida, Pelargonium horatum, and Pelargonium zonale. The decrease in absorbance is apparently due to the degradation of anthocyanins. Another possible reason, i.e., a decreased extractability of anthocyanins due to their association with insoluble components of the homogenate, could also be taken into account.
Some changes in the parameters of fluorescence spectra were not directional and therefore not useful for the evaluation of the freshness of petals or petal-based products. Decreases in fluorescence intensity were apparently due to anthocyanin degradation, while increases in fluorescence intensity and shifts in the positions of maxima were most probably due to the formation of transformation and degradation products. However, in many cases, the estimated parameters showed a progressive change during storage, enabling, in principle, the estimation of the time of storage. We have previously reported that the oxidation of anthocyanidins and anthocyanins is accompanied by the appearance of a new fluorescence band of maximal fluorescence in the range of 520–530 nm when excited at 460 nm [32]. This phenomenon seems to be a general property of these compounds, as we observed it for the six most common anthocyanidins and anthocyanins containing them (unpublished). The products responsible for this fluorescence are being identified. In petal extracts, this band often merged with the peaks present originally in a neighboring region; therefore, we measured the sum of fluorescence intensities in the range of 500–580 nm or even broader to encompass the entire peaks. We observed an increase in the sum of fluorescence intensities for this region, with minor exceptions: in Pelargonium horatum and Begonia semperflorens extracts, the intensity of this band decreased after 1 week in the extracts of dried petals, while in the extracts of Buddleja japonica and Chrysanthemum, a decrease in the sum of fluorescence intensities in this band from elevated values was seen after 12 weeks, apparently due to anthocyanin degradation.
The difference between the fluorescence spectra of whole petals and petal extracts (Figure 2 vs. Figure 3 and Figure 5) is noteworthy. While the emission spectra of whole petals and their extracts at the excitation wavelength of 350 nm were generally similar (Figure 2 vs. Figure 3), there were significant differences between the emission spectra obtained at the excitation wavelength of 460 nm (Figure 2 vs. Figure 4). While the main maxima of the spectra of petals were above 600 nm, most often about 680 nm, the main maxima of the spectra of the majority of petal extracts were in the range of 500–600 nm (Table 2 and Table S4). There may be several reasons for such differences. One could lie in the effects of the matrix on fluorescence. Such effects are known for other compounds [35], but we were unable to find data documenting such strong matrix effects on anthocyanin fluorescence. Another reason for these differences may be the fact that front-face fluorescence spectra were determined, which are dependent on the fluorescence of the surface layer of the petals, while the petal extracts contained anthocyanins from whole petals. However, it is not likely that the composition and properties of anthocyanins are very different in the surface layers and inside petals. The most probable explanation is that some oxidation of anthocyanins already occurs during the preparation of extracts after cell disruption and the dilution of their content. The emission maxima in the range of 500–600 nm may already represent the fluorescent oxidation product. Isolated anthocyanins are unstable and prone to degradation, including oxidation, which limits their applications [36,37]. The concentration of this product increases during storage of the petals, so the extracts of stored petals have a higher content of anthocyanin oxidation products. Cell sap pH was found to increase in the senescent petals of groundcover rose (Rosa ×·hybrida) [38]; the oxidation of anthocyanidins and anthocyanins increases with increasing pH [32,39].
The sum of fluorescence intensities within a fluorescence band, a parameter more reliable than fluorescence intensity at a single wavelength (less affected by the measurement noise), is still not ideal. It may be useful in studies of a defined sample, measured after different incubation times under different conditions, since it may be compared with the initial, reference value. However, the degradation of anthocyanins occurs during storage, which coincides with the increase in oxidation-dependent fluorescence. To evaluate the state of a sample of unknown initial value, with different anthocyanin concentrations, a ratiometric parameter independent of the anthocyanin concentration in the studied material and the efficiency of extraction, like the ratio of fluorescence intensities at two maxima or a ratio of the maximal fluorescence intensity to that at an arbitrarily chosen wavelength, would be much more useful.
The present results demonstrate that the study of the absorption properties of petal extracts may be useful in herbalism or forensic analysis, enabling species differentiation on the basis of preserved fragments of plant material. The analysis of the fluorescence spectra of such extracts may provide additional and often more discriminative opportunities in this respect. The evaluation of the extent of freshness of petals may also be useful both in forensics and the food industry when flowers are used as a raw material. Measurements of the fluorescence spectra of whole petals or their fragments with a front-phase fluorimeter or plate reader may be especially useful, due to their simplicity.

5. Conclusions

The absorption and, especially, fluorescence spectra of extracts of anthocyanin-containing petals of nine autumn flowers exhibited differences that may allow for species identification. Changes in the absorbance and fluorescence spectra of the extracts of petals stored under various conditions for up to 12 weeks showed species-specific changes dependent on incubation conditions. The sum of fluorescence intensities in a band typical for anthocyanin oxidation (500–580 nm for the excitation wavelength of 460 nm) increased in most cases during storage, demonstrating anthocyanin oxidation during storage. These results point to the possibility of confirming species identity and estimating the freshness of petals based on the analysis of fluorescence of petal fragments and extracts, potentially useful in herbalism, forensics, and the food industry.

Supplementary Materials

The following supporting information can be downloaded at: https://www.mdpi.com/article/10.3390/pr13061826/s1, Figure S1: Excitation spectra of petal extracts of selected flowers. Emission wavelength: 460 nm; Figure S2: Effect of storage time of fresh petals at room temperature and cold room temperature, and of dried petals on the selected parameters of the fluorescence excitation spectra of their extracts (emission measured at 460 nm). Sums of fluorescence calculated in the range of 290–330 nm (T. ptarense), 340–380 nm (Petunia, P. horatum, and P. peltatum), 310–380 nm (P. zonale and and B. semperflorens red and Chrysanthemum) or 270–340 nm (B. semperflorens pink); Figure S3: Excitation spectra of petal extracts of selected flowers measured at the emission wavelength: 680 nm; Figure S4: Effect of storage time of fresh petals at room temperature and cold room temperature, and of dried petals on the selected parameters of the fluorescence excitation spectra of their extracts (emission measured at 680 nm). Sum of fluorescence intensities calculated for the wavelength range of 390 and 440 nm (T. pratense, Petunia), 380–580 nm (B. semperflorens red and pink, Buddleja japonica), or 390–590 nm (Chrysanthemum); Table S1: Positions of excitation maxima [nm] in the excitation spectra for the emission wavelength of 460 nm of extracts of petals of selected flowers stored at cold room and room temperatures, and of stored dried petals; Table S2: Positions of excitation maxima [nm] in the excitation spectra for the emission wavelength of 680 nm of extracts of petals of selected flowers stored at cold room and room temperatures, and of stored dried petals; Table S3: Positions of emission maxima [nm] in the emission spectra for the excitation wavelength of 350 nm of extracts of petals of selected flowers stored at cold room and room temperatures, and of stored dried petals; Table S4: Positions of emission maxima [nm] in the emission spectra for the excitation wavelength of 460 nm of extracts of petals of selected flowers stored at cold room and room temperatures, and of stored dried petals.

Author Contributions

Conceptualization, I.S.-B. and K.K.; methodology, I.S.-B. and K.K.; investigation, K.K. and I.S.-B.; resources, I.S.-B. and K.K.; writing—original draft preparation, I.S.-B., G.B. and K.K.; writing—review and editing, I.S.-B. and G.B.; supervision, I.S.-B.; project administration, I.S.-B.; funding acquisition, I.S.-B. All authors have read and agreed to the published version of the manuscript.

Funding

This study was performed within the project “Modification of anthocyanins/anthocyanidins as new markers of food oxidation” (number of the application 2023/51/B/NZ9/02490) financed by the National Science Centre (NCN), Poland, in the program “Opus 26”.

Data Availability Statement

Data will be available from the corresponding author upon reasonable request.

Acknowledgments

We are indebted to Edyta Bieszczad-Bedrejczuk for her technical help.

Conflicts of Interest

The authors declare no conflicts of interest.

References

  1. Quina, F.H.; Moreira, P.F., Jr.; Vautier-Giongo, C.; Rettori, D.; Rodrigues, R.F.; Freitas, A.A.; Silva, P.A.; Maçanita, A.L. Photochemistry of anthocyanins and their biological role in plant tissues. Pure Appl. Chem. 2009, 81, 1687–1694. [Google Scholar] [CrossRef]
  2. Nassour, R.; Ayash, A.; Al-Tameemi, K. Anthocyanin pigments: Structure and biological importance. J. Chem. Pharm. Sci. 2020, 13, 45–57. [Google Scholar]
  3. Tena, N.; Martín, J.; Asuero, A.G. State of the art of anthocyanins: Antioxidant activity, sources, bioavailability, and therapeutic effect in human health. Antioxidants 2020, 9, 451. [Google Scholar] [CrossRef] [PubMed]
  4. Sadowska-Bartosz, I.; Bartosz, G. Antioxidant activity of anthocyanins and anthocyanidins: A critical review. Int. J. Mol. Sci. 2024, 25, 12001. [Google Scholar] [CrossRef]
  5. Narbona, E.; del Valle, J.C.; Arista, M.; Buide, M.L.; Ortiz, P.L. Major flower pigments originate different colour signals to pollinators. Front. Ecol. Evol. 2021, 9, 743850. [Google Scholar] [CrossRef]
  6. Tenhumberg, B.; Dellinger, A.S.; Smith, S.D. Modelling pollinator and nonpollinator selection on flower colour variation. J. Ecol. 2023, 111, 746–760. [Google Scholar] [CrossRef]
  7. Iriel, A.; Lagorio, M.G. Implications of reflectance and fluorescence of Rhododendron indicum flowers in biosignaling. Photochem. Photobiol. Sci. 2010, 9, 342–348. [Google Scholar] [CrossRef]
  8. Arnold, K.E.; Owens, I.P.F.; Marshall, N.J. Fluorescent signaling in parrots. Science 2002, 295, 92. [Google Scholar] [CrossRef]
  9. Parker, A.R. Fluorescence of yellow budgerigars. Science 2002, 296, 655. [Google Scholar] [CrossRef]
  10. Winter, Y.; Lopez, J.; von Helversen, O. Ultraviolet vision in a bat. Nature 2003, 425, 612–614. [Google Scholar] [CrossRef]
  11. De Ibarra, N.H.; Vorobyev, M.; Brandt, R.; Giurfa, M. Detection of bright and dim colours by honeybees. J. Exp. Biol. 2000, 203, 3289–3298. [Google Scholar] [CrossRef] [PubMed]
  12. Gandía-Herrero, F.; Escribano, J.; García-Carmona, F. Betaxanthins as pigments responsible for visible fluorescence in flowers. Planta 2005, 222, 586–593. [Google Scholar] [CrossRef] [PubMed]
  13. Kurup, R.; Johnson, A.J.; Sankar, S.; Hussain, A.A.; Kumar, C.S.; Sabulal, B. Fluorescent prey traps in carnivorous plants. Plant Biol. 2013, 15, 611–615. [Google Scholar] [CrossRef] [PubMed]
  14. van der Kooi, C.J.; Dyer, A.G.; Kevan, P.G.; Lunau, K. Functional significance of the optical properties of flowers for visual signalling. Ann. Bot. 2019, 123, 263–276. [Google Scholar] [CrossRef] [PubMed]
  15. Iriel, A.; Lagorio, M.G. Is the flower fluorescence relevant in biocommunication? Naturwissenschaften 2010, 97, 915–924. [Google Scholar] [CrossRef]
  16. Figueiredo, P.; Pina, F. Fluorescence spectra and decays of malvidin 3, 5-diglucoside in aqueous solutions. J. Photochem. Photobiol. A Chem. 1990, 52, 411–424. [Google Scholar] [CrossRef]
  17. Pina, F.; Melo, M.J.; Santos, H.; Lima, J.C.; Abreu, I.; Ballardini, R.; Maestri, M. Excited state proton transfer in synthetic flavylium salts: 4-methyl-7-hydroxyflavylium and 4′, 7-dihydroxyflavylium. Example of a four-level molecular device to invert the population of the excited state. New J. Chem. 1998, 22, 1093–1098. [Google Scholar] [CrossRef]
  18. Lee, S.G.; Brownmiller, C.R.; Lee, S.O.; Kang, H.W. Anti-inflammatory and antioxidant effects of anthocyanins of Trifolium pratense (red clover) in lipopolysaccharide-stimulated RAW-267.4 macrophages. Nutrients 2020, 12, 1089. [Google Scholar] [CrossRef]
  19. Ando, T.; Tatsuzawa, F.; Saito, N.; Takahashi, M.; Tsunashima, Y.; Numajir, H.; Watanabe, H.; Kokubun, H.; Hara, R.; Seki, H.; et al. Differences in the floral anthocyanin content of red petunias and Petunia exserta. Phytochemistry 2000, 54, 495–501. [Google Scholar] [CrossRef]
  20. Albert, N.W.; Lewis, D.H.; Zhang, H.; Irving, L.J.; Jameson, P.E.; Davies, K.M. Light-induced vegetative anthocyanin pigmentation in Petunia. J. Exp. Bot. 2009, 60, 2191–2202. [Google Scholar] [CrossRef]
  21. Mitchell, K.A.; Markham, K.R.; Boase, M.R. Pigment chemistry and colour of Pelargonium flowers. Phytochemistry 1998, 47, 355–361. [Google Scholar] [CrossRef]
  22. Fujioka, M.; Kato, M.; Kakihara, F.; Tokumasu, S. Anthocyanidin composition of petals in Pelargonium× domesticum Bailey. J. Jpn. Soc. Hort. Sci. 1991, 59, 823–831. [Google Scholar] [CrossRef]
  23. Zeid, M.H.; Mekky, T.M. Extraction of anthocyanins pigments from Pelargonium zonal petals as natural colorants in some foods. J. Food Dairy Sci. 2007, 32, 1159–1164. [Google Scholar] [CrossRef]
  24. Chirol, N.; Jay, M. Acylated anthocyanins from flowers of Begonia. Phytochemistry 1995, 40, 275–277. [Google Scholar] [CrossRef]
  25. Wu, Y.M.; Wu, Y.P.; Jin, X.H.; Meng, H. Effects of anthocyanin composition and distribution on flower color of Rieger begonia. CABI Abstr. 2020, 40, 58–68. [Google Scholar] [CrossRef]
  26. Madanakumar, A.J.; Kumaraswamy, M. Purified anthocyanin, its elicitation from cell cultures of Begonia malabarica and Begonia rex-cultorum ‘Baby Rainbow’ and it’s in vitro cytotoxicity Analysis by MTT Assay. Pharmacogn. J. 2018, 10, 553–558. [Google Scholar] [CrossRef]
  27. Dunn, B.L.; Lindstrom, J.T. Evaluation of a sib-mated population of Buddleja davidii ‘White Bouquet’× Buddleja indica hybrids. J. Environ. Hortic. 2009, 27, 67–69. [Google Scholar] [CrossRef]
  28. Chen, S.M.; Li, C.H.; Zhu, X.R.; Deng, Y.M.; Sun, W.; Wang, L.S.; Chen, F.D.; Zhang, Z. The identification of flavonoids and the expression of genes of anthocyanin biosynthesis in the chrysanthemum flowers. Biol. Plant. 2012, 56, 458–464. [Google Scholar] [CrossRef]
  29. Hong, Y.; Tang, X.; Huang, H.; Zhang, Y.; Dai, S. Transcriptomic analyses reveal species-specific light-induced anthocyanin biosynthesis in chrysanthemum. BMC Genom. 2015, 16, 202. [Google Scholar] [CrossRef]
  30. Mekapogu, M.; Vasamsetti, B.M.K.; Kwon, O.K.; Ahn, M.S.; Lim, S.H.; Jung, J.A. Anthocyanins in floral colors: Biosynthesis and regulation in chrysanthemum flowers. Int. J. Mol. Sci. 2020, 21, 6537. [Google Scholar] [CrossRef]
  31. Park, C.H.; Chae, S.C.; Park, S.Y.; Kim, J.K.; Kim, Y.J.; Chung, S.O.; Arasu, M.V.; Al-Dhabi, N.A.; Park, S.U. Anthocyanin and carotenoid contents in different cultivars of chrysanthemum (Dendranthema grandiflorum Ramat.) flower. Molecules 2015, 20, 11090–11102. [Google Scholar] [CrossRef] [PubMed]
  32. Bartosz, G.; Grzesik-Pietrasiewicz, M.; Sadowska-Bartosz, I. Fluorescent products of anthocyanidin and anthocyanin oxidation. J. Agric. Food Chem. 2020, 68, 12019–12027. [Google Scholar] [CrossRef] [PubMed]
  33. Tang, B.; He, Y.; Liu, J.; Zhang, J.; Li, J.; Zhou, J.; Ye, Y.; Wang, J.; Wang, X. Kinetic investigation into pH-dependent color of anthocyanin and its sensing performance. Dye. Pigment. 2019, 170, 107643. [Google Scholar] [CrossRef]
  34. Stavenga, D.G.; Leertouwer, H.L.; Dudek, B.; Van der Kooi, C.J. Coloration of flowers by flavonoids and consequences of pH dependent absorption. Front. Plant Sc. 2021, 11, 600124. [Google Scholar] [CrossRef]
  35. Rodríguez, N.; Real, B.D.; Ortiz, M.C.; Sarabia, L.A.; Herrero, A. Usefulness of parallel factor analysis to handle the matrix effect in the fluorescence determination of tetracycline in whey milk. Anal. Chim. Acta 2009, 632, 42–51. [Google Scholar] [CrossRef]
  36. Zhao, Y.W.; Wang, C.K.; Huang, X.Y.; Hu, D.G. Anthocyanin stability and degradation in plants. Plant Signal. Behav. 2021, 16, 1987767. [Google Scholar] [CrossRef] [PubMed]
  37. Guo, Y.; Zhang, H.; Shao, S.; Sun, S.; Yang, D.; Lv, S. Anthocyanin: A review of plant sources, extraction, stability, content determination and modifications. Int. J. Food Sci. Technol. 2022, 57, 7573–7591. [Google Scholar] [CrossRef]
  38. Schmitzer, V.; Veberic, R.; Osterc, G.; Stampar, F. Color and phenolic content changes during flower development in groundcover rose. J. Am. Soc. Hortic. Sci. 2010, 135, 195–202. [Google Scholar] [CrossRef]
  39. Enaru, B.; Drețcanu, G.; Pop, T.D.; Stǎnilǎ, A.; Diaconeasa, Z. Anthocyanins: Factors affecting their stability and degradation. Antioxidants 2021, 10, 1967. [Google Scholar] [CrossRef]
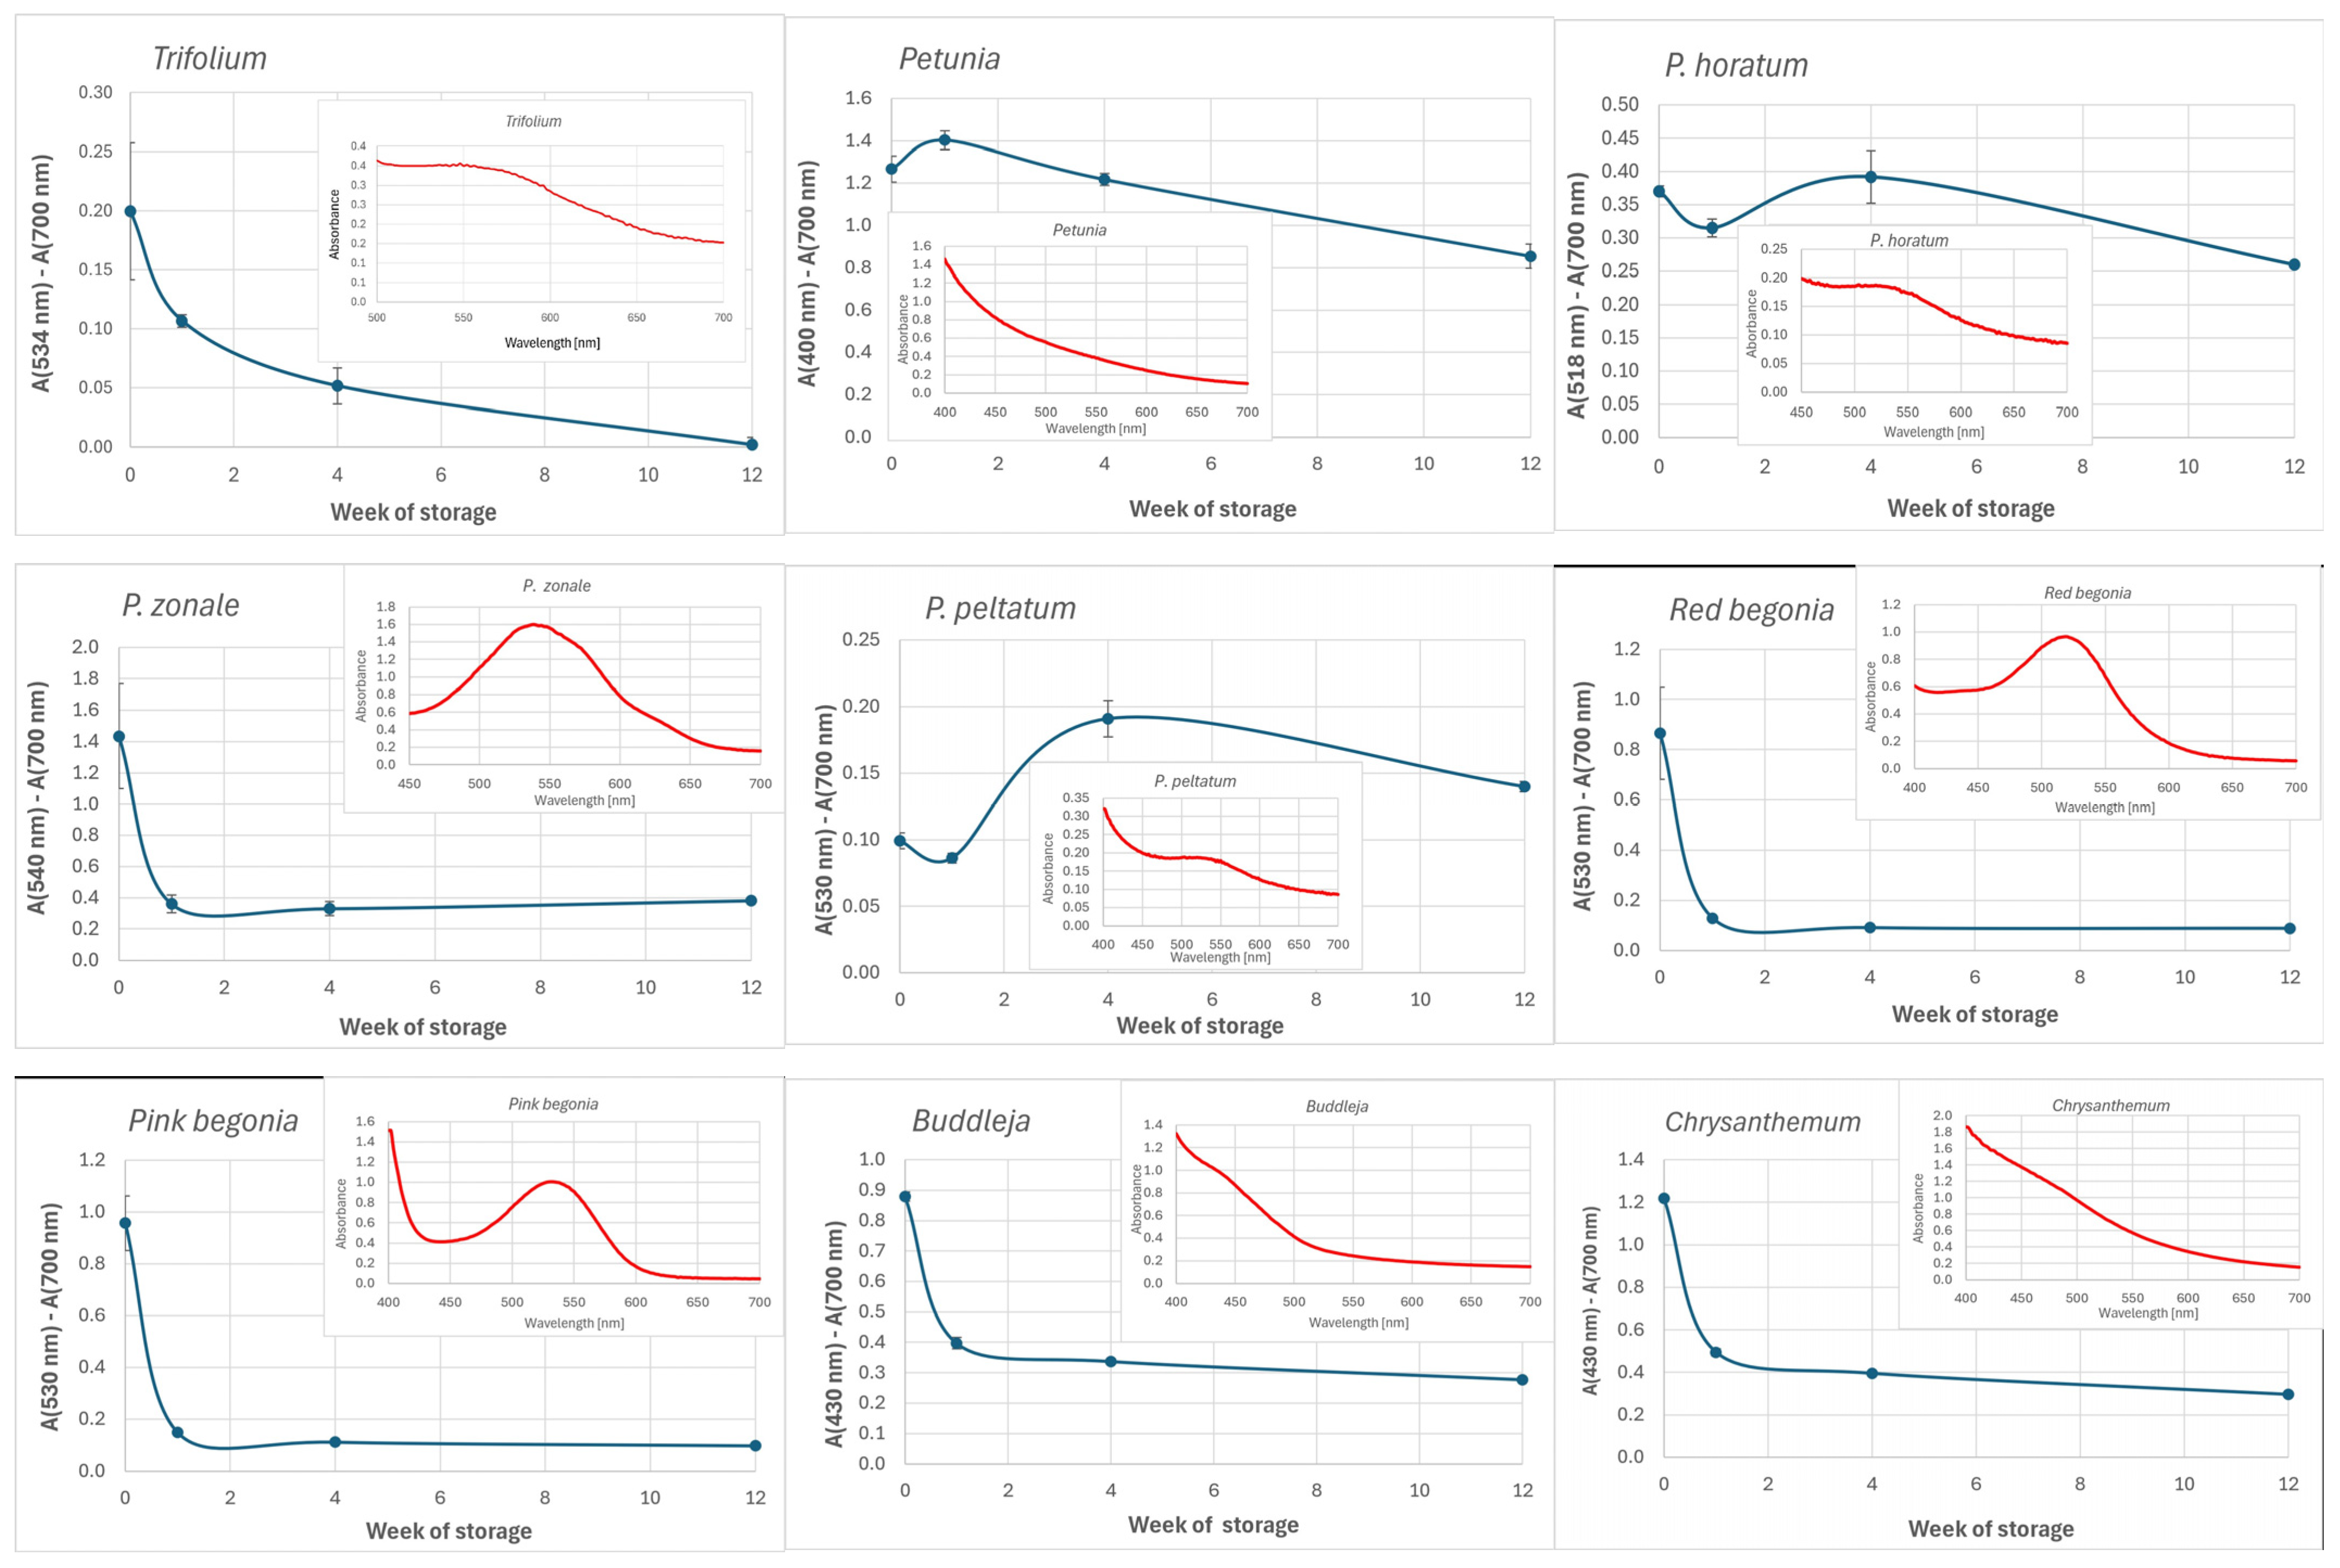
Figure 1. The effect of storage of petals at 4 °C on the selected spectral parameters of the petal extracts of selected autumn flowers. The spectra of extracts in the visible range are shown in insets. P., Pelargonium.
Processes 13 01826 g001
Figure 2. Excitation and emission fluorescence spectra of whole-petal fragments of selected flowers. P., Pelargonium.
Processes 13 01826 g002
Figure 3. The emission spectra of the petal extracts of selected flowers at the excitation wavelength of 350 nm; Processes 13 01826 i001 extract of fresh petals, Processes 13 01826 i002 extract of dried petals.
Processes 13 01826 g003
Figure 4. The effect of storage time of fresh petals at room temperature and cold-room temperature and dried petals on the selected parameters of the fluorescence emission spectra of their extracts (excitation wavelength of 350 nm).
Processes 13 01826 g004
Figure 5. Emission spectra of fresh and dried petal extracts of selected flowers at the excitation wavelength of 460 nm; Processes 13 01826 i001 extract of fresh petals, Processes 13 01826 i002 extract of dried petals.
Processes 13 01826 g005
Figure 6. The effect of storage time of fresh petals at room and cold-room temperatures and dried petals on the selected parameters of the fluorescence emission spectra of their extracts (excitation wavelength of 460 nm). The sum of fluorescence intensities was calculated in the range of 500–580 nm for Trifolium pratense, Petunia × hybrida, Buddleja japonica, and Chrysanthemum; 500–680 nm for Pelargonium horatum, Pelargonium zonale, and Pelargonium peltatum; and 500–560 nm for red and pink Begonia semperflorens.
Processes 13 01826 g006
Table 1. List of the flowers studied.
SpeciesCommon NameLocationDate of Collection
Trifolium pratenseRed cloverMedow, Dobrzechów24 October 2024
Petunia × hybridaPink petuniaPot cultivation, home garden, Dobrzechów20 October 2024
Pelargonium horatumRed geraniumPot cultivation, home garden Dobrzechów20 October 2024
Pelargonium zonalePink-red geraniumHome pot cultivation, Dobrzechów20 October 2024
Pelargonium peltatumPink ivy-leafed geraniumPot cultivation, home garden, Dobrzechów20 October 2024
Begonia semperflorensRed begoniaPot cultivation, home garden20 October 2024
Begonia semperflorensPink begoniaHome garden, Święcany27 October 2024
Buddleja japonicaBuddleiaPot cultivation, home garden, Dobrzechów19 October 2024
ChrysanthemumPurple chrysanthemumHome garden, Dobrzechów27 October 2024
Table 2. The positions of maxima [nm] in the fluorescence spectra of petals of selected flowers.
SpeciesExcitation Spectra
λem 460 nm
Excitation Spectra
λem 680 nm
Emission Spectra
λex 350 nm
Emission Spectra
λex 460 nm
Trifolium pratense242, 296326, 440444, 654520, 684
Petunia × hybrida366434412, 674596, 680
P. horatum360430604604
P. zonale358420678682
P. peltatum360434, 590-682
Red begonia324450,480610618
Pink begonia302322, 432, 538, 620624612
Buddleja japonica304, 360432, 536, 626668674
Chrysanthemum352430, 538646514, 678
P., Pelargonium.
Disclaimer/Publisher’s Note: The statements, opinions and data contained in all publications are solely those of the individual author(s) and contributor(s) and not of MDPI and/or the editor(s). MDPI and/or the editor(s) disclaim responsibility for any injury to people or property resulting from any ideas, methods, instructions or products referred to in the content.