Article

Mechanistic Insights into Ammonium Chloride Particle Deposition in Hydrogenation Air Coolers: Experimental and CFD-DEM Analysis

1
Institute of Flow-Induced Corrosion, Zhejiang Sci-Tech University, Hangzhou 310018, China
2
Hefei General Machinery Research Institute Co., Ltd., Hefei 230000, China
3
Sinopec Guangzhou Engineering Co., Ltd., Guangzhou 510000, China
*
Author to whom correspondence should be addressed.
Processes 2025, 13(6), 1816; https://doi.org/10.3390/pr13061816
Submission received: 6 May 2025 / Revised: 31 May 2025 / Accepted: 2 June 2025 / Published: 8 June 2025
(This article belongs to the Section Particle Processes)

Abstract

The operational reliability of industrial cooling systems is critically compromised by the crystallization of ammonium chloride (NH4Cl) in the terminal sections of heat exchangers and at air-cooler inlets. This study systematically investigated the deposition characteristics of NH4Cl particles in hydrogenation air coolers, along with the factors influencing this process, using a combination of experimental analyses and CFD-DEM coupled simulations. Numerical simulations indicated that gas velocity is the primary factor that governs the NH4Cl deposition behavior, whereas the NH4Cl particle size significantly affects the deposition propensity. Under turbulent conditions, larger particles (>300 μm) exhibit a greater deposition tendency due to increased inertial effects. A power-law equation (R2 > 0.75) fitted to the experimental data effectively predicts the variations in the deposition rates across tube bundles. This study offers a theoretical foundation and predictive framework for optimizing anti-clogging design and maintenance strategies in industrial air coolers.

1. Introduction

Ammonium chloride (NH4Cl) is an acidic inorganic salt that is commonly used as a buffer to control pH in various chemical and commercial applications [1], as well as in fertilizers [2]. When used as a fertilizer, it provides nitrogen to plants and strengthens the soil structure. In addition, it plays a crucial role in increasing proton conductivity [3]. In the food industry, NH4Cl is used as a flavoring agent. In many countries, due to increasing incidences of cardiovascular and cerebrovascular diseases, such as hypertension, food manufacturers have begun substituting sodium chloride with NH4Cl. However, NH4Cl is also known as a localized destructive corrosive agent in the petroleum refining industry [4], where it poses a serious threat to the integrity of equipment such as hydrogenation units and jeopardizes the safety of the refining process. This latent form of corrosion causes severe fouling, negatively affecting the operational reliability of various treatment units [5].
The main form of corrosion caused by NH4Cl is high-intensity localized corrosion [6,7,8]. When NH4Cl salt is deposited on a metal surface, pitting corrosion often occurs, particularly in environments with minimal or no free water phase. Through in situ experiments, Li et al. [9] showed that the mass transfer at the corrosion interface is affected by the hygroscopicity of ammonium salts. Surface characterization revealed that corrosion was more severe under supersaturated humidity conditions. Jin et al. [10] experimentally determined the stress conditions of NH4Cl particles in an air cooler and used endoscopic imaging to capture the deposition morphology within tube bundles. Vainio et al. [11] experimentally demonstrated that maintaining the material temperature above the water absorption temperature of NH4Cl can prevent severe corrosion of carbon steel. Liu et al. [12] studied the corrosion mechanism of Q345R steel under the flow of a water–oil two-phase system consisting of HCl and NH4Cl, and evaluated the corrosion rate and characteristics of Q345R steel by different corrosive media through weight loss and electrochemical measurements. Xing et al. [13] experimentally studied the heat-transfer characteristics of heat-exchange tubes scaled by NH4Cl crystals, analyzing the effects of the fluid velocity, temperature, and mass flow rate on both the overall and local heat-transfer performance.
The dynamic behavior of solid particles in a gas–solid two-phase flow is significantly affected by fluid–particle interaction forces and particle–particle or particle–wall collisions. These forces include drag, virtual mass, Bassett, Safman, and Magnus forces [14,15,16], with drag being the dominant force affecting particle motion in the flow field [17]. Previous studies have demonstrated that the dynamic behavior of gas–solid systems can be simulated using CFD-DEM [18,19,20]. In these simulations, the discrete element method [21] is used to track the motion of individual particles, representing the solid phase. Two principal collision models are employed: the hard-sphere model, which assumes no deformation during collision and is suitable for dilute particle flow [22,23]; and the soft-sphere model, which allows slight particle overlap to account for particle deformation and is preferable for simulating transport and accumulation phenomena [24]. CFD algorithms are commonly used to simulate the flow field of a continuous liquid phase. For non-spherical particles, Wang et al. [25] explored how the surface gas velocity, particle count, and particle shape affect fluidization behavior, providing comprehensive insights into bubbles, dynamics, particle movement, and their interactions. Zhang et al. [26] used experimental visualization, CFD, and DEM methods to study particle movement and deposition in a piping system equipped with simultaneously designed grooves and baffles.
Here, we present a novel investigation into NH4Cl particle deposition within tube bundles of air coolers. To address the limitations of current research, such as the lack of comprehensive multi-parameter coupling simulation analyses of NH4Cl deposition mechanisms and insufficient experimental validation, this study employed the CFD-DEM method, which integrates fluid dynamics and discrete particle tracking, to analyze the deposition behavior of NH4Cl particles. A dynamic particle deposition prediction model for gas–solid two-phase flow was established and validated using a visualization-based experimental platform. Orthogonal experimental data were fitted with mathematical equations, thereby enhancing the generalizability of the results. A power-law equation (R2 > 0.75) fitted to the experimental data effectively predicted the variations in NH4Cl deposition rates across tube bundles. This study provides a new theoretical foundation and a precise predictive tool for the anti-clogging design of air coolers in refining units.

2. Simulation Methods

2.1. Governing Equations for Particle Models (DEM)

2.1.1. Particle Motion

In the DEM framework, the velocity and acceleration of particles are determined based on Newton’s second law, which governs both translational and rotational motions [27]. The governing equations for particle translation and rotation are as follows:
m p d v p d t = F c + F f p + m p g ,
I p d ω p d t = T c + T f p ,
where mp is the particle mass (kg); g is the gravitational acceleration (m/s2); vp is the particle translation velocity (m/s); Fc is the interaction force (N) between the particles and between the particles and the walls (N); Ff→p is the force (N) exerted by the fluid on the particle; Ip is the moment of inertia (kg·m2); ωp is the unit angular velocity vector of the particle at the contact point position (rad/s); Tc is the tangential force (N) between the particles or between the particles and the walls causing rotation; and Tf→p is the additional torque (kg·m2·s−2) due to the velocity gradient of the fluid.

2.1.2. Contact Force Models

This study considered the deposition and adhesion behaviors of NH4Cl particles within the air-cooler tube bundle under increasing temperature conditions. Adhesion between cohesive particles and between the particles and the walls was considered. Johnson, Kendall, and Roberts [28] modified the Hertzian contact model to include the effects of attractive forces (adhesion) between two attractive bodies. This model accounts for the influence of van der Waals forces within the contact zone, allowing the design of strongly adhesive systems, such as dry powders and moist materials. Therefore, this study combined the Hertz–Mindlin model with the Johnson–Kendall–Roberts model to describe the contact forces between the particles and between the particles and the pipeline wall. Specific contact force calculations were performed as follows. The contact force Fc consists of normal and tangential components (Fc,n, Fc,t), as shown in the following equation:
F c = F c , n + F c , t ,
(1)
Normal force
The normal force based on the combined Hertz–Mindlin and JKR model [28,29,30] is expressed using Equation (4). A soft-sphere model was adopted to better simulate particle accumulation and collision processes; δn represents the deformations (overlap) obtained via Equation (5):
F c , n = 4 π γ E α 3 / 2 + 4 E α 3 / 3 R ,
δ n = α 2 / R 4 π γ α / E ,
where γ is the surface energy, E* is the equivalent Young’s modulus calculated using Equation (6), R* is the equivalent particle radius calculated using Equation (7), and α is the contact half-width. The corresponding equations are as follows:
1 E = 1 v 1 2 E 1 + 1 v 2 2 E 2 ,
1 R = 1 R 1 + 1 R 2 ,
where E1 and E2 denote the elastic moduli of the two contacting particles; v1 and v2 are the Poisson’s ratios of the two contacting particles; and R1 and R2 denote the radii of the two spherical particles in contact.
The normal damping force Fc,nd was calculated using Equations (8)–(10).
F c , n       d = 2 5 6 β S n m u n       r e l ,
β = ln e ln 2 e + π 2 ,
S n = 2 E R δ n ,
where m* is the equivalent mass, unrel is the relative velocity component in the normal direction, β is the coefficient, Sn is the normal stiffness, and e is the recovery factor.
(2)
Tangential force
The tangential force between the particles was calculated using the tangential stiffness (St) and tangential overlap (δt), as expressed by Equations (11)–(13):
F c , t = S t δ t ,
S t = 8 G R δ n ,
δ t = u c t d τ ,
where G* is the equivalent shear modulus, and uct is the relative velocity of the contact point in the tangential direction. The tangential damping force, Ftd, was obtained using Equation (14):
F c , t       d = 2 5 6 β S t m u t       r e l ,
where utrel is the relative tangential velocity.
The rolling friction τp in the tangential direction was also considered during the simulation and calculated according to the normal force on the contact surface using the standard rolling friction model, which can be expressed as
τ p = μ r F n L p ω p ,
where μr is the rolling friction coefficient, and Lp is the distance from the centroid of the particle to the contact point.

2.2. Governing Equations for Fluid Models (CFD)

The air cooler analyzed in this study involved heat transfer and multi-field coupling, and the working fluid was treated as incompressible. The continuity and momentum equations for incompressible fluid are as follows:
ρ t + ( ρ υ ) = 0 ,
t ( ρ υ ) + ( ρ υ υ ) = p + ( τ ¯ ¯ ) + ρ g + F d ,
where ρ represents the density of the fluid, t represents time, v represents the velocity vector, τ is the simulated stress tensor, and Fd is the drag force between the fluid and the particle.
When the fluid enters the air cooler through the inlet pipe, high shear stress and eddy currents induce complex fluid movements within the tube box. Therefore, the Realizable k–ε turbulence model was adopted. This model incorporates a rotational curvature correction to improve the accuracy of flow deposition calculations for NH4Cl particles. The compressibility of the fluid was also considered. The governing equations for calculating the turbulent kinematic energy (k) and its dissipation rate (ε) are as follows:
t ( ρ k ) + x j ( ρ k u j ) = x j μ + μ t σ k k x j + G k + G b Y M ρ ε + S k ,
t ( ρ ε ) + x j ( ρ ε u j ) = x j μ + μ t σ ε ε x j + C 1 ρ E ε C 2 ρ ε 2 k + υ ε + C 1 ε k ε k C 3 ε G b + S ε ,
C 1 = m a x 0.43 , η η + 5 ,
η = S k ε ,
S = 2 S i j S i j ,
where Gk represents the turbulent kinetic energy generated by the average velocity gradient; Gb is the turbulent kinetic energy generated by buoyancy; YM represents the contribution of the pulsating expansion in compressible turbulence to the total dissipation rate; σk and σε are the turbulent Prandtl numbers of k and ε, respectively; C1 and C2 are constants; and Sk and Sε are user-defined functions.

2.3. Forces on Particles in a Flow Field

Particles suspended in a fluid experience various forces, including inertia, drag, pressure gradient, virtual mass, Magnus, and Saffman forces [29]. However, depending on the flow condition, most of these forces can be ignored. In this study, considering the particle sizes are in the range of 100–600 μm and given the significant density difference between air and NH4Cl, the influence of the virtual mass and pressure gradient forces was negligible. Consequently, drag was considered the dominant force acting on the particles. Owing to the non-uniform pressure around the particles, viscous shear was evident on the surface of the particles in contact with the fluid. Therefore, drag force (Fd), representing the momentum exchange between the fluid and the particle, was calculated using Equation (23):
F d = 1 2 C d ρ p A p u f u p ( u f u p ) ,
where Cd is the drag coefficient of the particle, and Ap is the projected area of the particle. Cd and particle Reynolds number Rep were determined using Equations (24) and (25).
C d = 24 Re p ( 1 + 0.15 Re p 0.687 ) , Re p < 1000 0.44 , Re p 1000 ,
Re p = ρ 1 u f u p d p μ f .

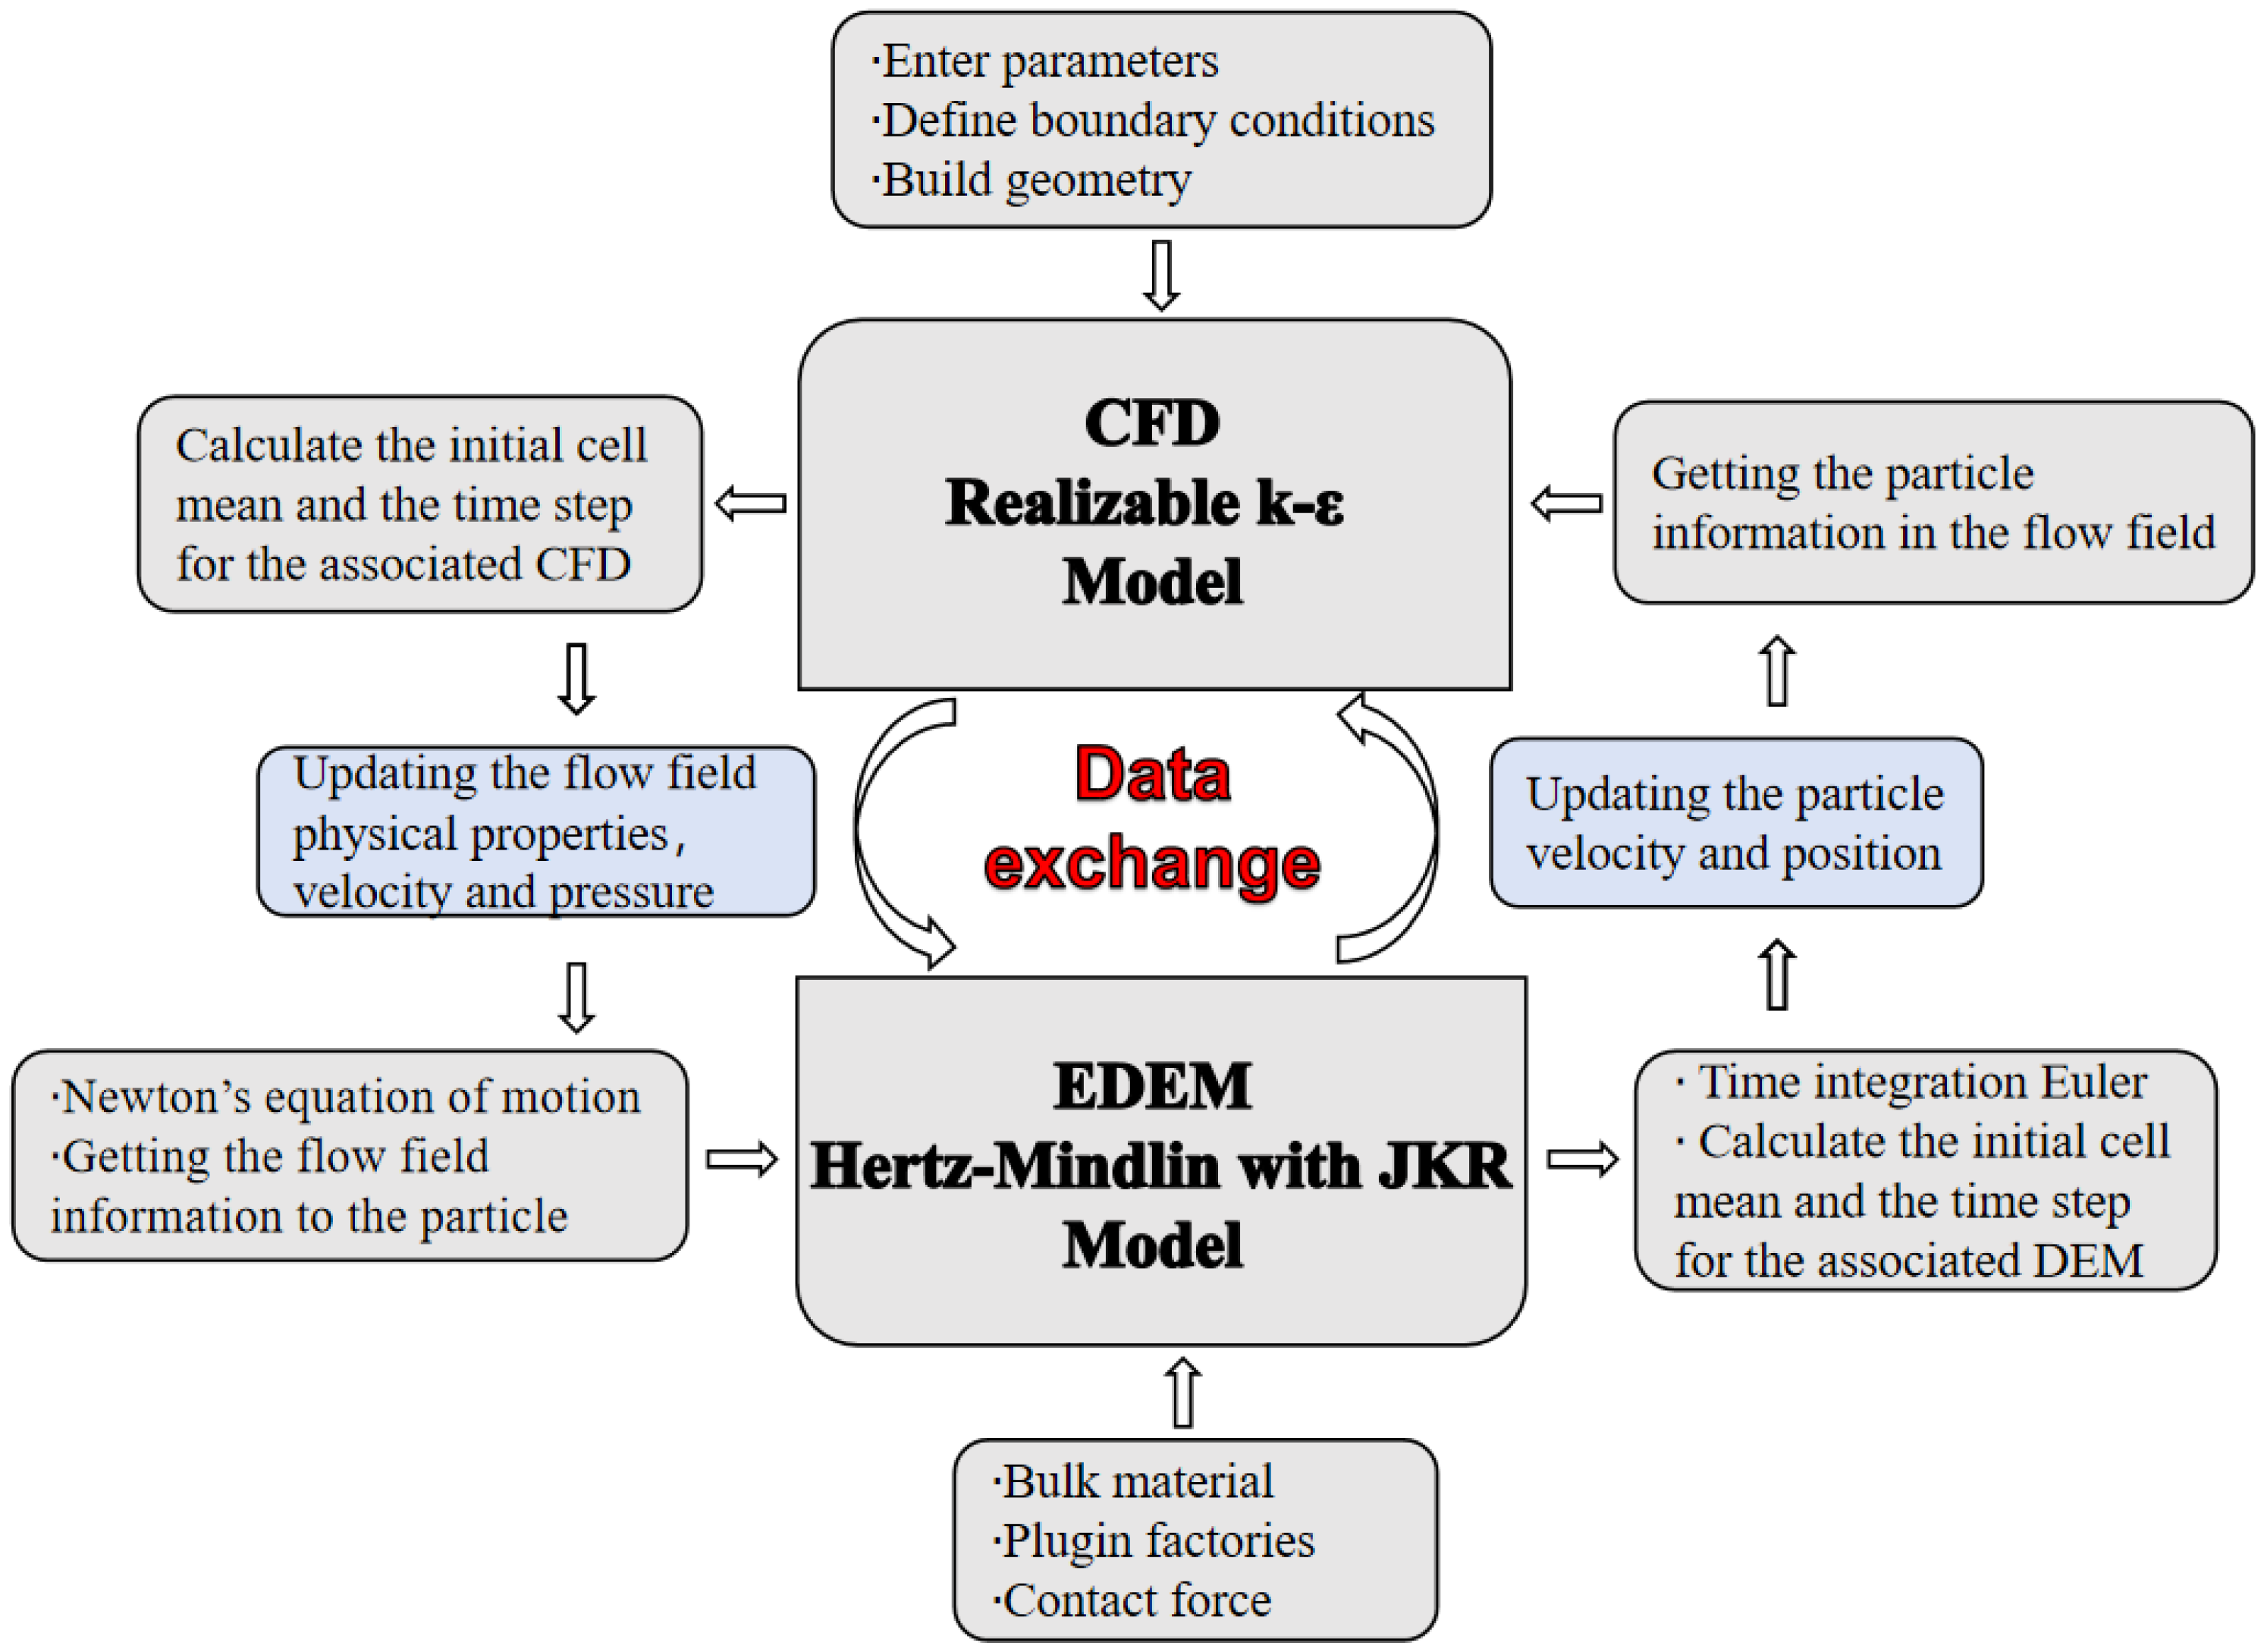
2.4. Coupling Process of the Fluid and Particles

The fluid–particle coupling methodology, implemented using ANSYS Fluent 2022 R1 (CFD) and EDEM 2022 (DEM), is illustrated in Figure 1. In this study, CFD–DEM was used to simulate the deposition of NH4Cl particles in hydroprocessing air coolers under flow conditions. The CFD module resolved the continuous fluid phase, and DEM governed the discrete particle dynamics.
We implemented the CFD-DEM coupling process using a dedicated interface, configuring 10 sampling points and employing a relaxation factor of 1 to ensure accurate data exchange while maintaining numerical stability. To assess interphase interactions, the Wen–Yu drag model was used, and the influence of lift forces was neglected because of the high particle density. To account for interphase heat transfer, the Ranz–Marshall model was adopted to describe convective heat transfer.
The multiphysics coupling scheme was initiated with flow-field initialization in ANSYS Fluent. Critical mesh cell data, such as fluid properties, velocity vectors, and pressure gradients, were transmitted in real time to the EDEM platform. EDEM subsequently performed topological mapping by identifying the corresponding Eulerian grid cells for individual Lagrangian particles using a nearest-neighbor search algorithm. Spatial interpolation techniques were applied to project the continuum flow-field parameters onto discrete particle positions. Concurrently, dynamic boundary synchronization maintained the geometric consistency between the EDEM particles and the Fluent mesh walls. Particle motion was solved in DEM by integrating the hydrodynamic drag forces (derived from local flow fields) and interparticle/wall collisions, generating kinematic data (velocities and displacements) for bidirectional coupling. Updated particle-phase information was iteratively fed back into Fluent via user-defined functions, enabling the recalculation of the fluid field. This two-way momentum exchange cycle was continued until the convergence criteria were satisfied, thereby achieving a closed-loop resolution of the multiphase interactions through iterative computation.

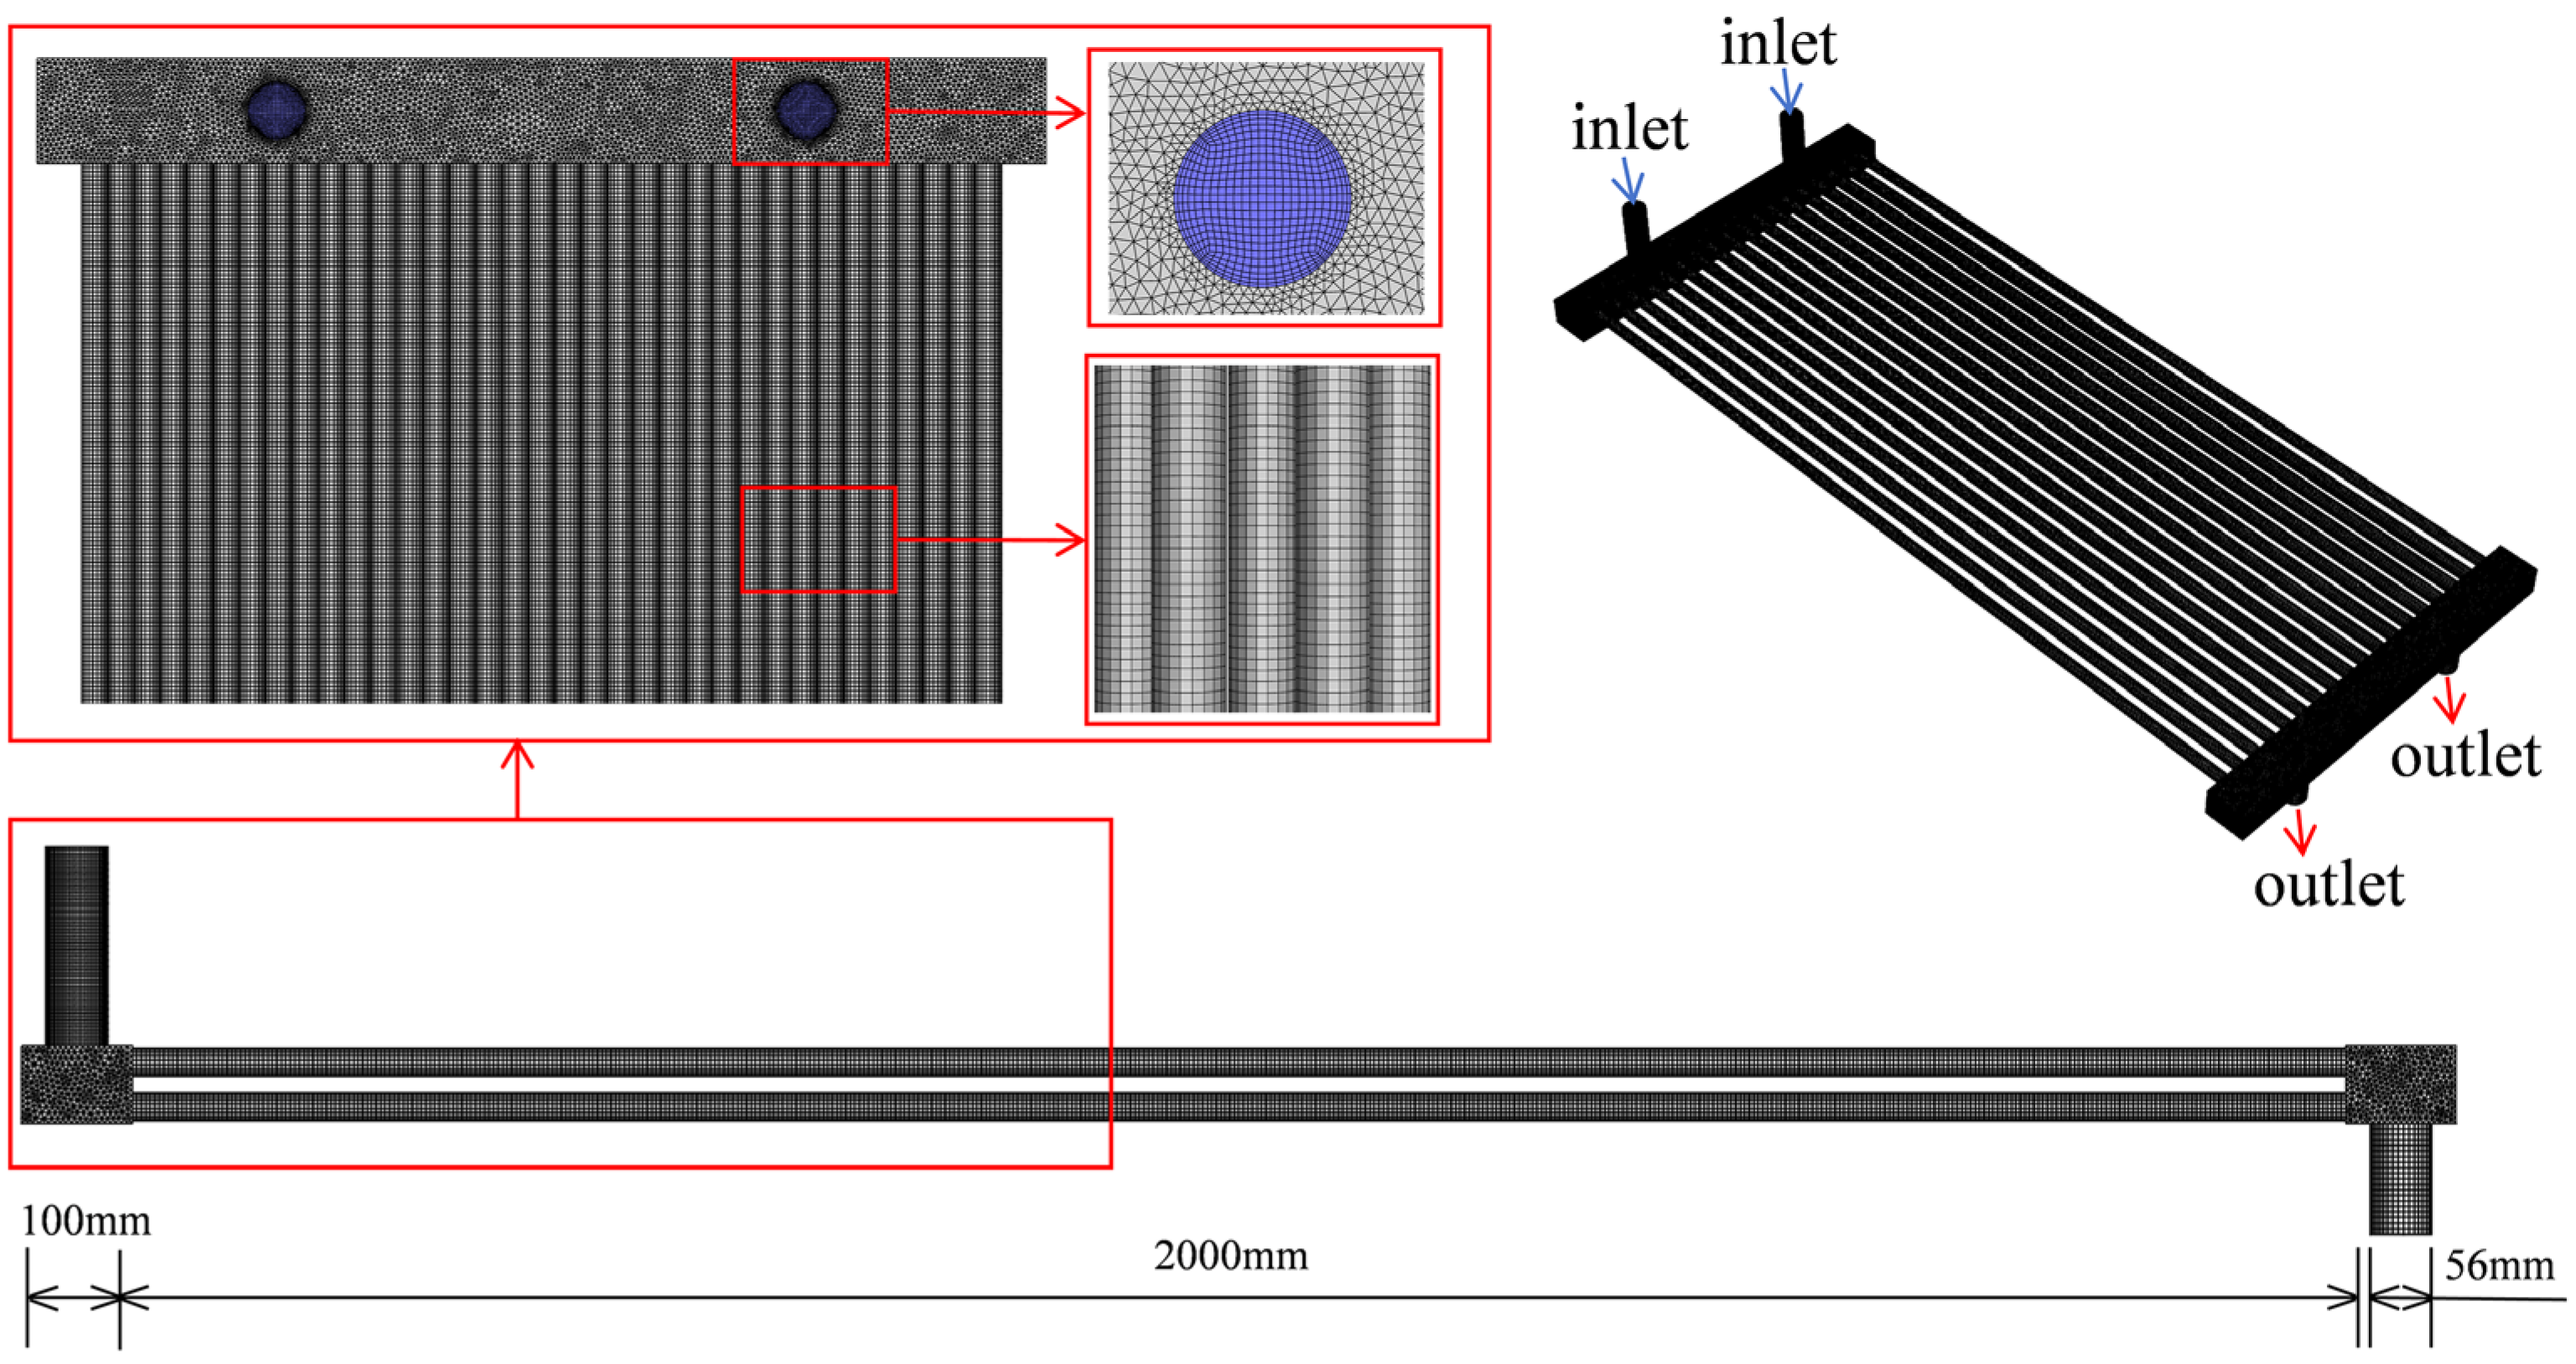
2.5. Geometric Modeling and Meshing

The air-cooler geometry (Figure 2) featured a 56 mm diameter inlet conduit (L = 180 mm) through which the fluid entered the manifold. The primary fluid domain comprised the front and rear manifolds (960 × 100 × 70 mm3) that were interconnected through a staggered tube-bundle arrangement. The bundle configuration consisted of 35 tubes (Φ26 × 2000 mm) arranged in two rows, with 18 tubes in the primary row and 17 in the secondary one. Meshing was performed using ICEM CFD (v2022 R1) with a hybrid grid methodology: structured hexahedral elements were applied to the piping systems, and unstructured tetrahedral cells were used for tube bundles. Interface continuity was ensured through node alignment at component junctions, obtaining a final computational grid of 4 × 10⁶ elements. This meshing strategy effectively minimized interfacial discontinuities while maintaining numerical stability.

3. Experimental Method

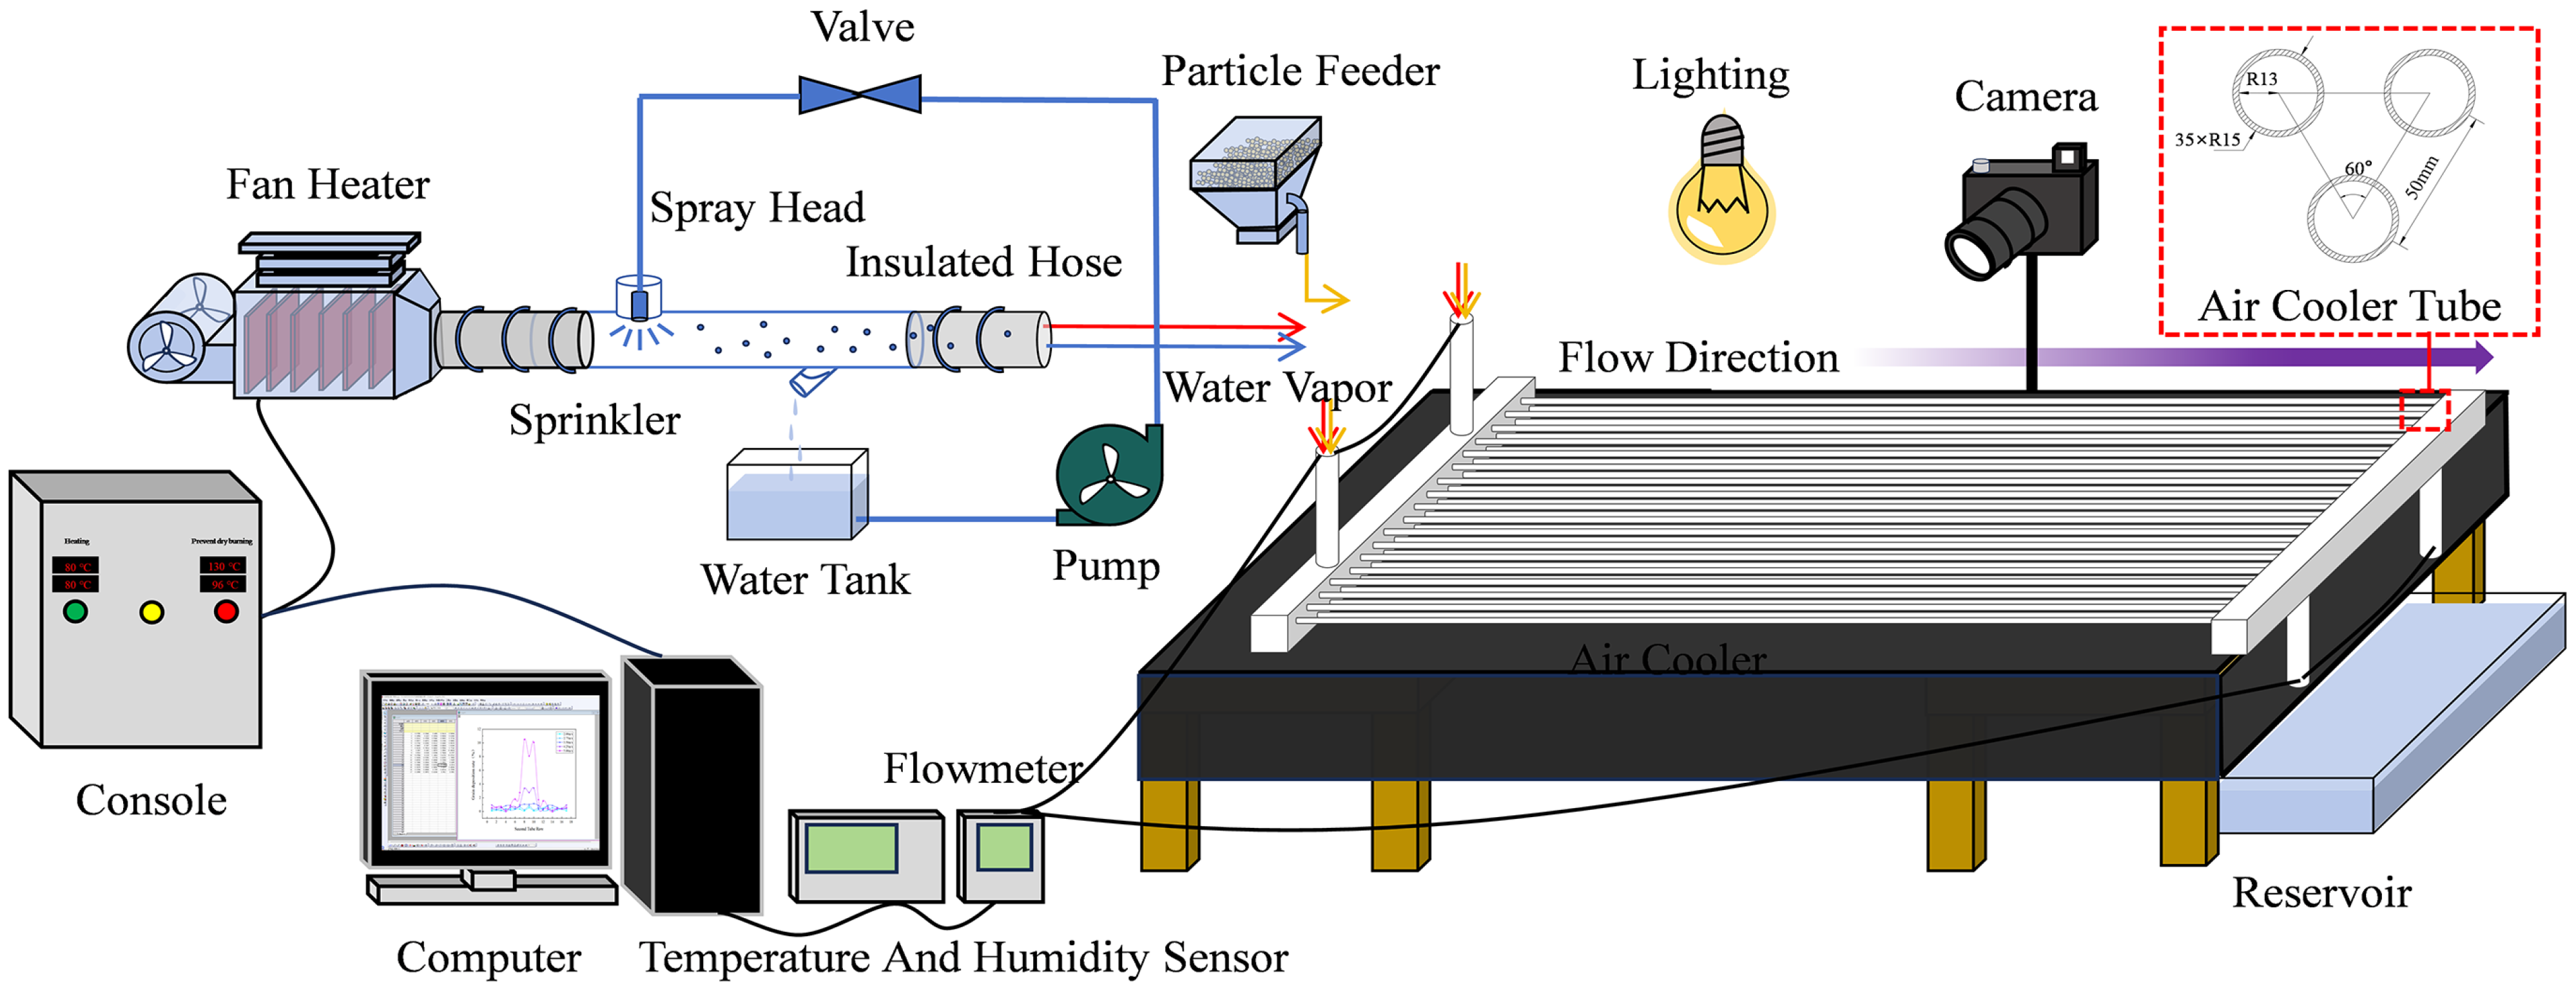
3.1. Experimental Setup

The experimental apparatus (Figure 3) comprised a closed-loop pneumatic system integrating a centrifugal fan (YN5-47, Qmax = 1100 m3·h−1), electric air heater (XCY/FD-10, T max = 623 K), and thermally insulated silicone–fiberglass composite hose. The fan generated airflow velocities ranging up to 20 m/s at the heater outlet. The air heater was thermally coupled to the fan discharge via a dedicated plenum chamber. A PID-controlled power regulation system enabled precise temperature modulation of the pressurized airflow before entry into the test section. Ceramic fiber insulation was applied to all critical thermal interfaces to minimize heat loss during gas transport.
The spray system comprised five principal components: (1) a stainless-steel injection manifold positioned at the fan heater outlet, (2) variable-aperture, high-temperature-rated nozzles selected based on airflow parameters, (3) a closed-loop recirculation system with a centrifugal pump (LS-0412: ΔP = 45 m, Qmax = 3 m3·h−1), (4) PID-controlled needle valves for flow regulation, and (5) a sedimentation sump with anti-backflow drainage. Unatomized water droplets settled in the sloped collection sump, which directed the condensate back to the reservoir through a check-valve-equipped drain. The pump delivered pressurized water through a feedback-controlled flow circuit to the nozzles, generating droplets that entered the air stream. This configuration enabled precise humidity control in the test section through real-time modulation of the spray flux.
The transparent test section comprised laser-cut polymethyl methacrylate (PMMA) components to form a modular air-cooler assembly. The aerodynamic circuit consisted of (i) an inlet manifold with a T junction and 90° elbow, (ii) front/rear header chambers interconnected through 35 staggered tubes (length = 2000 mm and internal diameter = 25 mm) arranged in an equilateral triangular pitch (s = 37 mm), and (iii) dual tube rows (18 upper/17 lower) maintaining a constant cross-sectional flow area. The tube-bundle geometry followed specifications for a dimensional tolerance of ±0.2 mm, enabling optical access for visualizing multiphase flow phenomena through the PMMA walls.

3.2. Experimental Operation

The experimental matrix was developed using an orthogonal array. The design incorporated three operating parameters: fluid velocity (Vg), fluid temperature (T), and particle size (dp), along with the corresponding particle retention rates for the first and second tube rows (DI and DII, respectively). The details of the conditions are given in Table 1.
This study employed a Taguchi L25 orthogonal experimental design (involving three influencing factors, each with five levels) to systematically investigate the particle deposition dynamics in the air-cooler equipment of a hydroprocessing effluent system. The study assesses the effects of three key parameters on the particle deposition behavior: gas flow velocity (2–5 m/s), temperature (353–393 K), and particle size distribution (100–600 μm). This orthogonal experimental design approach not only effectively identifies critical influencing factors, but also provides comprehensive insights into the effects of multiple parameters through a limited number of experiments.
Granular NH4Cl samples were divided into five monodisperse particle size groups using a sieving device compliant with ASTM E11 standards. A precision environmental control system maintained the relative humidity at 10 ± 5% throughout the experiment. After the system achieved thermal equilibrium (that is, temperature fluctuations were controlled within ±3 K), the particle injection procedure was initiated. The particles were injected through an opening in the main pipeline, located upstream of the air-cooler unit. This injection process effectively simulates the real-world scenario, where the nucleation and crystal growth processes of NH4Cl particles are completed before they enter the air-cooler system. In our experimental study, NH4Cl particles were introduced at a controlled rate of 60 g/min using a particle feeder. To prevent particle deliquescence caused by prolonged exposure to air, which affects the accuracy of deposition measurements, the particle introduction time was limited to 5 min. Post-experimental analyses were primarily carried out in two main steps: (1) the temperature distribution was monitored using K-type thermocouples, and (2) the mass of the particles deposited on each tube bundle was precisely measured using an FA1004 analytical balance (accuracy: ±0.0001 g). To evaluate the reliability of the experimental results, three repeated measurements were conducted under the reference conditions (3.5 m/s, 373 K, 300–400 μm particles), achieving a relative standard deviation of less than 5% and thus confirming the repeatability and accuracy of the experimental methodology.

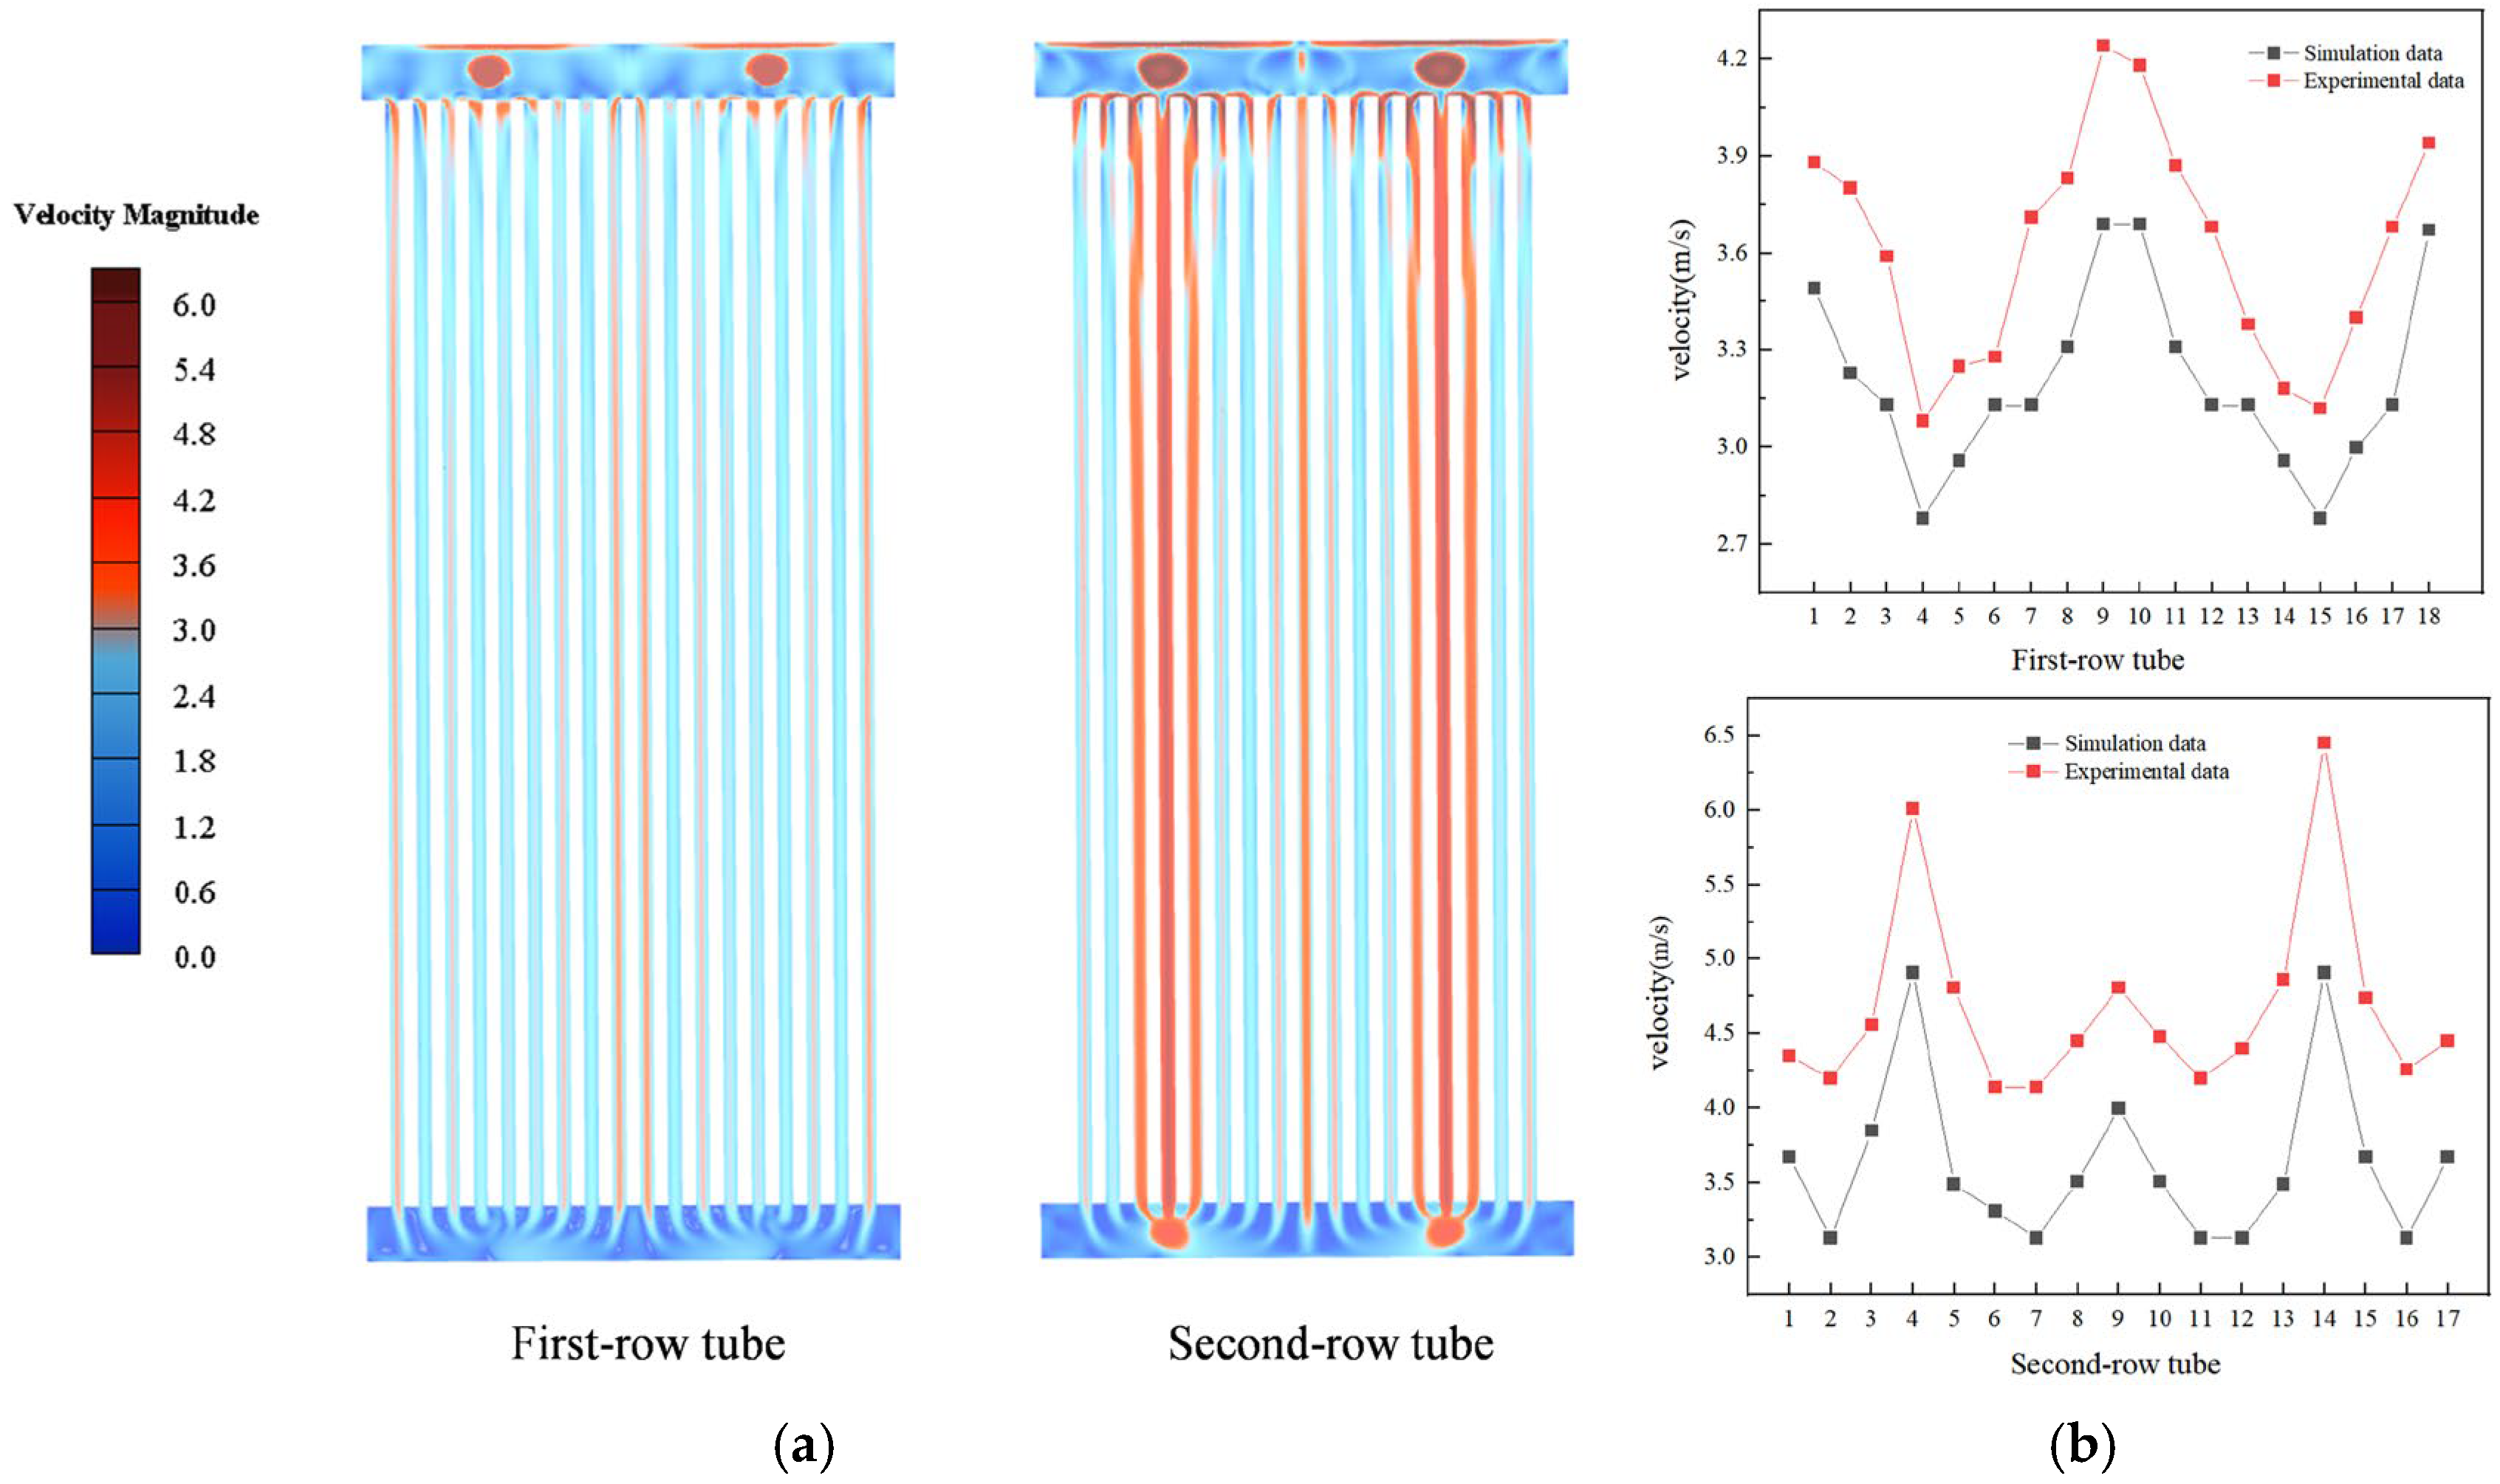
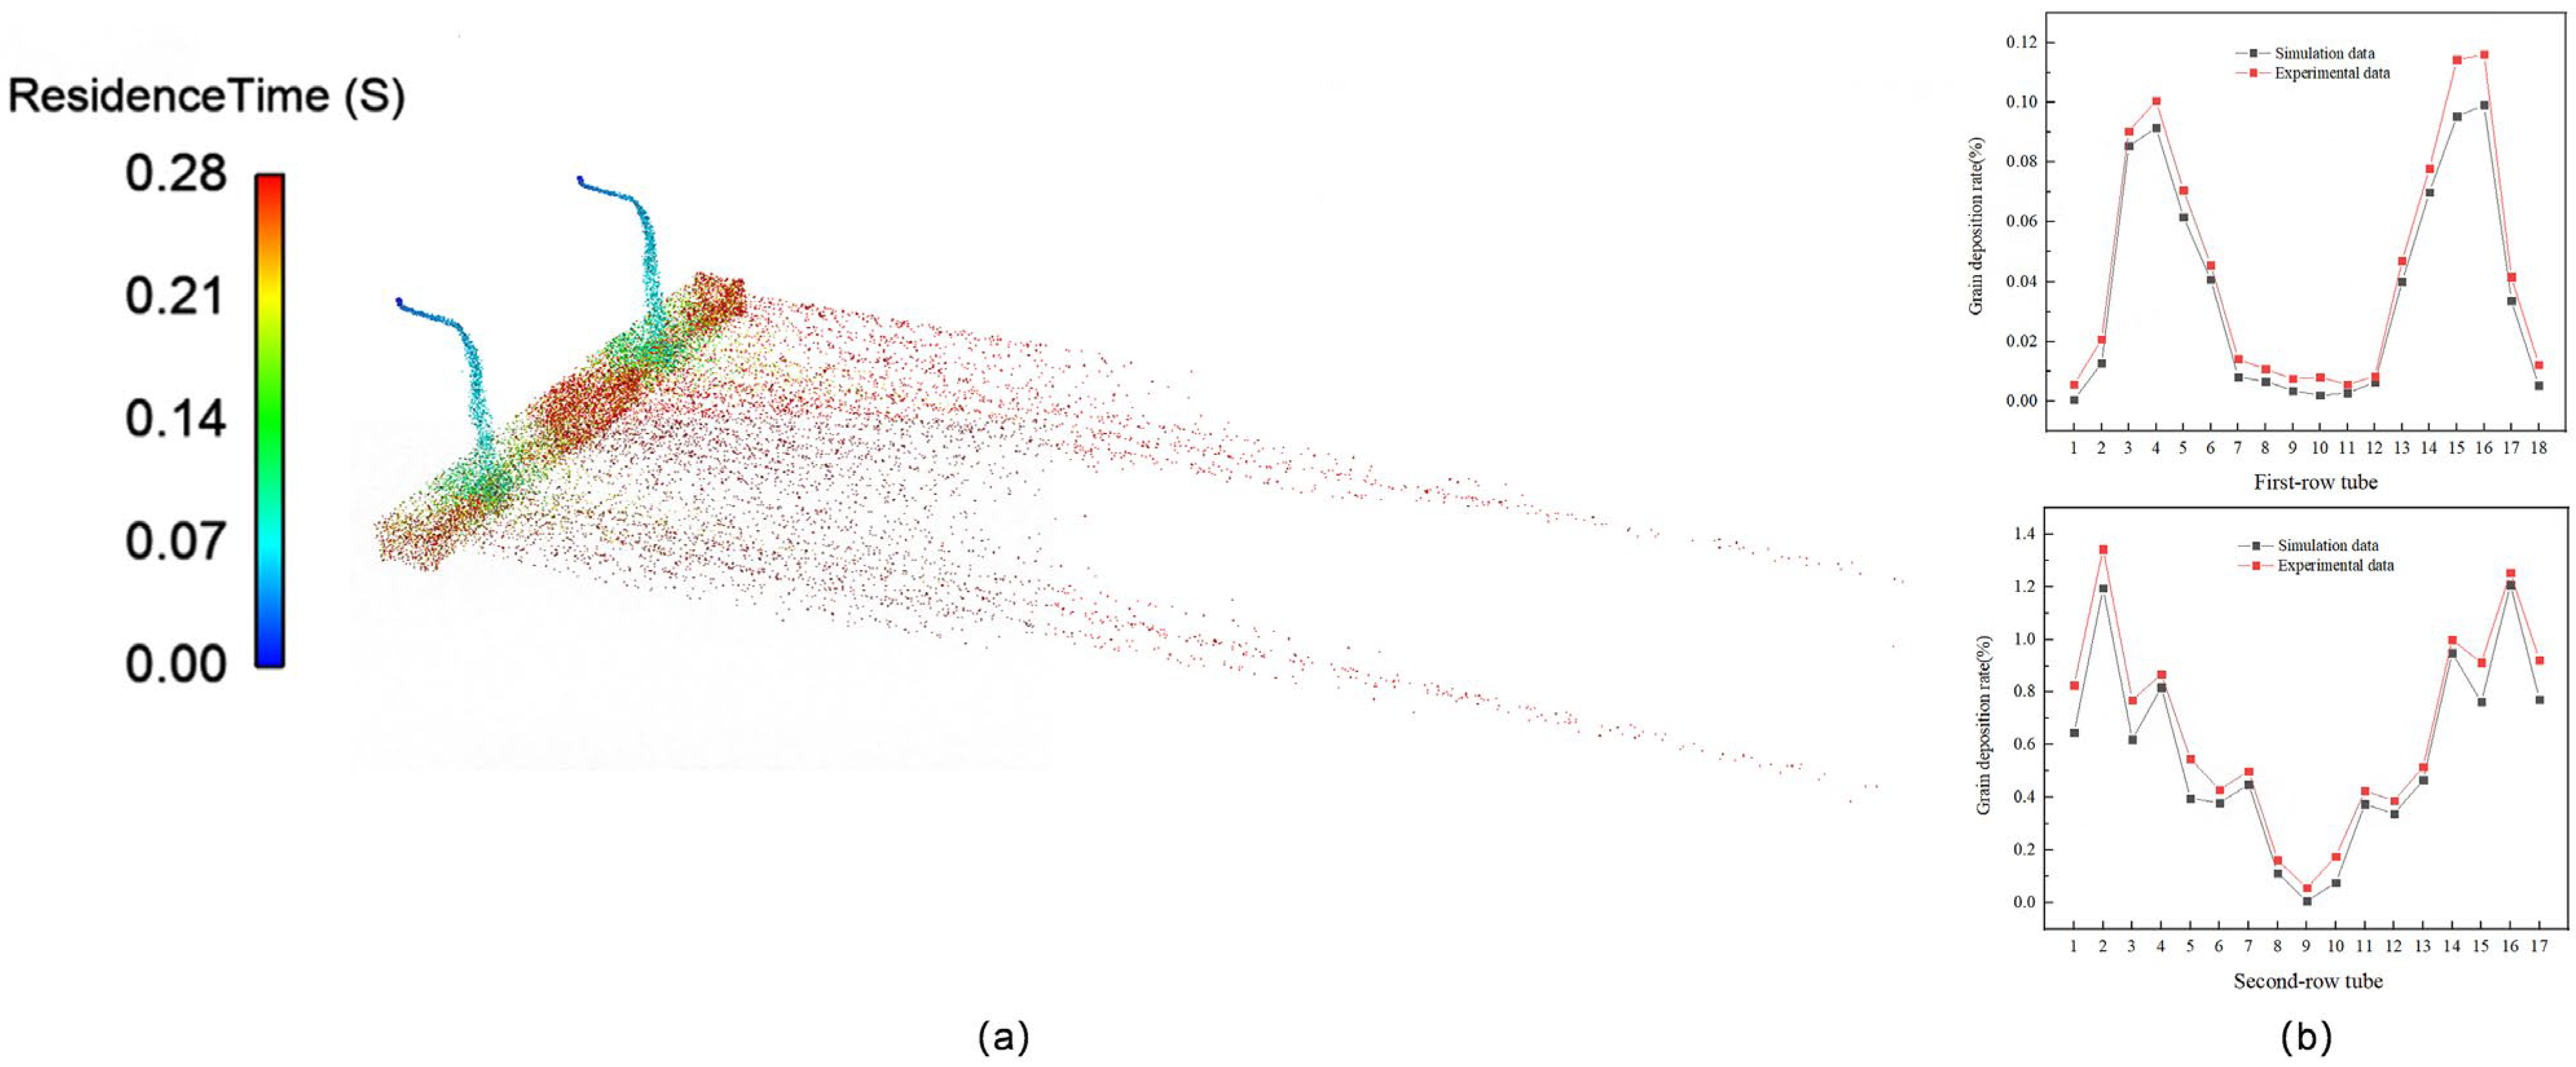
3.3. Validation of the Numerical Simulation Method

Numerical simulations of the internal flow dynamics in the air cooler were performed using the ANSYS Fluent CFD framework (v2022 R1), and experimental validation was conducted using a flow meter (W410A3, Beijing Aifanpeng Instrumentation Co., Ltd., Beijing, China). As shown in Figure 4b, the velocity contours obtained from simulations closely matched the experimental results across the staggered tube bundles. For the first-row tubes, a parabolic velocity profile was obtained, with peak velocities being observed in the central and adjacent tubes owing to flow constriction. On the other hand, the second-row tubes exhibited reversed flow acceleration near the inlet manifold, which is attributable to momentum redistribution induced by upstream turbulence. Flow separation at the header–tube junction produced a recirculation zone near the midspan of the secondary tubes, resulting in localized velocity amplification, consistent with Bernoulli effects.
Air coolers serve as critical heat-exchanging units in petrochemical processes by facilitating vapor condensation and fluid cooling through forced convection. We employed the following approach to quantify the temperature gradient variations in particles: in the EDEM 2022 software, we activated the heat conduction model for particle–particle–wall interactions and assigned the particles a thermal conductivity of 0.0454 W/(m·K). Within the particle body force settings, we enabled temperature updates and specified a specific heat capacity of 1846 J/(kg·K) for the particles. Subsequently, in the particle factory, we set the initial temperature of the NH4Cl particles. To analyze the effect of temperature variations on the particle deposition behavior, based on experimental conditions, we applied a temperature range of 353–393 K to the fluid inlet in Fluent 2022R1 software. As shown in Figure 5b, the simulated temperature contours agreed well with the experimental results obtained using thermocouples. The external flow-field grid of the air cooler was finely divided by Fluent Meshing, and the external flow field of the air-cooler shell was subsequently simulated using the energy equation. Figure 5a illustrates that the majority of heat exchange occurred in the inlet tube box of the air cooler. In the primary tube row, elevated temperatures were observed near the inlet pipe and central manifold, because the high-temperature fluid entering the manifold increased the temperature of adjacent tube bundles. This thermal coupling induced an undulating axial temperature profile along the tube array. In the secondary tube row, localized temperature spikes were observed near the inlet conduit because of thermal energy transport from high-velocity fluid streams through intensified convection.
Figure 6b compares the DEM-simulated and experimentally measured particle deposition rates under a gas velocity of 3.5 m/s, temperature of 373 K, and particle size of 300–400 μm. Distinct deposition patterns were evident across the tube-bundle rows. In the first-row tubes, the behavior of larger particles with lower initial velocities was predominantly governed by gravitational forces. After colliding with the bottom wall of the tube box, these particles preferentially migrated into the inlet-proximal tubes, forming a trough-shaped deposition profile with minimal retention in the central zones. In the second-row tubes, a similar pattern was observed; however, elevated flow velocities, particularly in peripheral tubes opposite the inlet, shifted the dominant mechanism to shear-induced lift forces, enhancing lateral particle dispersion and modifying the deposition distribution compared with that in the upper row. Quantitative validation revealed a strong agreement between simulated and experimental deposition rates across all 35 tubes, demonstrating the model’s fidelity in capturing intricate particle–tube interactions under high-temperature gas–solid flow conditions.
Numerical analysis identified hydrodynamic drag forces as the principal particle transport mechanism during the initial entry, with subsequent particle deposition governed by multiphase momentum transfer during wall impingement events. Granular convection occurs in tube bank regions with velocity gradients, and owing to size-dependent particle segregation, larger particles exhibit enhanced mobility through turbulent dispersion. Particle trajectory analysis revealed cyclical rebound patterns between the header base and the lower tube bundles, with the particles undergoing ≥3 wall collisions before final deposition [10]. This insight enables the predictive modeling of fouling patterns in staggered tube arrangements.

3.4. Effects of Multi-Factor Interactions

(1)
Effects of temperature and particle size at a flow velocity of 2 m/s
Figure 7 quantifies the NH4Cl particle retention rates across the tube bundles under experimental conditions 1–5 shown in Table 1. As the particle size increased, the location of particle deposition shifted from the mid-region within the tube box to the inlet region. Under low-velocity flow conditions, gravitational forces begin to dominate over fluid drag, causing larger particles to accumulate directly at the inlet position after entry.
The movement patterns of the NH4Cl particles present distinct trends under low-velocity flow conditions. In the first-row tube bundles, particle migration exhibited a characteristic lateral dispersion from the central region to both sides. This phenomenon is primarily governed by particle size variations within the 100–300 μm range.
Smaller particles (<300 μm) have greater fluid-flowing capability due to their lower mass, which enables them to maintain a trajectory that is coherent with the fluid stream, even at moderate flow velocities. On the other hand, larger particles (>300 μm) manifest different dynamics through a gravity-mediated collision-rebound mechanism. Upon contacting the bottom of the tube box, these macroparticles convert the gravitational potential energy into kinetic energy, resulting in pronounced rebound trajectories before entering the tube bundle. This size-dependent behavior became more apparent in the second-row tube bundles, where particle accumulation predominantly occurred near the fourth and fourteenth tube bundles. The preferential accumulation of particles at these locations correlates with localized flow velocity enhancements, because particles tend to follow fluid resistance gradients toward higher-velocity regions.
Mechanistic analysis revealed a positive correlation between the particle size and deposition tendency, driven by energy conversion dynamics during particle–wall interactions. Larger particles, having greater gravitational potential energy, exhibited rebound effects and higher deposition probability. From an operational perspective, this size-dependent deposition mechanism has critical implications in terms of the risk of tube-bundle blockage. Macroscale accumulation patterns indicated that larger particles contribute disproportionately to fouling processes, potentially exacerbating flow obstruction in practical applications.
(2)
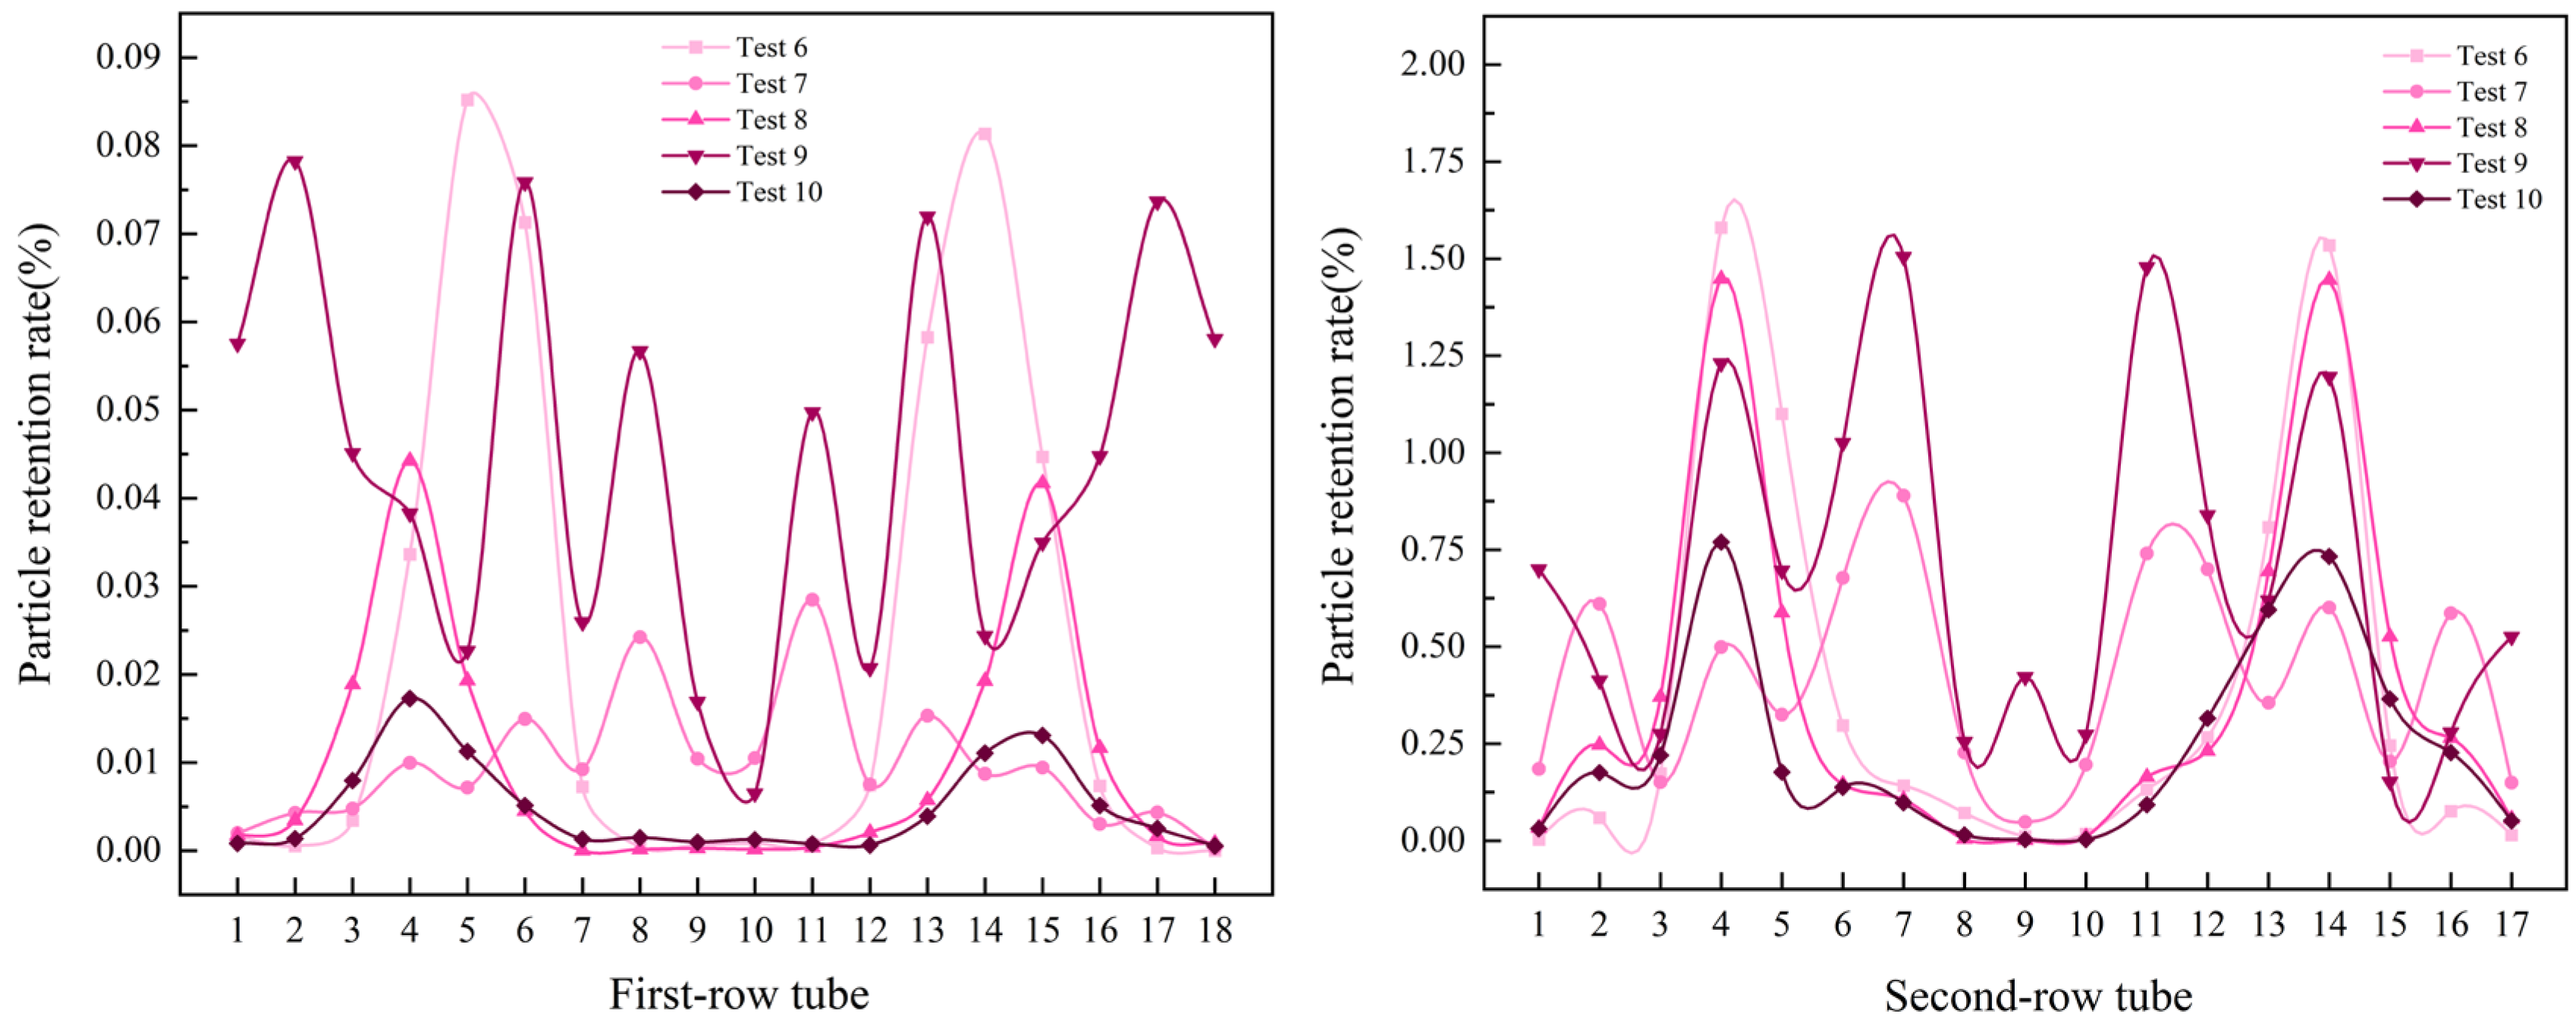
Effects of temperature and particle size at a flow velocity of 2.75 m/s
Figure 8 illustrates the NH4Cl particle retention rates across the tube bundles under operating conditions 6–10 with a flow velocity of 2.75 m/s (see Table 1). Comparative analysis revealed distinct shifts in particle distribution patterns, with the NH4Cl particles migrating toward both the lateral sides and the central region of the tube box. For particles in the range of 100–300 μm, the retention profile exhibits a non-uniform “jagged” distribution characterized by a pronounced central trough. This phenomenon arises from the interaction between the low flow velocity and the thermal dynamics. The lower flow velocity enhanced heat exchange between the fluid and its surroundings, causing localized cooling, particularly in the central region. Smaller particles, with a higher surface-area-to-mass ratio, are more susceptible to these thermal effects, resulting in an irregular spatial deposition pattern.
In contrast, particles that were larger than 300 μm preferentially accumulated near the inlet zone, with the retention rates positively correlating with the particle size. The larger particles (>300 μm) possessed sufficient gravitational potential energy to overcome fluid resistance forces. Upon colliding with the tube box base, they rebounded and migrated toward high-velocity tube bundles near the inlet. This size-dependent behavior indicates that under these flow conditions, particle motion is primarily governed by gravitational settling and inertial effects, rather than thermal gradients.
The observed retention trends demonstrate a systematic increase in particle deposition with increasing particle size, highlighting a critical operational implication: larger particles have a higher deposition propensity owing to their enhanced kinetic energy during wall collisions. This size-dependent deposition mechanism increases fouling risks in practical applications, particularly in systems with similar flow–thermal coupling conditions.
(3)
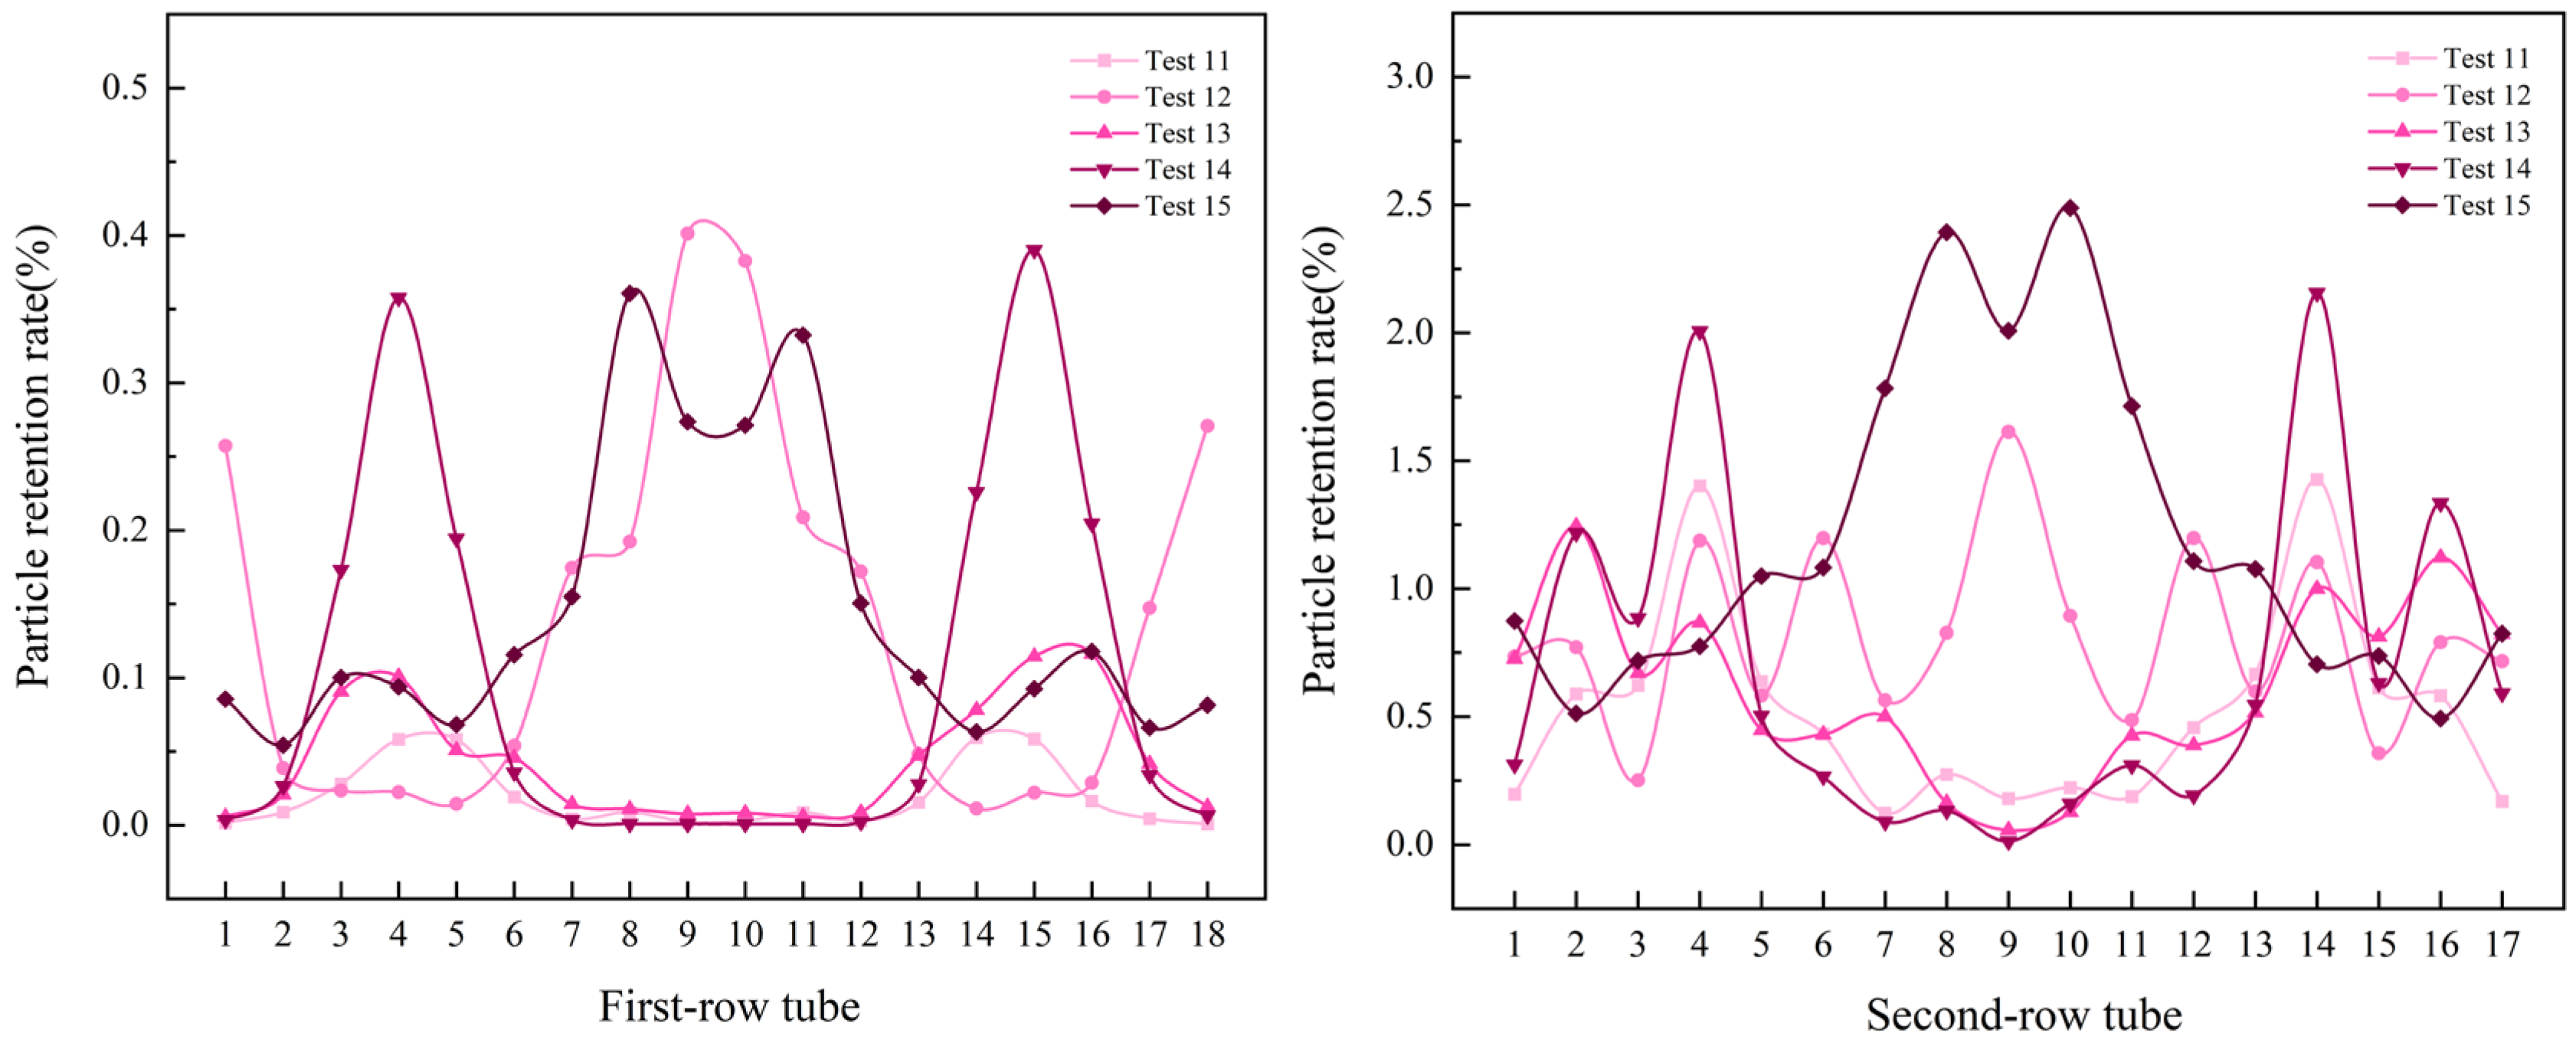
Effects of temperature and particle size at a flow velocity of 3.5 m/s
Figure 9 illustrates the NH4Cl retention rates across the tube bundles under operating conditions 11–15 in Table 1. The fine particles within the tube bundle were predominantly distributed in the central region of the tube box. As the flow rate increased, the retention rate of the NH4Cl particles on both sides of the tube box increased, especially at larger particle sizes.
In the first tube row, particles larger than 300 μm were primarily influenced by gravitational forces, even at elevated flow rates. Consequently, the retention rate at the inlet positions on both sides of the tube row increased with increasing particle size.
In the second tube row, unagglomerated particles (100–200 μm) entered the central region of the first tube row with the fluid flow. The remaining particles, which were predominantly agglomerated, migrated toward the central zone of the tube bundle following collisions with the tube box walls. Notably, particle agglomeration in the 200–300 μm size range was minimal under high-temperature, low-humidity conditions. Consequently, the retention rate in the second tube row was 13.8758% for condition 12 and 20.3427% for condition 15, indicating a marked reduction in the retention of smaller particles under condition 12. Along the sides of the second tube row, the retention rate exhibited a wavy distribution that increased with the particle size.
At a flow velocity of 3.5 m/s, the central region of the second tube bundle presented a higher risk of fine particle deposition, whereas the side regions of the tube bundle were more prone to accumulate larger particles.
(4)
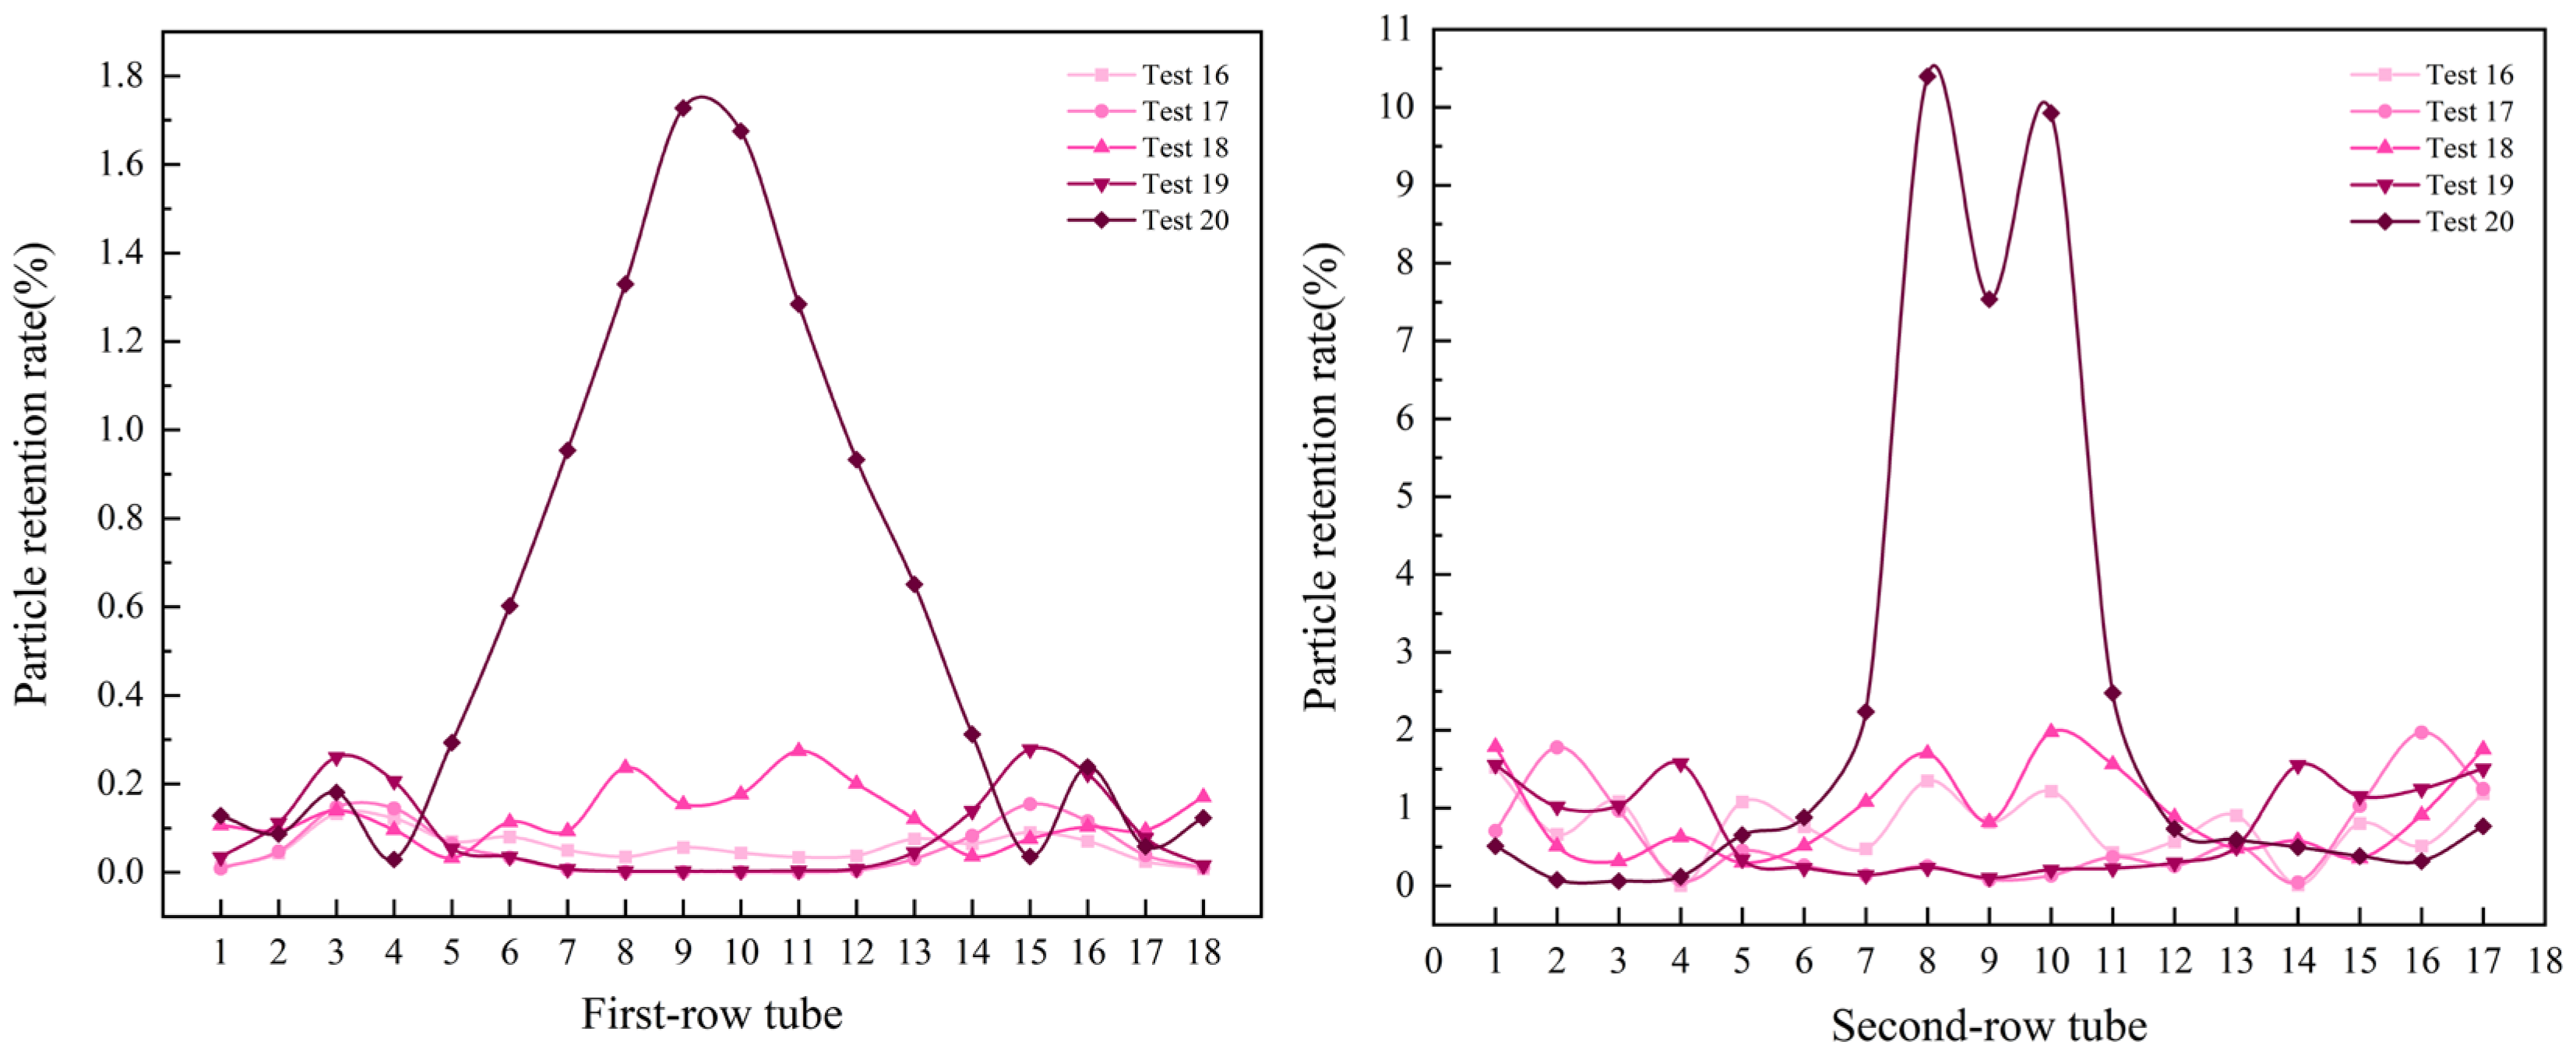
Effects of temperature and particle size at a flow velocity of 4.25 m/s
Figure 10 shows the simulated NH4Cl retention characteristics within the tube bundles under test conditions 16–20 in Table 1. When the flow velocity reaches 4.25 m/s, distinct particle retention patterns emerge: for particles in the 400–600 μm range, the retention rate gradually decreases at the central position of the tube bundle while increasing on both lateral sides. Conversely, particles in the 100–400 μm range exhibit size-dependent retention reduction at the lateral positions, with smaller particles showing lower retention rates. Notably, 100–200 μm particles demonstrated exceptionally high retention rates throughout the tube bundle, particularly in the central ninth and tenth rows, where the retention values reached 1.6272% and 1.6752%, respectively.
At an average flow velocity of 4.25 m/s, under high-temperature condition 20, initial tube blockage, predominantly involving 100–200 μm particles, was observed in the central region of the first tube row. This behavior originated from the dual influences of fluid drag and thermophoretic forces. While drag dominated the particle movement, thermophoretic forces directed particle migration toward lower-temperature regions of the tube, creating a macroscopically observable concentration pattern.
The distribution of retention rates in subsequent tube rows had a valley-shaped profile, with eddy currents in the central tube box region causing higher lateral retention compared with that in the central area. In the inlet-position tube bundles, elevated flow velocity enabled the NH4Cl particles to maintain a substantial kinetic energy through multiple collisions, until their ultimate deposition in the outlet tube box. This particle dynamics suggests that particle trajectory persistence is maintained until sufficient energy dissipation allows for final deposition.
(5)
Effects of temperature and particle size at a flow velocity of 5 m/s
Figure 11 illustrates the NH4Cl retention rates for each tube row under test conditions 21–25 in Table 1. At a flow rate of 5 m/s, the deposition rate of particles within the tube bundles decreased for all particle sizes. The reduction rate was particularly significant for NH4Cl particles in the size range of 100–300 μm. When the particle size exceeded 300 μm, the retention rate on both sides of the tube was higher than that at the middle position. As the particle size increased, the retention rate gradually became more uniform across the middle and side positions.
In the first row of tubes, owing to the high flow rate, NH4Cl particles with sizes in the 100–200 μm range exhibited a high retention rate within each tube bundle. In contrast, 200–300 μm particles were predominantly distributed in the middle of the tube bundle. In the second row of tubes, smaller particles remained prominent in the middle region, and the retention rate of NH4Cl particles increased significantly as the particle size decreased. Additionally, the retention rate on both sides of the tube bundle gradually increased, posing a risk of sedimentation and blockage. After analyzing the particle retention rate for each size group at a constant flow rate, the maximum level of the particle retention effect was determined through a detailed range analysis of the orthogonal test.

4. Results and Discussion
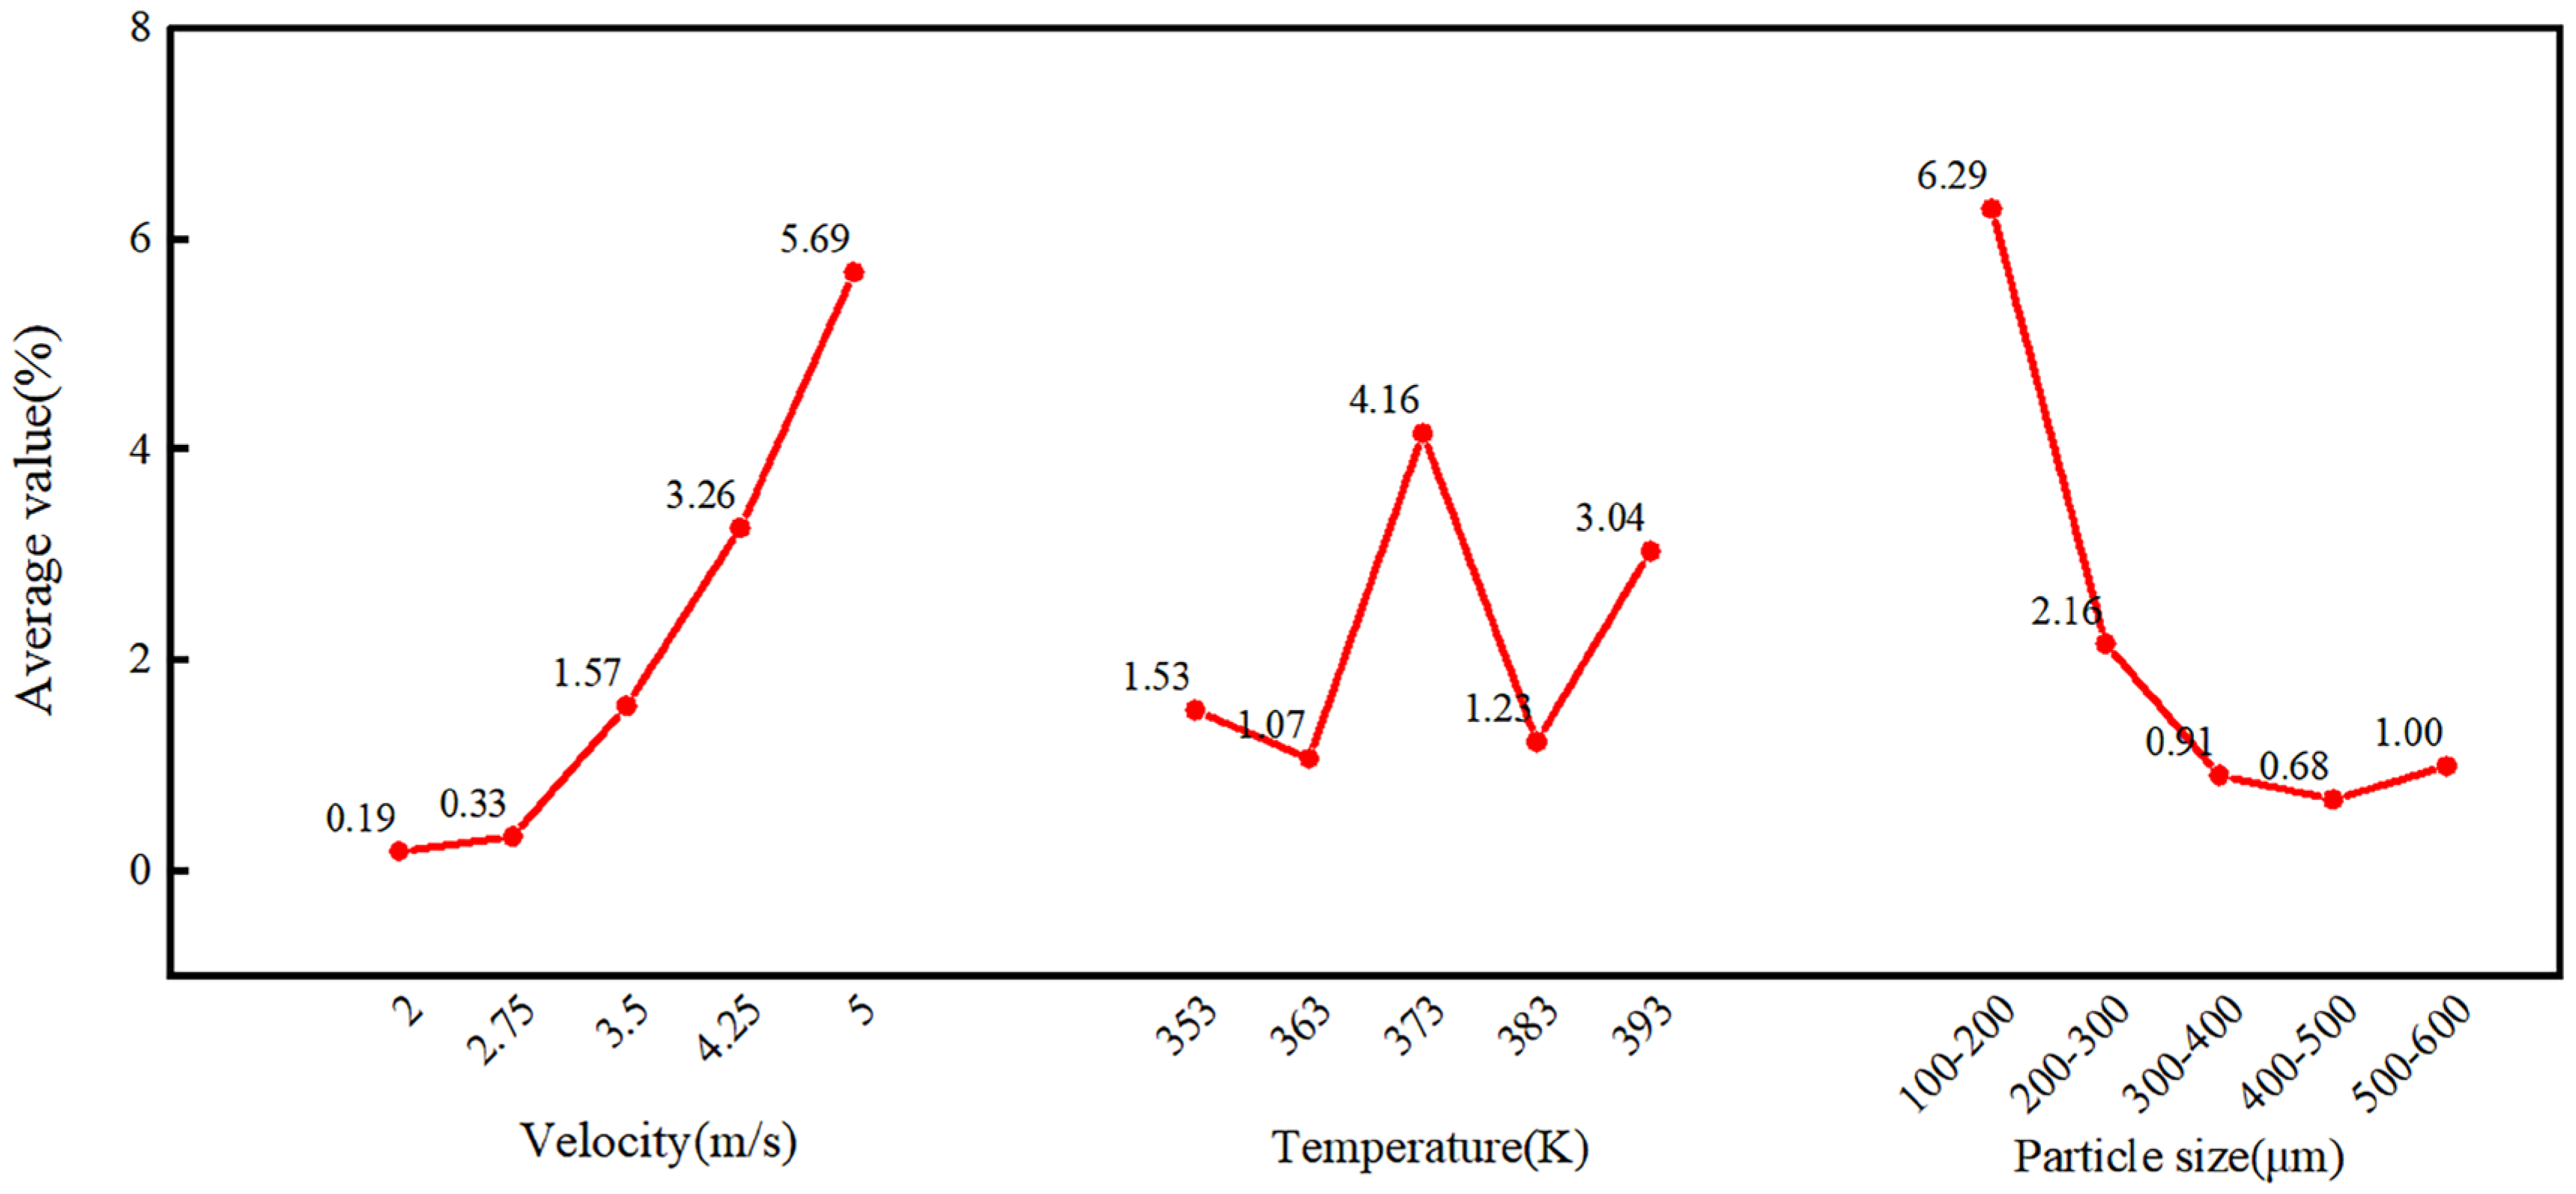
4.1. Range Analysis

Table 2 presents the range analysis results for the first-row tubes. The data indicate that the risk of deposition and blockage is the highest under the following conditions: flow velocity in the first-row tube at level 5 (5 m/s), inlet temperature at level 3 (373 K), and particle size at level 1 (100–200 μm). By comparing the range values (R) of each factor, the degree of influence of the variables on particle deposition in the first tube bundle can be ranked as follows: particle size > flow rate > inlet temperature. The flow velocity and particle size exerted the most significant effects on the particle deposition behavior.
Figure 12 illustrates the average values of the influencing factors for particle deposition in the first-row tubes. From the perspective of particle deposition dynamics, the following trends were observed: (1) Larger flow rates correlated with increased particle retention in the tube bundle, showing a monotonically increasing trend. (2) The influence of temperature on particle deposition in the first-row tubes displayed a wave-like fluctuation, with notable variations observed in the middle section of the row. (3) The impact of the particle size on the deposition decreased progressively as the particle size increased. These observations align with known mechanisms: smaller particles are more sensitive to flow dynamics, whereas larger particles exhibit reduced retention variability across the tube bundle.
Table 3 presents the range analysis results for the second-row tubes. The conditions that lead to the highest risk of particle deposition and the blockage of the second-row tube are as follows: flow velocity at level 5 (5 m/s), inlet temperature at level 3 (373 K), and particle size at level 1 (100–200 μm). By comparing the range values (R) of each influencing factor, the order of the impact of the variables on particle deposition in the second-row tubes was determined to be flow rate > particle size > inlet temperature.
Figure 13 shows the average values of the influencing factors for particle deposition in the second-row tubes. While the trends of the different factors aligned with those observed in Figure 12 (e.g., flow rate and particle size dependences), the average retention rate in the second-row tubes was significantly higher than that in the first-row tubes. This outcome suggests that the second-row tubes are more susceptible to blockage due to particle deposition than the first-row tubes during actual air-cooler operation.
The increased retention rate in the second-row tubes may arise from cumulative particle accumulation or altered flow dynamics downstream of the first-row tubes, emphasizing the need for targeted monitoring and maintenance in multirow tube systems.

4.2. Fitting with Equations

Orthogonal experimental data were used for fitting analysis, thereby enhancing the generalizability of the findings. Both second-order polynomial and power-law equations were employed to improve the accuracy of fitting. The fitting process was implemented using Visual Studio 2019 with the NET framework, and the numerical computations and visualizations were supported by the Math.NET Numerics and OxyPlot libraries. The experimental data, including the gas velocity (Vg), temperature (T0), and particle diameter (dp), were preprocessed by converting the particle size ranges to median values and removing outliers using the interquartile range method. A second-order polynomial model was constructed by incorporating the linear, quadratic, and interaction terms of the independent variables, and a power-law model was formulated based on the physical principles of particle deposition. The models were validated using statistical metrics, including the coefficient of determination (R2), root-mean-square error (RMSE), and residual analysis, to ensure homoscedasticity and randomness. The integration of these tools and methods ensured a robust and efficient fitting process, enabling the precise quantification of the relationships between the deposition rate and the experimental parameters.
The second-order polynomial equations are as follows:
D I = 14.8944 V g 0.3353 T + 0.0911 d p + 0.9511 V g 2 + 0.0004 T 2 + 0.0378 V g T 0.0117 V g d p 0.0003 T d p + 66.2667 ,
D I I = 1.9733 V g 5.3589 T + 0.2947 d p + 3.2581 V g 2 + 0.0077 T 2 0.0072 V g T 0.0302 V g d p 0.0007 T d p + 939.3384 ,
Because of the poor fit of the experimental data with the second-order polynomial equations, as indicated by the low R2 and high RMSE values (R2 = 0.14, DI; R2 = 0.22, DII) and RMSE (RMSE = 11.52, DI: RMSE = 13.21 DII), we adopted a power-law equation to fit the particle deposition residence rates in the tube bundle.
The power-law equation is as follows:
D I = 0.0048 V g 3.7792 T 1.204 d p 1.1417 ,
D I I = 0.0102 V g 1.7754 T 1.4058 d p 0.6035
The validation results for the power-law model, namely the values of the coefficient of determination (R2 = 0.776 > 0.75 for DI; R2 = 0.789 > 0.75 for DII) and RMSE (RMSE = 1.965 for DI; RMSE = 2.312 for DII), indicated that this model has a strong explanatory power and predictive accuracy. The residual analysis further confirmed that the residuals were randomly distributed with minimal systematic bias, thus satisfying the homoscedasticity assumption. By comparing the two fitting equations, we conclude that the power-law equation provides superior accuracy in predicting the particle deposition rates in the air-cooler system.
The superior correlation demonstrated by the power-law equation enables a systematic investigation of the factors that govern the NH4Cl particle deposition dynamics within the tube bundles. Researchers have employed this validated model to quantify parametric influences on particle retention characteristics during the deposition process. A comparison of the parameter exponents for the upper and lower tube rows revealed distinct influences of variables on the deposition rates (Figure 14). For both tube row configurations, a positive correlation was found between the deposition rate and the gas velocity and temperature as two key parameters. This relationship indicates enhanced particle deposition within the tube bundles under elevated flow velocities and thermal conditions. The effect of velocity (Figure 14a) primarily stems from intensified particle transport from the tube box into the tube bundle at higher flow rates, whereas the temperature elevation (Figure 14b) promotes particle–wall settling interactions. Notably, the fluid velocity emerged as the dominant influencing factor in the comparative exponent analysis. In contrast, the particle diameter exhibited negative exponents for both tube rows (Figure 14c), suggesting an inverse relationship between the particle size and particle deposition in the tube bundle. This phenomenon arises from the preferential deposition of larger particles in the header region, prior to their entry into the tube bundle, resulting in reduced residence time and consequently lower deposition rates within the tube rows for coarser particulates. The different magnitudes of the exponents for the upper and lower rows further suggest spatial variations in deposition mechanisms along the flow path. To ensure the reliability of our fitted model, we strictly limited the power-law correlation to discrete particles within the 100–600 μm range. This restriction accounts for the fact that larger agglomerated particles tend to deposit directly in the tube box due to gravitational settling, rather than entering the tube bundle.
It should be noted that although the experimental setup utilized transparent acrylic plates, instead of industrial-grade carbon steel pipes, our comparative analysis confirmed that the differences in the thermal properties and frictional characteristics do not significantly alter the distribution mechanism of NH4Cl particles within the tube row. This key finding ensures that our power-law model can predict the deposition behavior of NH4Cl particles under actual industrial air-cooler conditions, within the specified operational range.

5. Conclusions

This study numerically investigated the deposition characteristics of NH4Cl particles in an air cooler using computational simulations based on a detailed analysis of the multilevel factors that influence particle localization. Numerical simulations based on a coupled CFD-DEM approach were validated through experimental studies, in which discrete-phase particles were injected into the air cooler via the EDEM particle generator. Orthogonal experimental data were fitted with different mathematical equations, thereby enhancing the generalizability of the findings. The principal findings are as follows:
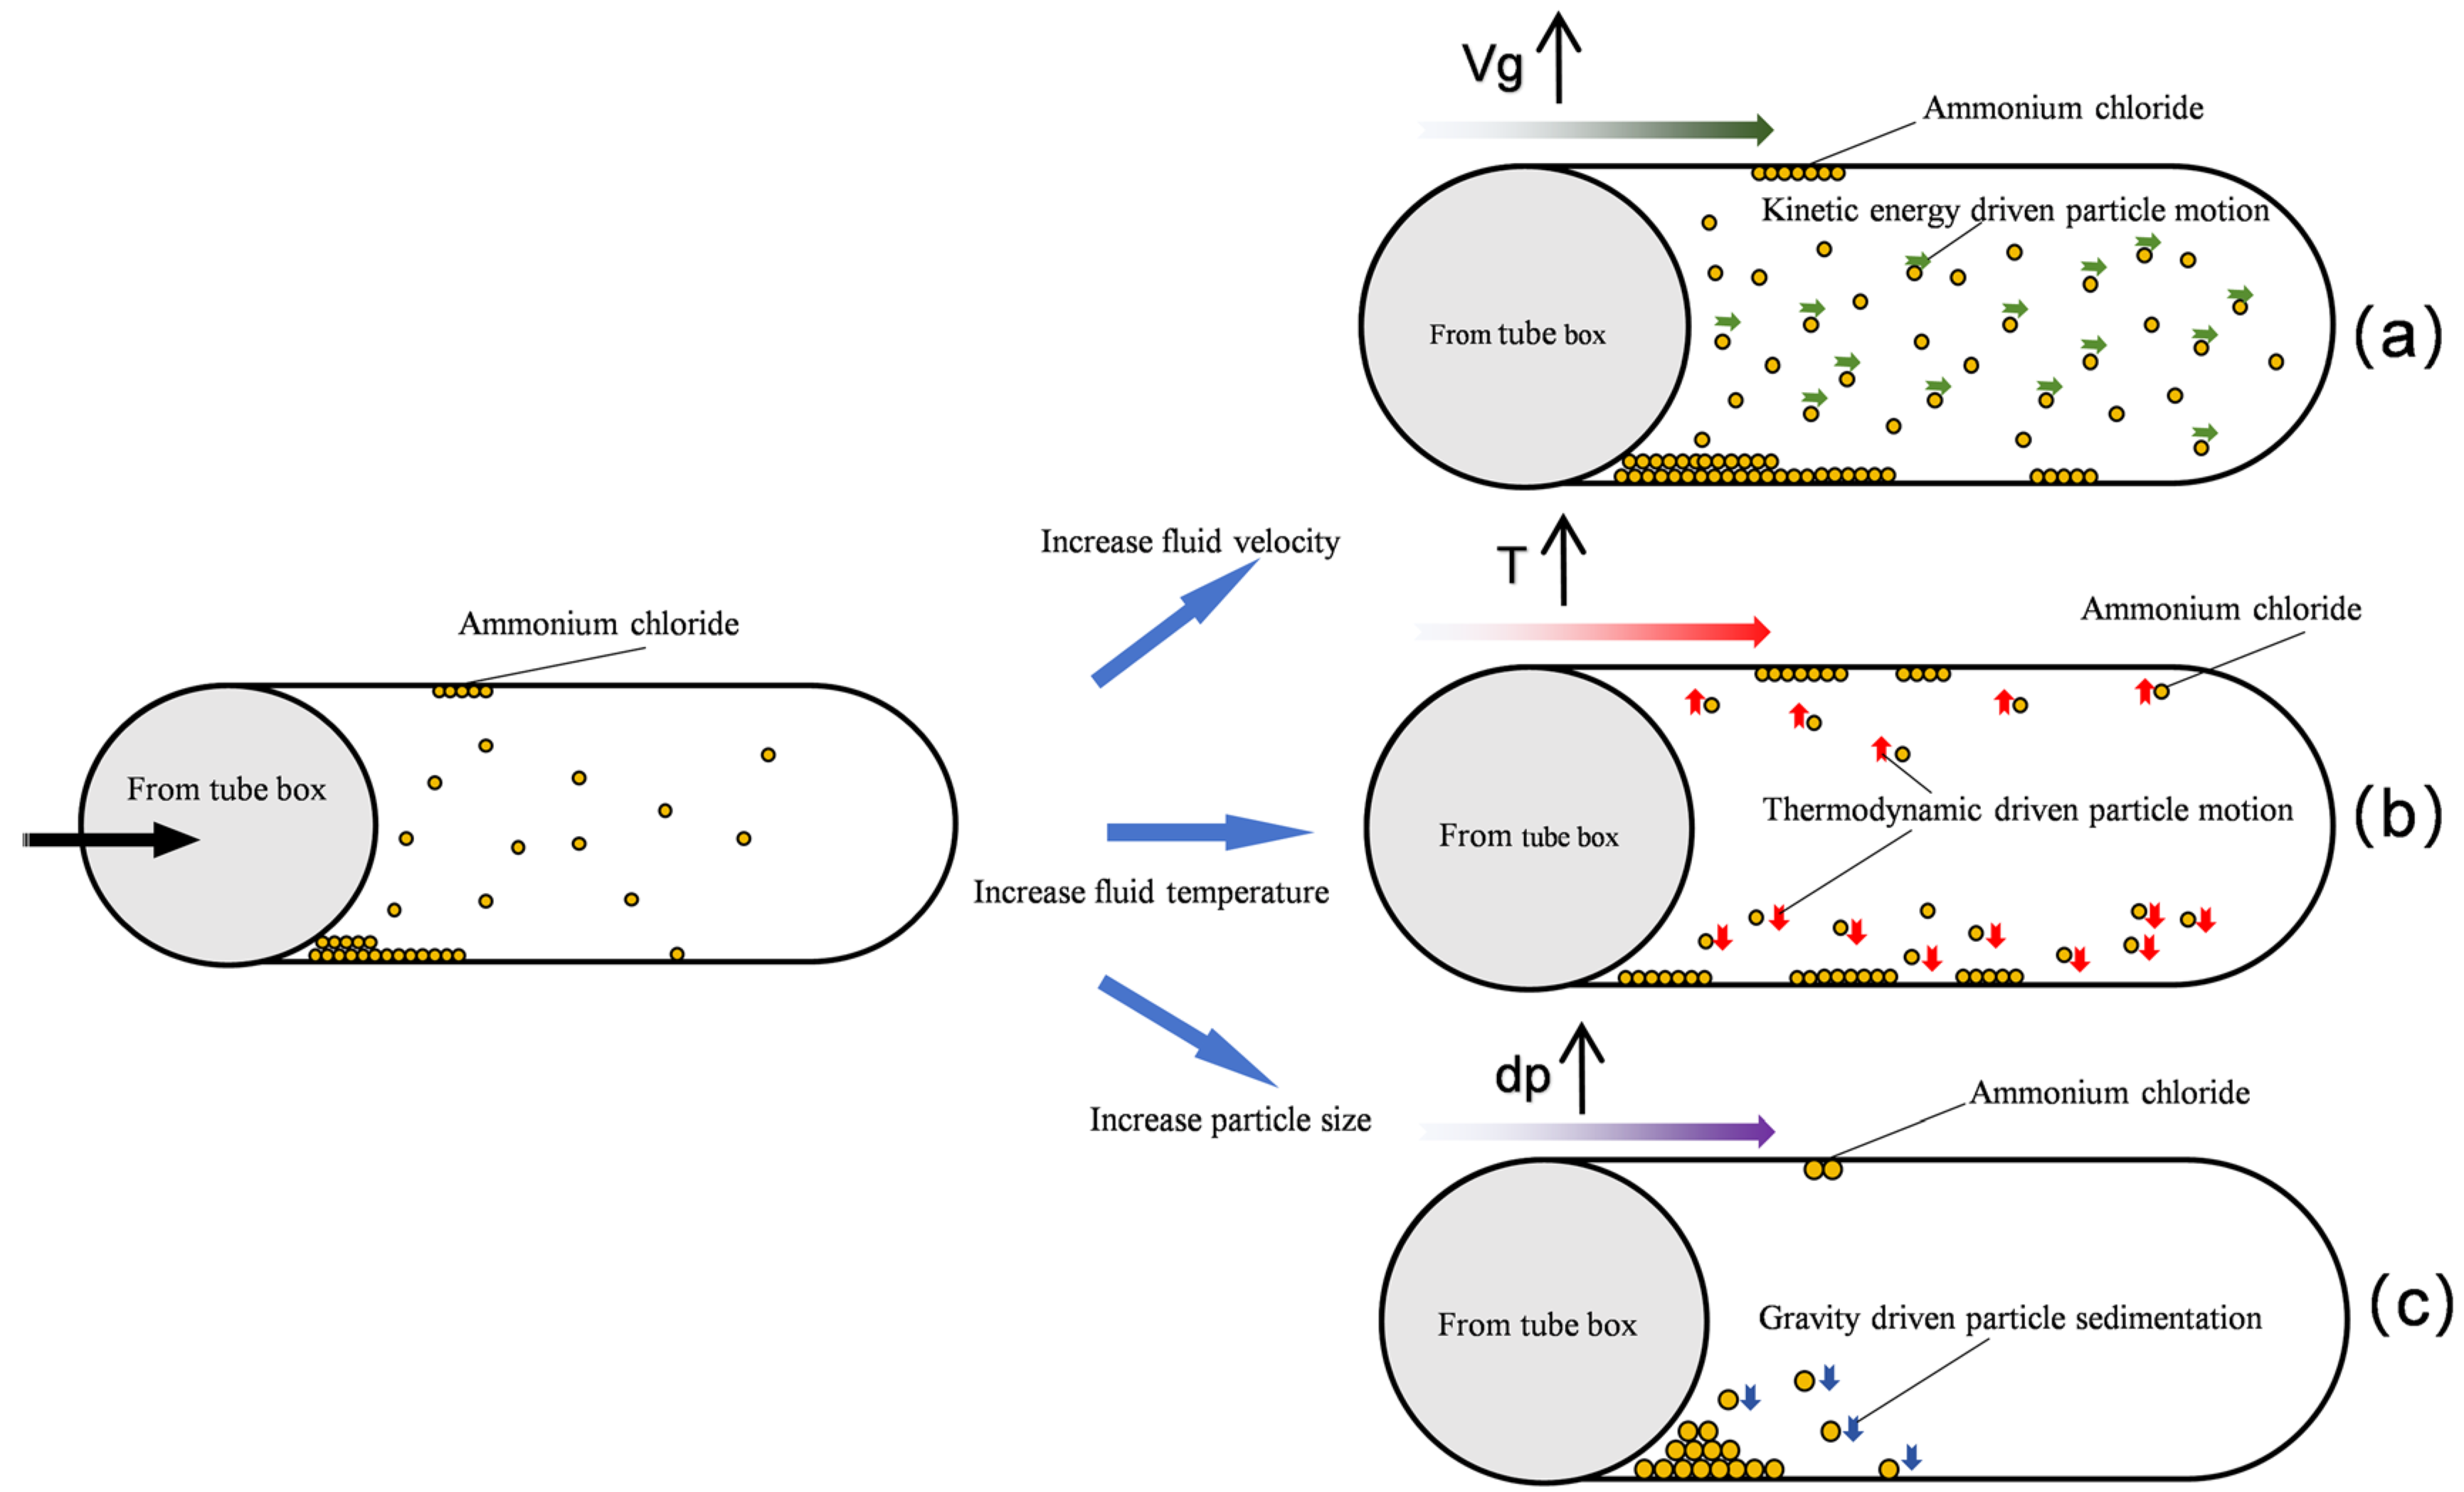
  • The fluid resistance governs the distribution of NH4Cl particles deposited within the air-cooler tube bundle. However, the particle size modulates the dominance of the fluid resistance, with larger particles indirectly diminishing its influence through inertial effects. Under the conditions of a fluid velocity of 2 m/s, particle size of 400–500 μm, and temperature of 393 K, the minimum deposition rate of particles (4.43385%) in the tube bundle was observed, which is attributable to the synergistic effects of larger particle sizes at lower flow velocities, which promoted preferential deposition in the tube box. In contrast, a significantly higher particle deposition rate of 63.91887% was recorded at an elevated fluid velocity (5 m/s), smaller particle sizes (100–200 μm), and a temperature of 373 K. The increased particle deposition is due to the finer particles being more effectively entrained by the high-velocity fluid, resulting in intensified particle transport and accumulation within the tube bundle.
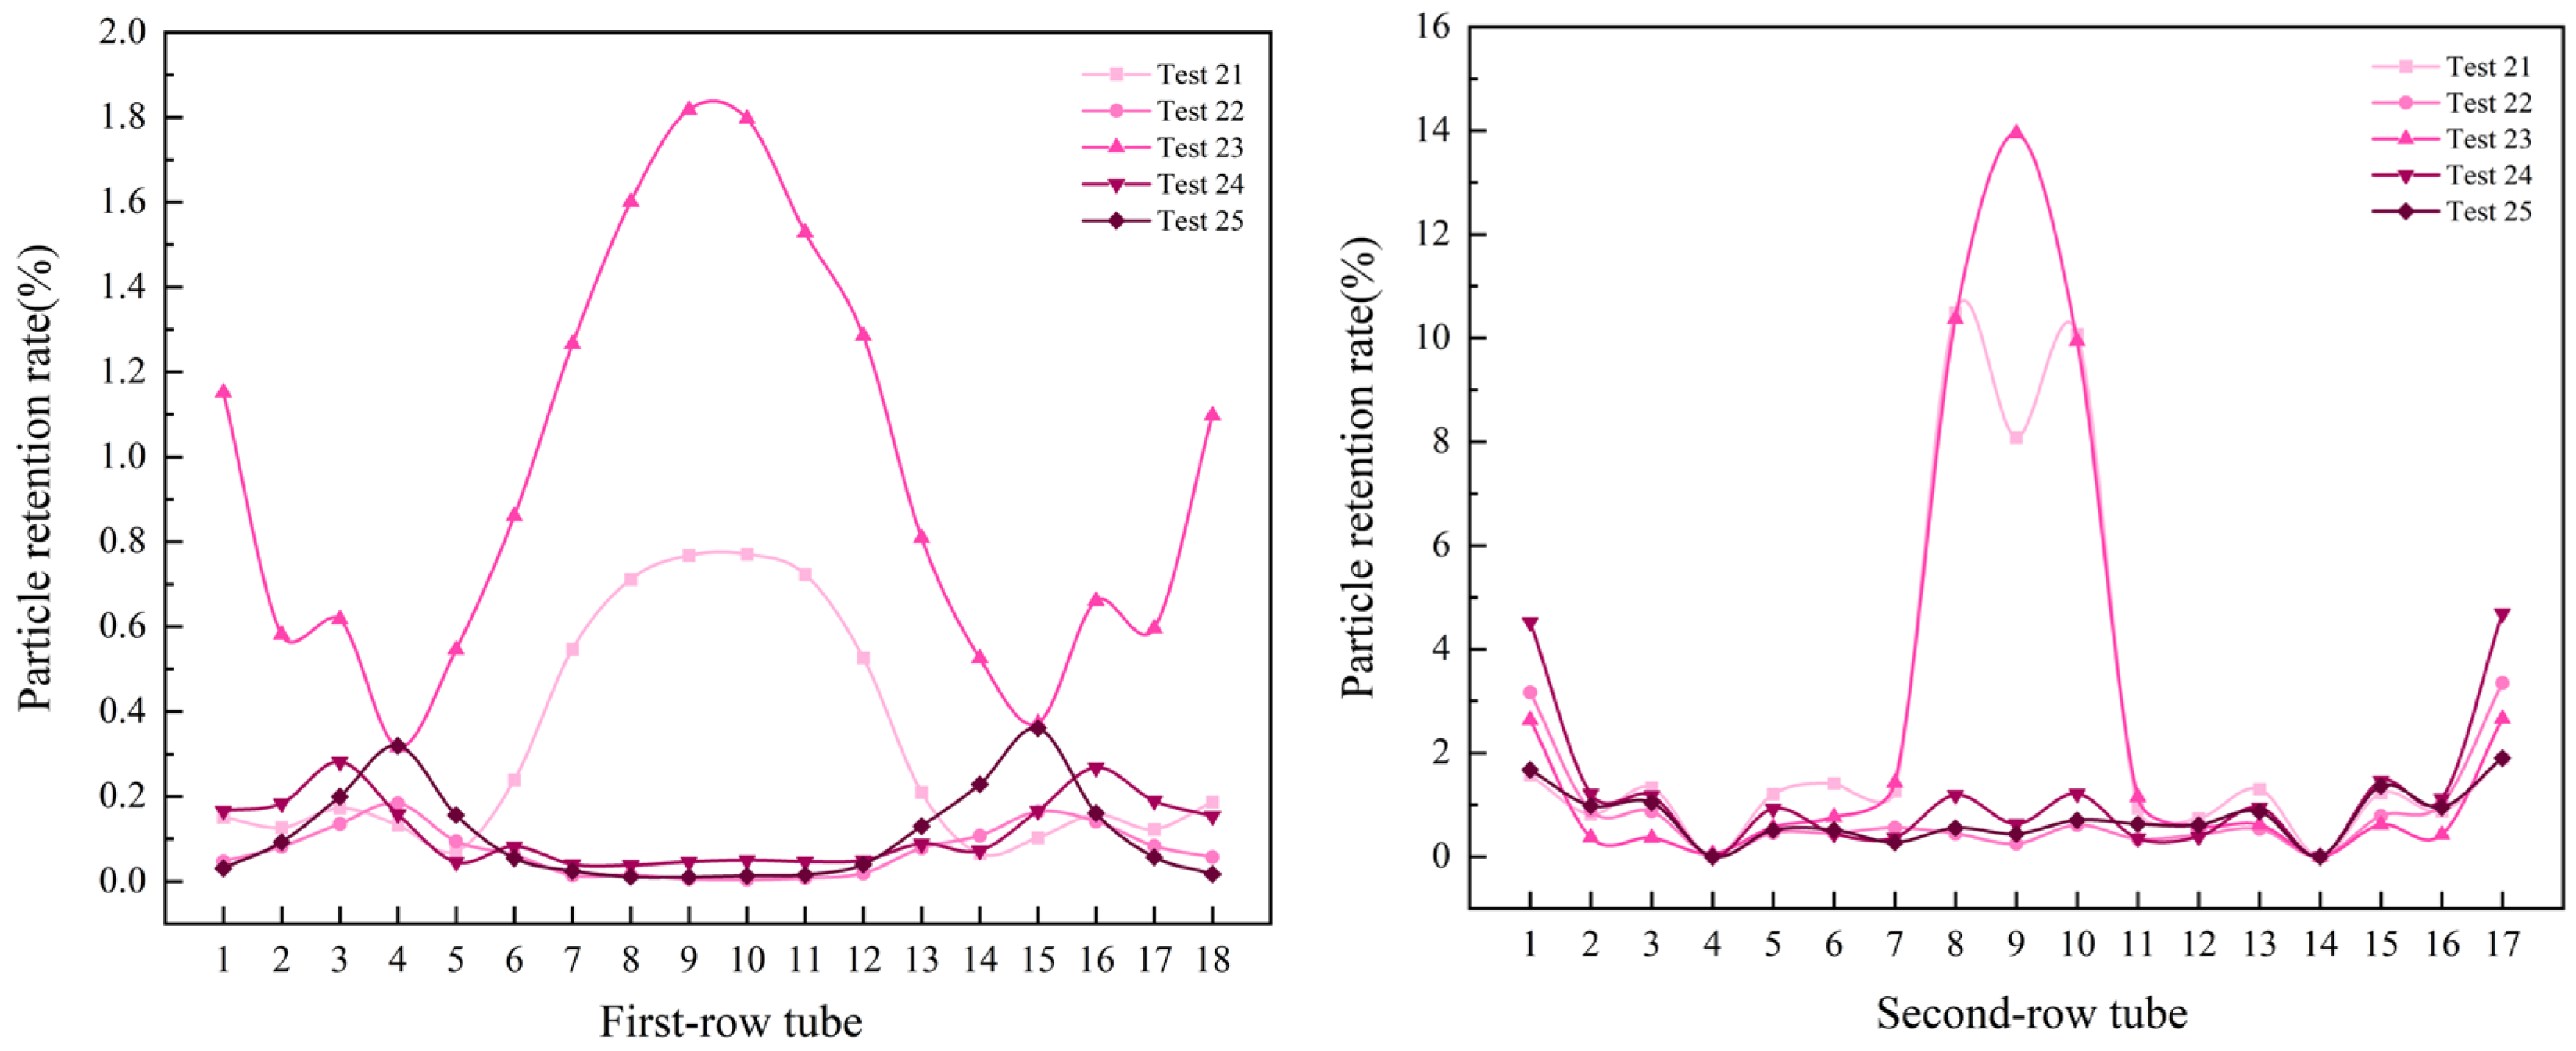
  • The numerical simulation provided the following key results: for double-tube-row structures, the particle residence rate in the second tube row is significantly higher than that in the first tube row, and the spatial distribution of particles is highly sensitive to operational parameters. Furthermore, as the flow velocity and inlet temperature increase, particles tend to accumulate in the central region of the tube rows. Notably, the key parameters that influence the particle deposition behavior in the two tube rows differ significantly. For the first tube row, the order of the factor importance is particle size > flow velocity > inlet temperature, whereas that for the second tube row has a distinct sequence of flow velocity > particle size > inlet temperature. This finding conclusively indicates that in complex multiphase flow systems, hydrodynamic factors exert a more dominant influence on the particle deposition behavior than temperature fields and particle properties, particularly in the second-row tube region.
  • The orthogonal experimental results were fitted with second-order polynomial and power-law equations. Between the two, the power-law equation provides superior accuracy in predicting the particle deposition rates. The power-law exponents revealed that for deposition rates in both the upper and lower tube rows, the gas velocity and temperature exhibit positive correlations, while the particle size shows a negative exponential relationship.
Overall, this study demonstrates the predictive assessment of blockage risks in air-cooler tube bundles under diverse industrial operating conditions using CFD-DEM coupled simulations. Moreover, the integration of experimental and computational approaches provides a validated framework for forecasting crystallization-driven deposition across full-flow-field systems. By leveraging the mechanistic dependences of particle deposition on the flow rate, particle size, and temperature, this study establishes a basis for optimizing maintenance scheduling and mitigating fouling-induced efficiency losses in gas-cooling applications.

Author Contributions

Conceptualization, H.J., W.C., F.C., S.X., C.W. and S.L.; methodology, H.J.; software, H.Y.; validation, H.Y.; formal analysis, H.Y.; investigation, X.L.; resources, H.J.; data curation, H.Y.; writing—original draft preparation, H.Y.; writing—review and editing, X.L. and S.L.; visualization, H.Y.; supervision, X.L.; funding acquisition, H.J. All authors have read and agreed to the published version of the manuscript.

Funding

This work is supported by the National Key Research and Development Program of China (No. 2023YFC3010501) , the Key Research and Development Project of Zhejiang Province (No. 2024C03122), the National Natural Science Foundation of China (No. 52176048) and the Fundamental Research Funds of Zhejiang Sci-tech University (No. 25242133-Y).

Data Availability Statement

The original contributions presented in this study are included in the article. Further inquiries can be directed to the corresponding author.

Conflicts of Interest

Authors Haozhe Jin, Wei Chen, Fengguan Chen, Shuangqing Xu were employed by the company Hefei General Machinery Research Institute Co., Ltd., Author Shuangquan Li was employed by the company Sinopec Guangzhou Engineering Co., Ltd. The remaining authors declare that the research was conducted in the absence of any commercial or financial relationships that could be construed as a potential conflict of interest.

Abbreviations

The following abbreviations are used in this manuscript:
CFDComputational Fluid Dynamics
CFD–DEMComputational Fluid Dynamics–Discrete Element Method
DEMDiscrete Element Method
JKRJohnson–Kendall–Roberts (contact model)
NH4ClAmmonium Chloride
PIDProportional–Integral–Derivative
PMMAPolymethyl Methacrylate
R2Coefficient of Determination
RMSERoot-Mean-Square Error

References

  1. Mao, Q.; Wang, Z.; Hu, Z.; Yang, Z.; Li, H.; Yao, Y.; Yong, Z.; Ma, T. Facial detection of formaldehyde by using acidichromic carbon dots and the reaction between formaldehyde and ammonium chloride. Chin. Chem. Lett. 2024, 35, 110499. [Google Scholar] [CrossRef]
  2. Chai, X.; Chen, L.; Xue, B.; Liu, E. Granulation of ammonium chloride fertilizer and agglomeration mechanism. Powder Technol. 2017, 319, 148–153. [Google Scholar] [CrossRef]
  3. Zhang, S.-S.; Fang, F.; Wang, P.; Zhao, L.-J.; Guo, Y.-Y.; Wang, R.-D.; Zhang, Z.; Du, L.; Zhao, Q.-H. High proton conductivity enhancement of post-modified 2D cadmium metal–organic frameworks with ammonium chloride. Inorg. Chem. Commun. 2024, 168, 112848. [Google Scholar] [CrossRef]
  4. Pereira Nicacio, J.A.; Castro Oliveira, F.; Rosa Dumont, M. Failure analysis and electrochemical testing of ammonium chloride corrosion in a heat exchanger in a diesel hydrotreating unit of a petroleum refinery. Eng. Fail. Anal. 2024, 156, 107758. [Google Scholar] [CrossRef]
  5. Akpanyung, K.V.; Loto, R.T.; Fajobi, M.A. An overview of ammonium chloride (NH4Cl) corrosion in the refining unit. J. Phys. Conf. Ser. 2019, 1378, 022089. [Google Scholar] [CrossRef]
  6. Ali, M.; Ul-Hamid, A.; Alhems, L.M.; Saeed, A. Review of common failures in heat exchangers—Part I: Mechanical and elevated temperature failures. Eng. Fail. Anal. 2020, 109, 104396. [Google Scholar] [CrossRef]
  7. Liu, D.; Hu, J.; Yuan, X.; Zhou, L.; Zhong, X. Failure analysis and experimental verification on the hydrogen-driven pitting corrosion of heat exchanger tube material. Eng. Fail. Anal. 2022, 137, 106283. [Google Scholar] [CrossRef]
  8. Zhu, H.; Jin, H.; Zhang, S.; Liu, X.; Wang, C. Numerical simulation and experimental studies on the ammonia absorption process by water injection in reaction effluent air cooler system. Chem. Eng. Sci. 2023, 269, 118455. [Google Scholar] [CrossRef]
  9. Li, R.; Wang, X.; Chen, J.; Wang, Y. Understanding of ammonium salts under-deposit corrosion: Electrochemical and AIMD investigations. Corros. Sci. 2024, 229, 111887. [Google Scholar] [CrossRef]
  10. Jin, H.; Yin, H.; Xu, S.; Chen, W.; Liu, X.; Jiang, Y. Experimental study on the deposition characteristics of ammonium chloride particles in a hydrogenation air cooler. Powder Technol. 2025, 452, 120533. [Google Scholar] [CrossRef]
  11. Vainio, E.; Yrjas, P.; Hupa, L.; Hupa, M. Cold-end corrosion caused by hygroscopic ammonium chloride in thermal conversion of biomass and waste. Fuel 2023, 346, 128061. [Google Scholar] [CrossRef]
  12. Liu, X.; Li, R.; Yao, H.; Jin, H.; Wang, C. Research on the corrosion mechanism of Q345R steel under water-oil two-phase flow with the HCl and NH4Cl corrosive medium in low-temperature system of petrochemical plants. Colloids Surf. A Physicochem. Eng. Aspects 2024, 703, 135360. [Google Scholar] [CrossRef]
  13. Xing, H.; Jin, H.; Liu, X.; Li, R.; Wang, M.; Xiang, H.; Wang, C. Effect of NH4Cl fouling on heat transfer process of heat exchange tube under forced convection condition. Int. J. Heat Mass Transf. 2023, 217, 124826. [Google Scholar] [CrossRef]
  14. Pudasaini, S.P. A fully analytical model for virtual mass force in mixture flows. Int. J. Multiph. Flow 2019, 113, 142–152. [Google Scholar] [CrossRef]
  15. Feng, Y.H.; Zhang, Z.; Qiu, L.; Zhang, X.X. Heat recovery process modelling of semi-molten blast furnace slag in a moving bed using XDEM. Energy 2019, 186, 115876. [Google Scholar] [CrossRef]
  16. Zbib, H.; Ebrahimi, M.; Ein-Mozaffari, F.; Lohi, A. Comprehensive analysis of fluid-particle and particle-particle interactions in a liquid-solid fluidized bed via CFD-DEM coupling and tomography. Powder Technol. 2018, 340, 116–130. [Google Scholar] [CrossRef]
  17. Fang, J.C.; Jiao, B.L.; Zhao, G.; He, L.; Wu, Y.N.; Dai, C.L. Study on the channel flow control regulation of particle agents in fractured-vuggy carbonate reservoirs via CFD-DEM coupling method. J. Petrol. Sci. Eng. 2019, 180, 495–503. [Google Scholar] [CrossRef]
  18. Wang, C.; Liu, M.; Yan, J. Flow irreversibility versus wear of elbow-reducer connection with gas-solid two-phase flow: A numerical study via CFD-DEM coupling method. Powder Technol. 2023, 428, 118835. [Google Scholar] [CrossRef]
  19. Gou, D.; Shen, Y. GPU-accelerated CFD-DEM modeling of gas-solid flow with complex geometry and an application to raceway dynamics in industry-scale blast furnaces. Chem. Eng. Sci. 2024, 294, 120101. [Google Scholar] [CrossRef]
  20. Metzger, J.P.; Mehring, C. Particle removal from solid surfaces via an impinging gas jet pulse: Comparison between experimental and CFD-DEM modeling results. J. Aerosol. Sci. 2024, 179, 106364. [Google Scholar] [CrossRef]
  21. Cundall, P.A.; Strack, O.D.L. A discrete numerical model for granular assemblies. Géotechnique 1979, 29, 47–65. [Google Scholar] [CrossRef]
  22. Kosinski, P.; Hoffmann, A.C. An extension of the hard-sphere particle-particle collision model to study agglomeration. Chem. Eng. Sci. 2010, 65, 3231–3239. [Google Scholar] [CrossRef]
  23. Breuer, M.; Almohammed, N. Modeling and simulation of particle agglomeration in turbulent flows using a hard-sphere model with deterministic collision detection and enhanced structure models. Int. J. Multiph. Flow 2015, 73, 171–206. [Google Scholar] [CrossRef]
  24. Zhu, H.P.; Zhou, Z.Y.; Yang, R.Y.; Yu, A.B. Discrete particle simulation of particulate systems: Theoretical developments. Chem. Eng. Sci. 2007, 62, 3378–3396. [Google Scholar] [CrossRef]
  25. Wang, G.; Yang, S.; Zhang, X.; Wang, H. Investigation of complex gas-particle flow characteristics in fluidizing process of non-spherical particles by CFD-DEM. Powder Technol. 2024, 445, 120068. [Google Scholar] [CrossRef]
  26. Zhang, G.; Mao, Y.H.; Liu, Z.X.; Chen, D.S.; Wu, F.; Lin, Z. Study on particle deposition in pipeline groove from gas–particle two-phase flow. Powder Technol. 2024, 438, 119630. [Google Scholar] [CrossRef]
  27. Wang, D.; You, Z.; Wang, M.; Li, Q.; Wu, L. Numerical investigation of proppant transport at hydraulic-natural fracture intersection. Powder Technol. 2022, 398, 117123. [Google Scholar] [CrossRef]
  28. Johnson, K.L.; Kendall, K.; Roberts, A.D. Surface energy and the contact of elastic solids. Proc. R. Soc. Lond. A 1971, 324, 301–313. [Google Scholar] [CrossRef]
  29. Mindlin, R.D.; Deresiewicz, H. Elastic spheres in contact under varying oblique forces. J. Appl. Mech. 1953, 20, 327–344. [Google Scholar] [CrossRef]
  30. Pasha, M.; Dogbe, S.; Hare, C.; Hassanpour, A.; Ghadiri, M. A linear model of elasto-plastic and adhesive contact deformation. Matter 2014, 16, 151–162. [Google Scholar] [CrossRef]
Figure 1. CFD-DEM coupling principle.
Processes 13 01816 g001
Figure 2. Air-cooler model and mesh configuration.
Processes 13 01816 g002
Figure 3. Schematic of the experimental setup.
Processes 13 01816 g003
Figure 4. (a) Schematic of flow-field velocity simulation. (b) Comparison of the experimental and numerical fluid flow velocities.
Processes 13 01816 g004
Figure 5. (a) Schematic of flow-field temperature simulation. (b) Comparison of experimental and simulated fluid temperatures.
Processes 13 01816 g005
Figure 6. (a) Schematic of the simulation of the ammonium chloride (NH4Cl) particle residence time. (b) Comparison of the experimental and numerical particle deposition rates.
Processes 13 01816 g006
Figure 7. Deposition rate of particles in each tube row under conditions 1–5 in Table 1.
Processes 13 01816 g007
Figure 8. Deposition rate of particles in each tube row under working conditions 6–10.
Processes 13 01816 g008
Figure 9. Deposition rate of particles in each tube row under working conditions 11–15.
Processes 13 01816 g009
Figure 10. Deposition rate of particles in each tube row under working conditions 16–20.
Processes 13 01816 g010
Figure 11. Deposition rate of particles in each tube row under working conditions 21–25.
Processes 13 01816 g011
Figure 12. Schematic of the range difference analysis for the first-row tube.
Processes 13 01816 g012
Figure 13. Schematic of the range difference analysis for the second-row tube.
Processes 13 01816 g013
Figure 14. Effects of different variables on tube-bundle deposition rate: (a) Flow rate, (b) temperature, and (c) particle size.
Processes 13 01816 g014
Table 1. Orthogonal experimental design.
Test PlanVg (m/s)T (K)dp (μm)DIDII
12.00353100–2000.20235.0911
22.00363300–4000.52424.7938
32.00373500–6000.09455.4510
42.00383200–3000.05364.3880
52.00393400–5000.08584.3480
62.75353500–6000.40496.5315
72.75363200–3000.17467.1435
82.75353500–6000.40496.5315
92.75383100–2000.802011.8854
102.75393300–4000.08654.4086
113.50353400–5000.33806.1459
123.50363100–2002.469213.8758
133.50373300–4000.777410.3134
143.50383500–6001.687511.3452
153.50393200–3002.581320.3427
164.25353300–4001.046513.3730
174.25363500–6000.889410.2492
184.25373200–3002.312216.1314
194.25383400–5001.506112.8981
204.25393100–20010.542638.1582
215.00353200–3005.678241.8306
225.00363400–5001.296914.1524
235.00373100–20017.424046.4879
245.00383300–4002.122420.6385
255.00393500–6001.918913.0158
Table 2. Range analysis for particle deposition in the first-row tube.
TermLevelVg (m/s)T0 (K)dp (μm)
K-value10.967.6731.44
21.645.3510.80
37.8520.784.56
416.306.173.40
528.4415.225.00
K-avg-value10.191.536.29
20.331.072.16
31.574.160.91
43.261.230.68
55.693.041.00
The best level531
R5.503.095.61
Level quantity555
Number of replicates per level, r5.05.05.0
Table 3. Range analysis for particle deposition in the second-row tube.
TermLevelVg (m/s)T0 (K)dp (μm)
K-value124.0372.97115.50
235.9050.2189.80
362.0284.7153.13
490.8161.1243.87
5136.1379.8746.59
K-avg-value14.8114.5923.10
27.1810.0417.96
312.4016.9410.63
418.1612.228.77
527.2315.979.32
The best level531
R22.426.9014.32
Level quantity555
Number of replicates per level, r5.05.05.0
Disclaimer/Publisher’s Note: The statements, opinions and data contained in all publications are solely those of the individual author(s) and contributor(s) and not of MDPI and/or the editor(s). MDPI and/or the editor(s) disclaim responsibility for any injury to people or property resulting from any ideas, methods, instructions or products referred to in the content.

