Article

Examining the Key Denitrifying Bacterial Community Structure and Individual Proliferation of Activated Sludge in Wastewater Treatment Plants Operating at Low Temperatures

Key Laboratory of Songliao Aquatic Environment, Ministry of Education, Jilin Jianzhu University, Changchun 130118, China
*
Author to whom correspondence should be addressed.
Processes 2025, 13(6), 1814; https://doi.org/10.3390/pr13061814
Submission received: 20 April 2025 / Revised: 28 May 2025 / Accepted: 5 June 2025 / Published: 7 June 2025
(This article belongs to the Special Issue Microbial Bioremediation of Environmental Pollution (2nd Edition))

Abstract

:
To analyze the microbiological mechanisms of biological denitrification during low-temperature operations, continuous sampling of influent and activated sludge samples was conducted at the Changchun Municipal Wastewater Treatment Plant. The relative abundance and absolute gene abundance of ammonia-oxidizing bacteria, ammonia-oxidizing archaea, and denitrifying bacteria were determined using high-throughput sequencing technology and reverse transcription–polymerase chain reaction (RT–PCR) technology, respectively. Nitrosomonas and Nitrosospira were the dominant bacteria in ammonia-oxidizing bacteria; the detection rate was 100%; and the abundance distribution fluctuated greatly. The percentages of net proliferation rate greater than −0.05 were 75% and 62.5%, respectively, but the temperature effect was not obvious. The detection rate of Nitrosomonadaceae (norank) was 76.67%, and the percentage of net proliferation rate greater than −0.05 was 50%. The growth of ammonia-oxidizing archaea was limited at low temperature, and the abundance of most bacteria fluctuated greatly. The frequencies of net proliferation rate of Crenarchaeota (norank), Thaumarchaeota (norank), and Nitrososphaera greater than −0.05 were more than 50%. Of the 20 OUTs of denitrifying bacteria, 16 had a net increment rate greater than −0.2/d with a frequency greater than 50 per cent, of which Sinorhizobium and Alphaproteobacteria were detected with a frequency of 100% in activated sludge. The frequency of AOB and denitrifying bacteria net proliferation rate greater than zero during the low-temperature period was relatively high, which ensured the smooth progress of the denitrification process and reasonably explains the microbiological mechanism. In addition, it can be inferred that the migration of influent microorganisms can shape the population structure of denitrifying bacteria, as the net proliferation rate of most bacterial populations was less than 0.

1. Introduction

As a biological method in the wastewater treatment process, the activated sludge process relies on the degradation effect of microorganisms for its effectiveness [1,2]. Microorganisms are the primary reactants that maintain the stable operation of the treatment system. The microorganisms present in the wastewater during the treatment process play a vital role in removing and metabolizing conventional pollutants, such as carbon, nitrogen, phosphorus, and other pollutants [3]. The microbial population and structure of activated sludge are closely related to environmental factors, among which temperature is an important influencing factor [4,5,6,7,8]. Generally, temperature affects the fluidity of cell membranes; as the temperature increases, the fluidity of the membrane becomes greater, which is conducive to the transport of substances. The absorption rate of nutrients and secretion of metabolites by microorganisms is faster, and the growth and reproduction rate of microorganisms are also accelerated. Meanwhile, temperature is related to the catalytic activity of enzymes, with higher temperatures indicating stronger activity. The suitable growth temperature for microorganisms is relatively broad, with −10~95 °C being the temperature range ideal for the growth and reproduction of most microorganisms. Microorganisms are divided into psychrophilic bacteria, thermophilic bacteria, and normal temperature bacteria according to their growth temperature. The optimum growth temperature of normal temperature bacteria is about 20 °C; The microorganism with the optimum growth temperature ≤ 15 °C is psychrophilic; Some bacteria and archaea live in extreme environments such as geothermal hot springs and are classified as thermophilic bacteria [9]. While most microorganisms in activated sludge are normal temperature bacteria, certain specialized microbes are also present, including microfilamentous bacteria and ammoxidation archaea. In some cases, these groups can become dominant. For example, the abundance of microfilaria has been observed to increase significantly during low-temperature periods in winter. Water temperatures below 10 °C can be confirmed as a low-temperature habitat in the biological wastewater treatment process [10,11,12,13,14,15,16].
Ammonia-oxidizing bacteria, ammonia-oxidizing archaea, and denitrifying bacteria are widely present in urban wastewater biochemical treatment systems. They are the main participants in nitrification and denitrification reactions as well as essential contributors to the denitrification process of wastewater treatment systems. Numerous research reports indicate that the denitrification process in wastewater biochemical treatment systems generally operates stably within the temperature range of 20 °C to 30 °C. When the temperature drops below 15 °C, the nitrification and denitrification reaction rates tend to decrease [17,18,19,20,21,22]. This is related to the physiological and ecological properties of nitrifying bacteria and denitrifying bacteria and also can be explained by nitrification and denitrification kinetics. The temperature coefficients of reaction rate constants in nitrification and denitrification processes are 1.10 and 1.08, respectively, indicating that the reaction rate is related to temperature, and the nitrification reaction is more affected by temperature. However, according to a large number of reports on the operational conditions of wastewater plants, the compliance rates of ammonia nitrogen and total nitrogen in low-temperature wastewater plants have not been significantly reduced.
To analyze the principles and deepen the understanding of biological denitrification, in this study, activated sludge samples were collected from sewage treatment plants operating in cold regions in winter in chronological order. From the perspective of microbial ecology, this paper discussed the temporal variation law of AOB, AOA and denitrifying bacteria abundance in sewage plants, and the shaping effect of influent microbial population migration on denitrifying bacteria during low temperatures. This study aimed at providing a scientific basis for the adjustment of operating parameters such as sludge age during low-temperature operations of sewage plants. This article critically examined the influent and activated sludge of a municipal wastewater treatment plant in Changchun City by sampling during low-temperature operations. A high-throughput sequencing technology and real-time quantitative polymerase chain reaction (PCR) technology were used to detect the relative abundance and absolute abundance of ammonia-oxidizing bacteria, ammonia-oxidizing archaea, and denitrifying bacteria, respectively. The structure and abundance distribution of the microbial community were studied. Using the principle of material balance, the individual net proliferation rate of the population was calculated and determined, and the influence of influent microorganisms on the microbial community structure of activated sludge was determined.

2. Materials and Methods

2.1. Wastewater Treatment Plant Description and Sampling

This study used the municipal wastewater treatment plant in Changchun City as a research object. Changchun is located at 124°118′–127°02′ E longitude and 43°05′–45°15′ N latitude. It is located in a temperate continental monsoon climate region with an extensive annual temperature range. Correspondingly, the wastewater temperature has a variable temperature period, with a low temperature period of up to 5 months. The total catchment area of the wastewater treatment plant is 81.6 km2, with industrial wastewater accounting for about 50% and contributing approximately 70% to the organic matter (represented by chemical oxygen demand (COD)) in the influent. The main body adopts an improved A2O process, and the effluent meets the Class A standard of the “Pollutant Discharge Standards for Urban Wastewater Treatment Plants” (GB18918–2002) [23].
From 1 November 2023 to 12 March 2024, activated sludge samples were collected from the end of the aerobic zone of the improved A2O reaction tank every 5 days. Three samples were collected in September 2023 to form a comparison, making a total of 30 samples. The collected activated sludge samples were first centrifuged at 4000 rpm for 7 min, and the concentrated sludge was stored in a −80 °C freezer for subsequent DNA extraction.
To study the effect of influent-denitrifying bacteria on the activated sludge community, activated sludge samples and water samples were collected every 10 days from 10 November 2023 to 30 January 2024 from the influent channel of the biochemical tank to detect the structure of denitrifying bacteria. The absolute abundance was determined using quantitative PCR.

2.2. DNA Extraction and High-Throughput Sequencing

The centrifuged activated sludge samples were cold-dried, and then 0.5 g of cold-dried sludge was extracted using the FastDNA® SPIN Kit by MP company for the Soil kit (Bio 101, Vista, CA, USA). Three parallel sets, each 75 μL, were used to extract DNA. The integrity of DNA was detected by 1% agarose gel electrophoresis, and the ultramicro-spectrophotometer NanoDrop2000 (Thermo Fisher Scientific, Waltham, MA, USA) was used to evaluate the quality of DNA according to A260/A280 nm and A260/A230 nm values. If A260/A280 nm is greater than 1.8 and A260/A230 nm is greater than 2, then the extracted DNA has high purity and can be used for subsequent analysis.
The primers of key functional genes of ammonium-oxidizing bacteria, ammonium-oxidizing archaea, and denitrifying bacteria were used for the PCR. The primers and amplification procedures are shown in Table 1. During PCR amplification, agarose, 50 × TAE and Goodviewna II dyes were purchased from Harbin Xing Microbiological Technology Co., Ltd., Harbin, China; Agarose recovery and purification kit (TaKaRa Agarose Gel DNA PurificationKit Ver. 2.0), DL500 DNA Marker, conventional PCR amplification kit (TaKaRa EX Taq) and real-time fluorescence quantitative reagent kit (Premix Ex Taq) were purchased from Xi’an Hongxin Biotechnology Co., Ltd., Xi’an, China. The amplified PCR products were detected and purified, and then the library was constructed and sequenced according to the operating procedures of the Illumina MiSeq platform (Majorbio, Shanghai, China). The quality control and optimization of the sequences returned from high-throughput sequencing were performed by Qiime (version 1.9.1), and the OTU clustering was performed according to 97% similarity. The denitrifying bacteria in each sample were identified in the microbial database NCBI.

2.3. Real-Time Quantitative PCR Technology

To determine the absolute abundance of key functional genes of denitrifying bacteria in influent and activated sludge, qPCR amplification of AOA amoA, AOB amoA, and nirK functional genes was performed using DNA extracts as templates. The quantitative PCR was performed using the SYBR Green I staining method and the SYBR Premix Ex TaqTM kit (TaKaRa, Dalian, China). The experiment was conducted on an ABI 7500 Real-Time PCR System (Applied Biosystems, Foster, CA, USA). Primers and amplification conditions are shown in Table 2.

3. Results and Discussion

3.1. Operation Conditions of the Wastewater Treatment Plant

The municipal wastewater treatment plant in Changchun has been operating stably for 8 years. While collecting samples, the plant staff provided daily operational data on inlet and outlet water concentration indicators and critical environmental factors. The concentrations of main water quality indicators such as suspended solid (SS), five-day biochemical oxygen demand (BOD5), total nitrogen (TN), and total phosphorus (TP), as well as activated sludge indicators such as mixed liquid suspended solids (MLSS) and sludge volume index (SVI), were determined according to the standard detection methods specified by China. The sludge retention time (SRT), hydraulic retention time (HRT), SVI, and BOD sludge load values were calculated using the operation data, as shown in Figure 1. Flow rate, dissolved oxygen (DO), pH, oxidation reduction potential (ORP), etc., were measured by an online detector. During the sampling period, the hydraulic retention time of the wastewater treatment plant was above 20 h, and the BOD sludge load varied within the range of 0.077–0.181 kgBOD/(kgMLSS·d), indicating good carbon and nitrogen removal effects. After improving the A2O process, an efficient clarification tank and fiber filter cloth filter were set up, and polyaluminum chloride and polyacrylamide were added to ensure the removal efficiency of SS and phosphorus. Therefore, the compliance rate of various indicators during operation was very high, close to 100%.
As shown in Figure 1, the wastewater temperature changed significantly during the sampling period, dropping from 22.1 °C to 7.7 °C. Due to the decrease in temperature, the growth rate of most microorganisms decreased. The remaining sludge discharge was reduced to ensure sufficient biomass in the biological system, and the sludge age was extended from October. In addition, it can be seen from the figure that in January, when the temperature was the lowest, sludge bulking occurred briefly. There was foam on the surface of the biochemical tank, but it had no adverse effect on the treatment process.
A comprehensive analysis of wastewater quality, main processes, operating parameters, and effluent standards concluded that the research object was a typical urban wastewater treatment plant in mid- to high-latitude regions, and the research results were universal.

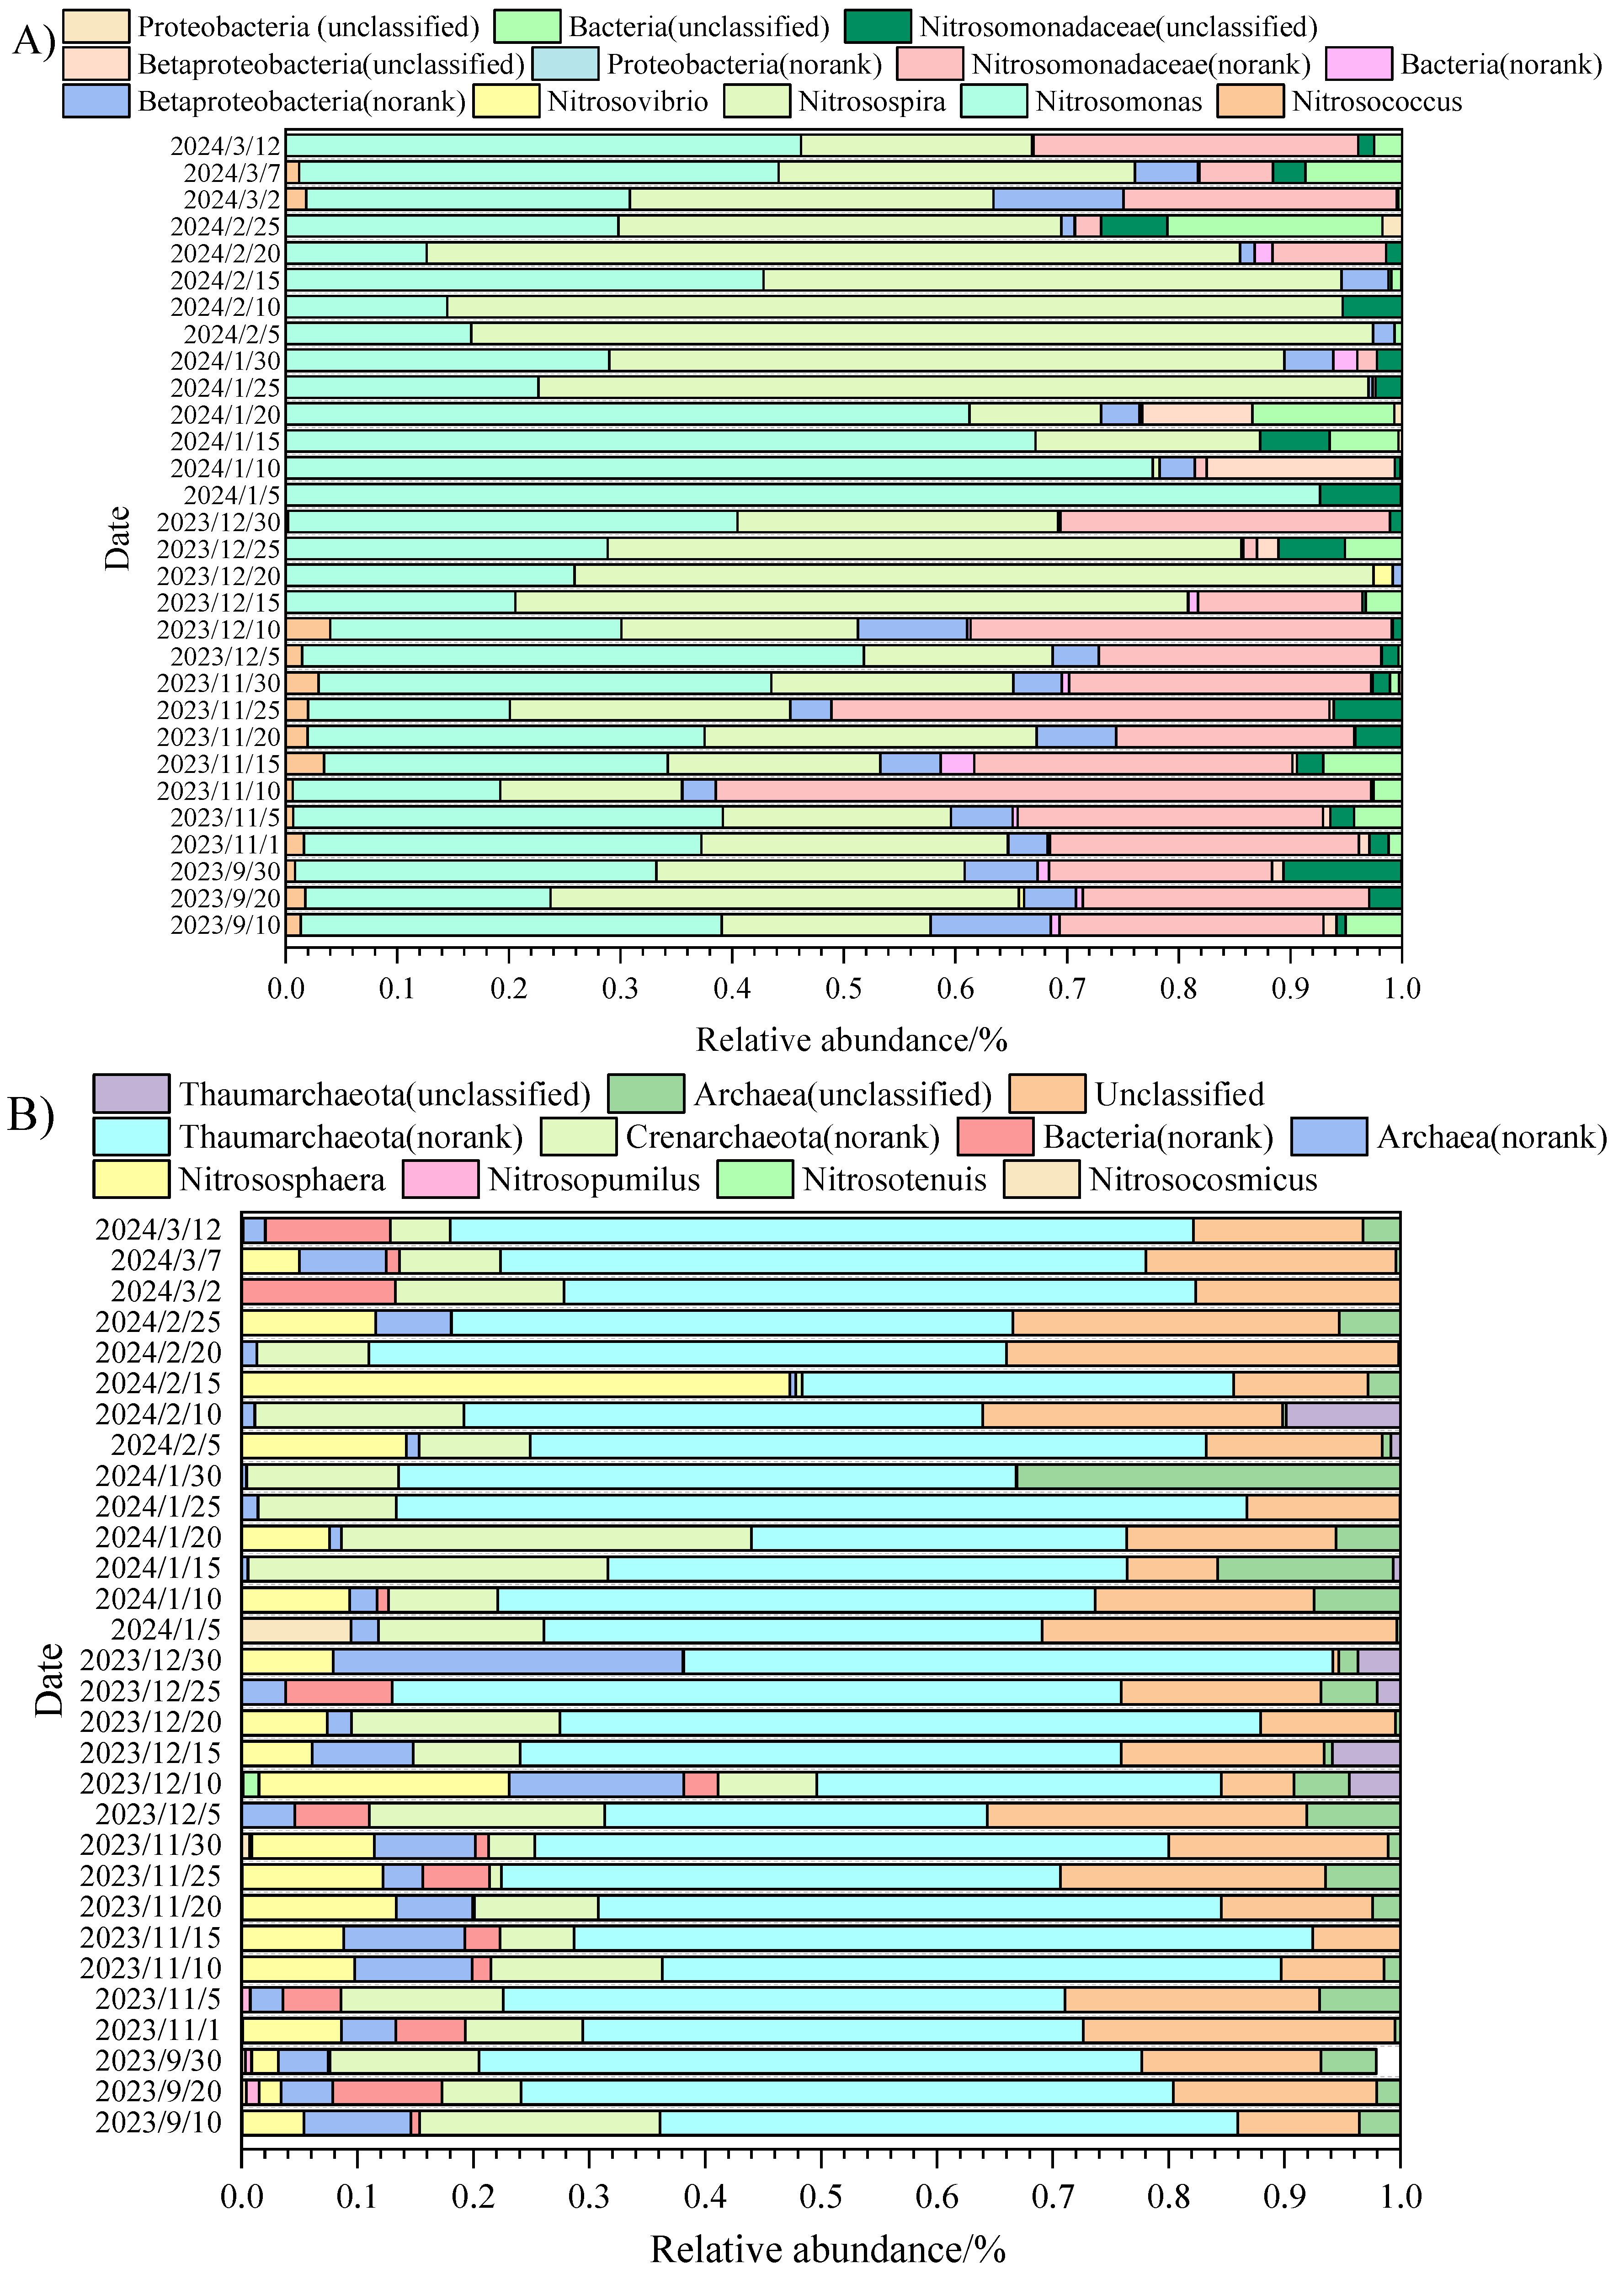
3.2. The Structure of AOA, AOB, and Denitrifying Bacteria During the Low Temperature Period

The results of high-throughput sequencing and species annotation of the functional gene amoA of AOB in activated sludge are shown in Figure 2A. The relative abundance in the figure is the percentage of sequences from different bacterial genera of the total number of AOB amoA gene sequences. In this process, 12 OUTs were detected, of which 10 species of bacteria were annotated, and the remaining 2 species were not found or had no clear taxonomic information. The figure shows that among the 10 species, Nitrosomonas and Nitrosospira were dominant bacterial genera with a detection frequency of 100% and an abundance greater than 10%, but with significant fluctuations, especially for Nitrosospira. However, there was no noticeable temperature effect on the distribution of abundance fluctuations in the two bacterial genera. Nitrosomonas and Nitrosospira are common and widely present ammonia-oxidizing bacteria that contribute significantly to natural nitrogen cycling processes. They are key bacterial genera in most nutrient removal wastewater treatment systems [24,25,26,27,28]. The abundance of another ammonia-oxidizing bacterium, Nitrosomonadaceae, is also relatively high with the value of 90% in activated sludge, but the abundance distribution of this genus is significantly affected by temperature. The detection frequency and abundance decreased significantly after entering the coldest months of December and January in the north. Therefore, this bacterium was the dominant ammonia-oxidizing bacterium in wastewater treatment plants that operate at suitable temperatures. Other bacteria, such as Betaproteobacteria, had a higher detection frequency but lower abundance, and their contribution to the nitrification reaction was unclear. After entering the coldest month, Nitrococcus disappeared from the activated sludge, while before September and December, although its abundance was low, it was still detected. The detection frequency and abundance of other AOB bacterial genera were relatively low.
The high-throughput sequencing and species annotation results of the AOA functional gene amoA in activated sludge are shown in Figure 2B. The relative abundance in the figure is the percentage of sequences from different bacterial genera of the total number of AOA–amoA gene sequences. Most ammonia-oxidizing archaea in the activated sludge belong to Thaumarchaeota, with a detection frequency of 100%, the highest abundance, no significant fluctuations, and no temperature effect. The second highest abundance and detection frequency was Crenarchaeota, which had lower abundance and significant fluctuations than Thaumarchaeota, but which had no temperature effect. The annotated ammonia-oxidizing archaea related to the nitrification function include Nitrososphaera, Nitrosopumilus, Nitrosotenuis, and Nitrosocosmicus. Among them, Nitrososphaera had a detection frequency of 73.33% and an abundance of around 0.01–47.23%, with significant fluctuations. The detection rate decreased significantly during the lowest temperature period in December and January. The abundance of the other three bacterial genera was less than 0.1%, with low detection frequency and almost no detection during the lowest temperature period.
The high-throughput sequencing and species annotation results of nirK functional genes in activated sludge are shown in Figure 2C. The relative abundance in the figure is the percentage of sequences from different bacterial genera of the total number of nirK gene sequences. The figure shows that at least half of the gene sequences in each activated sludge sample were not annotated, classified as Bacteria, and showed significant abundance fluctuations. This group of bacteria exhibited high abundance, so it can be inferred that they had a great contribution to the denitrification process, and they could be used as the focus of future research. In addition, although the common bacterial genera in wastewater treatment systems contributed significantly to the denitrification process, such as Bosea, Ochrobactrum, Rhizobium, Paracoccus, Sinorhizobium, and Alphaproteobacteria, had a detection frequency of 100%, their abundance was low, even less than 0.01%, with apparent fluctuations and no significant temperature effect.

3.3. Effects of Influent Denitrification Microorganisms on the Structure of Key Denitrification Bacteria in Activated Sludge

The wastewater treatment plant is an open system, and the microorganisms in the activated sludge come from the migration of influent microorganisms. There are three types of microorganisms in the influent: (1) those that adapt to the biochemical pool environment for growth and reproduction; (2) those that do not adapt to the biochemical pool environment but still exist in the activated sludge due to the large number and high migration rate in the influent; and (3) those that do not adapt to the biochemical pool environment and are eliminated [29]. To investigate the direct impact of influent-denitrifying microorganisms on the structure of denitrifying bacterial communities in activated sludge, samples were collected from the influent channel of the biochemical tank in Changchun Municipal Wastewater Treatment Plant. High-throughput sequencing technology was used to detect the abundance of AOB, AOA, and denitrifying bacteria. The absolute gene abundance was determined using real-time quantitative PCR technology; the net proliferation rate was calculated using the material balance principle to determine the growth degree of the influent denitrification bacteria community and evaluate the relationship with the denitrification function of the system.
The net growth rate of an individual population can be described by its growth rate minus its decay rate. If it is assumed that the growth and decline are described by a first-order process and the system is in a stable state, there is no net change in the number of cells in the activated sludge biomass, and the cumulative amount is zero. Therefore, the net growth rate k of individual population is calculated by Formula (1), and the calculation method and process were described in the literature [1]. The absolute gene abundance of denitrifying bacteria was measured using real-time quantitative PCR technology. Since the sludge age of the wastewater treatment plant was about 25 days, the interval between the influent and AS data was 30 days during the calculation process. The operating parameters, such as the flow rate involved in the formula, depended on the wastewater treatment plant. Therefore, the daily operating data and indicators were collected while collecting samples, as shown in Table 3.
k x = P x , A S n e w P x , i n w n i n w P x , A S n A S
n i n w = Q · S S · G i n w
n e w = X · G A S
n A S = X · V · G A S
where
  • nAS—activated sludge AOB, AOA, denitrifying bacteria, absolute abundance of genes measured by real-time quantitative PCR;
  • Ginw—absolute abundance of AOB, AOA, and denitrifying bacteria genes in the influent, ×106 copies/g SS;
  • GAS—absolute abundance of AOB, AOA, and denitrifying bacteria genes in activated sludge, ×106 copies/g dry sludge;
  • Px,AS—relative abundance of various denitrifying microorganisms in activated sludge (%);
  • ninw—the amount of AOB, AOA, and denitrifying bacteria entering the system with wastewater every day, calculated based on the absolute abundance of genes determined by real-time quantitative PCR;
  • Px,inw—relative abundance of various denitrifying microbial genera in the influent (%);
  • new—AOB, AOA, and denitrifying bacteria in excess sludge, calculated based on the absolute abundance of genes determined by real-time quantitative PCR;
  • Q—water inflow, m3/d;
  • SS—SS concentration in the influent, mg/L;
  • ΔX—residual sludge discharge, ×103 kg/d;
  • X—mixed liquor suspended solids, mg/L;
  • V—effective volume of an improved A2O process biochemical pool, 35,250 m3.
Table 3. Operational data and performance indicators of the wastewater treatment plant on the days of inflow and activated sludge sampling.
Date (Influent)Date (AS)Q (m3/d)SS (mg/L)MLSS (mg/L)Excess Sludge (×103 kg/d)
20 November 202320 December 2023144192183469923.22
30 November 202330 December 2023145440214553523.53
10 December 202310 January 2024144256185509222.26
20 December 202320 January 2024143712204444822.20
30 December 202330 January 2024143328221457822.42
10 January 202410 February 2024144192283505521.81
20 January 202420 February 2024156512274465421.26
30 January 202430 February 2024156832264483222.49

3.3.1. Relative Abundance of Denitrifying Bacteria in Influent

The results of the abundance analysis of key denitrifying bacteria in the biochemical pool inlet channel of Changchun Municipal Wastewater Treatment Plant are shown in Figure 3. From the figure, it can be seen that the AOB bacterial community structure in the influent was relatively stable. Nitrosomonas, Nitrosompira, Nitrosomonadaceae, and three other AOBs were dominant bacterial genera with a detection rate of 100%. The abundance of Nitrosomonas did not fluctuate significantly, while the other two showed significant changes. Thaumarchaeota had an absolute advantage among the AOA flora in the inlet, followed by Crenarchaeota. Nitrososphaera were detected in all seven samples, with abundance fluctuating between 4.04 and 17.57%, while the detection rate and abundance of other common ammonia-oxidizing archaea were relatively low. In the denitrifying bacteria in the influent, the proportion of unidentified sequences was relatively large, similar to that in activated sludge. The detection rate of eight bacterial genera, including Ochrobactrum, Paracoccus, Rhizobium, Alphaproteobacteria, Rhizobiaceae, Rhodobacteraceae, Rhizobiales, and Proteobacteria, was 100%, with low abundance and minor changes. The population structure and dominant species of denitrifying bacteria in the influent were consistent with those in the activated sludge. It can be inferred that most of the denitrifying microorganisms in the activated sludge came from the influent.

3.3.2. Absolute Abundance of Key Functional Genes in the Denitrification Process

To determine the variation pattern of the number of denitrifying bacteria in activated sludge during the low-temperature period, real-time quantitative PCR technology was used to amplify the functional genes of AOA amoA, AOB amoA, and nirK using DNA extracts as templates. Three biological replicates were performed for each DNA sample to determine the absolute abundance. The amplification efficiency of qPCR analysis ranged from 92.99% to 99.74%, with R2 values between 0.997 and 0.998. The measurement results are shown in Figure 4. From the graph, it can be seen that the absolute abundance of AOB amoA genes in the influent and activated sludge was within the range of (0.52–0.89) × 106 copies/g and (0.81–1.39) × 106 copies/g, respectively, and remained stable. The AOA amoA gene in the influent fluctuated wildly and showed a decreasing trend over time, with the highest value reaching 2.47 × 10⁶ copies/g and the lowest value being 0.34 × 10⁶ copies/g. The same change pattern was also observed in activated sludge, with a minimum value of 0.41 × 10⁶ copies/g and a maximum value of 2.94 × 10⁶ copies/g, except for 10 December 2023. The nirK gene in the influent and activated sludge was much higher than that in AOB and AOA, and the absolute abundance values varied greatly, ranging from 3.44–11.26 × 10⁶ copies/g to 7.71–17.66 × 10⁶ copies/g, respectively. The results showed that the inflow of microorganisms was affected by the low temperature, and the growth and reproduction of ammonia-oxidizing bacteria were limited, resulting in a decrease in abundance. Ammonia-oxidizing archaea were more suitable for harsh environments, especially Thaumarchaea, so their absolute abundance exceeded that of ammonia-oxidizing bacteria. Denitrifying bacteria belong to facultative and heterotrophic microorganisms, with a broad ecological range, strong adaptability, and a large variety of species, so their absolute abundance is relatively high.

3.3.3. Net Proliferation Rate of Key Denitrifying Bacteria

Using the Formulas (1)–(4), the net proliferation rates of AOB, AOA, and functional genes of denitrifying bacteria were first calculated, and the results are shown in Figure 5.
In the activated sludge ecosystem, the growth and attenuation of microorganisms occur simultaneously, and the net growth rate (observed abundance change) is the in situ growth rate minus the attenuation rate. According to the recommended value of the International Water Association (IWA) expert group, the decay rate of denitrifying bacteria is 0.2/d and that of nitrifying bacteria is 0.05/d at 10 °C, which indicates that the net growth rate of organisms may be negative when the positive in situ growth rate is lower than the decay rate. Therefore, it is conservatively believed that organisms with a net growth rate of denitrifying bacteria between −0.2 and 0 grows slowly. Similarly, nitrifying bacteria with the net growth rate between −0.05 and 0 grow slowly. As can be seen from the figure, AOB and denitrifying bacteria grow, while AOA is considered to have a high frequency of non-growth.
In view of the great influence of temperature on the nitrification process, the specific proliferation rate is calculated by using the proliferation kinetics of nitrifying bacteria, and the formula is shown in Formula (5). During the sampling period, the specific proliferation rate of nitrifying bacteria in the sample was 0.075~0.106/d, which is slightly lower than the result calculated by this formula. The reason was that the parameters in the formula were obtained under the condition of pure culture, and the growth conditions were better than those in the biochemical pool of sewage plant.
μ = μ m a x N a K n + N a e 0.098 ( T 15 )
where
  • μ—specific proliferation rate of ammonia-oxidizing bacteria (including archaea ammoxidation);
  • μmax—maximum specific proliferation rate at 15 °C;
  • Na—ammonia nitrogen concentration;
  • Kn—semi-saturation rate constant;
  • T—temperature.
A formula was used to combine the relative abundance of denitrifying bacteria in the influent and activated sludge to analyze the growth of different populations of denitrifying bacteria in detail and determine the main microorganisms that function. The net proliferation rates of each AOB, AOA, and denitrifying bacterial population were further calculated, and the results are shown in Table 4, Table 5 and Table 6. The table shows that the k values for individuals in the denitrifying bacterial community are frequently negative. The reasons for this are as follows: (1) the environment inside the biochemical pool was not suitable for growth, with a slow or no growth rate; (2) the number of microorganisms migrating into the water exceeded the growth rate; (3) the existence of detection errors. In addition, due to the high level ofmigration, organisms with high abundance in the influent could enter the system in sufficient quantities. As a result, even with a net proliferation rate below zero, these strains persisted in the activated sludge and could even become dominant. Aaron M. Saunders and others calculated the net proliferation rate of each OTU by using the high-throughput sequencing results of 16s rRNA gene. The results showed that 90% of OTUs proliferated in the activated sludge system, and the non-growth part only accounted for 2.5% of the total reads, while 7.5% grew slowly. Acinetobacter, the only slow-growing microorganism in the core flora, was removed from the core flora [1].
Table 4 and Figure 4 show that among the dominant bacteria genera of activated sludge AOB, Nitrosomonas had a higher frequency of proliferation rate k greater than −0.05, accounting for 75%, which was between −0.016 and 0.111/d. The second is Nitrosospira with the frequency of 62.5%, whose k value was between 0.014 and 0.100/d. In addition, the bacteria with higher frequency of k value greater than −0.05 were Nitrosomonadaceae (norank) and Betaprotebactria (unclassified), accounting for 50%. These three types of bacteria are common ammonia-oxidizing bacteria in activated sludge systems, indicating that they can grow and reproduce even in low-temperature seasons, maintain the nitrification performance of the system, and ensure the compliance rate of ammonia nitrogen and total nitrogen in winter. Particularly, the k value of Betaproteobacteria (unclassified) was higher than that of other strains; therefore, it could speculate that Betaproteobacteria might have a higher contribution to nitrification. This may be related to changes in the operating mode during the low-temperature period. To adapt to low-temperature environments, the wastewater treatment plant reduced excess sludge discharge and extended the sludge age since October. This not only reduced the inflow load but also ensured the survival of ammonia-oxidizing bacteria that grow more slowly due to low temperatures in the system.
Compared with AOB, low temperature had a more significant impact on the net proliferation rate of AOA. The migration of ammoxidation archaea in influent microorganisms has had a great influence on the population structure. Crenarchaeota (norank), Thaumarchaeota (norank), Nitrososphaera (unclassified) had a net proliferation rate greater than −0.05, and the frequency was over 50%, indicating that then played roles in the nitrification process. Particularly, the k value of Nitrososphaera was between 0.045 and 0.140/d before 20 January 2024. However, it was not detected afterwards, indicating that the genus played a role when the water temperature was above 10 °C. In addition, the high k value of the unclassified group indicated that it played a great role in the nitrification process, and it needs to be further studied by using technical methods or with the help of phylogenetic relationships in the future. Moreover, considering that the absolute abundance of the AOA amoA gene was higher than that of AOB amoA, it cannot be ruled out that ammonia-oxidizing archaea contribute to nitrification during the low-temperature period.
Among denitrifying bacteria, the individuals with a higher frequency of net proliferation rate greater than −0.2/d were Bradyrhizobium (100%), Bosea (87.5%), Sinorhizobium (75%), Bacteria (norank) (100%), Alphaproteobacteria (unclassified) (87.5%), Bradyrhizobiaceae (unclassified) (87.5%), Rhodobacteraceae (unclassified) (87.5%), Ochrobactrum (75%), and Bacteria (unclassified) (87.5%). Among them, only Sinorhizobium and Alphaproteobacteria were detected at a frequency of 100% in activated sludge. Among the 20 OUTs, 16 OUTs had a net increment rate greater than −0.2/d and a frequency greater than 50%. From the operational effect of the wastewater treatment plant, although there was no obvious pattern in the net proliferation rate, low temperature did not affect the denitrification reaction. The reason may be that denitrifying bacteria are heterotrophic facultative bacteria with many species and strong adaptability [30]. Therefore, although the individual proliferation rate was not high or less than zero, the overall net proliferation rate was unaffected. In addition, the absolute gene abundance of nirK was also relatively high, which ensured the smooth progress of the denitrification process. In addition, the net proliferation rate of the most dominant denitrifying bacteria with high abundance was lower than 0, indicating that these bacterial genera had migrated from denitrifying bacteria in the influent microorganisms, that is, the migration of influent microorganisms shaped the denitrifying bacterial community.
Based on the net proliferation rate and population abundance, the denitrifying bacterial community in activated sludge can be divided into three categories. The first type is the population with a high frequency of individual net proliferation rate greater than −0.05/d (AOA and AOB) or greater than −0.2/d (denitrifying bacteria), which is adapted to low temperature environments and performs denitrification functions. The second category refers to populations with individual net proliferation rates below the critical value (−0.05 or −0.2) and relatively low abundance in activated sludge. The contribution of these populations to denitrification cannot be determined, but it can be confirmed that these microorganisms affect the population structure. The third category consists of bacterial genera with a net proliferation rate lower than the critical value (−0.05 or −0.2) but relatively high abundance or dominance. These bacterial genera migrated from the population of influent microorganisms, indicating that the migration of influent microorganisms had a driving effect on the composition of denitrifying bacterial populations. Therefore, the migration of influent microorganisms was one of the driving factors for the composition of AOB, AOA and denitrifying bacteria in activated sludge, and the other driving factors are deterministic factors such as temperature.

4. Conclusions

This study examined the abundance distribution and the individual net proliferation rate of key denitrifying bacterial communities, namely ammonia-oxidizing bacteria, ammonia-oxidizing archaea, and denitrifying bacteria, in the influent and activated sludge of wastewater treatment plants during low-temperature operations. The aim was to analyze the biological denitrification mechanism from the microbial ecology perspective and determine the contribution of influent microorganisms to the assembly of denitrification bacterial communities.
It can be observed that the population structure of AOB, AOA, and denitrifying bacteria in the influent was relatively stable, and the frequency and abundance distribution patterns were largely consistent with those observed in activated sludge, indicating that most of the denitrifying bacteria in activated sludge emerged from the influent. The absolute abundance of AOB amoA gene in influent and activated sludge remained relatively stable, and the overall AOA amoA gene showed a downward trend with decreasing temperature. The nirK gene abundance was significantly higher than that of both AOB and AOA and exhibited notable variation. In addition, AOA and AOB with high abundance were in a slow proliferation state in the system, while most denitrifying bacteria (including those not annotated) were in a proliferation or slow proliferation state. The combined action of influent microbial migration shaped the composition of denitrifying bacteria in activated sludge. Furthermore, in view of the large number of unclassified gene sequences, which may be involved in biological nitrogen removal, further research is warranted. For example, the MiDAS field guide can be used to infer ecological functions based on phylogenetic relationships, while in situ techniques may help identify their metabolic roles and ecological niches.

Author Contributions

Conceptualization, X.Z.; methodology, X.Z.; software, X.Z.; validation, B.J.; formal analysis, B.J.; investigation, H.L.; resources, H.L.; data curation, S.L.; writing—original draft preparation, X.Z.; writing—review and editing, H.L.; visualization, S.L.; supervision, X.W.; project administration, X.W.; funding acquisition, X.W. All authors have read and agreed to the published version of the manuscript.

Funding

This work was supported by the National Natural Science Foundation of China (No. 52370037) and the Open Project of Key Laboratory of Songliao Aquatic Environment, Ministry of Education (No. SLLY2022001).

Data Availability Statement

The original contributions presented in this study are included in the article. Further inquiries can be directed to the corresponding author.

Conflicts of Interest

The authors declare no conflicts of interest.

References

  1. Saunders, A.; Albertsen, M.; Vollertsen, J.; Nielsen, P. The activated sludge ecosystem contains a core community of abundant organisms. ISME J. 2016, 10, 11–20. [Google Scholar] [CrossRef]
  2. Chen, W.; Wen, D. Advances in Space–Temporal Distribution and Assembly Mechanisms of Microbial Community in Wastewater Treatment Systems. Environ. Eng. 2022, 40, 1–13. [Google Scholar]
  3. Fanaei, F.; Shahryari, T.; Mortazavis, M.; Nasseh, N.; Pourakbar, M.; Barikbin, B. Hazard identification and integrated risk assessment of drinkingwater supply system from catchment to consumer based on the World Health Organization’s Water Safety Plan. Desalin. Water Treat. 2023, 286, 257–273. [Google Scholar] [CrossRef]
  4. Uddin, M.; Zhou, J.; Qu, Y.; Guo, J.; Wang, P.; Zhao, L. Biodecolorization of Azo Dye Acid Red B under High Salinity Condition. Bull. Environ. Contam. Toxicol. 2007, 79, 440–444. [Google Scholar] [CrossRef]
  5. Kim, Y.; Oh, S. Machine–learning insights into nitrate–reducing communities in a full–scale municipal wastewater treatment plant. J. Environ. Manag. 2021, 300, 113795. [Google Scholar] [CrossRef] [PubMed]
  6. Ruiz–Haddad, L.; Shaw, D.; Ali, M.; Pronk, M.; Loosdrecht, M.; Saikaly, P. Characterization of the core microbial community across different aggregate sizes in full–scale aerobic granular sludge plants and their relevance to wastewater treatment performance. Water Res. 2025, 274, 123036. [Google Scholar] [CrossRef]
  7. Zhang, T.; Zhang, J.; Yang, F.; Xie, H.; Hu, Z.; Li, Y. Effect of Temperature on Pollutant Removal and Nitrous Oxide Emission of Wastewater Nitrogen Removal System. Environ. Sci. 2012, 33, 1283–1287. [Google Scholar]
  8. Yang, X.; Huo, M.; Wang, S.; Guo, J.; Wang, Z.; Peng, Y.; Zhang, L. Effect ofs carbon sources on sludge settling and filamentous bacteria growth. CIESC J. 2011, 62, 3471–3477. [Google Scholar]
  9. Shu, W.S.; Huang, L.N. Microbial diversity in extreme environments. Nat. Rev. Microbiol. 2022, 20, 219–235. [Google Scholar] [CrossRef]
  10. Zhou, F.; Huang, P.; Ma, C.; Peng, X.; Fu, M.; Ren, T.; Kan, J. Treatment of cold pressed Zanthoxylum schinifolium oil wastewater: Process, sludge characteristics, and microbial diversity analysis using biochemical methods. J. Environ. Manag. 2025, 377, 124565. [Google Scholar] [CrossRef]
  11. Zhang, Y.; Ma, G.; Yu, D.; Li, J.; Zhao, X.; Miao, Y. Effects of Low Temperature on Mainstream SNAD Process and Restoration of Nitrogen Removal Performance. Technol. Water Treat. 2024, 50, 102–107. [Google Scholar]
  12. Ma, G.; Yu, D.; Zhang, J.; Miao, Y.; Zhao, X.; Li, J.; Zhang, Y.; Dong, G.; Zhi, J. A novel simultaneous partial nitrification, anammox, denitrification and fermentation process: Enhancing nitrogen removal and sludge reduction in a single reactor. Bioresource Technol. 2023, 369, 128484. [Google Scholar] [CrossRef]
  13. Zhang, J.; Miao, Y.; Sun, Y.; Zhang, Q.; Dai, J.; Peng, Y. An effective strategy for in situ start–up of mainstream anammox process treating domestic sewage. Bioresource Technol. 2021, 339, 125525. [Google Scholar] [CrossRef] [PubMed]
  14. Zhang, J.; Zhang, L.; Miao, Y.; Sun, Y.; Zhang, Q.; Wu, L.; Peng, Y. Enhancing sewage nitrogen removal via anammox and endogenous denitrification: Significance of anaerobic/oxic/anoxic operation mode. Bioresource Technol. 2019, 289, 121665. [Google Scholar] [CrossRef]
  15. Gao, X.; Xu, Z.; Peng, Y.; Zhang, L.; Ding, J. The nitrification recovery capacity is the key to enhancing nitrogen removal in the AOA system at low temperatures. Sci. Total Environ. 2022, 818, 151674. [Google Scholar] [CrossRef]
  16. Chen, J.; Lu, Y.; Huang, W.; Li, Y.; Tang, L.; Zhang, J. Effect of low temperature shock on nitrogen removal performance of Anammox in CRl systems. Environ. Sci. Technol. 2020, 43, 137–143. [Google Scholar]
  17. Liu, J.; Bi, X.; Yang, X.; Chen, S.; Pan, K.; Fan, X.; Zhou, X. Nitrogen Removal Performance of a Pilot–scale Pure Moving Bed Biofilm Reactor System at Low Temperature. China Water Supply Drain. 2023, 39, 19–26. [Google Scholar]
  18. Chang, M.; Chen, X.; Shen, J.; Zhu, T.; Xiao, T.; Wang, J.; Wang, C.; Wang, Y. A novel sulfur–based fiber carrier fixed–bed reactor for nitrate–contaminated wastewater treatment: Performance, operational characteristics and cold–tolerant mechanism. J. Environ. Chem. Eng. 2024, 12, 114203. [Google Scholar] [CrossRef]
  19. Zeynali, R.; Asadi, M.; Ankley, P.; Esser, M.; Brinkmann, M.; Soltan, J.; McPhedran, K. Sustainable enhancement of biogas production from a cold–region municipal wastewater anaerobic digestion process using optimized sludge–derived and commercial biochar additives. J. Clean. Prod. 2024, 478, 143948. [Google Scholar] [CrossRef]
  20. Li, J.; Wen, Y.; Fang, Z.; Yang, W.; Song, X. Application of cold–adapted microbial agents in soil contaminate remediation: Biodegradation mechanisms, case studies, and safety assessments. RSC Adv. 2024, 14, 12720–12734. [Google Scholar] [CrossRef]
  21. Lu, Z.; Cheng, X.; Xie, J.; Li, Z.; Li, X.; Jiang, X.; Zhu, D. Iron–based multi–carbon composite and Pseudomonas furukawaii ZS1 co–affect nitrogen removal, microbial community dynamics and metabolism pathways in low–temperature aquaculture wastewater. J. Environ. Manag. 2024, 349, 119471. [Google Scholar] [CrossRef] [PubMed]
  22. Wu, L.; Ding, X.; Lin, Y.; Lu, X.; Lv, H.; Zhao, M.; Yu, R. Nitrogen removal by a novel heterotrophic nitrification and aerobic denitrification bacterium Acinetobacter calcoaceticus TY1 under low temperatures. Bioresource Technol. 2022, 353, 127148. [Google Scholar] [CrossRef] [PubMed]
  23. GB18918–2002; Discharge Standard of Pollutants for Municipal Wastewater Treatment Plant. Standards Press of China: Beijing, China, 2002.
  24. Guo, Y.; Qi, R.; Xiao, S.; Dou, D.; Su, G.; Gao, J. Microbial Community Structure Analysis of Activated Sludge in Chinese Biological Sewage Wastewater Treatment Process. Environ. Sci. 2025, 46, 934–943. [Google Scholar]
  25. Shi, X.; Liu, W.; Nie, Z.; Li, Q.; Liang, X.; Zhao, W.; Qu, H.; Bian, D. Seasonal effects on pilot–scale high–concentration activated sludge systems in cold regions. J. Water Process Eng. 2023, 52, 103575. [Google Scholar] [CrossRef]
  26. Wang, H.; Zhou, Q. Potential application of bioelectrochemical systems in cold environments. Sci. Total Environ. 2024, 927, 172385. [Google Scholar] [CrossRef]
  27. Yang, S.; Qin, Z.; Liang, M. Meta–analysis of Microbial Communities in the Activated Sludge of Wastewater Treatment Plants Under Different Climate Types. Environ. Sci. 2021, 42, 4844–4852. [Google Scholar]
  28. Fang, P.; Li, Y.; Wei, D.; Jin, D. Microbial community diversity and its response to environmental factors during sewage treatment. Microbiol. China 2020, 47, 3004–3020. [Google Scholar]
  29. Sun, C.; Zhang, B.; Ning, D.; Zhang, Y.; Dai, T.; Wu, L.; Li, T.; Liu, W.; Zhou, J.; Wen, X. Seasonal dynamics of the microbial community in two full–scale wastewater treatment plants: Diversity, composition, phylogenetic group based assembly and co–occurrence pattern. Water Res. 2021, 200, 117295. [Google Scholar] [CrossRef]
  30. Qu, J.; Zhao, R.; Chen, Y.; Li, Y.; Jin, P.; Zheng, Z. Enhanced nitrogen removal from low–temperature wastewater by an iterative screening of cold–tolerant denitrifying bacteria. Bioproc. Bloyst. Eng. 2021, 45, 381–390. [Google Scholar] [CrossRef]
Figure 1. Operation parameters, environmental factors and effluent water quality index concentrations during the sampling period of the wastewater treatment plant.
Processes 13 01814 g001
Figure 2. Abundance distribution of denitrifying bacteria in activated sludge samples during the low-temperature period. (A) Ammonia-oxidizing bacteria. (B) Ammonia-oxidizing archaea. (C) Denitrifying bacteria.
Processes 13 01814 g002aProcesses 13 01814 g002b
Figure 3. Distribution of denitrifying bacteria abundance in the influent during the sampling period from 30 November 2023 to 10 January 2024. (A) Ammonia-oxidizing bacteria. (B) Ammonia-oxidizing archaea. (C) Denitrifying bacteria.
Processes 13 01814 g003
Figure 4. Absolute abundance of functional genes of ammonia-oxidizing bacteria, ammonia-oxidizing archaea, and denitrifying bacteria. (A) AOB–amoA. (B) AOA–amoA. (C) Denitrifying bacteria–nirK.
Processes 13 01814 g004
Figure 5. Net proliferation rate of key denitrifying bacterial genera (/d). (A) AOB–amoA. (B) AOA–amoA. (C) Denitrifying bacteria–nirK.
Processes 13 01814 g005
Table 1. Primer sequences and amplification conditions for high-throughput sequencing.
MicroorganismsKey GenesPrimer Name and Sequence (5′–3′)Amplification Conditions
Ammonia-oxidizing bacteriaamoA geneamoA–1F(GGGGTTTCTACTGGTGGT)
amoA–2R(CCCCTCKGSAAAGCCTTCTTC)
95 °C 5 min; (94 °C 45 s, 55 °C 30 s, 72 °C 1 min) × 35; 72 °C 5 min
Ammonia-oxidizing archaeaamoA genearchea–amoAF (STAATGGTCTGGCTTAGACG)
archea–amoAR (GCGGCCATCCATCTGTATGT)
95 °C 5 min; (94 °C 45 s, 53 °C 60 s, 72 °C 1 min) × 35, 72 °C 5 min
Denitrifying bacterianirK genenirK1aCuF(ATCATGGTSCTGCCGCG)
nirKR3CuR(GCCTCGATCAGRTTGTGGTT)
95 °C 5 min; (95 °C 30 s, 53 °C 30 s, 72 °C 45 s) × 35; 72 °C 10 min
Table 2. Primers and amplification conditions for the quantitative PCR tests.
MicroorganismsKey GenesPrimer Name and Sequence (5′–3′)Amplification Conditions
Ammonia-oxidizing bacteriaamoA genebamoA1F(GGGGTTTCTACTGGTGGT)
bamoA2R(CCCCTCKGSAAAGCCTTCTTC)
95 °C 5 min; (94 °C 30 s, 55 °C 30 s, 72 °C 1 min) × 35
Ammonia-oxidizing archaeaamoA genearchea–amoAF (STAATGGTCTGGCTTAGACG)
archea–amoAR (GCGGCCATCCATCTGTATGT)
95 °C 5 min; (94 °C 45 s, 53 °C 60 s, 72 °C 1 min) × 35
Denitrifying bacterianirK genenirK1aCuF(ATCATGGTSCTGCCGCG)
nirKR3CuR(GCCTCGATCAGRTTGTGGTT)
95 °C 5 min; (95 °C 30 s, 55 °C 30 s, 72 °C 30 s) × 35
Table 4. Net proliferation rate of the AOB gene.
AOB2023/12/202023/12/302024/1/102024/1/202024/1/302024/2/102025/2/202025/3/2N/Nr*
Nitrosococcus −1.039 0.1141/8
Nitrosomonas0.005−0.0100.0930.111−0.002−0.306−0.297−0.0163/8
Nitrosospira0.1000.014−1.638−0.0920.0640.0780.088−0.1155/8
Nitrosovibrio0.137 1/8
Betaproteobacteria (norank)−0.447−3.1130.0210.140−0.065 −0.4760.1133/8
Bacteria (norank) 0.1400.142 0.108 3/8
Nitrosomonadaceae (norank) 0.056−3.056 0.142 0.1080.0864/8
Proteobacteria (norank) 0/8
Betaproteobacteria (unclassified) 0.1380.1260.1400.142 4/8
Nitrosomonadaceae (unclassified) 0.031−0.403 −0.0200.102−0.093−5.4802/8
Bacteria (unclassified) −30.1130.0740.140 −2.5502/8
Proteobacteria (unclassified) 0.140 1/8
Note: Nr indicates the total number of Kx, 8; N represents the number of samples with k > 0.
Table 5. Net proliferation rate of AOA.
AOA2023/12/202023/12/302024/1/102024/1/202024/1/302024/2/102025/2/202025/3/2N/Nr
Nitrosocosmicus−0.640 0/8
Nitrosotenuis 0/8
Nitrosopumilus 0/8
Nitrososphaera0.0450.1380.0450.140 4/8
Archaea (norank)−0.021−0.0140.052−0.073−0.479−0.099−1.526 1/8
Bacteria (norank) 0.073−68.307−0.166−157.136 0.0852/8
Crenarchaeota (norank)0.046−46.746−0.0320.1040.043−0.0040.011−0.0904/8
Thaumarchaeota (norank)−0.061−0.1370.079−0.079−0.040−0.171−0.0470.0222/8
Unclassified0.038−12.3670.0870.099−25.6900.0320.1060.1146/8
Archaea (unclassified)−1.0880.0770.0740.0960.141−0.068−1.983−18.4704/8
Thaumarchaeota (unclassified) 0.126 1/8
Note: Nr indicates the total number of Kx, 8; N represents the number of samples with k > 0.
Table 6. Net proliferation rate of denitrifying bacteria.
Denitriing Bacteria2023/12/202023/12/302024/1/102024/1/202024/1/302024/2/102025/2/202025/3/2N/Nr
Achromobacter 0.098 0.140 0.111 0.1144/8
Bosea0.014−0.0290.047−0.1880.033−0.341−0.1170.0164/8
Bradyrhizobium0.1360.1380.1310.0250.106−0.005−0.0610.0136/8
Luteovulum 0.108 1/8
Mesorhizobium0.1370.0300.101−0.2730.1000.111−0.477 5/8
Nitrosospira 0/8
Ochrobactrum−0.114−0.214−0.066−0.043−0.153−0.085 0.0601/8
Paracoccus−0.428−1.422−1.681−0.035−0.010−0.291−0.081−0.0010/8
Pseudomonas 0/8
Rhizobium−0.030−0.077−0.007−0.1360.070−0.200−0.255−0.2411/8
Sinorhizobium0.1320.1380.131−0.3470.024−0.131−0.209−0.1904/8
Bacteria (norank)0.0700.0400.0810.0920.070−0.148−0.1530.0986/8
Alphaproteobacteria (unclassified)0.052 0.035−0.0870.019−0.064−0.1680.0394/8
Unclassified 0.120 −0.040 0.1112/8
Bradyrhizobiaceae (unclassified)0.1370.1380.131−0.0160.103−0.018−0.032 4/8
Rhizobiaceae (unclassified)0.000−0.0800.034−0.2290.017−0.143−0.288−0.2172/8
Rhodobacteraceae (unclassified)0.083−0.024−0.0290.0370.1110.033−0.055 4/8
Bacteria (unclassified)0.0400.0090.0540.051−0.0260.027−0.3380.0596/8
Rhizobiales (unclassified)−0.020−0.086−0.020−0.293−0.004−0.286−0.238−0.0470/8
Proteobacteria (unclassified)−0.103−0.125−0.471−0.0040.090−0.036−0.3390.0522/8
Note: Nr indicates the total number of Kx, 8; N represents the number of samples with k > 0.
Disclaimer/Publisher’s Note: The statements, opinions and data contained in all publications are solely those of the individual author(s) and contributor(s) and not of MDPI and/or the editor(s). MDPI and/or the editor(s) disclaim responsibility for any injury to people or property resulting from any ideas, methods, instructions or products referred to in the content.

