1. Introduction
The global transition toward sustainable and energy-resilient industrial facilities has become increasingly imperative in the face of escalating climate challenges, volatile energy markets, and tightening regulatory frameworks. Among the strategies emerging to address these issues, the integration of photovoltaic (PV) systems into industrial building envelopes offers a dual advantage: facilitating on-site renewable electricity generation while simultaneously enhancing the thermal performance of lightweight structures. Recent research has underscored the dual function of PV installations, highlighting their capacity not only to generate clean energy but also to act as passive modifiers of building thermal loads by attenuating solar heat gains through the roof and façade systems [
1,
2].
Technological advances in PV system modeling and integration have accelerated the adoption of these solutions in industrial contexts. Studies have demonstrated the use of advanced power electronics and simulator models to support autonomous renewable systems and optimize maximum power point tracking algorithms [
3]. Similarly, synergistic strategies combining energy management with PV deployment have achieved substantial progress toward zero-energy industrial sites [
1]. Optimization frameworks have further revealed the significant potential of building-integrated PV systems to reduce operational energy consumption and enhance economic viability in industrial facilities [
4,
5].
Beyond energy production, research efforts are increasingly directed toward understanding the impact of PV integration on indoor thermal comfort, especially in non-conditioned industrial spaces where overheating risks are pronounced. Dynamic simulation studies confirm that rooftop PV arrays can significantly mitigate peak operative temperatures [
2,
6], contributing to more stable indoor environments without relying on mechanical cooling. Complementary materials research, including the development of phase change materials (PCMs) [
7] and novel thermally enhanced composites [
8], emphasizes the critical role of envelope design and material science in passive thermal management.
Innovative sustainable materials such as industrial wastewater sludge-derived bricks have also demonstrated notable improvements in thermal insulation and carbon footprint reduction [
9], reinforcing the importance of material selection in advancing energy-efficient and climate-adaptive industrial architecture. Such material innovations align strongly with the broader objectives of composite material research in delivering high thermal performance and environmental sustainability.
The increasing availability of high-resolution solar cadaster datasets [
10] and geospatial analyses of rooftop PV potential [
11] are expanding the possibilities for strategic deployment of PV systems in industrial and urban landscapes. Recent analyses of PV surplus generation dynamics in industrial parks [
12] highlight the need for aligning renewable generation profiles with operational demand patterns to maximize system efficacy.
Despite these advancements, there remains a marked scarcity of research explicitly addressing the calibrated dynamic modeling of industrial warehouses operating under lightweight metallic envelopes in semi-arid climatic regions, particularly in Mexico. Many existing studies either focus on residential and commercial typologies or rely on uncalibrated models, limiting the applicability of their findings to real-world industrial scenarios [
13,
14]. Moreover, although the importance of thermal comfort is increasingly recognized in the occupational health literature, its consideration within industrial warehouse design remains underexplored [
2,
15].
Thermal comfort is defined as the condition of mind that expresses satisfaction with the thermal environment, as formalized in standards such as ASHRAE 55 [
16]. The most widely applied metrics are the Predicted Mean Vote (PMV) and the Predicted Percentage of Dissatisfied (PPD), which quantify occupants’ thermal sensation on a scale from cold to hot and the corresponding percentage of likely dissatisfied individuals. In naturally ventilated or non-conditioned spaces, the adaptive thermal comfort model [
15] provides a more flexible framework by correlating acceptable temperature ranges with outdoor conditions and occupants’ behavioral adaptation. Additionally, the Universal Thermal Climate Index (UTCI) [
10] offers an integrative measure of outdoor thermal stress by combining meteorological variables, physiological responses, and clothing insulation.
To position this study within the landscape of recent advancements,
Table 1 summarizes key contributions from the recent literature, highlighting the intersections of energy simulation, PV integration, thermal performance enhancement, and industrial applications.
While a robust body of knowledge has been developed around energy generation via PV systems and thermal optimization strategies, few investigations have systematically explored the passive thermal contributions of PV modules integrated into lightweight, metallic industrial buildings operating in free-running conditions. This knowledge gap highlights the critical need for research that bridges computational energy modeling, real-world calibration, and thermal comfort evaluation under realistic industrial settings.
In this context, the present study aims to address these gaps by developing a calibrated dynamic energy model of three industrial warehouses located in Tecámac, Mexico. The model is validated using actual utility billing data following ASHRAE Guideline 14 procedures [
17]. A real-world photovoltaic system proposal is integrated into the model to evaluate its impact on both annual electricity consumption and indoor operative temperatures. By combining computational energy simulations with calibrated field data, this study offers new insights into the role of rooftop PV systems as dual-function technologies for energy generation and passive thermal control in industrial buildings under semi-arid climate conditions.
While the installation of PV systems is widely recognized for reducing operational energy consumption in buildings, the passive thermal benefits induced by PV integration, particularly in lightweight industrial structures, remain comparatively underexplored.
This study does not aim to quantify economic or net energy savings from PV generation but rather focuses on assessing the passive thermal performance enhancements provided by rooftop PV arrays acting as shading layers over metallic building envelopes.
Based on the existing research gaps, the following hypothesis was formulated to guide this study:
H1: the integration of rooftop PV arrays over lightweight metallic roofs significantly reduces peak indoor operative temperatures and improves the proportion of thermally comfortable hours in free-running industrial warehouses.
This hypothesis is tested through calibrated dynamic energy simulations validated against real-world operational data, thereby contributing new insights into multiscale computational approaches for predicting thermal performance in composite industrial roof systems.
In this context, the integration of photovoltaic arrays over metallic industrial roofs effectively creates a composite envelope system, where the thermal properties of the PV modules and the underlying metal interact to alter overall roof performance. This study evaluates the passive thermal benefits of such composite roof assemblies through multiscale simulation approaches.
The main contributions of this work are as follows: (1) the development and calibration of a dynamic thermal model for lightweight industrial envelopes using real utility data; (2) the application of rooftop PV arrays as passive thermal modifiers; and (3) the demonstration that, although full thermal comfort was not achieved under PMV/PPD criteria, the intervention significantly increased the proportion of comfortable hours in unconditioned warehouse settings.
The remainder of this paper is structured as follows.
Section 2 presents the materials and methods, including case study characterization, energy model development, and the calibration approach.
Section 3 shows the results of energy performance and thermal comfort simulations before and after PV integration.
Section 4 critically discusses the findings in the context of the existing literature.
Section 5 outlines the main conclusions and directions for future research.
2. Materials and Methods
This study employed a calibrated multiscale simulation framework linking material properties of metallic industrial envelopes and PV modules to building-level thermal performance outcomes. The methodology included geometric reconstruction, thermal envelope definition, dynamic simulation of operational loads, calibration against measured utility data, and evaluation of thermal comfort shifts. This modeling workflow supports the computational prediction of thermal behavior for passive cooling strategies in lightweight industrial buildings.
2.1. Case Study Description
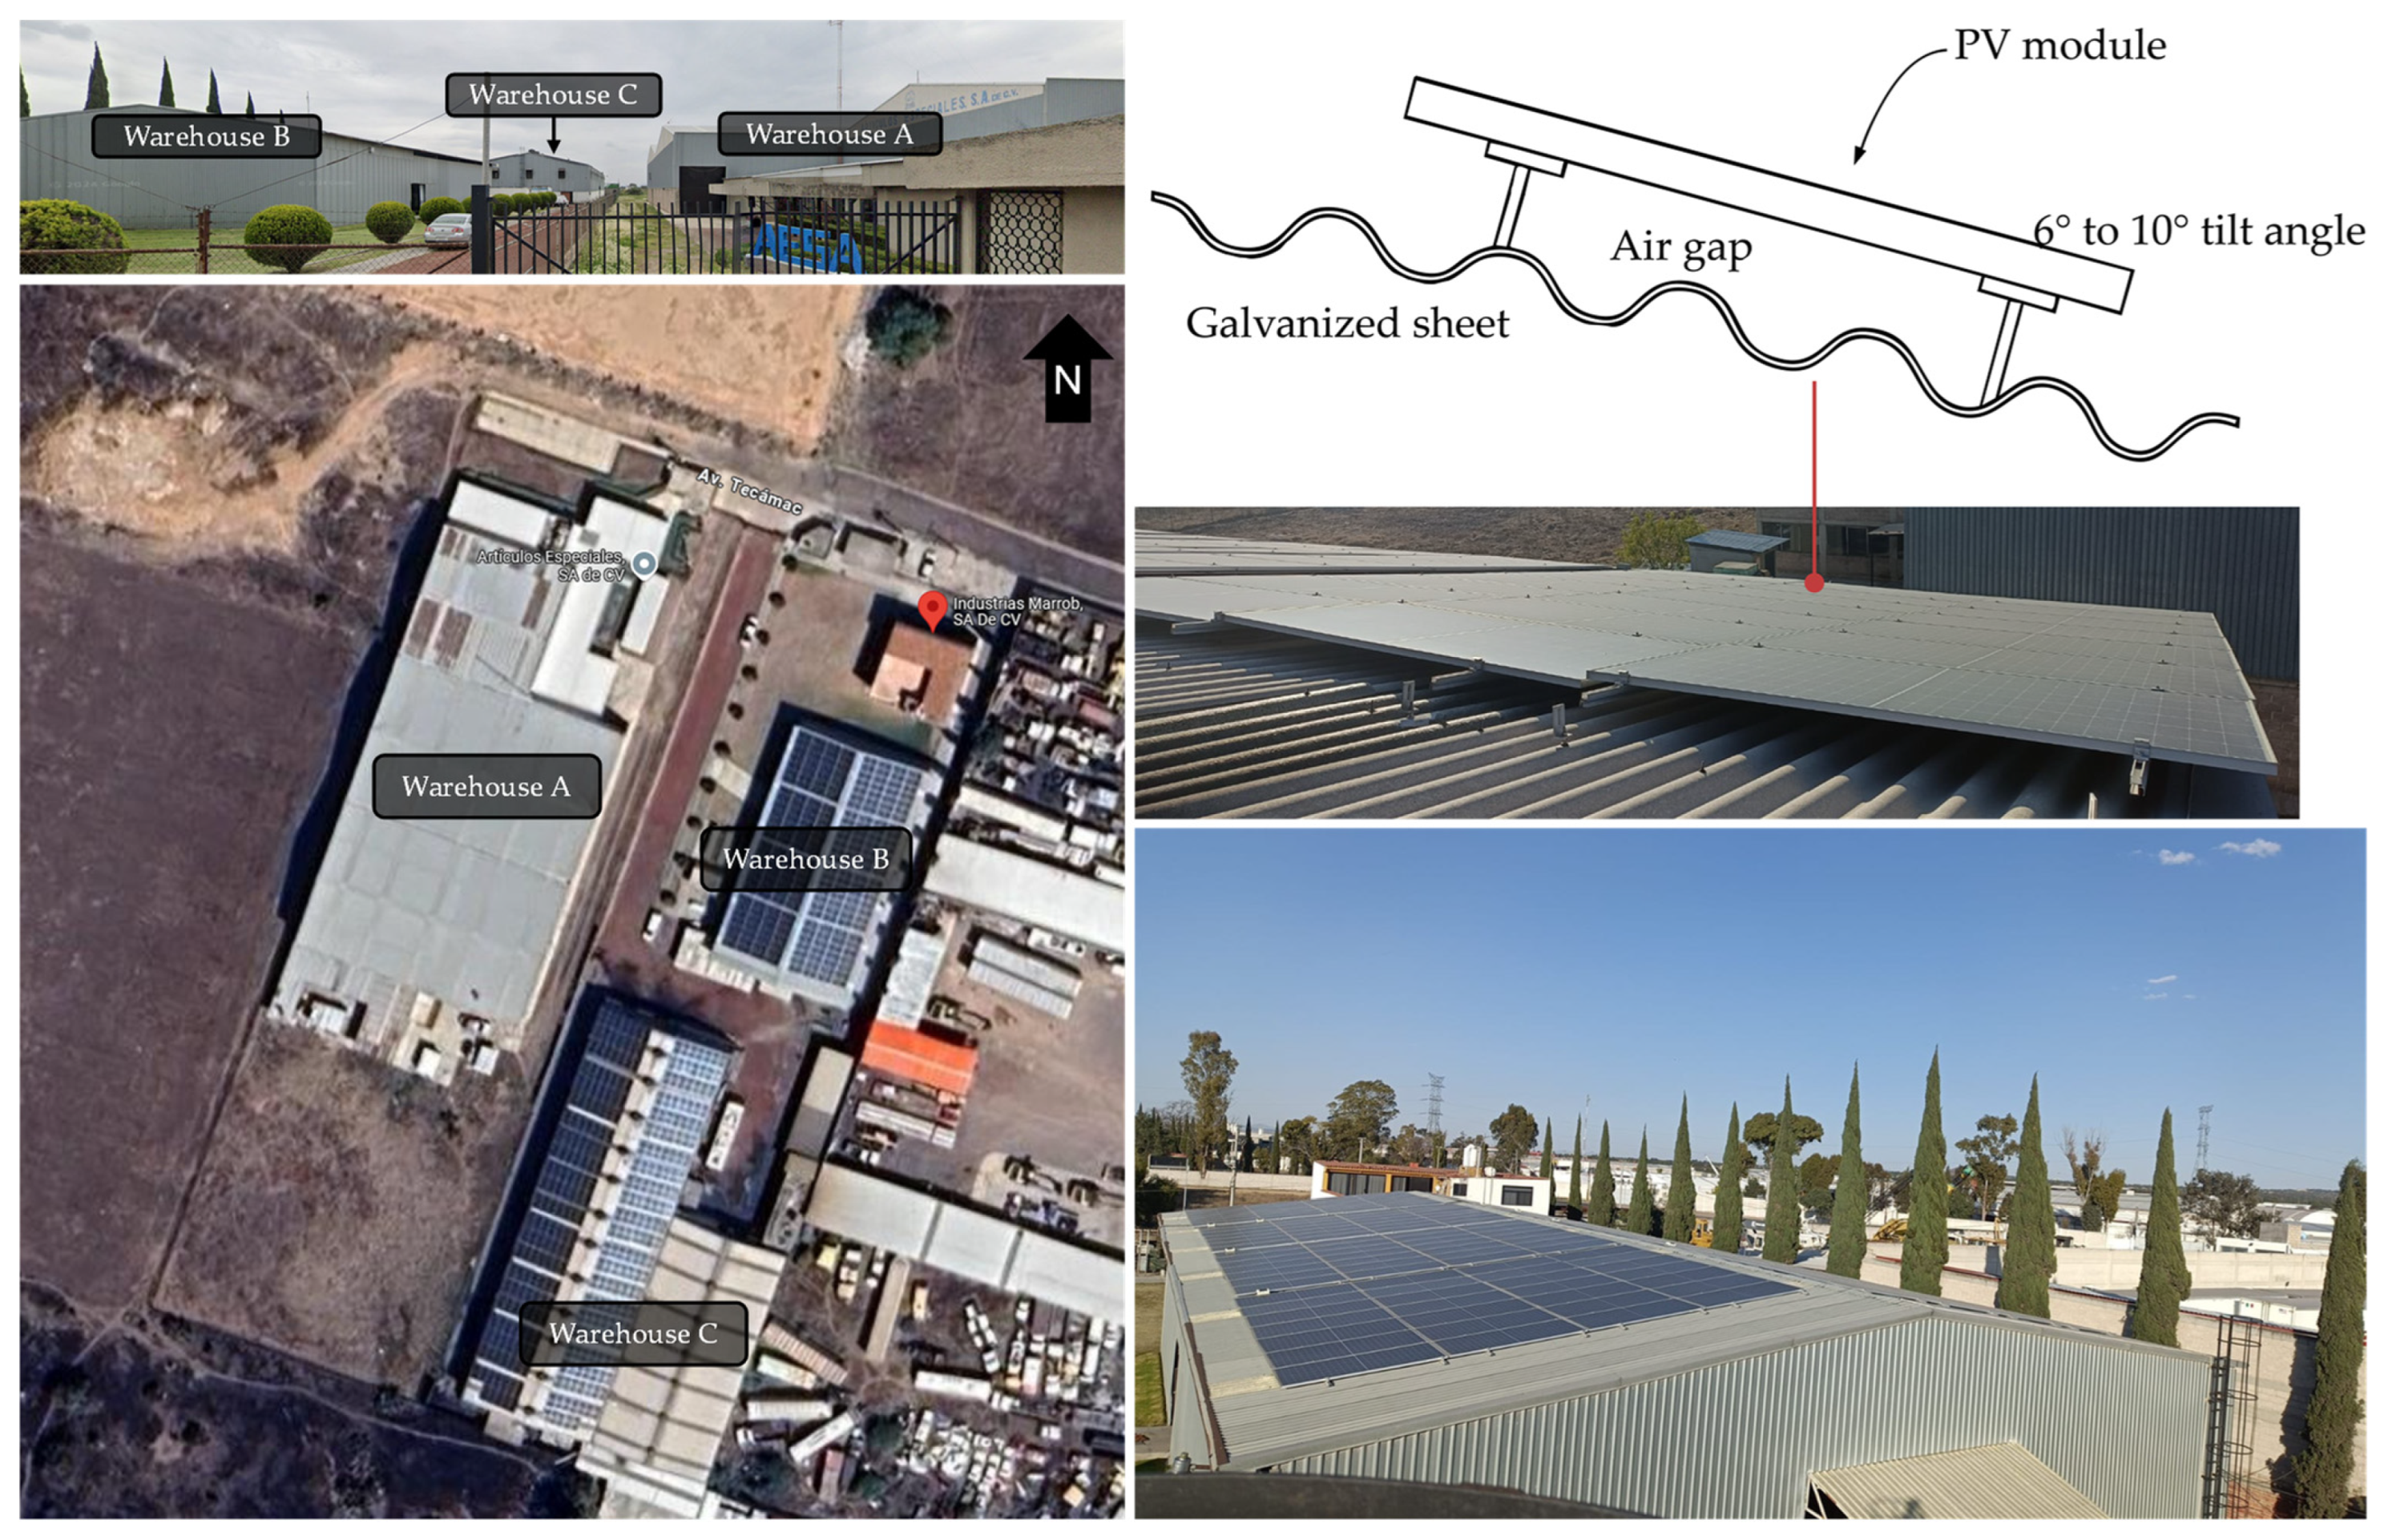
This study was conducted on three industrial buildings located in Tecámac, Estado de México (Latitude: 19.6882° N, Longitude: −98.9732° W). The facilities belong to Maquinados e Inyecciones Tecámac (
Figure 1) and operate under the high-voltage tariff scheme GDMTH provided by the Comisión Federal de Electricidad (CFE). All buildings feature metallic roofing systems commonly found in industrial facilities without HVAC equipment for cooling.
Figure 1 illustrates the exact placement of the rooftop PV systems on Warehouses B and C.
Each module is mounted parallel to the corrugated metal roof, which is inclined at 6° on Warehouses A and B and 10° on Warehouse C, following the factory roof pitch. The aluminum rail system creates an average air gap of 0.10 m between the module backsheet and the roof surface. The plan view in
Figure 1 identifies the array footprint on each warehouse, and the section detail shows the roof pitch, rail spacing, and air gap analyzed in this study.
A customized EnergyPlus Weather (EPW) file was generated using Meteonorm 8 software based on the site’s geographic coordinates to represent the local climatic conditions in the energy simulations.
Figure 2 depicts the annual climatic profile at the site, showing the trend components of outdoor air temperature and global horizontal irradiance derived from hourly simulation data. The temperature trend (black line, left axis) reveals a seasonal thermal regime, with higher values from April to September, where daily maximum temperatures frequently exceed 24 °C, and cooler conditions from November to February, when nighttime temperatures often fall below 10 °C. These pronounced diurnal and seasonal temperature variations are characteristic of a semi-arid climate and directly affect passive thermal comfort strategies. Concurrently, the irradiance trend (red line, right axis) indicates substantial solar resource availability, with daily global horizontal irradiance regularly surpassing 400–500 Wh/m
2 during the dry season. The temporal alignment between peak solar radiation and elevated ambient temperatures supports implementing PV systems as a dual-purpose strategy, providing on-site electricity generation while contributing to passive thermal mitigation through rooftop shading and envelope interaction.
2.2. Model Development in EnergyPlus
The buildings were modeled using Ladybug Tools v 1.8.0, integrated with EnergyPlus v23.2.0, simulating 8760 h of annual operation. The model incorporates detailed occupancy and equipment schedules, matching operational profiles for industrial machinery. The thermal zones were modeled to reflect the real operational conditions of the facility, including lighting schedules, internal equipment loads, and customized envelope constructions based on the actual building assembly. Rather than using default presets, material layers for the roof and walls were explicitly defined using thermo-physical properties derived from on-site inspections and PV panel specifications. The rooftop PV system was modeled not only as an electricity generator but also as an additional thermal resistance layer above the metal roof, accounting for its effect in attenuating solar heat gains through shading and surface coverage. Construction sets were assigned using Honeybee’s Metal Building category, with further refinement of materials and U-values to reflect the real warehouse envelope. No HVAC systems were modeled, as the buildings operate in free-running mode. The modeling process included the following:
Geometric reconstruction based on satellite imagery and technical specifications;
Material layers;
Operational schedules corresponding to typical industrial occupancy;
Weather data obtained from Meteonorm 8 in EnergyPlus Weather Format (EPW) for Mexico City, adjusted to the Tecámac region.
Figure 3a illustrates the 3D energy model of the industrial facility without PV panels, while
Figure 3b presents the same model after integrating the proposed rooftop PV systems. These visualizations represent the base and modified configurations used for the comparative energy and thermal performance analysis.
2.3. Building Materials and Envelope Configuration
The thermal envelope of the three industrial buildings was constructed using standardized materials available within the Honeybee v1.8.0-EnergyPlus library. The three industrial warehouses featured distinct envelope configurations based on a combination of concrete masonry and lightweight metal cladding systems, as summarized in
Table 2. Warehouses A and C were designed with a composite envelope, where the lower sections of the exterior walls consisted of 8-inch concrete block masonry exhibiting moderate thermal mass and insulation properties (U-value = 2.24 W/m
2·K), while the upper wall sections and the entire roof utilized galvanized metal sheets (U-value = 6.09 W/m
2·K). This hybrid construction aimed to balance structural robustness with rapid installation practices typical in industrial settings. In contrast, Warehouse B adopted a fully lightweight envelope approach, with both walls and roof exclusively composed of galvanized metal sheeting without any masonry support, resulting in comparatively higher thermal transmittance. All three buildings shared a common floor assembly consisting of 6-inch normal-weight concrete slabs (U-value = 4.35 W/m
2·K), contributing to limited thermal buffering at the ground level.
Additional thermal resistance layers were incorporated into the roof construction to account for the rooftop PV arrays. The PV module assembly was modelled using layer-specific thermo-physical data obtained from JA Solar datasheets manufactured by JA Solar Technology Co., Ltd., based in Beijing, China [
18] and specifications provided in Mexico by EcoValue, S.A. de C.V., as detailed in the lower portion of
Table 2. The assembly includes tempered AR glass, EVA encapsulants, mono-crystalline silicon cells, a Tedlar (PVF) backsheet, and an anodized aluminum frame [
19], resulting in a combined U-value of 2.09 W/m
2·K. This value was applied as a composite roof layer in the energy model with the air gap to reflect the insulating effect of the installed PV system.
The impact of rooftop PV systems was thus modelled in two ways: (1) as an active energy generation component, based on hourly simulated electricity production; and (2) as a passive thermal modifier, altering the heat transfer characteristics of the roof. This dual modelling approach enabled a consistent comparative assessment of the thermal and energetic performance between warehouses with and without PV coverage, isolating the PV array’s contribution to shading and insulation.
These constructions were selected to reflect common practices in Mexican industrial architecture and align with assumptions made during the energy model calibration process. No glazing or HVAC systems were modeled, as the buildings are operated in free-running conditions and function primarily as production and storage areas.
2.4. Load Profile Generation from Utility Billing
A detailed load profile was developed using 2021 monthly utility billing data from CFE, incorporating both energy consumption (kWh) and maximum demand (kW) information, as seen in
Table 3.
The load was disaggregated into base, intermediate, and peak periods according to CFE’s seasonal tariff schedules. Each hour of the year was assigned to the appropriate tariff period based on the month and time of day, following official CFE definitions. The operational conditions were based on the actual working schedule of the facility:
During non-operational hours, a passive background load between 5 and 15% of the maximum monthly demand was simulated, depending on whether the day was a regular day or a holiday.
A synthetic 15 min interval load profile was generated by modeling each equipment group’s consumption behavior, considering operational variability through randomization of working factors. The simulation ensured the following:
The total annual consumption was preserved (matching the reported 616,919 kWh);
The monthly energy allocations into base, intermediate, and peak periods reflected the actual CFE utility bill proportions;
The simulated maximum demand remained realistic compared to the billing records.
Finally, the 15 min profile was aggregated into hourly average values to obtain a continuous 8760 h load profile suitable for the Honeybee energy simulation purposes.
Calibration and Post-Installation Validation Strategy
To ensure the accuracy and reliability of the dynamic energy model, the calibration was based on the year 2021, representing the last full year of operation prior to the integration of the PV system. At that time, the facility operated without on-site renewable generation, thus reflecting the building’s pure energy demand profile under conventional grid supply conditions.
Calibration was performed by aligning the simulated monthly electricity consumption with the measured values reported in the 2021 CFE utility bills, following the procedures recommended by ASHRAE Guideline 14 [
17]. This approach allowed the model to be tuned without the confounding influence of on-site generation, ensuring that internal loads, schedules, and envelope thermal characteristics were accurately captured.
After the system calibration phase, the model was adapted to include the PV installation proposed and implemented by EcoValue SA de CV in Mexico City, Mexico. The PV system was gradually installed during 2022 and reached full operational capacity in 2023.
The PV system’s expected annual production was estimated at 426,200 kWh/year (approximately 69.57% of the facility’s original consumption). Detailed system losses were accounted for, including shading (0.8%), soiling (3.0%), mismatch losses (4.4%), wiring losses (0.5%), and inverter efficiency (98.1%).
To assess the real-world performance and validate the energy savings potential, post-installation CFE billing data from 2022 and 2023 were also collected and analyzed. Although slight variations were observed due to the progressive commissioning of the PV system throughout 2022, the 2023 billing statements demonstrated a marked reduction in grid-supplied electricity, in alignment with simulation predictions.
The present calibration, carried out in accordance with ASHRAE Guideline 14 [
17], guarantees that the model reproduces the whole-building energy balance; however, it does not provide direct confirmation that the simulated indoor operative-temperature reductions are accurate at room level. Continuous temperature monitoring was not available during the study period. Consequently, the reported temperature reductions should be regarded as model-based estimates. Future work will deploy a network of indoor air-temperature loggers and roof heat-flux sensors on all three warehouses. These measurements will enable point-by-point validation of the simulated thermal response and provide a tighter uncertainty bound on the passive-cooling benefit attributed to the rooftop PV arrays.
2.5. Calibration Using ASHRAE Guideline 14
The energy model was calibrated against actual utility billing data recorded during the year 2021, prior to the installation of the PV system. Monthly energy consumption values were disaggregated into base, intermediate, and peak periods according to the seasonal tariff structure of the CFE.
Calibration efforts adhered to the recommendations outlined in ASHRAE Guideline 14 [
17], which establishes acceptable statistical thresholds for model validation. Specifically, two key performance indicators were evaluated:
Normalized Mean Bias Error (NMBE) measures the mean bias between simulated and measured data, normalized by the average measured value and adjusted for the degrees of freedom;
Coefficient of Variation of the Root Mean Square Error (CV(RMSE)) reflects the normalized spread of simulation errors relative to the mean measured value.
The NMBE and CV(RMSE) were computed as described in Equations (1) and (2):
where
p = 1,
is the arithmetic mean of the sample of
observations,
is the measured values, and
the simulation-predicted data.
= total number of observations (12 months);
= number of model parameters adjusted during calibration (in this case, = 1);
= measured monthly energy consumption (kWh);
= simulated monthly energy consumption (kWh);
= arithmetic mean of the measured values.
According to ASHRAE Guideline 14 [
17], acceptable calibration thresholds are ±5% MBE and 15% CV (RMSE).
2.6. Photovoltaic System Integration
The PV system modeled was based on a real-world installation proposal provided by the Mexican company EcoValue in 2022 which included:
542 JA Solar JAM72S30 panels of 540 Wp (monocrystalline half-cell), manufactured by JA Solar Technology Co., Ltd., based in Beijing, China [
18];
Total installed capacity: 292.68 kWp (DC);
Orientation: East–West (108.89–291.52°) with 6° and 10° inclinations depending on the roof section;
Mounting type: fixed roof-mounted;
Inverters: 4 × Solis 60 kW-LV-5G, with 3 MPPT per unit;
System loss factors:
- ○
Shading: 0.8%;
- ○
Soiling: 3.0%;
- ○
Temperature: 10.2%;
- ○
Mismatch: 4.4%;
- ○
Wiring: 0.5%;
- ○
Inverter efficiency: 98.1%.
PV parameters were assigned using Honeybee’s HB Photovoltaic Properties component, and the energy model was re-simulated to account for both electric production and thermal impact on the roof.
2.7. Statistical Analysis Approach
This study formulated and tested the hypothesis (H1).
To test this hypothesis, a two-stage statistical evaluation was conducted:
The Wilcoxon signed-rank test was employed to assess differences in hourly operative-temperature distributions before and after PV integration, due to the non-normality of the data;
McNemar’s test for paired nominal data was used to evaluate shifts in thermal comfort classification (comfortable vs. uncomfortable) based on the PMV/PPD model with 1.1 met, 0.7 clo, and a 20% dissatisfaction threshold.
- ○
The PMV/PPD model was adopted in accordance with ASHRAE Standard 55 [
6], which allows its use for metabolic rates up to 2.0 met. Although activity levels in the study warehouses vary over the workday, from machine monitoring (≈1.0 met) to intermittent material handling (≈1.2 met), they remain within this limit [
20,
21,
22]. A representative value of 1.1 met and a clothing insulation of 0.7 clo (light industrial workwear) were applied uniformly throughout the simulation year. The PMV model was used only to generate an hourly binary comfort flag (PPD ≤ 20%), minimizing sensitivity to small input uncertainties. For tasks that exceed 2.0 met or for seasonal clothing changes, future studies will incorporate either (i) activity-specific PMV calculations or (ii) the adaptive comfort methodology supplemented by field surveys.
Statistical significance was determined at a threshold of
p < 0.05 for all tests. All statistical analyses, including normality evaluation, Wilcoxon signed-rank testing, and McNemar’s testing of thermal comfort classification, were conducted using RStudio 2024.12.1 Build 563, employing the packages dplyr, ggpubr, moments, and readr. Calibration of the dynamic energy model followed ASHRAE Guideline 14 standard [
17], with error metrics (NMBE; CV(RMSE)) computed in RStudio to ensure statistical reliability of the model validation phase. All calibration error metrics, including NMBE and CV(RMSE), were computed in RStudio to ensure methodological consistency.
3. Results
To ensure the accuracy of the energy model, monthly electricity consumption was compared against actual measured data from CFE utility bills for the year 2021.
3.1. Energy Model Calibration for Thermal Performance Analysis
The dynamic energy model was calibrated using the CFE measured utility billing data from 2021, representing the operational conditions prior to PV system installation.
Table 4 shows the monthly simulated and measured electricity consumption values and the percentage error, in other words, how much the simulation deviates from the actual consumption expressed as a percentage of the measured value.
The values were substituted in Equations (1) and (2) giving the following NMBE and CV(RMSE) results:
The NMBE of 0.061% and a CV(RMSE) of 0.503% demonstrate the ASHRAE Guideline 14 thresholds (±5% NMBE; 15% CV(RMSE)).
3.2. Influence of Photovoltaic Integration on Energy Load Dynamics
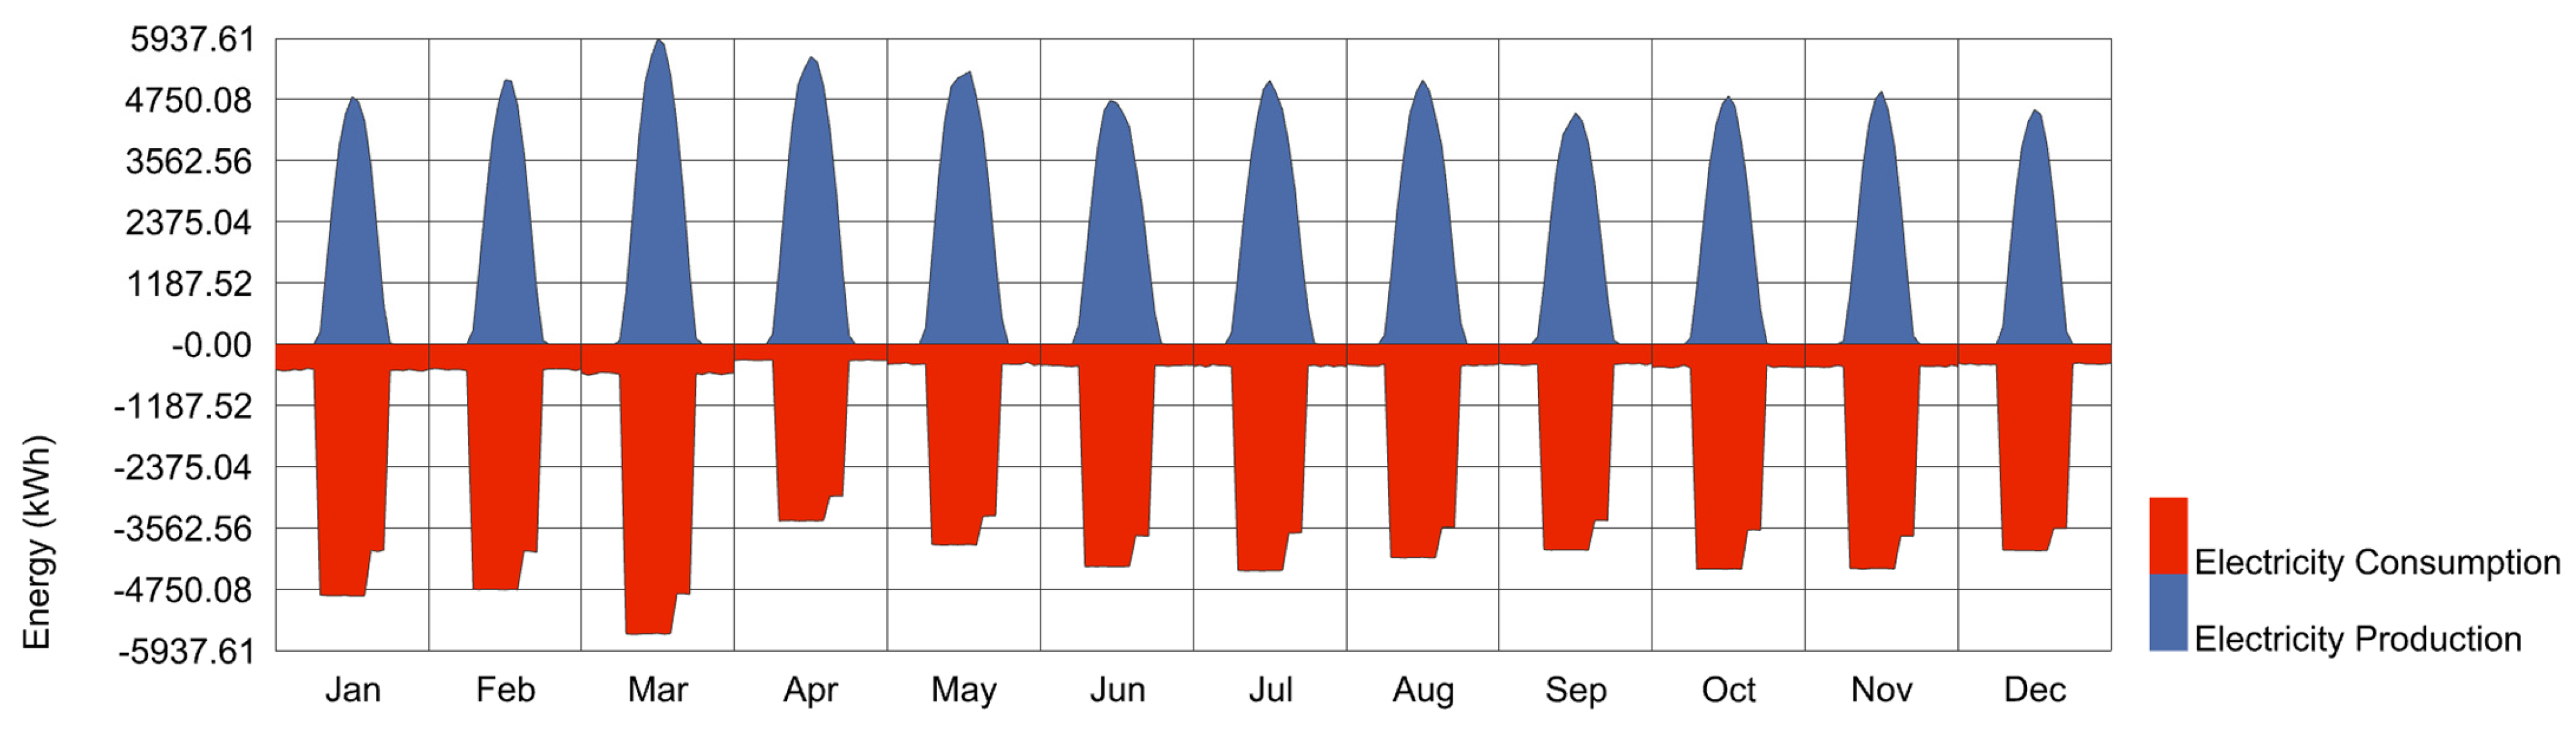
Following calibration, the PV system was integrated into the model based on the real-world specifications of the installed array. The hourly profiles of electricity consumption and PV production are illustrated in
Figure 4. Throughout the year, PV generation exhibited strong alignment with the operational schedule of the facility, peaking during midday hours and thus directly offsetting a considerable portion of daytime loads. Midday PV production approached or exceeded consumption peaks during the spring and summer seasons, enhancing the system’s self-sufficiency. In contrast, winter months exhibited lower midday production, resulting in a greater reliance on the electrical grid to satisfy demand.
The facility’s load profile remained relatively stable across all months, consistent with the regular industrial operation schedule. However, the seasonal variation in PV output produced distinct patterns in the net load, confirming the influence of climatic conditions on renewable energy integration performance. The graphical analysis highlights that while PV generation substantially reduced the daytime peak loads, it could not fully eliminate the need for supplemental energy during early morning and late evening periods.
Monthly and hourly data analyses were conducted to assess the PV system’s performance and its contribution to the facility’s electricity demands.
Table 5 presents the monthly energy balance, including total electricity consumption, total PV generation, net savings (on-site self-consumed PV energy), excess production (surplus PV generation not consumed on-site), and energy deficit (residual demand met by the grid). Notably, both excess production and a deficit can occur within the same month, as PV generation may exceed demand during certain hours (e.g., midday) and fall short during others (e.g., night or overcast periods).
The results show that the PV system covered a significant proportion of the industrial site’s demand throughout the year. The PV Coverage Rate varied from 57.7% in January to a peak of 109.3% in April, indicating that the PV system generated more energy than the facility required in some months. The Self-Consumption Rate, representing the fraction of total consumption met directly by PV, ranged from approximately 46.7% to 73.1%, highlighting the substantial on-site usage of renewable energy. Annual energy savings amounted to 49.4%, evidencing a considerable reduction in grid dependency thanks to PV integration.
Figure 5 shows the seasonal trend profiles of electricity generation and consumption at the industrial facility, derived from decomposed time series data. The blue and red lines correspond to the trend components of direct current (DC) and alternating current (AC) electricity production from the rooftop photovoltaic (PV) system, respectively, while the black line represents the smoothed trend of total on-site AC electricity consumption. The data highlight distinct seasonal patterns: PV output increases progressively from January to peak levels in May and then gradually decreases toward the end of the year, in line with local solar availability. Electricity consumption remains relatively steady throughout the year, with moderate variations due to operational schedules and climatic conditions. The plot underscores the alignment between high PV generation and consumption during spring and early summer and periods of mismatch during the rainy and winter seasons. These insights support the relevance of complementary strategies such as energy storage or demand-side management to optimize system efficiency further.
Figure 5 highlights the seasonal interaction between electricity generation and consumption at the facility. During the dry season (March to September), a significant portion of the facility’s daily electricity demand was met by PV generation, particularly during midday hours. Nonetheless, early morning and evening periods consistently required grid-supplied electricity due to the absence of solar input.
3.3. Thermal Performance Enhancement of Composite Roof Systems
While the integration of rooftop PV systems contributed to a measurable reduction in grid electricity consumption, the primary focus of this study is not on energy yield quantification. Rather, the emphasis lies in evaluating the passive thermal role of PV arrays. By covering the exposed metallic roof surfaces, the PV systems served as external shading elements, reducing direct solar heat gains and altering the thermal boundary conditions of the building envelope. This passive effect directly impacts indoor thermal comfort in industrial facilities located in hot and semi-arid climates.
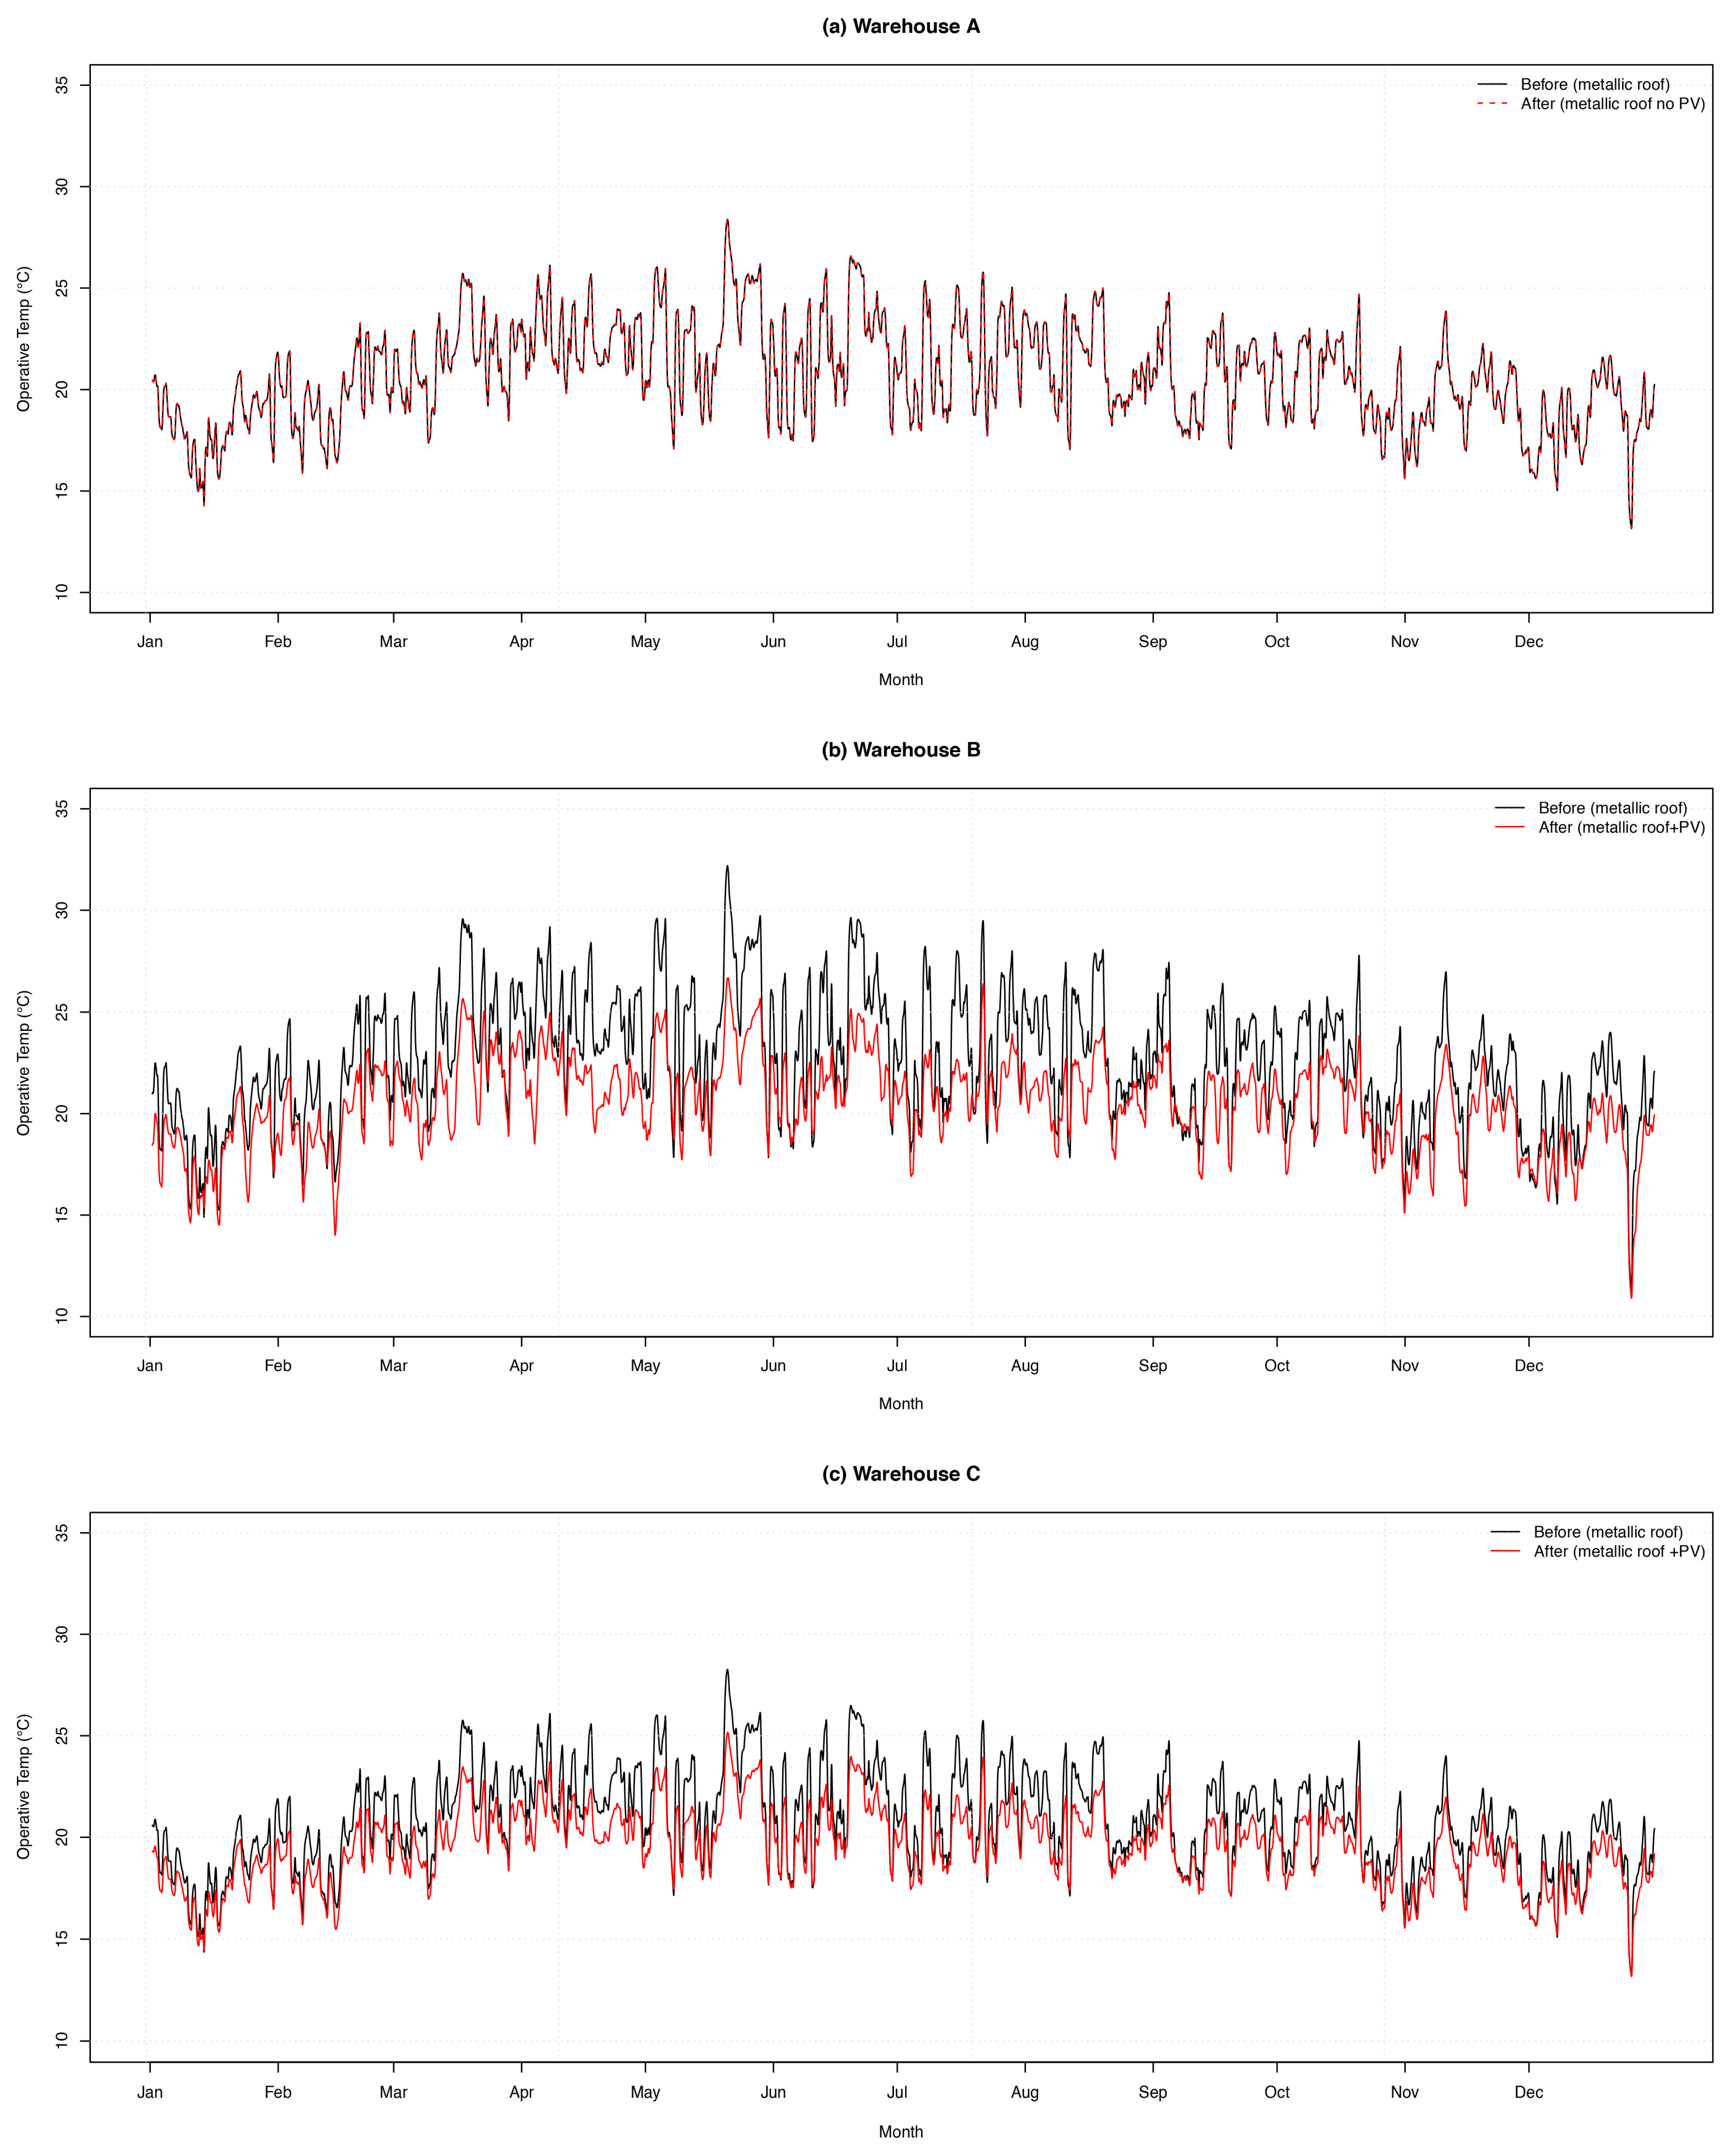
Therefore, the thermal impact of rooftop PV integration was assessed by comparing indoor operative-temperature trends under two conditions: (a) metallic roofs without PV panels and (b) metallic roofs with PV coverage. Daily average operative temperatures were computed from the hourly time series, and the difference between the “before” and “after” cases was calculated for each day of the year.
Figure 6 displays the annual trend components for each warehouse.
In Warehouse A, which did not implement a PV system, daily differences were negligible, confirming that the metallic roof alone did not undergo structural modification. In contrast, Warehouse B exhibited substantial temperature reductions, with a mean daily decrease of 2.1 °C and daily peaks of up to 6 °C. Similarly, Warehouse C showed a mean daily reduction of 1.2 °C, with maximum values exceeding 3.1 °C. These effects were most pronounced between March and September, coinciding with the dry season and periods of intense solar radiation.
These reductions are attributed to the passive shading and insulating function of the PV modules, which attenuated rooftop solar heat gains and delayed heat transfer into the occupied zones. As expected, nighttime temperatures were largely unaffected due to the absence of solar radiation. Therefore, the data confirm that PV systems provide energy generation and yield significant passive thermal performance benefits in industrial buildings with lightweight envelopes.
3.3.1. Statistical Analysis of Thermal Comfort Hypothesis
This subsubsection tests the primary study hypothesis (H1).
Statistical analysis using the Wilcoxon signed-rank test confirmed significant reductions in operative temperatures for all warehouses (p < 0.05). However, because Warehouse A did not incorporate a rooftop PV system during the study period, the practical significance of its temperature reduction was further scrutinized by analyzing shifts in thermal comfort classification rather than absolute temperature values. The thermal comfort classification was assessed using a binary metric derived from the PMV/PPD model (0 = discomfort; 1 = comfort), considering an activity level of 1.1 met, 0.7 clo insulation, and a maximum 20% dissatisfied threshold.
McNemar’s test for paired nominal data was employed to detect shifts in thermal comfort status before and after PV installation. For Warehouse A, the McNemar’s test yielded a chi-squared value of 0 with a p-value of 1, indicating no significant change in the distribution of comfort states, consistent with the absence of PV intervention. Conversely, Warehouses B and C, which incorporated rooftop PV systems, exhibited highly significant improvements in comfort status, with chi-squared values of 805.3 and 322.01, respectively (both p < 0.05).
In Warehouse A, the Wilcoxon test detects a very small but statistically significant drop in the operative temperature (median difference = 0.05 °C, p < 0.05). Because the hourly dataset contains 8,760 values, even a negligible shift can reach statistical significance. However, the associated change in the Predicted Percentage of Dissatisfied is only +0.02 percentage points. McNemar’s test therefore shows no practical improvement in comfort state (PPD ≤ 20%), highlighting that effect size, not p-value alone, determines comfort relevance. In contrast, Warehouses B and C achieved mean daily reductions of 2.11 °C and 1.23 °C, respectively, well above the 1 °C perceptibility threshold, resulting in comfort hour gains of 14.5 percentage points (B) and 16.5 percentage points (C).
The key results of the thermal performance analysis, including maximum operative temperatures, statistical test outcomes, and shifts in thermal comfort percentages, are summarized in
Table 6. While operative-temperature reductions were statistically significant in all cases, only Warehouses B and C demonstrated meaningful improvements in thermal comfort classification, attributable to the passive thermal benefits of rooftop PV integration.
The thermal performance analysis confirms that PV-covered metallic roofs, functioning as composite thermal systems, substantially reduced overheating periods and improved indoor thermal comfort percentages across the analyzed warehouses. These results validate the working hypothesis and establish rooftop PV systems as effective passive thermal management strategies for lightweight industrial envelope retrofits.
These results validate Hypothesis H1, confirming that rooftop PV systems provide statistically significant passive thermal benefits by reducing indoor operative temperatures and enhancing thermal comfort rates in lightweight industrial warehouses operating under semi-arid conditions.
3.3.2. Practical Significance of Temperature Reductions
Under the PMV/PPD method in ASHRAE 55 [
16], a representative light-industrial occupant reaches the 20% PPD limits at an operative-temperature band of roughly 22–26 °C in still air. The local slope of PMV in this regime is ≈0.25–0.35 PMV·°C
−1, so a ΔT
0 of about 1.5–2.0 °C is required to shift PMV by −0.4 to −0.7 and move an hour from “warm” (PPD > 20%) to “neutral/slightly warm” (PPD ≤ 20%). Reductions smaller than ≈1 °C seldom cross the 26 °C comfort boundary and therefore have little practical effect, even though they can be statistically significant in large hourly data sets. In our study, Warehouse A’s median drop of only 0.05 °C falls into this category, whereas Warehouses B and C, with average daytime drops of 3.6 °C and 1.9 °C, exceeded the ~1.5 °C threshold and consequently gained 14.5% and 16.5% in comfort-compliant hours, respectively.
4. Discussion
This study employed a calibrated multiscale simulation approach to investigate the role of PV arrays not only as renewable energy generators but also as passive thermal modifiers in lightweight industrial warehouses. By integrating material-level properties, envelope construction characteristics, operational schedules, and real-world calibration against utility billing data, it was possible to comprehensively assess the thermal behavior of metallic roofs modified with PV overlays under semi-arid climatic conditions.
The results demonstrated that the combination of galvanized metallic roofing and rooftop PV arrays operated effectively as a composite system for passive thermal management. By shading the metallic surfaces, the PV panels substantially reduced daytime solar heat gains without modifying the primary structural characteristics of the buildings. Thermal buffering was improved through passive means, leading to delayed and moderated indoor temperature peaks. Peak indoor operative temperatures were reduced by up to 15.3 °C, while the proportion of thermally comfortable hours increased notably, from 15.13% to 29.65% in Warehouse B and from 18.13% to 26.63% in Warehouse C after PV installation. These thermal benefits were most pronounced during the high-irradiance months between March and September, confirming that the passive cooling effect of PV systems is strongly seasonal.
However, this seasonal modulation warrants further attention. As shown in the site’s climatic and energy generation profiles (
Figure 2 and
Figure 5), solar irradiance and PV output decline markedly from October to February. Consequently, the passive cooling contribution of PV shading also diminishes during this period. Lower rooftop heat gains, higher cloud cover, and reduced solar angles limit the system’s ability to attenuate operative temperatures meaningfully. While temperature reductions remain statistically detectable year-round, their impact on thermal comfort, defined by PMV/PPD thresholds, is most evident during periods of intense solar exposure. This reinforces the need to consider seasonal dynamics when assessing the passive thermal benefits of PV integration and suggests that complementary measures may be necessary to sustain comfort benefits year-round.
In addition, the present results confirm that pairing galvanized metal roofs with full-coverage rooftop PV arrays can act as a composite passive-cooling system in semi-arid climates. In Warehouses B and C, max daily values dropped up to 5.99 °C and 3.16 °C, respectively, after PV installation. These reductions are larger than those reported for other passive roof modifications in semi-arid settings. For example, a 29-day experiment in Marrakech found that conventional static shading lowered indoor air temperature by ≤4.8 °C relative to a bare roof, while white-paint and insulation treatments achieved 7.7 °C and 6.9 °C, respectively [
23]. Numerical work in Mafraq, Jordan, showed that residential PV-shading reduced roof-related heat gains by 4.85% during summer, with only marginal winter penalties [
24]. City-scale modelling for Chaoyang, China, indicates that 100% rooftop-PV coverage can cool near-surface air by 0.4–0.7 °C and trim building cooling demand by ≈15% during extreme heatwaves [
25].
While these improvements are statistically and operationally relevant, it is important to note that full compliance with thermal comfort criteria, as defined by PMV/PPD models, was not achieved. The buildings remained largely outside the acceptable comfort envelope, with less than one-quarter of the annual hours classified as comfortable. Therefore, the rooftop PV retrofit should be viewed as a relative enhancement that mitigates peak overheating in free-running warehouses rather than a strategy that attains absolute thermal comfort compliance. Future studies could combine PV shading with additional passive measures (e.g., radiant barriers; nighttime ventilation) or adaptive comfort criteria to further narrow the comfort gap.
Importantly, this study validates that PV arrays, when integrated over lightweight composite roofing systems, can serve a dual purpose: generating renewable energy while simultaneously enhancing thermal comfort. These results reinforce the conceptualization of PV arrays not merely as energy devices, but as functional layers within advanced composite envelope designs tailored for industrial passive cooling applications.
The findings of this research are consistent with, but extend beyond, previous studies. Gao and Chung [
6] demonstrated that passive shading strategies, including the use of solar panels, reduced peak indoor temperatures in heritage buildings; however, their analysis lacked real-world calibration. In contrast, the present work couples dynamic simulation with calibration against actual energy consumption data, enhancing the validity of the results for operational industrial settings. Similarly, Barone et al. [
2] observed thermal comfort improvements linked to building-integrated photovoltaic/thermal (BIPV/T) systems. However, their focus included active thermal contributions, whereas this study isolates the passive thermal performance enhancements attributable solely to PV shading.
Prior works by Triana et al. [
11] and Liao et al. [
12] emphasized the importance of rooftop PV deployment in industrial environments, focusing mainly on energy surplus dynamics without evaluating the associated impacts on indoor thermal conditions. The present study closes this gap by demonstrating the contribution of PV systems to improvements in thermal comfort, particularly in unconditioned industrial warehouses.
Complementary efforts, such as those of Ahmed et al. [
9] and Monnier et al. [
15], have explored sustainable material innovations aimed at enhancing thermal comfort, including the development of bricks with improved thermal properties. While material substitution was not addressed here, this study complements those contributions by demonstrating that PV arrays, when integrated into metallic envelope structures, can similarly enhance thermal performance without altering the primary load-bearing construction. Additionally, the simulation framework applied here builds upon the multiscale modeling practices advocated by Rekutov et al. [
3] and Jeong et al. [
8], combining material, envelope, and operational scales into a unified predictive model validated through real-world data.
Thus, this research bridges an important gap in the literature by systematically linking rooftop PV integration, multiscale dynamic simulation, statistical validation, and thermal comfort outcomes in free-running industrial warehouses, an area that remains critically underserved in current scientific discourse.
Nevertheless, certain limitations must be acknowledged. First, the buildings analyzed were operated without mechanical HVAC systems. Consequently, the passive thermal benefits observed here may not directly extrapolate to mixed-mode or fully conditioned industrial facilities. Second, while operational schedules and internal gains were carefully reconstructed based on actual facility usage patterns between 2021 and 2023, future variations in production processes or occupancy patterns could alter thermal dynamics.
Additionally, PV system degradation effects, including soiling accumulation and module aging, were considered through standard derating assumptions but not explicitly modeled as time-evolving phenomena. The assessment of thermal comfort relied on conventional PMV/PPD models, which, while standardized and widely accepted, may not fully account for occupant behavioral adaptations, particularly in free-running industrial environments where clothing and activity levels might vary seasonally. Future studies should integrate adaptive comfort frameworks and longitudinal PV performance monitoring to enhance predictive reliability.
5. Conclusions
This study confirmed that integrating rooftop PV arrays onto lightweight metallic industrial roofs provides a dual-function benefit: substantial reductions in grid electricity consumption and significant moderation of indoor thermal conditions. Through calibrated dynamic simulations validated against actual energy consumption data, it was demonstrated that rooftop PV systems passively reduce peak operative temperatures and meaningfully improve thermal comfort conditions in free-running industrial warehouses.
The results validated the initial hypothesis, emphasizing that PV panels, beyond their energy generation role, enhance the thermal performance of composite roof systems in semi-arid industrial contexts. Indoor operative temperatures were reduced by up to 15.3 °C (from 53.01 °C to 37.71 °C in Warehouse B), and the percentage of thermally comfortable hours improved by approximately 10 percentage points, confirming the significant role of rooftop PV systems as passive thermal modifiers in lightweight composite industrial roofs.
These findings position rooftop PV systems as a critical element not only for industrial decarbonization efforts but also for enhancing occupational thermal resilience without the need for mechanical cooling, particularly in regions with high solar resource availability. Locally, this research may have direct impact and implementation also in the housing sector, in the semi-arid zones of Mexico, in states like Chihuahua, Coahuila, Zacatecas or San Luis Potosí, which face extreme climate conditions (high temperatures and intense solar radiation) and in whose most vulnerable communities it is common to find metal roofs on houses (with important internal overheating phenomena that are worsening due to climate change). This research suggests that rooftop PV Integration could be a valid technical implementation for retrofit, which may drastically improve living comfort and quality of life.
Future research should expand this approach by exploring hybrid passive strategies that combine PV shading with dynamic ventilation controls and advanced envelope technologies such as phase change materials (PCMs) or aerogel-enhanced composites, aiming to further optimize thermal buffering capabilities and improve overall thermal stability. The integration of adaptive thermal comfort models, which account for seasonal variations and occupant-specific behaviors, will be crucial for more accurately predicting real-world indoor environmental conditions. Moreover, the development of multiscale dynamic digital twins incorporating real-time indoor environmental monitoring would enable predictive operational adjustments and more robust comfort management over time. Long-term simulation frameworks that consider PV system degradation, maintenance cycles, and the effects of future climate change scenarios will be essential to validate the durability and extended performance of PV-composite systems. Expanding the validation framework to encompass diverse climatic zones, including humid tropical and cold temperate environments, will further enhance the generalizability of the proposed passive cooling strategy. Finally, coupling passive thermal performance evaluations with techno-economic optimization models would provide a more holistic understanding of the lifecycle benefits and broader applicability and adoption of PV-enhanced composite envelope retrofits in industrial sectors worldwide.


 ,
, 


