Abstract
With the continued advancement of shale gas development, the issue of frac hit has become increasingly prominent and has emerged as a key factor influencing the production of shale gas wells. Quantitative evaluation of the impact of frac hit on shale gas wells and proposing different methods to prevent frac hit are of great significance for the efficient development of shale gas. This research puts forward a machine learning-based workflow that incorporates geological and engineering factors to evaluate the impacts of frac hit. The “Frac Hit Pressure Integral Index (FPI)” quantifies the dynamic pressure responses by means of the ratios of initial pressure to shut-in pressure. Pearson analysis is employed to reduce the dimensionality of parameters, and Random Forest and K-means++ algorithms are utilized to classify the risks of frac hit. Among numerous influencing factors, it has been found that the brittleness index and well spacing possess the highest weights among the geological and engineering influencing factors, reaching 20.4 and 16.1, respectively. The L well area of southern Sichuan shale gas lies in the Fuji syncline of the Huaying Mountain tectonic system’s low-fold Fujian zone. When applied to the L well area in the Sichuan Basin, the results pinpoint the brittleness index, fluid intensity, and well spacing as crucial factors. It is recommended that, for reservoirs with high fracturability, reducing fluid intensity and increasing well spacing can minimize inter-well interference. This workflow classifies risks into low (FPI ≤ 265.43), medium (265.43 < FPI < 658.56), and high levels (FPI ≥ 658.56) and recalibrates natural fracture zones based on pressure and flowback data, thereby enhancing the alignment between geological and engineering aspects by 10%. This framework optimizes fracturing designs and mitigates inter-well interference, providing support for the efficient development of shale gas.
1. Introduction
Hydraulic fracturing on a large scale at platform wells represents a critical strategy for maximizing the exploitation of deep shale gas reservoirs and for attaining higher investment returns [1]. However, due to the small inter-well distance and the abnormal development of natural fractures, this method of production enhancement often leads to the problem of frac hit [2,3]. To optimize the large-scale development of deep shale gas reservoirs, precise evaluation of frac hit is required on-site.
During the process of reservoir stimulation, as the well spacing is shortened, the fractures of the fracturing wells are highly likely to connect with the natural fracture zones in a single direction. This can induce a rapid increase in the pressure of adjacent wells, thereby triggering the issue of frac hit. According to statistics, since 2022, more than 84% of the horizontal wells in the southern Sichuan region have been affected by frac hit. Specifically, for adjacent wells with a distance of 300 m, the pressure increase exceeds 30 MPa, and for those with a distance ranging from 600 to 1000 m, the pressure increase can still reach as high as 20 MPa. Affected by frac hit, the scope of fracturing stimulation for wells on the platform is limited [4]. Meanwhile, the problem of casing deformation occurs in adjacent wells. As a result, the horizontal wells have not been fully exploited and utilized, and the effectiveness of reservoir stimulation has been significantly reduced.
To gain a more accurate understanding of the impact of frac hit, a series of measures such as pressure sensors, DFIT (Diagnostic Fracture Injection Test) mini-frac tests, chemical tracers, microseismic monitoring, and fiber optic monitoring are used to monitor the hydraulic fracture morphology and the response of adjacent wells in real-time during hydraulic fracturing [5,6,7,8]. By analyzing fracture asymmetry, fracturing fluid flowback rates, and adjacent well pressure increases, the extent of frac hit can be quantitatively assessed. Since 2014, Sardinha et al. [9] have identified the timing of frac hit by monitoring the pressure responses of fracturing wells and production wells. Their research found that when there is connectivity between the fracturing well and the adjacent well, the pressure in the adjacent well rises rapidly, and the pressure peak also increases. Crespo et al. [10] analyzed 2345 microseismic data points and obtained the morphology of hydraulic fractures through numerical inversion methods. They clearly observed that the fractures from the fracturing well extended towards the adjacent well, thereby confirming the occurrence of frac hit. It is evident that, while these methods are often accurate and intuitive, they tend to be expensive, time-consuming, and less efficient.
In recent years, frac hit analysis methods based on production testing, RTA (Rate Transient Analysis), PTA (Pressure Transient Analysis), and MPI (Multiwell Productivity Index) have developed rapidly [11,12]. These methods analyze the sources and impacts of frac hit, making the design of anti-interference techniques easier and more efficient. In 2016, Awada et al. [13] developed a testing procedure to identify frac hit. This method quantifies the extent of frac hit by shutting in adjacent wells in a multi-well system and testing the pressure recovery rate of the adjacent wells. In 2022, Qin et al. [14] invented a comprehensive diagnostic method for frac hit and inter-well interference by integrating PTA and RTA methods. This approach uses EDFM to couple natural fractures into the CFN (complex fracture network) model, accurately reflecting the interaction mechanisms between fractures. It quantitatively characterizes the extent of frac hit through the analysis of multi-fracture pressure and production interference, improving the accuracy of interpreting inter-well interference using pressure and production data in the field. By 2023, M. Almasoodi et al. [15] proposed a new method for interpreting frac hit. This method extends the MPI method invented by Chu et al. and introduces the DPI index (production interference analysis), which considers the effects of fracture conductivity, fluid, and rock property changes. It establishes the relationship between dimensionless well spacing and the DPI index, identifying the timing of frac hit. Wang et al. [16] developed a coupled semi-analytical flow model (FSM) for evaluating frac-hit interference in shale oil reservoirs. Results show that under steady-state production conditions, the model can achieve accurate identification of frac-hit interference in hydraulically fractured horizontal wells through Laplace transformation and Stehfest numerical inversion. Overall, compared with the diagnostic technology for frac hit response, statistical methods exhibit remarkable advantages in terms of cost control and operational convenience. Although some statistical methods, such as the response surface methodology, have certain limitations in terms of operational convenience, they possess prominent advantages in terms of cost effectiveness. They are capable of achieving effective analysis and evaluation with lower economic input. However, because they rely on production testing as a prerequisite and overlook complex processes such as micro-fracture reopening and propped fracture closure, these methods have the limitations of idealized assumptions and a narrower scope of applicability.
Due to the high costs of frac hit response characteristic analysis and the limited accuracy of methods such as RTA, as well as the complexity and high time cost of numerical simulation methods, the application of artificial intelligence and machine learning methods in the evaluation and analysis of frac hit has become a mainstream trend [17,18]. In 2020, Shahab et al. from West Virginia University [19] utilized shale gas well fracturing-production dynamic data and integrated a wellbore-reservoir-hydraulic fracture numerical simulation model to establish the “Shale Dynamic Analysis” process. This process identified and predicted frac hit, significantly saving time and costs and laying the foundation for the establishment of an “Intelligent Frac hit Prediction System.” By 2023, Wu et al. [20] used long short-term memory and multilayer perceptron neural networks to take pressure and production time series as samples. They innovatively identified the interactions of frac hit between different well sites and accurately predicted the probability of frac hit, providing adjustment suggestions for construction parameters. Zhang Qing et al. [21] used the random forest algorithm for the first time to qualitatively analyze and intelligently predict the degree of frac hit, identifying the main controlling factors affecting frac hit and providing a reliable method for the evaluation and prevention of shale gas well frac hit. It is evident that machine learning methods are effective in understanding and evaluating frac hit.
In recent years, a great many Quantitative Evaluation Methods for Frac Hit based on pressure data have emerged.
Traditionally, observing the change in bottomhole pressure of a parent well (adjacent well) during the fracturing process of a child well has been an important indicator for evaluating fracture interference in shale gas wells. However, although this method is more intuitive and convenient for statistical purposes, it cannot accurately describe the dynamic response of adjacent well pressure over time during frac hit and fails to consider the time effect of frac hit.
In this section, the overall calculation method of PCI (Pressure Change Integral) is reviewed. For the convenience of the study, it is assumed that there is only one fracturing well and one adjacent monitoring well on the gas well fracturing platform. During the fracturing process of the fracturing well, the pressure of the adjacent well is monitored simultaneously to observe its changes. Therefore, the pressure change integral of the adjacent well throughout the process can be expressed as:
Here, represents the wellhead pressure of the adjacent wells during the fracturing process, is the initial wellhead pressure of the adjacent well.
Therefore, Guo et al. [22] believe that PCI, which characterizes the extent of fracture interference, has a high correlation with the production of adjacent wells after they are put into production and significantly impacts productivity.
In actual field operations, the closer the adjacent well’s pressure is to the initial shut-in pressure, the more difficult it will be to rise. However, this method overlooks the relative difficulty of achieving the highest pressure increase in the adjacent well, still presenting some deficiencies in evaluating the extent of frac hit.
However, the existing evaluation methods for the degree of frac hit have certain deficiencies. The currently proposed evaluation methods for the degree of frac hit mainly rely on the pressure increase in adjacent wells or the integral of the pressure change in adjacent wells to characterize it. Nevertheless, there are the following problems: It is impossible to determine the degree of frac hit for adjacent wells with the same pressure increase. There is an element of contingency, and the correlation with production is poor. After considering that adjacent wells are affected by frac hit, the relative difficulty of the pressure increase in adjacent wells has not been taken into account.
Therefore, the focus of this paper is to propose a method for evaluating frac hit in shale gas wells. This method quantitatively describes the frac hit characteristics of typical shale gas wells and analyzes the impact of complex geological and engineering factors on frac hit.
2. The Workflow for Quantifying Frac Hit
Based on the integral index of pressure changes in adjacent wells, we propose a quantitative evaluation index for frac hit—“Frac hit Pressure Integral Index” (FPI)—to analyze the extent of frac hit. Combining this with machine learning technology, we have established a brand-new workflow for evaluating frac hit in shale gas wells. Each step is discussed in detail in the following sections.
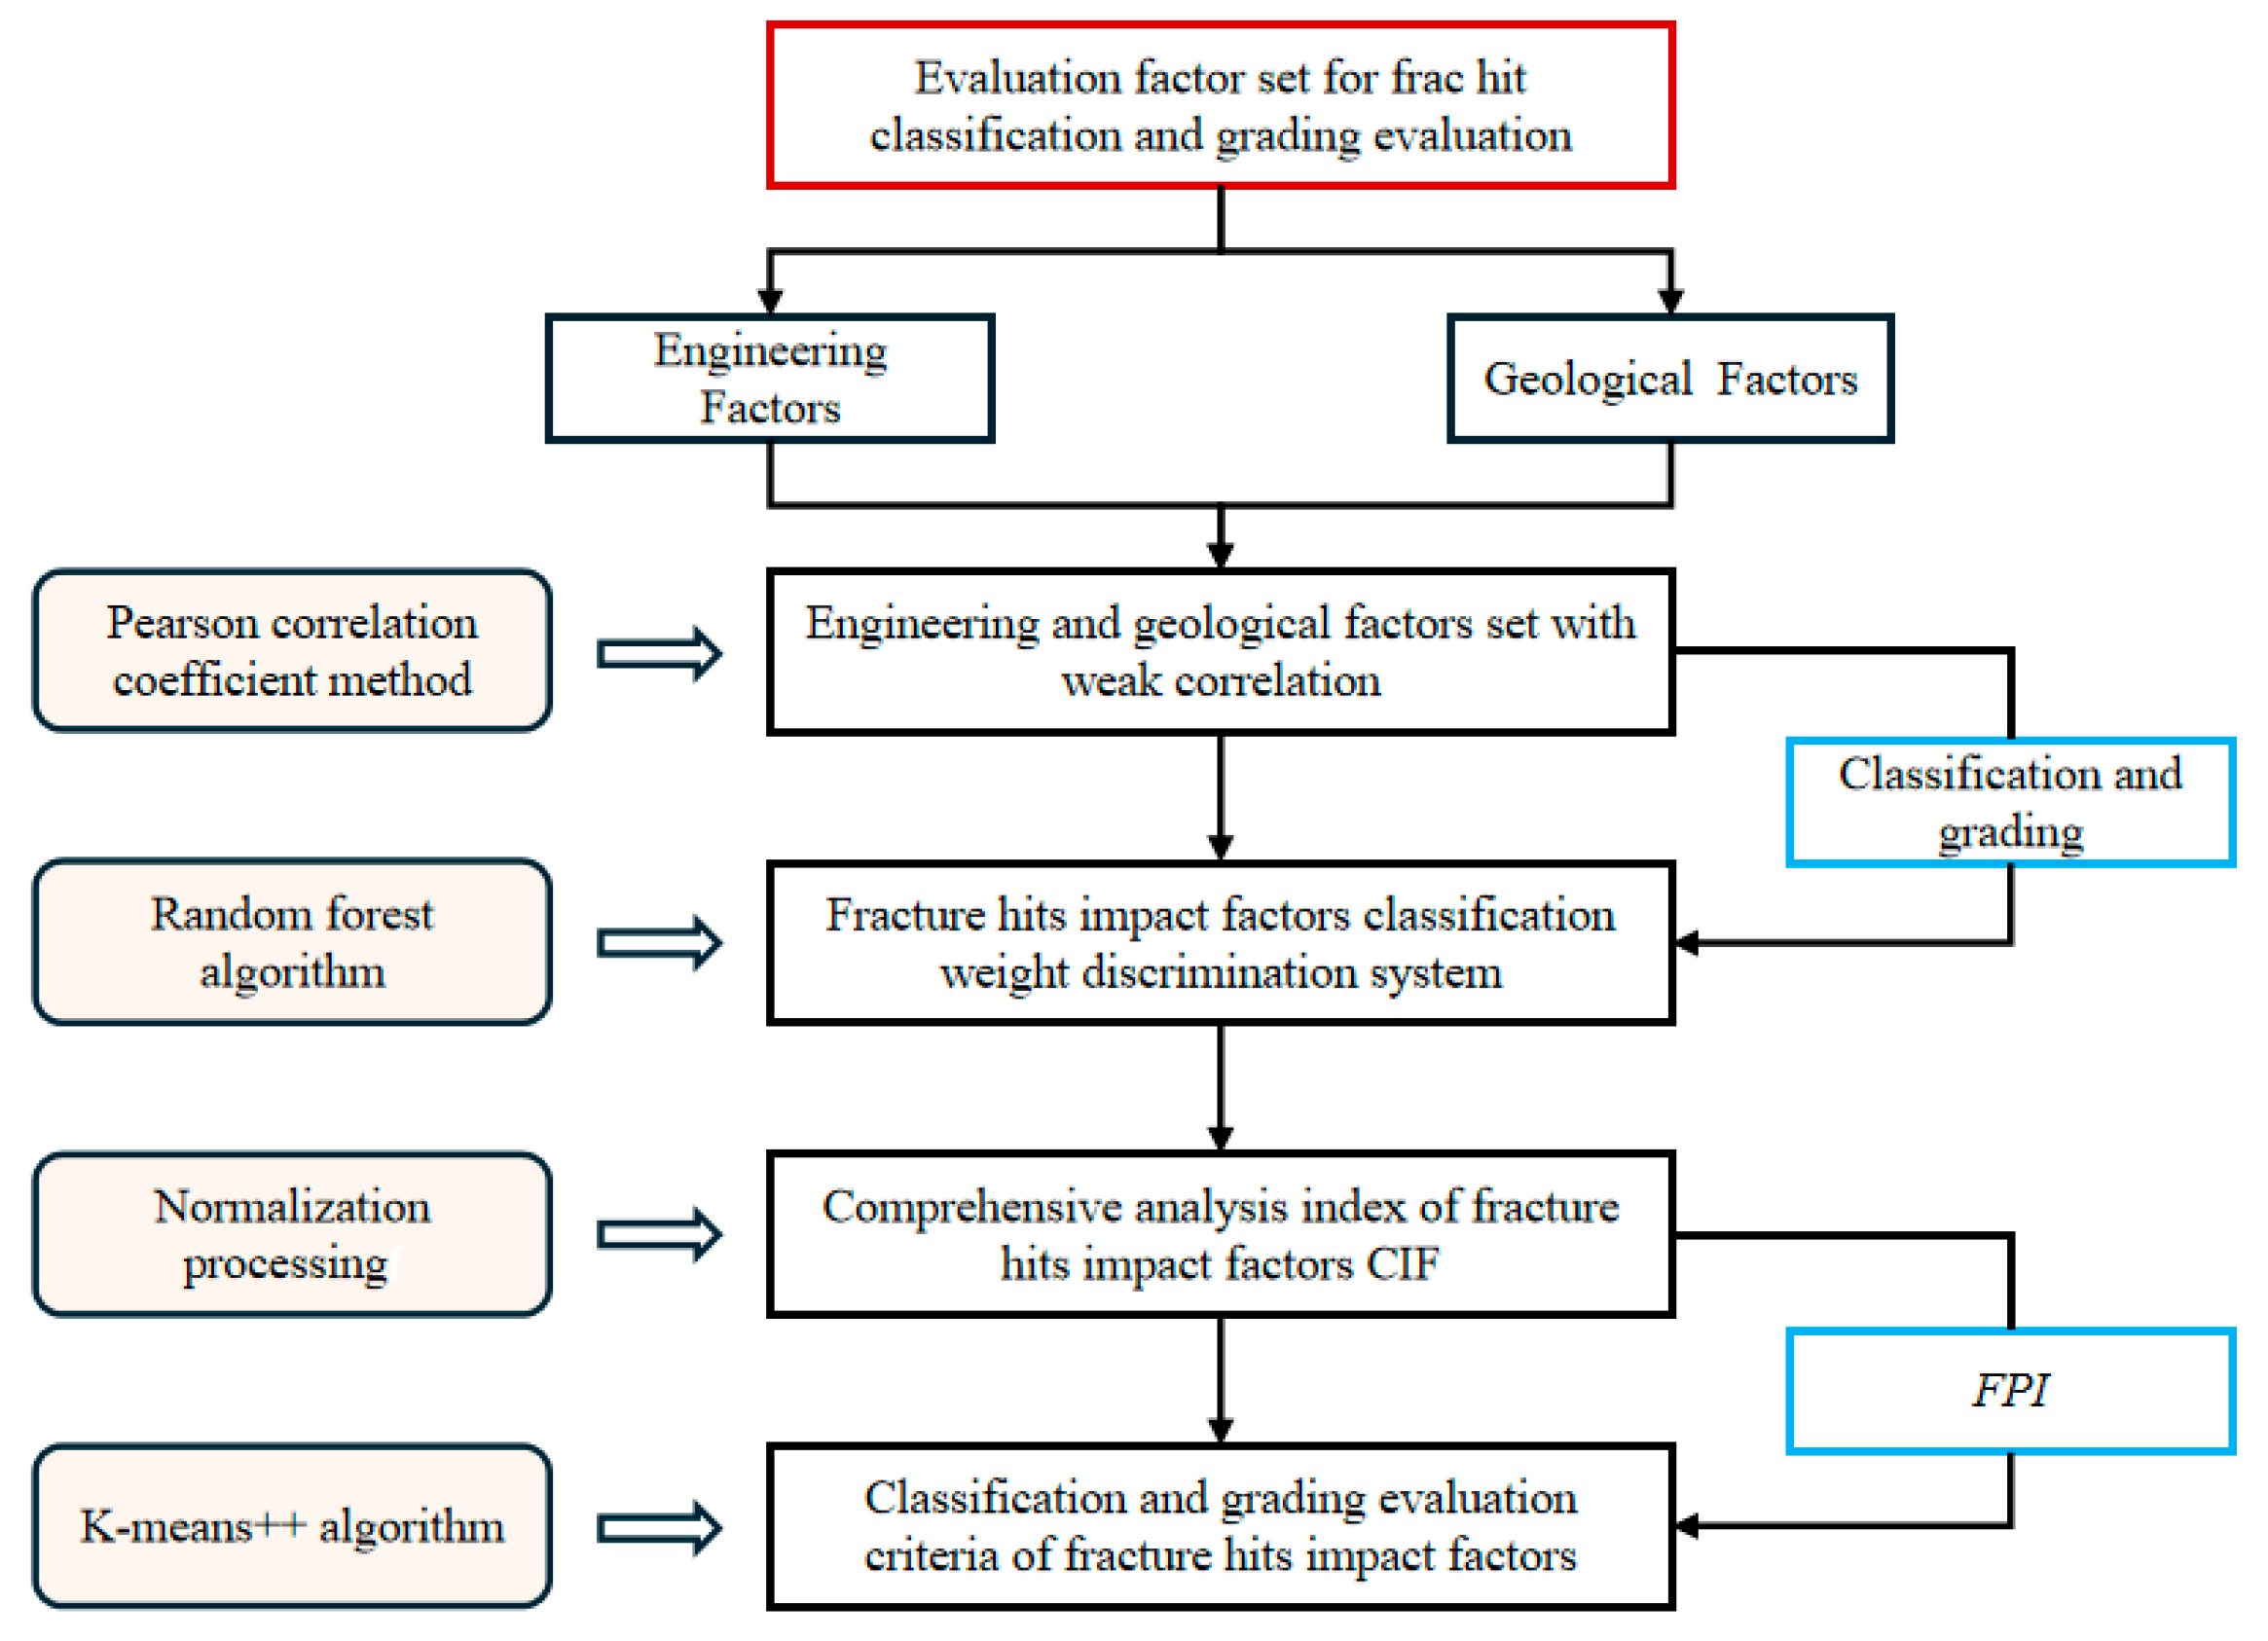
The specific process is shown in Figure 1.
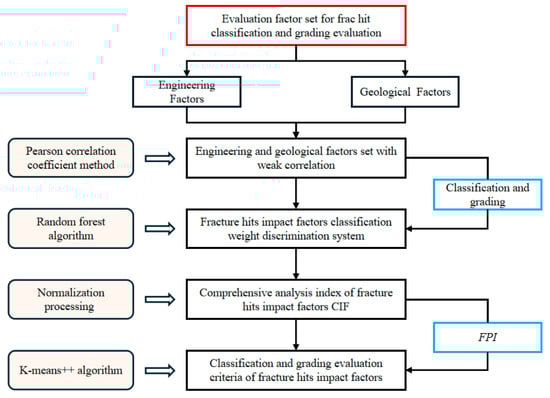
Figure 1.
Shale gas wells frac hit comprehensive evaluation process diagram.
- Categorize the factors influencing frac hits into engineering and geological factors.
- Utilize the Pearson correlation coefficient method to obtain an engineering and geological factor set with a weak correlation from the factors identified in Step 1.
- Employ the random forest algorithm to construct a classification weight discrimination system for fracture hits impact factors.
- Conduct normalization processing to derive the Comprehensive Analysis Index of Fracture Hits Impact Factors (CIF).
- Apply the K-means++ algorithm to establish the classification and grading criteria for fracture hits impact factors, and subsequently perform classification and grading.
- Establish the “Frac Hit Pressure Integral Index” (FPI).
2.1. Step 1: Creating FPI for Describing the Extent of the Impact of Frac Hit
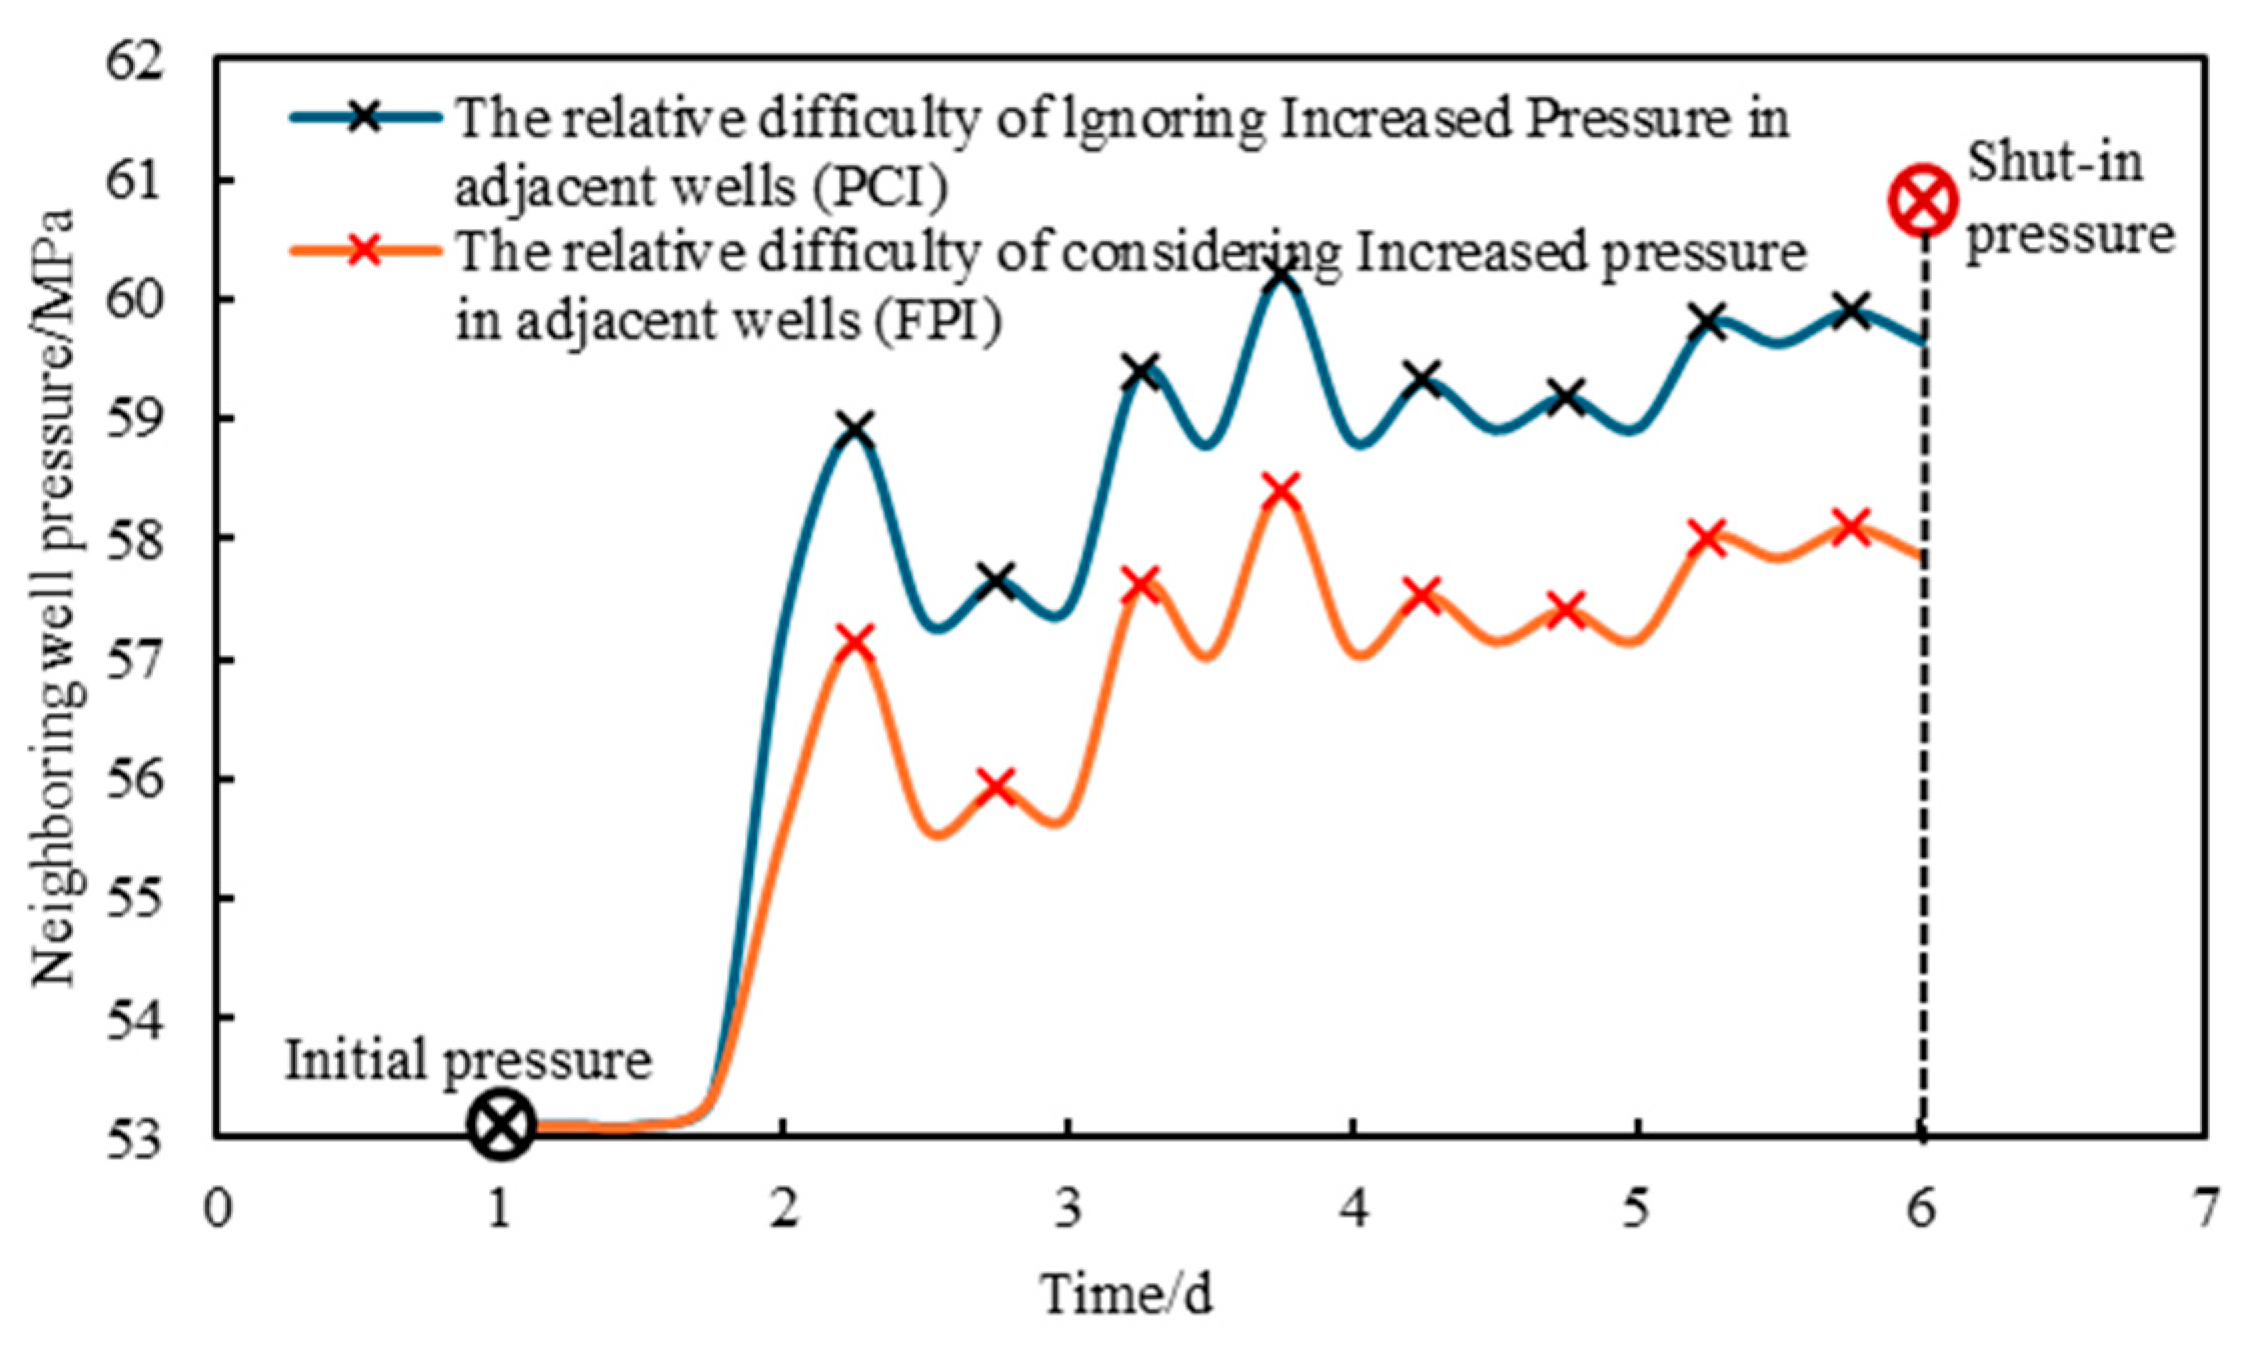
To accurately characterize the changes in adjacent wells’ pressure over time during the fracturing process of a shale gas well and reflect the degree of frac hit interference in deep shale gas wells, the FPI was established using a pressure integral method, further enhancing the evaluation dimensions of frac hit impact. Compared to the adjacent wells pressure change integral method, the FPI considers the changes in adjacent wells’ pressure during the fracturing process by adding one parameter, the shut-in pressure, to the original formula, as shown in Figure 2. The FPI considers the cumulative effects of pressure changes, providing evaluation results for frac hit interference that better align with actual field conditions. The calculation formula can be expressed as follows:

Figure 2.
Calculation curve schematic diagram of adjacent wells FPI.
In the equation, is the shut-in pressure of the adjacent well.
Taking Figure 2 as an example, the calculation result of FPI is the area below the red line in the figure, while the calculation result of PCI is the area below the blue line in the figure. It is observed that the red line shows a trend of overall downward shift compared to the blue line, which somewhat reduces the difference in the degree of frac hit between adjacent segments. To validate the consistency of the FPI method with actual field conditions, we conducted a detailed comparison between the calculated FPI results along the wellbore and the known distribution of natural fracture bands in the field. Our study revealed that areas with higher FPI values show good agreement with the locations of large-scale natural fracture bands observed in practice. Specifically, in our FPI result map, the high-value areas interpreted as large-scale natural fracture band locations demonstrated significant consistency with their actual distribution. In contrast, results obtained using the PCI method showed lower accuracy in predicting the distribution of natural fracture bands. This comparative analysis not only confirms the close alignment of the FPI method with field observations but also highlights the advantages of FPI over PCI in practical applications. The high degree of consistency indicates that FPI, as a new method for evaluating frac hit, can more accurately reflect the geological features and fracturing effects in the field, providing a more reliable basis for fracturing design optimization and productivity assessment.
2.2. Step 2: Dividing the Factors Influencing Frac Hit into Engineering and Geological Categories
Using the Analytic Hierarchy Process (AHP) [23], all factors are divided into four levels: the first-level indicator is the FPI evaluation index, the second-level indicators are geological factors and engineering factors, and the third-level indicators include cluster spacing design, fracturing pumping parameters, anti-interference measures, reservoir storage capacity, reservoir fracability, and reservoir mechanical properties. Finally, the third-level indicators are further refined into 15 influencing factors, such as fracture stage length and fluid intensity, as fourth-level indicators. By integrating all the evaluation indicators across these levels, a comprehensive hierarchical system for evaluating the degree of frac hit interference is established, as shown in Figure 3.
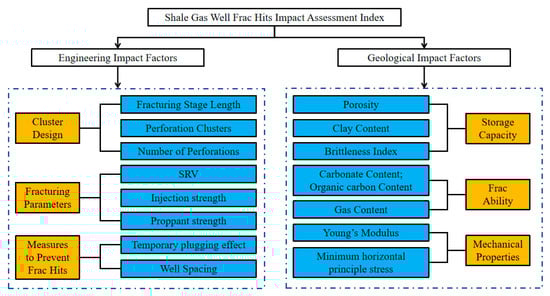
Figure 3.
Frac hit degree evaluation grading index spectrum chart.
2.3. Step 3: Analyzing the Correlation Between Different Influencing Factors
From the hierarchy of indicators, it can be observed that there may be strong correlations between various engineering and geological factors, which can be considered as a single category in the evaluation of frac hit interference. Therefore, the Pearson correlation coefficient method is used to quantify the linear relationships between different factor variables.
The Pearson correlation coefficient is sensitive to the linearity of the relationship and assumes that the data follows a normal distribution [24]. It is computed using the formula:
Here, and represent the observed values of the two variables, while and denote their respective means. The numerator calculates the covariance, indicating the consistency of the variables’ changes. The denominator normalizes the covariance by dividing it by the product of the standard deviations of the two variables.
It is worth noting that the correlation coefficient typically ranges from −1 to 1. The closer it is to 1, the stronger the positive correlation; the closer it is to −1, the stronger the negative correlation. When the coefficient is 0, it indicates that there is no linear relationship.
2.4. Step 4: Calculate the Weights of the Various Factors Affecting Frac Hit
Once the correlations between different influencing factors are obtained, it is necessary to calculate the weights of the various factors affecting frac hit. However, due to the numerous factors and high dimensionality of the indicators, conventional methods such as Principal Component Analysis (PCA) are challenging for weight calculation. The RF (Random Forest) algorithm, as a crucial tool for elucidating key factors affecting shale gas production, has demonstrated significant reliability in analyzing characteristic datasets of deep shale gas wells. Its application is broad, covering critical tasks such as feature selection and predictive modeling in geological and engineering data analysis.
Random Forest (RF) is an ensemble learning method that operates by constructing a multitude of decision trees at training time and outputting the class, that is the mode of the classes of the individual trees [25,26]. The corresponding loss function of RF is defined as:
where is the mean of y for cases where the j-th variable does not exceed , while is the mean of y where the j-th variable surpasses .
In the architecture of Classification and Regression Trees (CART), each node is delineated by the inclusion of subsets of data, denoted as Ds. The CART algorithm is tasked with identifying the optimal feature for partitioning and the specific value that effectively divides Ds into two distinct groups in pursuit of reducing the loss function. Following the training phase of CART, the convergence of various independently trained CARTs yields the Random Forest (RF) model, an ensemble that encapsulates the diversity and collective decision-making capabilities of its component trees.
The RF algorithm is based on the concept of Bootstrap aggregating, where multiple subsets of the original dataset are created and used to build separate decision trees. Each tree is grown to the maximum depth allowed and then pruned back to a depth that is sufficient to ensure each node is pure or nearly pure. The final prediction is made by averaging the predictions of all the individual trees. One of the key advantages of RF is its ability to handle nonlinear relationships and interactions between features, making it a versatile tool for complex datasets. Additionally, it is less prone to overfitting due to the ensemble nature of the algorithm, as it combines multiple models to reduce the risk of individual model errors. By calculating the Gini coefficient of each decision tree node, RF effectively evaluates the relative importance of different factors, thus promoting a wise decision-making process. Its ability to alleviate over-fitting and accommodate diverse data types makes it an ideal tool for identifying the main controlling factors that affect the degree of frac hit.
This paper’s weighted calculation of frac hit influence factors is carried out based on the Random Forest algorithm. By assigning weights to factors of different levels in engineering and geological aspects and conducting importance ranking, the main controlling factors affecting the degree of frac hit are clarified.
2.5. Step 5: Establishing CIF to Analyze Frac Hit Impact Factors from Multiple Angles
To reduce the one-sidedness of single-factor evaluations of frac hit, this study established the comprehensive analysis index CIF using “multidimensional factors + machine learning” to analyze the impact of frac hit from multiple dimensions. Firstly, combining the results of the Pearson correlation coefficient, the engineering and geological factors affecting frac hit in deep shale gas wells were divided into positive and negative dimensions, as shown in Table 1.

Table 1.
Classification of the positive and negative factors of frac hit in shale gas wells.
It can be observed that the larger the well spacing, the less interference the fractures cause to other wells, and the lower the likelihood of frac hit, which is considered a negative factor. On the other hand, the longer the fracturing section length, the easier the fractures can communicate with other wells, increasing the chances of frac hit, which is considered a positive factor. Based on the classification of positive and negative factors and the weight analysis of factors influencing frac hit, a comprehensive analysis index CIF for assessing the impact of geological and engineering factors on frac hit in deep shale gas wells is proposed. The formula is as follows:
In the formula, P represents positive factors, N represents negative factors, n represents the number of positive factors, m represents the number of negative factors, Wi and Wj, respectively, represent the weights of the positive and negative factors.
2.6. Step 6: Calculating the Classification and Grading Boundaries of Influencing Factors on Frac Hit
When evaluating the impact of frac hit on shale gas wells, it is important to categorize the numerical values representing the degree and factors of interference into different levels, in order to qualitatively determine the extent of interference for a particular well. The division into levels involves assigning a range of values to clusters within each level, and clustering algorithms can facilitate the clustering aspect of this task and provide cluster centers for different indicators within each cluster, thereby aiding in the establishment of a comprehensive evaluation model and yielding more meaningful results. Furthermore, incorporating the factors that may influence inter-well interference along with the degree of interference as features into the clustering model, rather than analyzing the interference degree in isolation, can lead to a more complex and meaningful model.
Addressing the limitations of traditional quantitative descriptions of frac hit and the lack of systematic classification and evaluation standards, a multi-factor interactive clustering algorithm, K-means++ is utilized to construct a deep shale gas well frac hit classification and grading evaluation model [27]. This model enables quantitative evaluation and qualitative classification of different types of frac hit and proposes classification and grading thresholds. The K-means++ algorithm [28], with improved initialization of cluster centers, enhances clustering effectiveness and is suitable for cluster analysis of factors influencing frac hit.
Summarize the sample set D of normalizing the FPI and the Comprehensive Influence Factor (CIF) of frac hit, and randomly select a sample as the first cluster center μr. For each point Xi that has not been selected, calculate the distance between Xi and the nearest cluster center that has already been selected with the formula as follows:
Select a new data point as a cluster center based on the criterion that a point X with a larger corresponding dist(X) is more likely to be selected as a cluster center. The probability of it being selected is given by the formula:
Continuing for each unselected point Xi in the dataset., calculate the distance between Xi and the nearest selected cluster center until three cluster centers are selected, corresponding to initial mean vectors for high frac hit risk, medium frac hit risk, and low frac hit risk.
Recompute the distance between each data point Xi and each centroid vector, label the sample Xi into the corresponding cluster Ck based on the nearest mean vector. For i = 1,2, 3....k, replace the original centroid with the center point of all samples in each cluster. Repeat the step of assigning each sample point to the cluster closest to it until the center points do not change, at which point the algorithm terminates.
3. Demonstrate the Workflow Using a Gas Field Situation Example
3.1. Case Study of Shale Gas Well Frac Hit from the Sichuan Basin
The L well area of southern Sichuan shale gas is in the Fuji syncline structure of the low-fold Fujian zone, part of the Huaying Mountain tectonic system. The Fuji syncline is characterized by a “narrow anticline and wide syncline” feature, flanked by two sides of anticlines. Primary (displacement > 300 m) and secondary faults (displacement 50–300 m) are not developed near the syncline. However, tertiary and quaternary small interlayer faults (displacement 10–50 m) are mainly developed. These small faults do not significantly damage the reservoir but can easily affect the propagation of hydraulic fractures, greatly impacting frac hit. The maximum horizontal principal stress direction in the well area is nearly east-west (between 85° and 105°), consistent with adjacent areas, and nearly perpendicular to the long axis of the structure, with a slight deflection in the structural transition zone. The minimum horizontal principal stress ranges from 95 to 101 MPa, with an average of 90.8 MPa. The horizontal stress difference ranges from 12.9 to 16 MPa, with an average of 14.5 MPa. The stress index ranges between 1 and 2, indicating a strike-slip fault stress state, which is less stable compared to the normal fault state in gently structured areas, leading to a higher risk of casing deformation [29,30,31].
3.2. Quantitative Analysis of Frac Hit Severity in Different Gas Wells
Based on the pressure response of adjacent wells during the construction process of dozens of frac stages in three fractured wells (well L-1, well L-2, well L-3) in the L well zone in South Sichuan, the FPI distribution of each well and each stage was calculated on a well-by-well basis, as shown in Table 2.
Table 2.
Response characteristics of frac hit in three horizontal wells in the L well zone after hydraulic fracturing.
From Table 2, the maximum pressure increase in adjacent wells caused by Well L-3 is relatively small, and the frequency and severity of leakage and frac hit are also relatively low. In contrast, the maximum pressure increase in adjacent wells for Wells L-1 and L-2 is relatively large, with higher frequencies and greater severity of leakage and frac hit. According to the calculation results, the severity of frac hit is ranked as follows: Well L-2 > Well L-1 > Well L-3.
3.3. Comprehensive Evaluation of Shale Gas Well Frac Hit Classification and Grading
To achieve results that more closely reflect actual field conditions, the current study on shale gas well frac hit considers a wide range of geological and engineering factors. While this research approach is undoubtedly correct, using too many variable factors can lead to additional workload and significantly reduce work efficiency. Therefore, a correlation analysis of the geological and engineering parameters affecting frac hit was conducted.
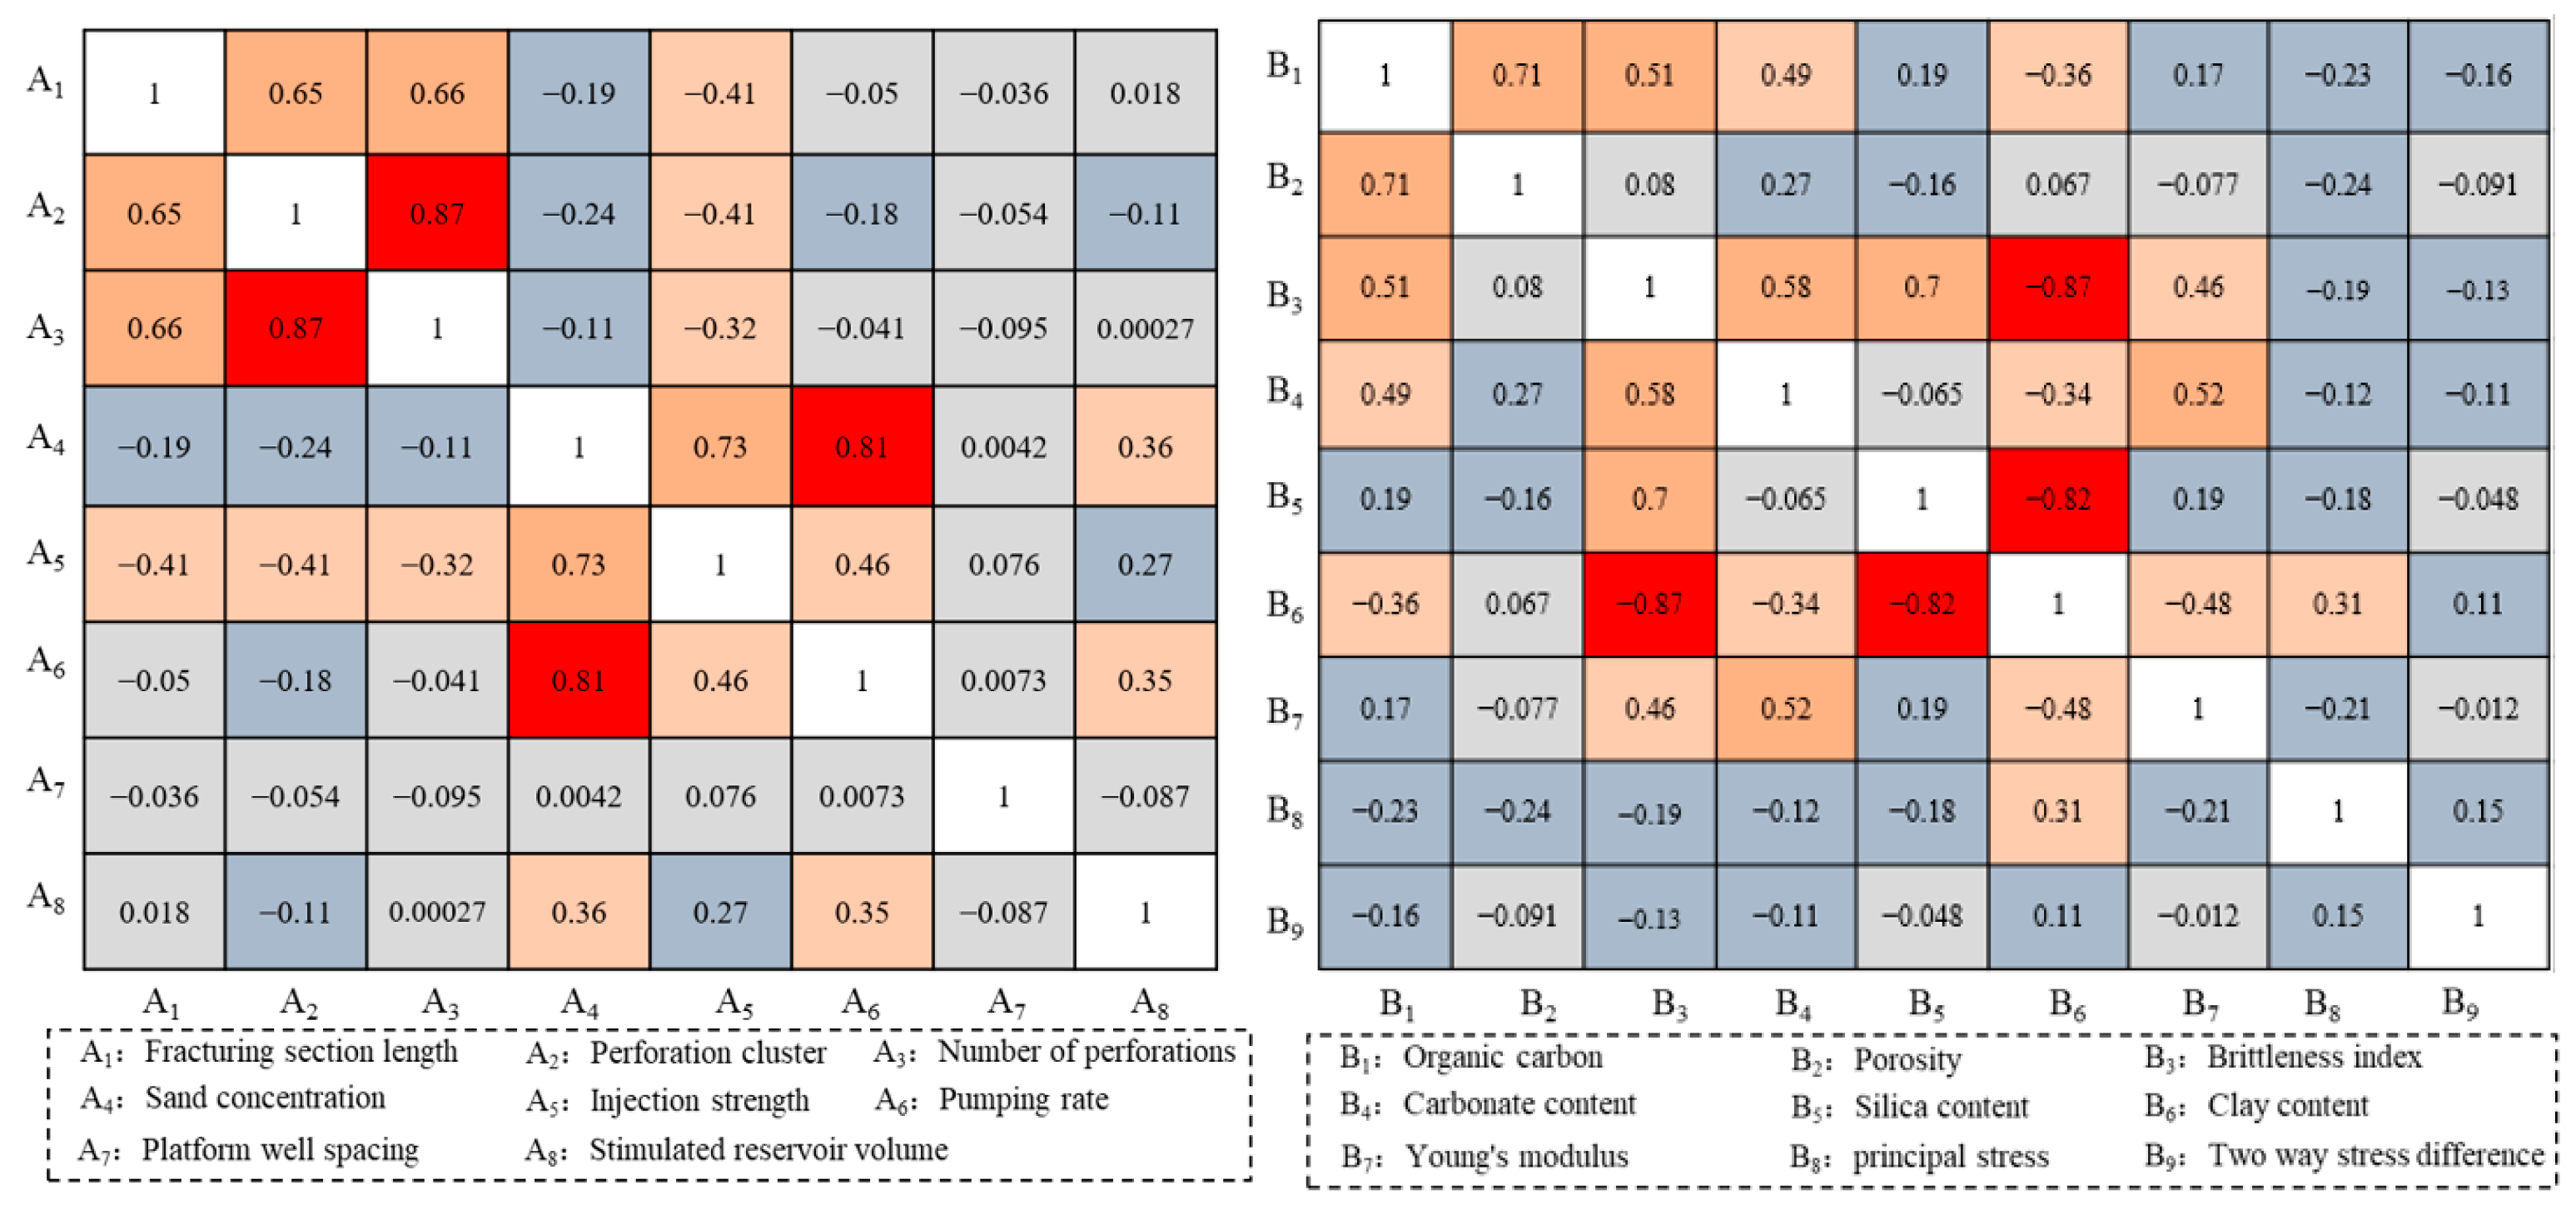
The generation of a heatmap is based on the statistical analysis and visualization processing of data. Firstly, when conducting feature importance analysis, specific algorithms (such as the mean decrease in impurity in Random Forest or the calculation of feature contribution in Gradient Boosting Trees) are employed to calculate the importance values of each feature with respect to the target variable. The selection of these values is determined according to the degree of contribution of the features in aspects such as splitting the data and reducing the prediction error during the training process of the algorithm. After obtaining these values, they are normalized to a specific range (usually 0–1 or 0–100) to facilitate unified comparison and display. Subsequently, these values are mapped to different color regions of the heatmap, where the shade of the color represents the magnitude of the value, thereby intuitively presenting the differences in the importance of each feature. Eventually, a heatmap that can clearly display the distribution of feature importance is generated, providing a basis for subsequent data analysis and decision-making.
This process resulted in a heat map of the relevant engineering and geological factors for frac hit (Figure 4). The analysis results show that there is a strong correlation (>0.8) between the number of perforations and perforation clusters, sand intensity and construction displacement, and the content of clay, silica, and brittleness index (calculation based on mineral content), which can be grouped into one category for consideration.

Figure 4.
Analysis of the correlation between frac hit engineering and geological factors heatmap.
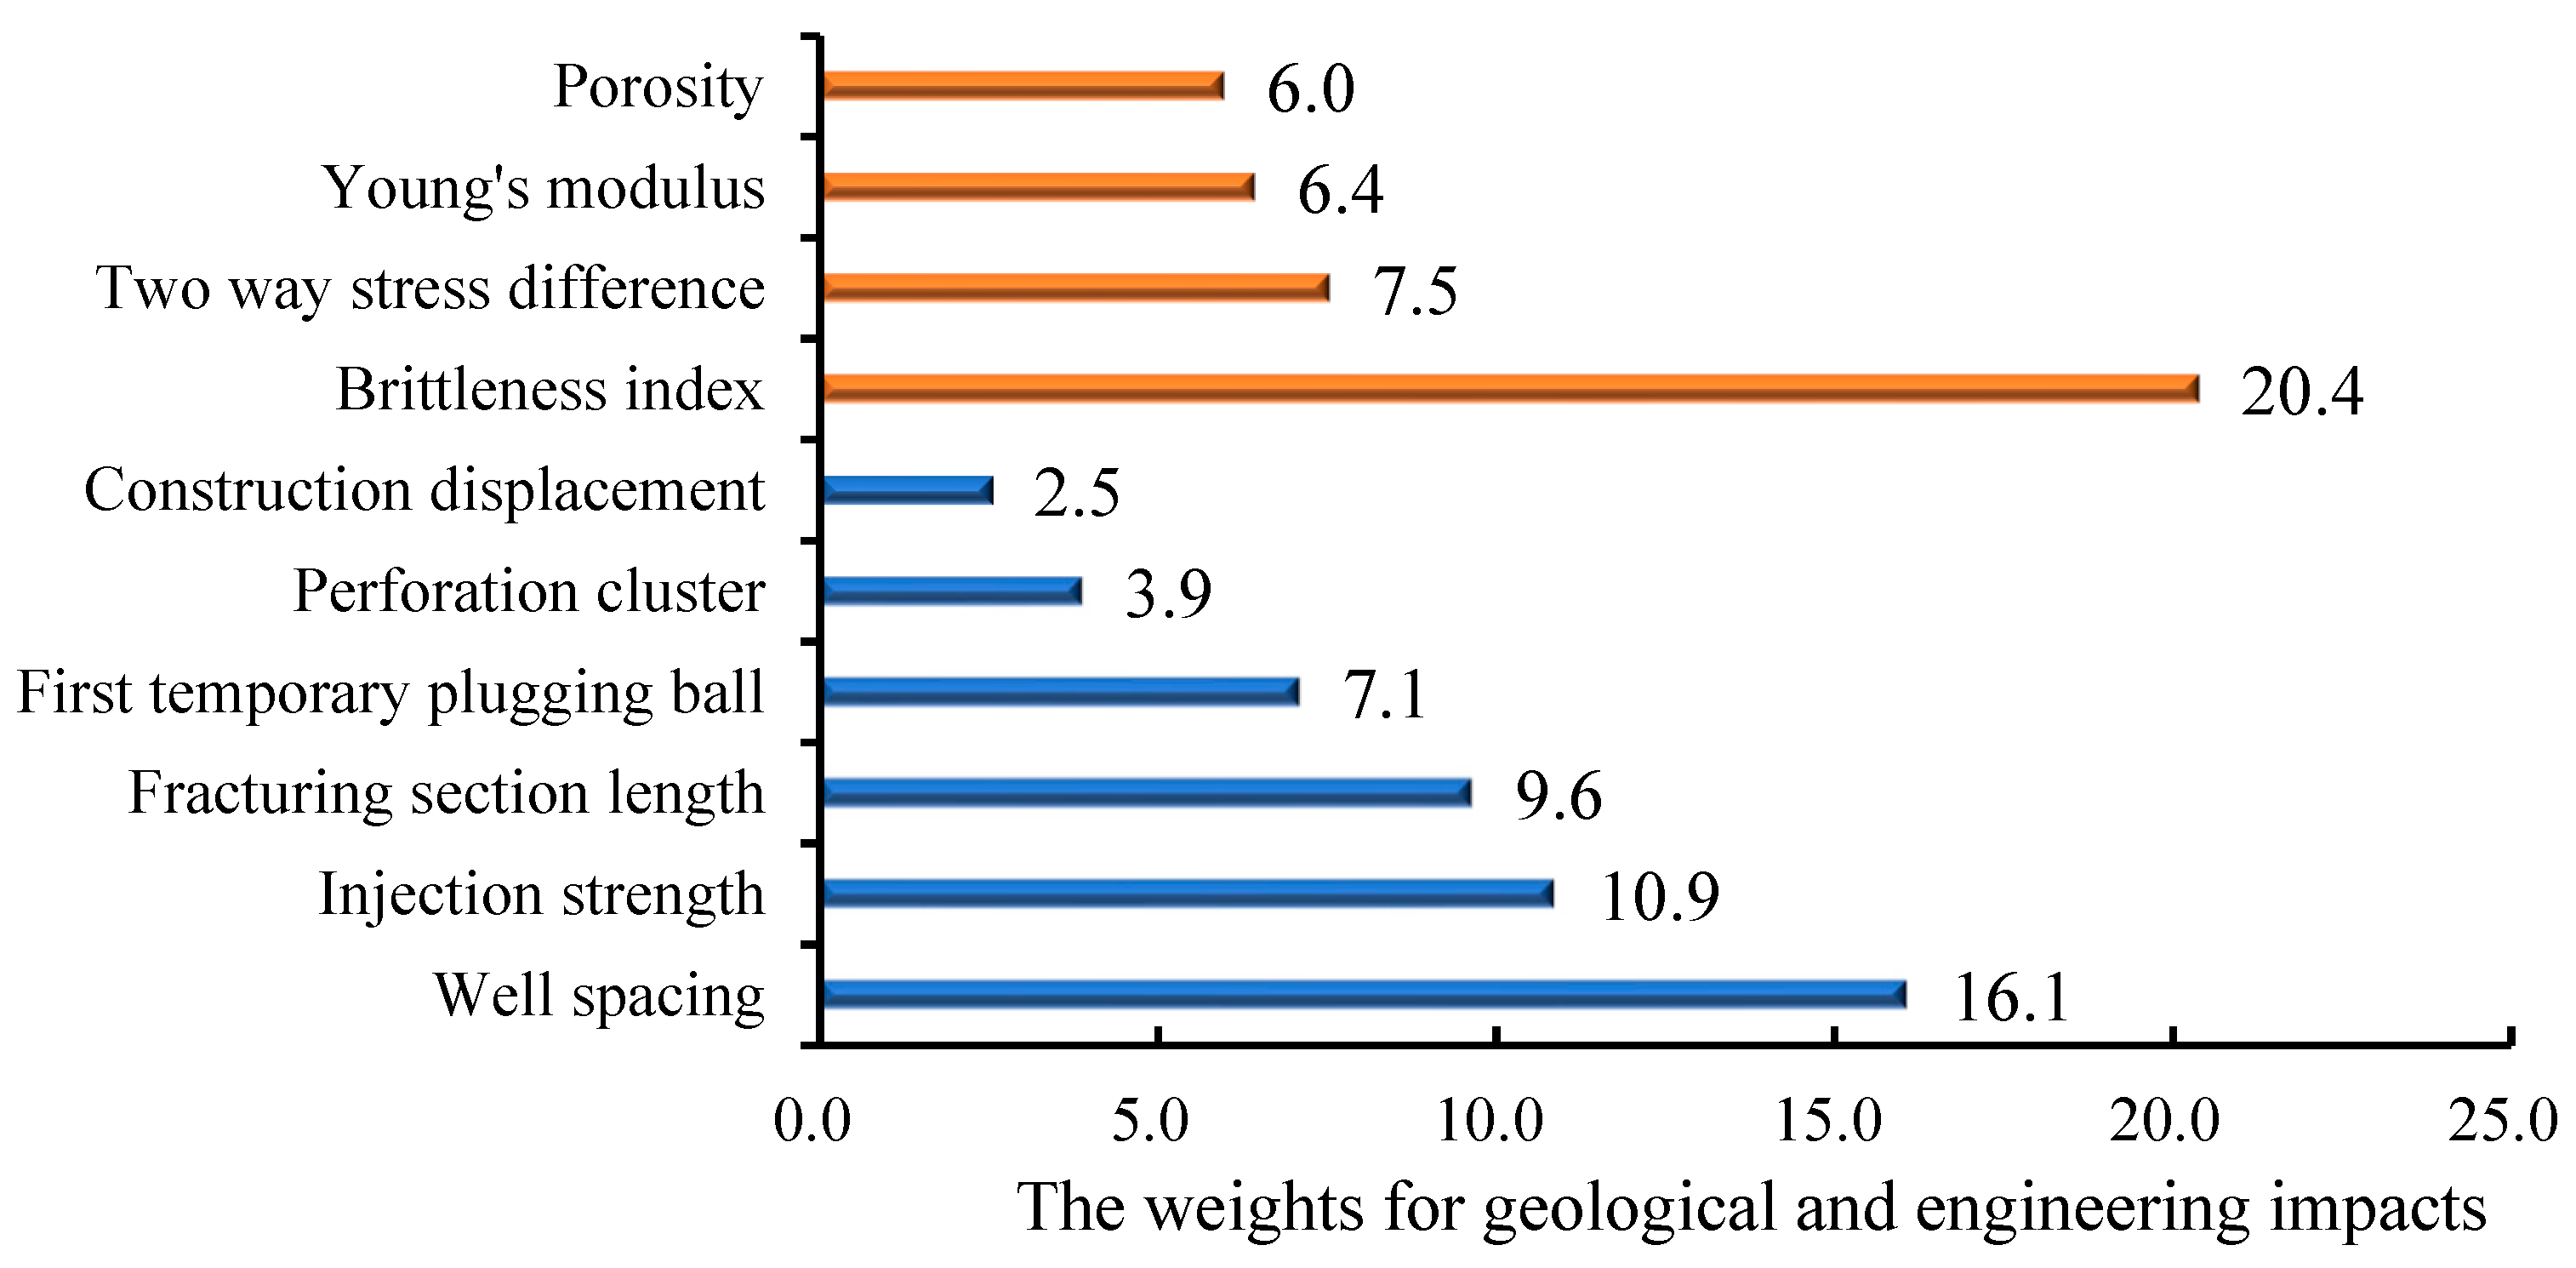
Furthermore, based on the above results, the importance scores for third-level factors such as fracturing section length, perforation cluster, number of perforations, sand concentration, injection strength, temporary plugging effect, and well spacing are calculated using random trees. For second-level factors, the calculated third-level factors are combined accordingly. Finally, the weights for geological and engineering impacts are scored, and each influencing factor of frac hit is assigned a weight. Through the calculation results, a storm chart of feature importance scores for different impacting parameters on the degree of frac hit is obtained (Figure 5).
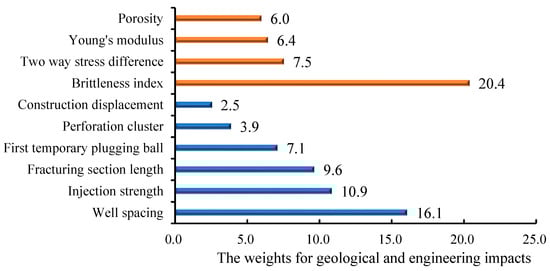
Figure 5.
Feature importance storm chart for frac hit influencing.
The analysis results show that geological factors and engineering factors also have a significant impact on the degree of frac hit. Well spacing, first temporary plugging ball, and brittleness index have the highest impact weights on frac hit, while second temporary plugging ball, second temporary plugging agent, and perforation cluster have the lowest impact weights on frac hit. It is recommended that in future designs of shale gas exploitation schemes in Well pad L, optimization schemes should be considered to avoid significant frac hit occurrences.
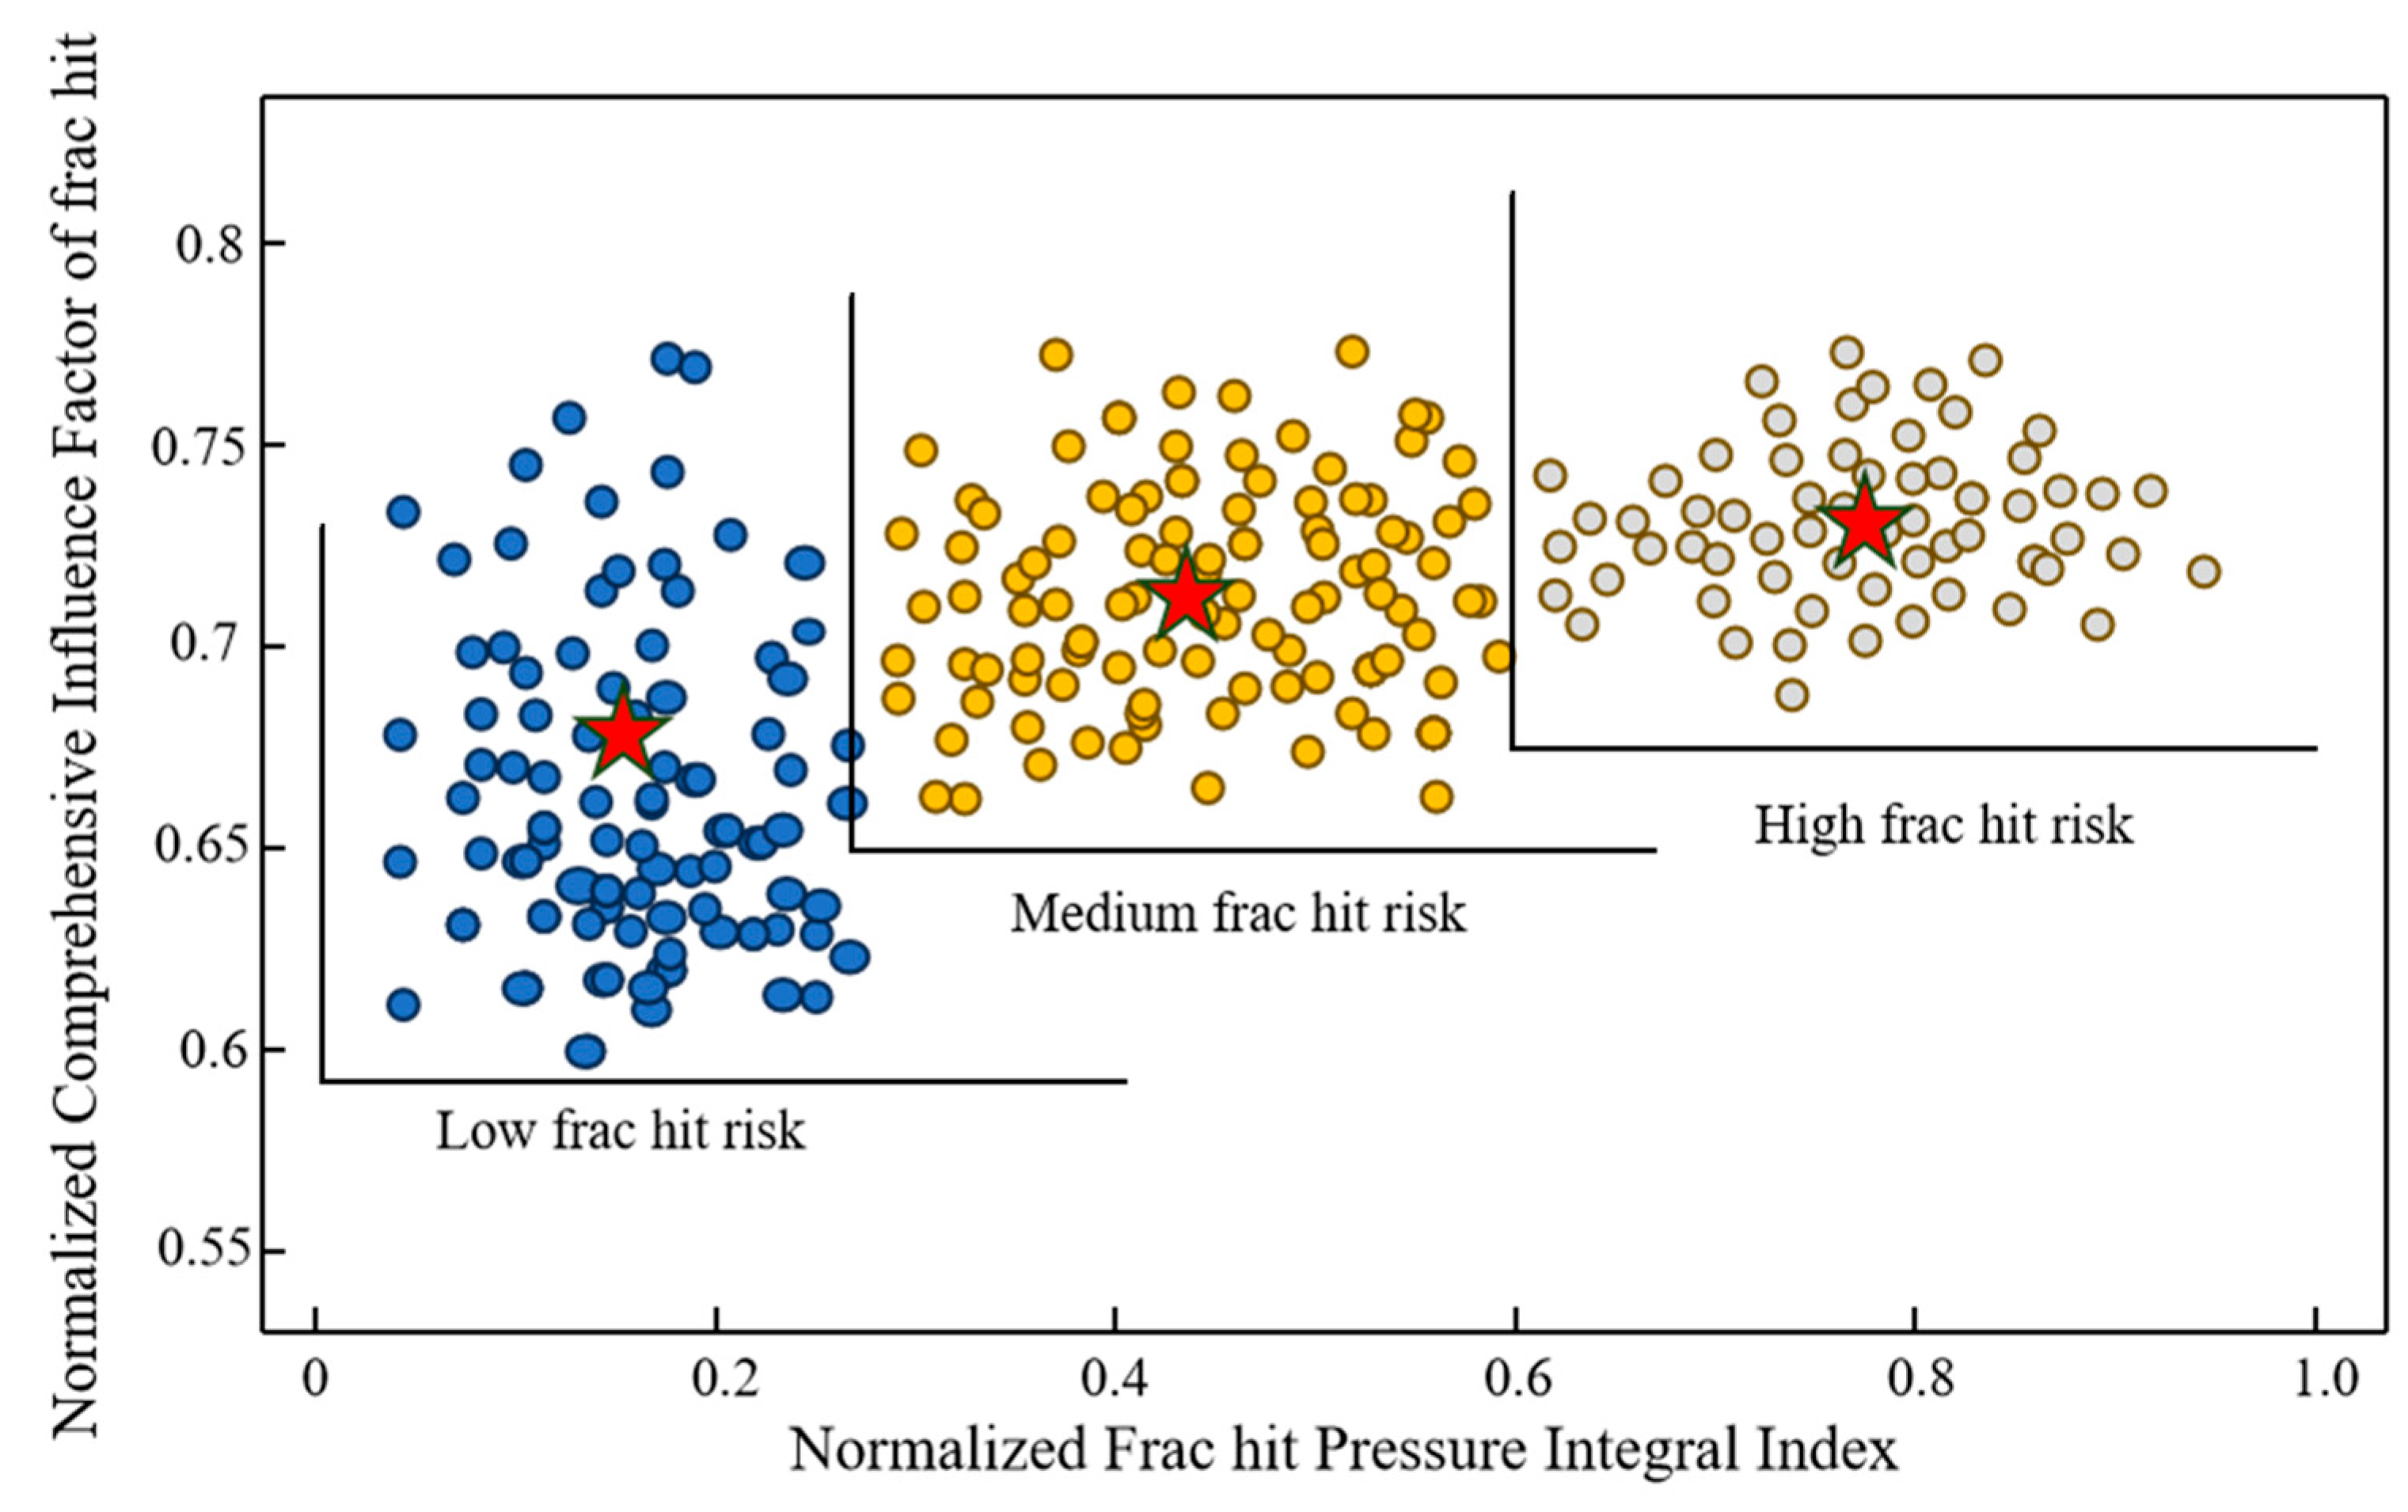
Then, based on the weight results of the influencing factors, the CIF-FPI dataset is obtained. By combining cluster analysis, the final mean vectors corresponding to high frac hit risk, medium frac hit risk, and low frac hit risk are derived for the three different centers, as shown in Figure 6.
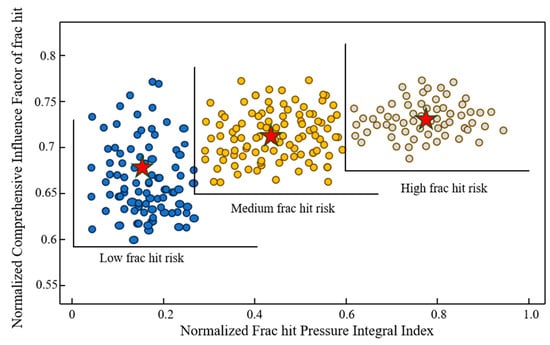
Figure 6.
Illustration of high, medium, and low frac hit risk (the location of the red star corresponds to the value of the cluster center).
By combining various influencing factors and evaluation indicators, repeat the aforementioned steps to obtain classification and grading standards for different levels of influence and types (high, medium, low) of frac hit risk, as shown in Table 3.
Table 3.
Classification and grading of frac hit, geological and engineering factors in the L well pad.
This study defines Class I, Class II, and Class III frac hit as corresponding to high, medium, and low frac hit risks. Through analyzing examples of frac hit in L1-1, L1-2, and L1-3 horizontal wells, the results in Table 4 show that 55.74% of the frac stages lead to low frac hit risks, 24.59% lead to medium frac hit risks, and 19.67% lead to high frac hit risks. The characteristics of the generated frac hit risks are mainly of medium to high intensity and low frequency. Therefore, efforts should be made on-site to reduce the intensity of frac operations to minimize the adverse impact of frac hit on adjacent wells.
Table 4.
Case analysis of frac hit in three horizontal wells in the L well pad.
3.4. Correction of Natural Fracture Zone Position
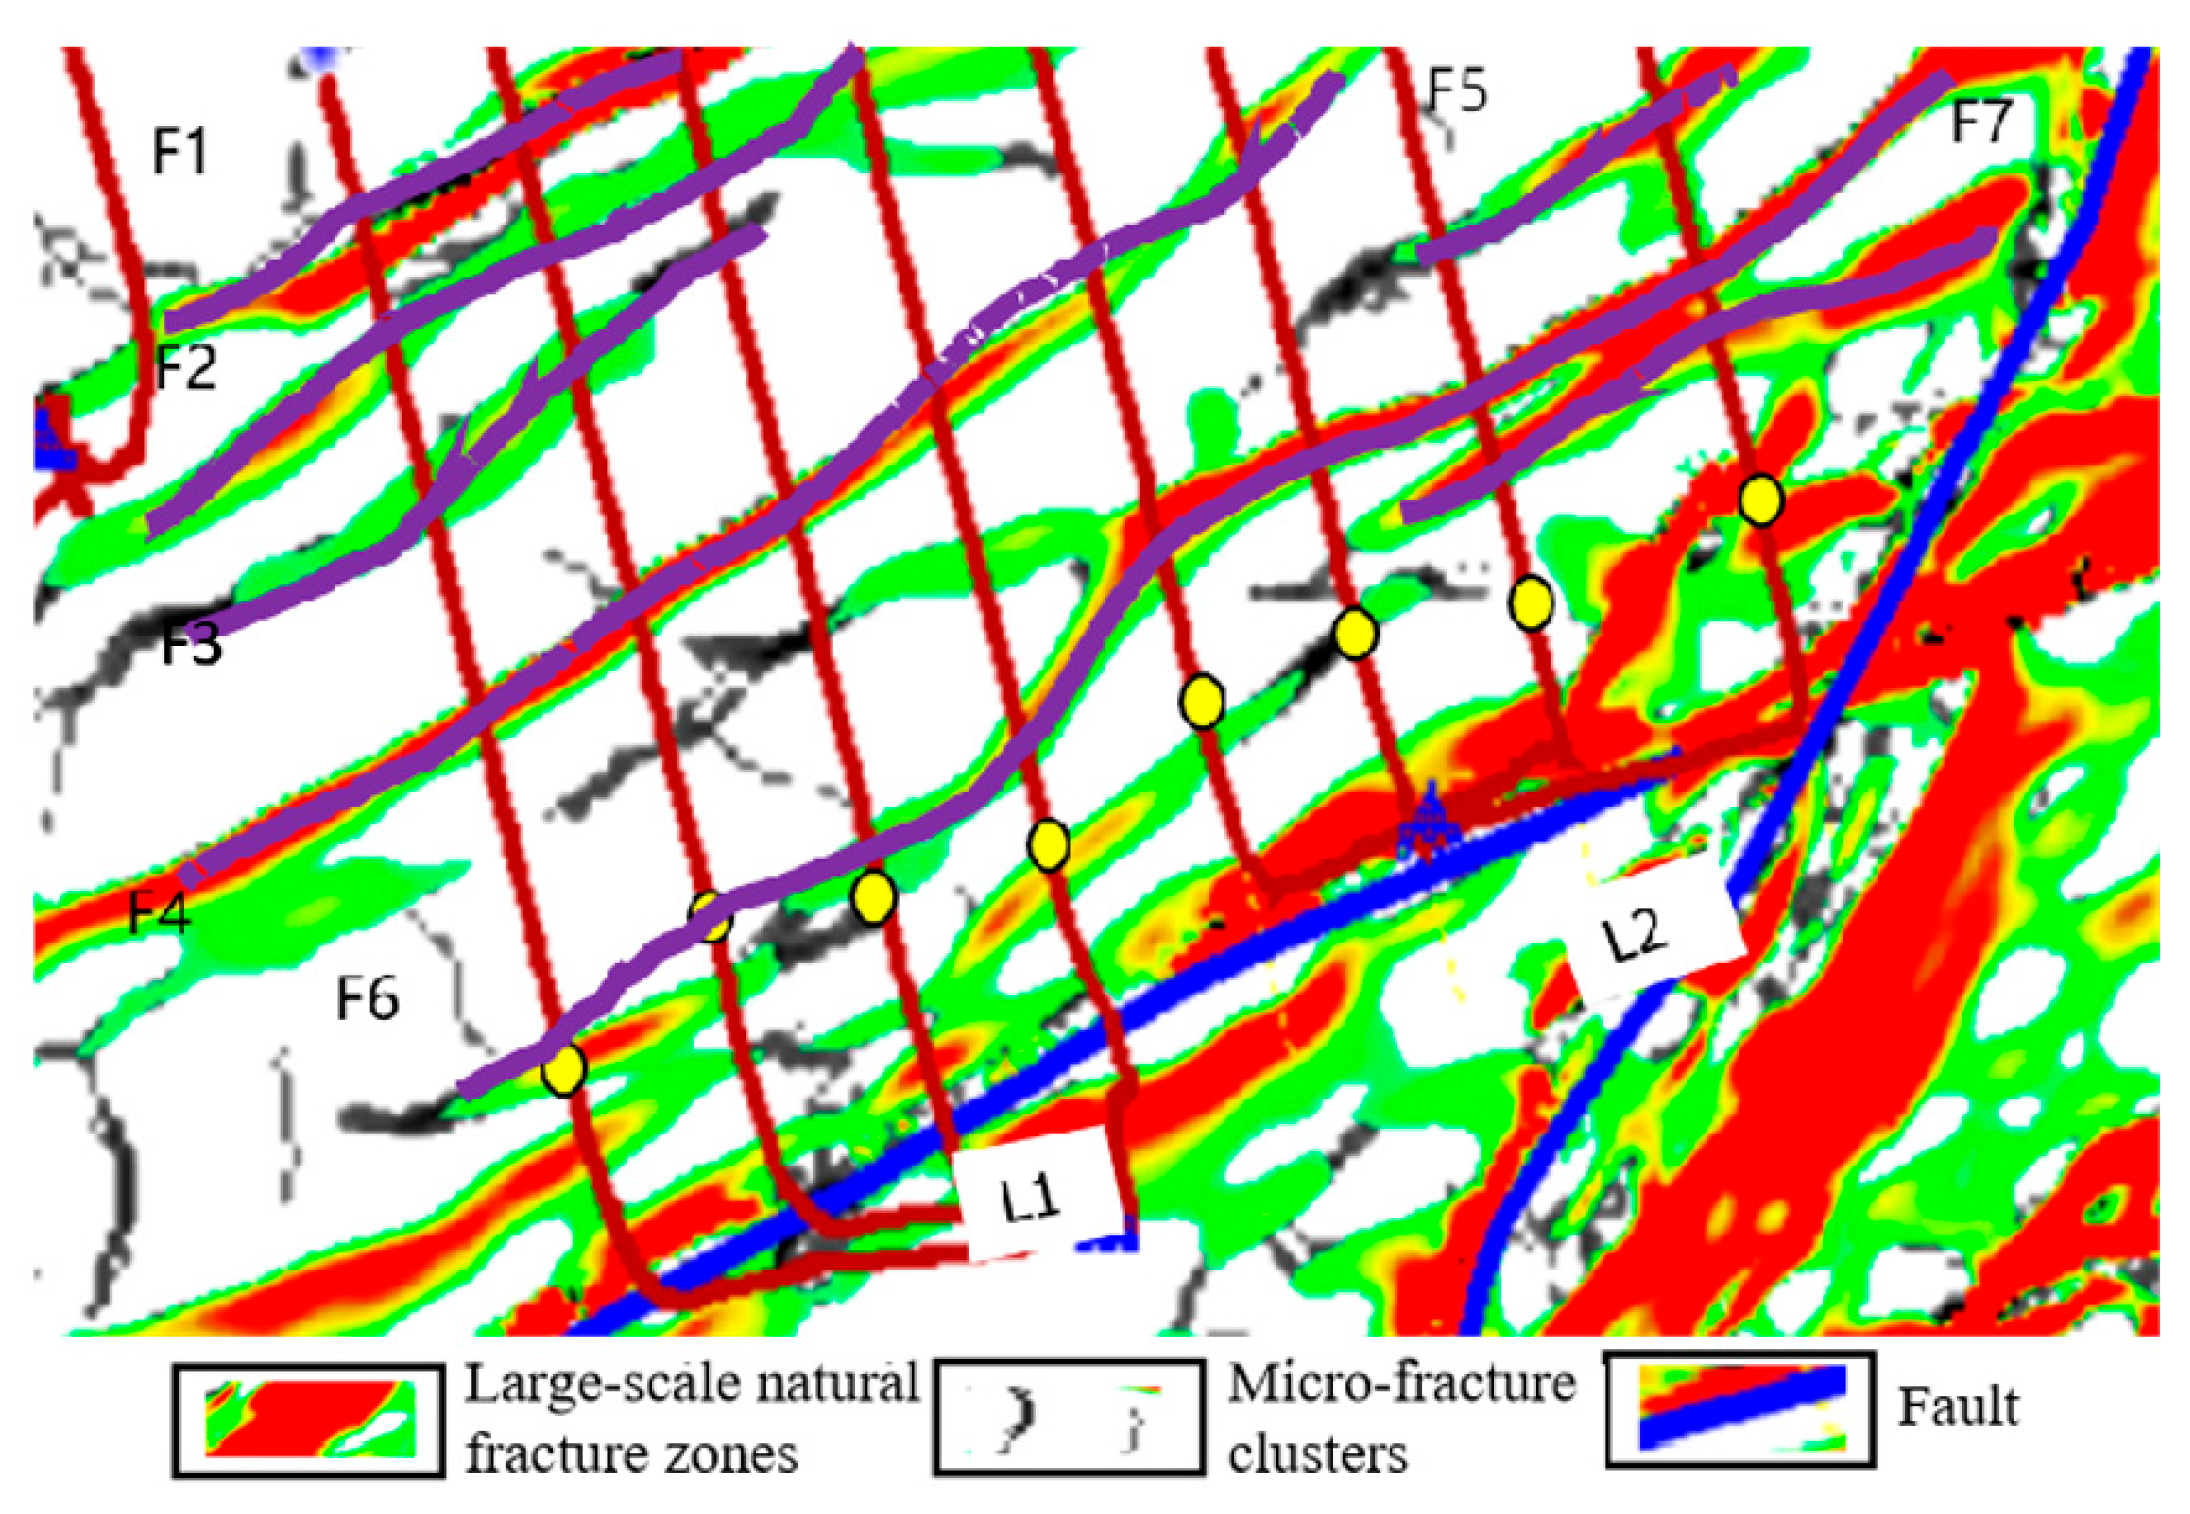
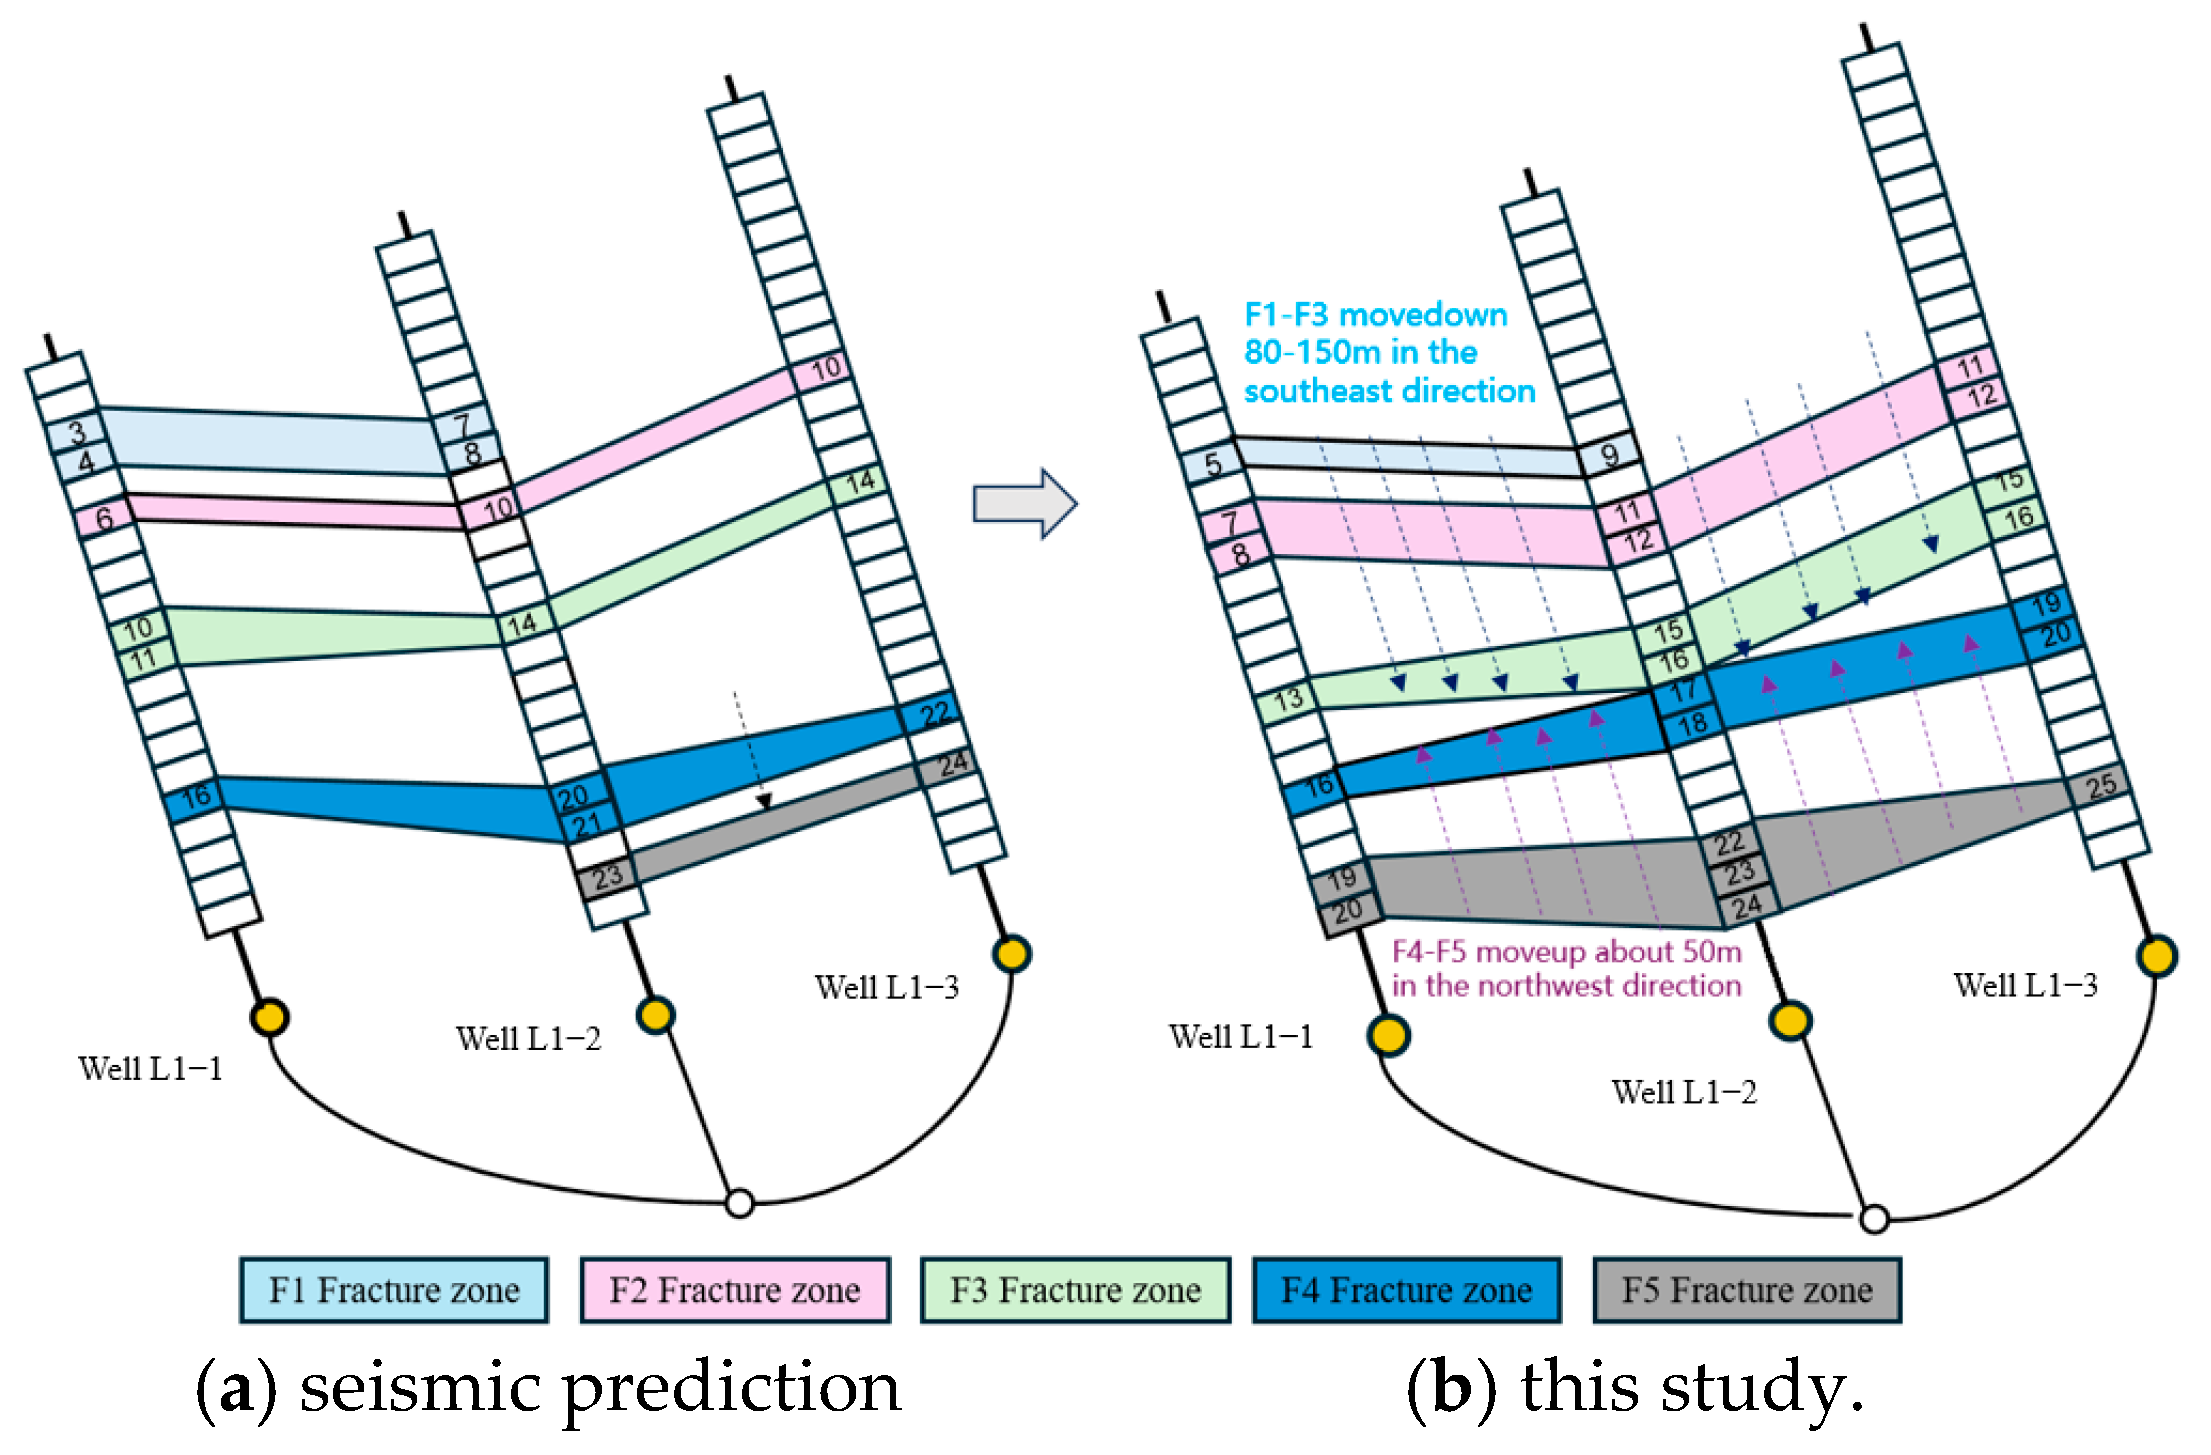
Based on the comprehensive interpretation and analysis of geological core logging data, the relative positions of large-scale natural fracture zones and platform wells in the L well area were determined, as shown in Figure 7. However, pressure monitoring of adjacent wells during the fracturing process of stimulated wells revealed abnormally high pressure values in some locations where natural fractures are not well developed, which is inconsistent with the actual understanding. Therefore, sections with medium to high frac hit risk were identified as potential points where large-scale natural fractures might intersect, and the distribution characteristics were corrected accordingly to ensure precise control during differentiated fracturing design, as shown in Figure 8. For example, in the case of well L1-1, this study indicates that Sections 19 and 20 are located within the natural fracture zone, whereas the engineering prediction places Section 18 in the natural fracture zone. Similarly, for well L-3, this study suggests that Section 25 is within the natural fracture zone, while the engineering prediction positions Section 24 in the natural fracture zone.
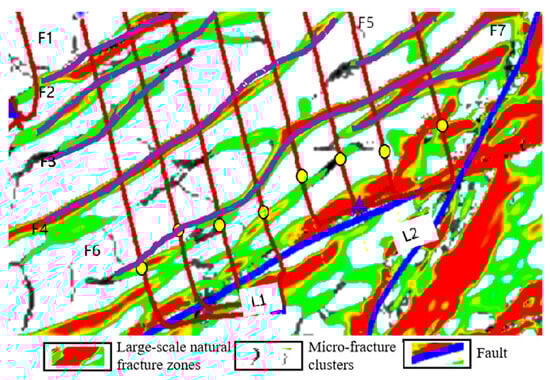
Figure 7.
The relative positional distribution of large-scale natural fracture zones F1–F7 and platform wells in the L well area (L1, 2 is the name of the well area).
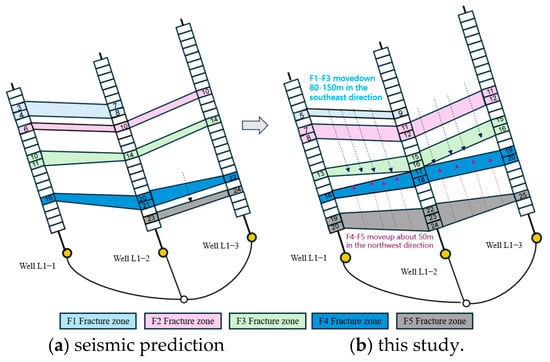
Figure 8.
Locations of natural fracture zones.
Meanwhile, by checking the proportion of flowback fluid from different fracturing stages on-site, the flowback fluid proportion for Section 18 of well L1-1 is 74.1%, while the average flowback fluid proportion for Sections 19 and 20 is 87.6%. For well L1-3, the flowback fluid proportion for Section 24 is 84.1%, and for Section 25 it is 100%. Based on on-site experience, when natural fracture zones develop near the fractured stages, fracturing fluid is prone to leak into the natural fracture zones and flow back up the wellbore to the surface, and the flowback fluid proportion should be higher. Through comparison, it was found that, compared to the engineering prediction of natural fracture zone locations, the predicted natural fracture zone in this study showed significantly higher flowback fluid proportions in the corresponding well sections, better aligning with the on-site production scenarios. Therefore, this study provides a new means of correcting the location of natural fracture zones.
4. Conclusions
This study establishes a comprehensive workflow for evaluating frac hit impacts in shale gas wells, integrating machine learning with geological and engineering analyses. Key contributions include:
- (1)
- FPI Optimization: The proposed FPI index addresses limitations of traditional pressure integral methods by incorporating shut-in pressure ratios, enhancing the temporal resolution of interference evaluation. Field validation confirms its alignment with natural fracture distributions, outperforming prior metrics like PCI.
- (2)
- Multi-Factor Analysis: The combined use of Pearson correlation, Random Forest, and K-means++ clarifies dominant factors (e.g., brittleness index, well spacing) and quantifies their weights. The derived Comprehensive Influence Factor (CIF) systematically links geological and engineering parameters to frac hit severity.
- (3)
- Risk Classification: A three-tier risk system (high, medium, low) is developed, enabling targeted adjustments in fracturing parameters. Application in the L well area shows 55.74% of stages pose low risk, while 19.67% require mitigation strategies, guiding optimized field operations.
- (4)
- Geological Calibration: By correlating FPI results with flowback data, natural fracture zones are recalibrated, improving prediction accuracy and supporting differentiated fracturing designs.
Future work will integrate RTA/PTA methods, expand validation across basins, and refine numerical models to enhance predictive capabilities. This workflow advances frac hit management by bridging geological insights with engineering practices, offering a scalable solution for sustainable shale gas development.
Author Contributions
Conceptualization, B.Z.; methodology, B.Z. and D.T.; software, Y.D.; formal analysis, Y.S. (Yi Song); investigation, K.C.; data curation, D.T. and W.Y.; writing—original draft preparation, J.W. and Y.H.; writing—review and editing, Y.S. (Yuliang Su); visualization, K.C. and C.S. All authors have read and agreed to the published version of the manuscript.
Funding
Research on Key Technologies for Unconventional Reservoir Construction: Prevention and Control of Casing Deformation and Frac Hit in Shale Gas Wells, as well as Efficient Fracturing Technology and Testing (2023ZZ28-05).
Data Availability Statement
The data presented in this study are available on request from the corresponding author.
Acknowledgments
Thanks to all the authors for their contribution to the paper and their efforts.
Conflicts of Interest
Authors Bo Zeng, Jianfa Wu, Dengji Tang, Yi Song, Chen Shen, Yongzhi Huang, Yurou Du and Wenfeng Yu were employed by the PetroChina Southwest Oil & Gasfield Company. Author Ke Chen was employed by the Sichuan Shale Gas Exploration and Development Co., Ltd., PetroChina Southwest Oil and Gasfield Company. The remaining author declares that the research was conducted in the absence of any commercial or financial relationships that could be construed as a potential conflict of interest.
References
- Tang, H.Y.; Liang, H.P.; Qin, J.H.; Ding, Y.; Zhang, L.H.; Liu, S. Analysis of the Causes of Frac hit in Unconventional Oil and Gas Reservoirs and Study on Prevention Measures. In Proceedings of the Chinese Conference on Theoretical and Applied Mechanics (CCTAM 2019), Hangzhou, China, 25–28 August 2019. [Google Scholar]
- Zheng, Y.; Fan, Y.; Yong, R.; Zhou, X. New Technology of Shale Gas Close Cut Segmentation + High-Intensity Proppant Fracturing. Nat. Gas Ind. 2019, 39, 76–81. [Google Scholar]
- Guo, X.Y.; Jin, Y.; Huang, L.; Xu, J.Y. Current Research Status and Discussion on Interference between Horizontal Wells in Shale Oil and Gas Reservoirs. Pet. Drill. Prod. Technol. 2021, 43, 348–367. [Google Scholar]
- Wang, W.D.; Yu, W.F.; Wang, S.K.; Zhang, L.P.; Zhang, Q.; Su, Y.L. Mitigating Interwell Fracturing Interference: Numerical Investigation of Parent Well Depletion Affecting Infill Well Stimulation. J. Energy Resour. Technol. 2024, 146, 013502. [Google Scholar] [CrossRef]
- Haustveit, K.; Greenwood, H. Delineating Stacked Pay with Existing and Emerging Diagnostic Tools. In Proceedings of the SPE Hydraulic Fracturing Technology Conference and Exhibition, The Woodlands, TX, USA, 23–25 January 2018. [Google Scholar]
- Kumar, A.; Seth, P.; Shrivastava, K. Well Interference Diagnosis through Integrated Analysis of Tracer and Pressure Interference Tests. In Proceedings of the SPE/AAPG/SEG Unconventional Resources Technology Conference, Houston, TX, USA, 23–25 July 2018. [Google Scholar]
- Mcdowell, B.; Yoelin, A.; Pottebaum, B. Production Effects from Frac-Driven Interactions in the Southeastern Midland Basin, Reagan County, Texas. In Proceedings of the SPE/AAPG/SEG Unconventional Resources Technology Conference, Denver, CO, USA, 22–24 July 2019. [Google Scholar]
- Chen, M.; Guo, T.K.; Xu, Y.; Qu, Z.Q.; Zhang, S.C.; Zhou, T.; Wang, Y.P. Mechanism of Fiber Optic Strain Evolution Induced by Multiple Fracture Expansion in Horizontal Well Fracturing. Pet. Explor. Dev. 2022, 49, 183–193. [Google Scholar] [CrossRef]
- Sardinha, C.; Petr, C.; Lehmann, J. Determining Interwell Connectivity and Reservoir Complexity Through Frac Pressure Hits and Production Interference Analysis. In Proceedings of the SPE/CSUR Unconventional Resources Conference, Calgary, AB, Canada, 30 September–2 October 2014. [Google Scholar]
- Crespo, P.; Pellicer, M.; Crovetto, C. Quantifying the Parent-Child effect in Vaca Muerta Formation. In Proceedings of the SPE/AAPG/SEG Unconventional Resources Technology Conference, Virtual, 20–22 July 2020. URTEC-2020-1035-MS. [Google Scholar]
- Al-Shami, T.M.; Jufar, S.R.; Kumar, S.; Abdulelah, H.; Abdullahi, M.B.; Al-Hajri, S.; Negash, B.M. A comprehensive review of interwell interference in shale reservoirs. Earth-Sci. Rev. 2023, 237, 104327. [Google Scholar] [CrossRef]
- Yadav, H.; Motealleh, S. Improving Quantitative Analysis of Frac-Hits and Refracs in Unconventional Plays Using RTA. In Proceedings of the SPE Hydraulic Fracturing Technology Conference and Exhibition, The Woodlands, TX, USA, 24–26 January 2017. [Google Scholar]
- Awada, A.; Santo, M.; Lougheed, D.; Xu, D. Is that interference. A work flow for identifying and analyzing communication through hydraulic fractures in a multiwell pad. SPE J. 2016, 21, 1554–1566. [Google Scholar] [CrossRef]
- Qin, J.Z.; Zhong, Q.H.; Tang, Y.; Yu, W.; Sepehrnoori, K. Well interference evaluation considering complex fracture networks through pressure and rate transient analysis in unconventional reservoirs. Pet. Sci. 2023, 1, 337–349. [Google Scholar] [CrossRef]
- Almasoodi, M.; Andrews, T.; Johnston, C.; Singh, A. A new method for interpreting well-to-well interference tests and quantifying the magnitude of production impact: Theory and applications in a multi-basin case study. Geomech. Geophys. Geo-Energy Geo-Resour. 2023, 9, 95. [Google Scholar] [CrossRef]
- Wang, W.; Zhang, Q.; Yu, W.; Su, Y.; Li, L.; Hao, Y. Modeling and Analysis for Coupled Multi-Zone Flow of Frac Hits in Shale Reservoirs. Appl. Math. Model. 2024, 129, 823–836. [Google Scholar] [CrossRef]
- Tyree, R. Predicting Frac Hits Using Artificial Intelligence; Application in Marcellus Shale. Master’s Thesis, Statler College of Engineering and Mineral Resources, Morgantown, WV, USA, 2018. [Google Scholar]
- Zhang, C.; Pan, Y.; Ma, W. Application of Combined Statistics, Machine Learning and Game Theory Approach for Shale Gas Production Performance Evaluation: Insights of Frac-Hit Timing and Severity. In Proceedings of the SPE/AAPG/SEG Unconventional Resources Technology Conference, Denver, CO, USA, 13–15 June 2023. [Google Scholar]
- Mohaghegh, S. Frac-Hit Dynamic Modeling using Artificial Intelligence & Machine Learning. In Proceedings of the Unconventional Resources Technology Conference, Virtual, 20–22 July 2020. [Google Scholar]
- Wu, X.; Liu, G.; Romanov, V. Machine learning applications for frac-hit identification: A field data use case. In Proceedings of the SEG International Exposition and Annual Meeting, Dallas, TX, USA, 11–16 September 2022. [Google Scholar]
- Zhang, Q.; He, F.; He, Y.W. Well interference evaluation and prediction of shale gas wells based on machine learning. Pet. Reserv. Eval. Dev. 2022, 12, 487–495. [Google Scholar]
- Guo, Y.; Ashok, P.; Oort, E.V. A Data Analytics Framework for Analyzing the Effect of Frac hit on Parent Well Production. In Proceedings of the SPE Hydraulic Fracturing Technology Conference and Exhibition, The Woodlands, TX, USA, 4–6 May 2021. [Google Scholar]
- Wang, B.; Xie, H.-L.; Ren, H.-Y.; Li, X.; Chen, L.; Wu, B.-C. Application of AHP, TOPSIS, and TFNs to Plant Selection for Phytoremediation of Petroleum-Contaminated Soils in Shale Gas and Oil Fields. J. Clean. Prod. 2019, 233, 13–22. [Google Scholar] [CrossRef]
- Morais, É.T.; Barberes, G.A.; Souza, I.-F.; Leal, F.G.; Guzzo, J.-P.; Spigolon, A.-D. Pearson Correlation Coefficient Applied to Petroleum System Characterization: The Case Study of Potiguar and Reconcavo Basins, Brazil. Geosciences 2023, 13, 282. [Google Scholar] [CrossRef]
- Huang, R.; Wei, C.; Yang, J.; Xu, X.; Li, B.; Wu, S.; Xiong, L. Quantitative Analysis of the Main Controlling Factors of Oil Saturation Variation. Geofluids 2021, 2021, 1–12. [Google Scholar] [CrossRef]
- Tong, S.; Wang, F.; Gao, H.; Zhu, W. A Machine Learning-Based Method for Analyzing Factors Influencing Production Capacity and Production Forecasting in Fractured Tight Oil Reservoirs. Int. J. Hydrogen Energy 2024, 70, 136–145. [Google Scholar] [CrossRef]
- Su, X.M.; Zhang, T.; Li, Y.F.; Qing, Y.; Li, Y.M. Research on Prediction Method of Sanding and Sticking during Drilling Based on K-Means Clustering Algorithm. Drill. Prod. Technol. 2021, 44, 5–9. [Google Scholar]
- Deng, Y.; Wang, W.; Su, Y.; Sun, S.; Zhuang, X. An Unsupervised Machine Learning Based Double Sweet Spots Classification and Evaluation Method for Tight Reservoirs. J. Energy Resour. Technol. 2023, 145, 072602. [Google Scholar] [CrossRef]
- Yang, H.Z.; Zhao, S.X.; Xia, Z.Q.; Yang, X.F.; Zhang, C.L.; Zhang, D.L.; Zhang, J.; Yuan, S.S.; Feng, J.R.; Xie, W.; et al. Optimal selection of three-dimensional development targets for deep shale gas in the Luzhou block of the southern Sichuan Basin. Nat. Gas Ind. 2022, 42. [Google Scholar]
- Yang, H.; Zhao, S.; Liu, Y.; Wu, W.; Xia, Z.; Wu, T.; Luo, C.; Fan, T.; Yu, L. Main Controlling Factors of Enrichment and High Production of Deep Shale Gas in Luzhou Block. Nat. Gas Ind. 2019, 39, 55–63. [Google Scholar]
- Zhang, S.R.; Dong, D.Z.; Liao, Q.S.; Sun, S.; Huang, S.; Guan, Q.; Zhang, C.; Guo, W.; Jiang, S.; Shi, P. Geological characteristics and resource prospects of deep marine shale gas in the southern Sichuan Basin. Nat. Gas Ind. 2021, 41, 35–45. [Google Scholar]

Disclaimer/Publisher’s Note: The statements, opinions and data contained in all publications are solely those of the individual author(s) and contributor(s) and not of MDPI and/or the editor(s). MDPI and/or the editor(s) disclaim responsibility for any injury to people or property resulting from any ideas, methods, instructions or products referred to in the content. |
© 2025 by the authors. Licensee MDPI, Basel, Switzerland. This article is an open access article distributed under the terms and conditions of the Creative Commons Attribution (CC BY) license (https://creativecommons.org/licenses/by/4.0/).