
Research on the Influencing Factors During Hydraulic Fracturing Assisted Oil Displacement Process in Offshore Low Permeability Oilfields and the Quantitative Characterization of Fracture Propagation and Liquid Infiltration


Abstract
1. Introduction
2. Theory and Method
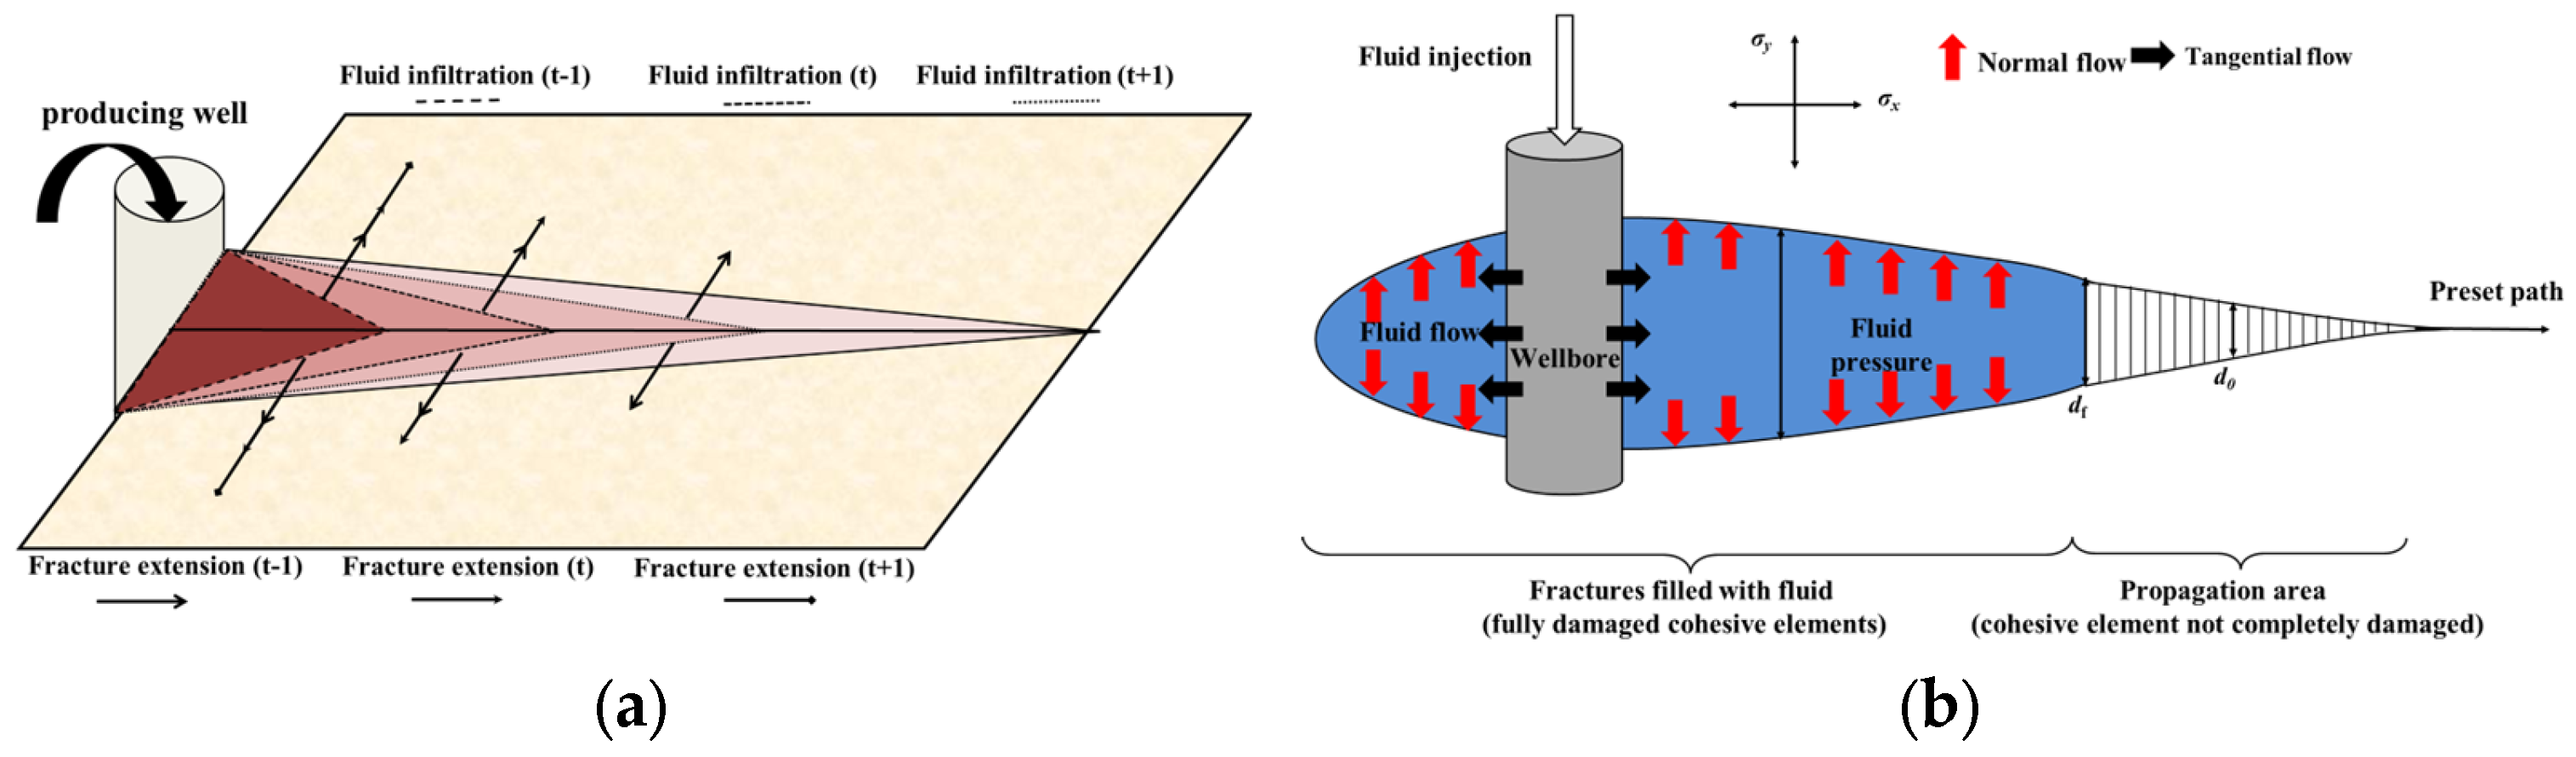
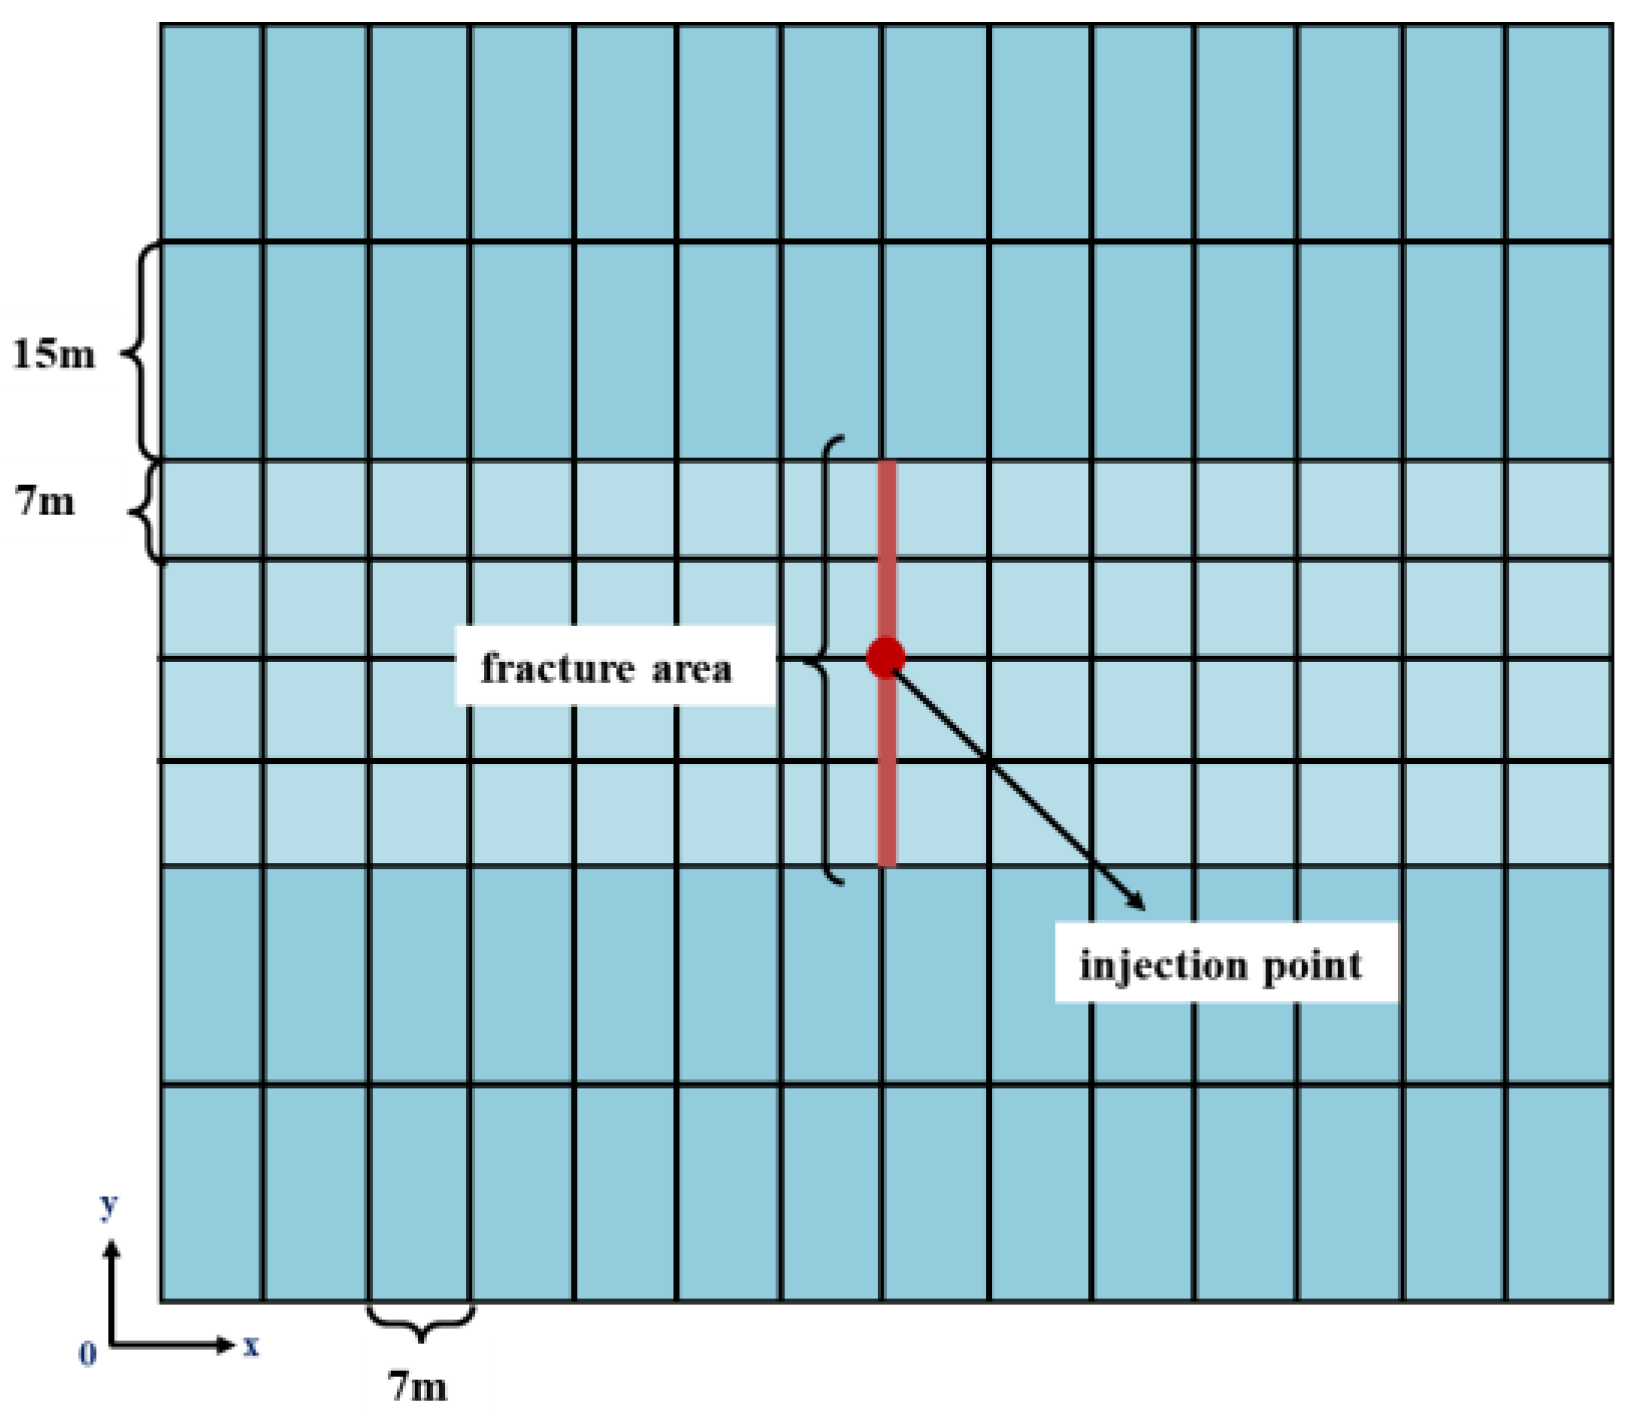
2.1. Physical Model and Assumptions
2.2. Mathematical Model
2.2.1. Rock Stress Equilibrium Equations
2.2.2. Pore Fluid Flow Equations
2.2.3. Fracture Initiation and Propagation Criteria
2.3. Grid Generation
3. Application
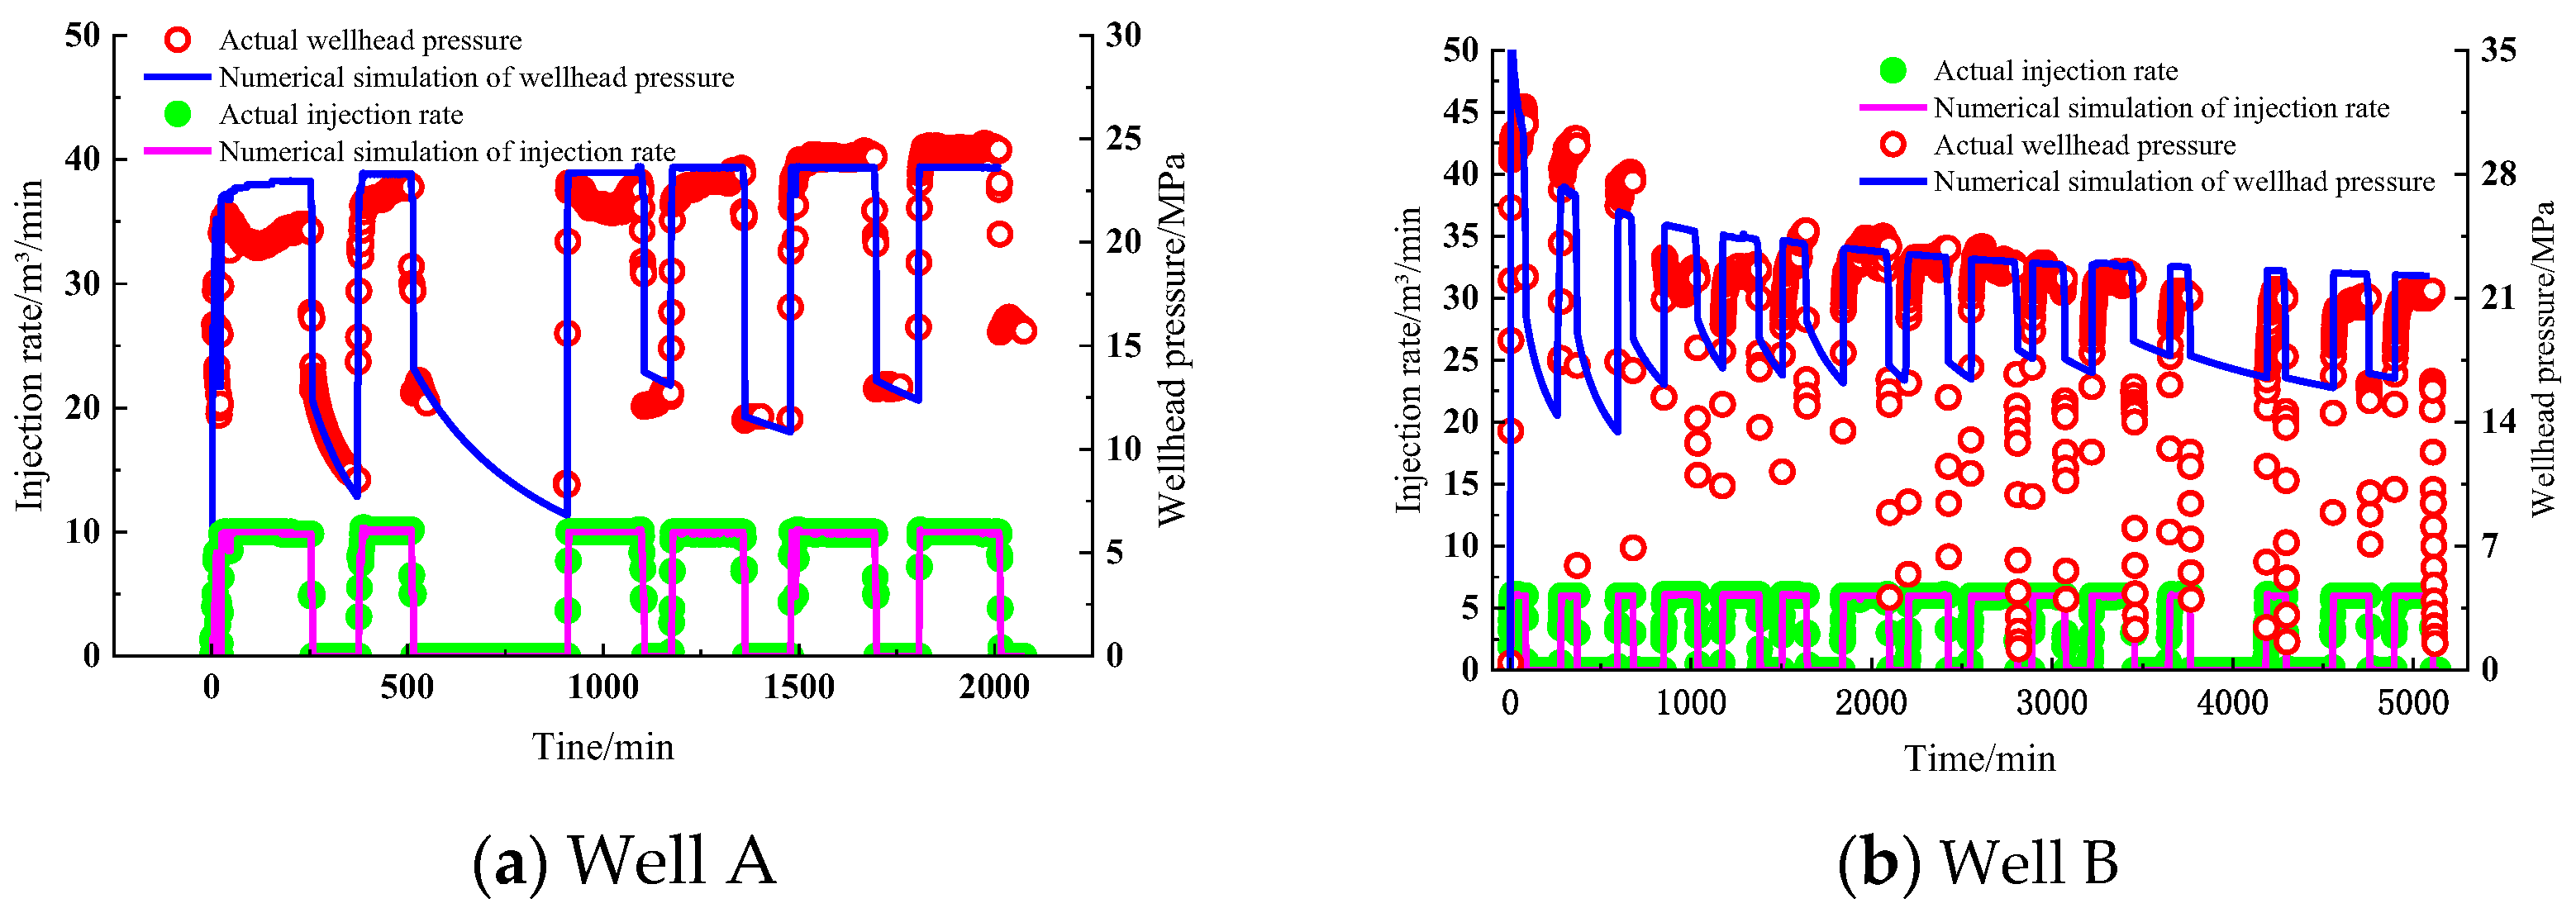
3.1. Validation
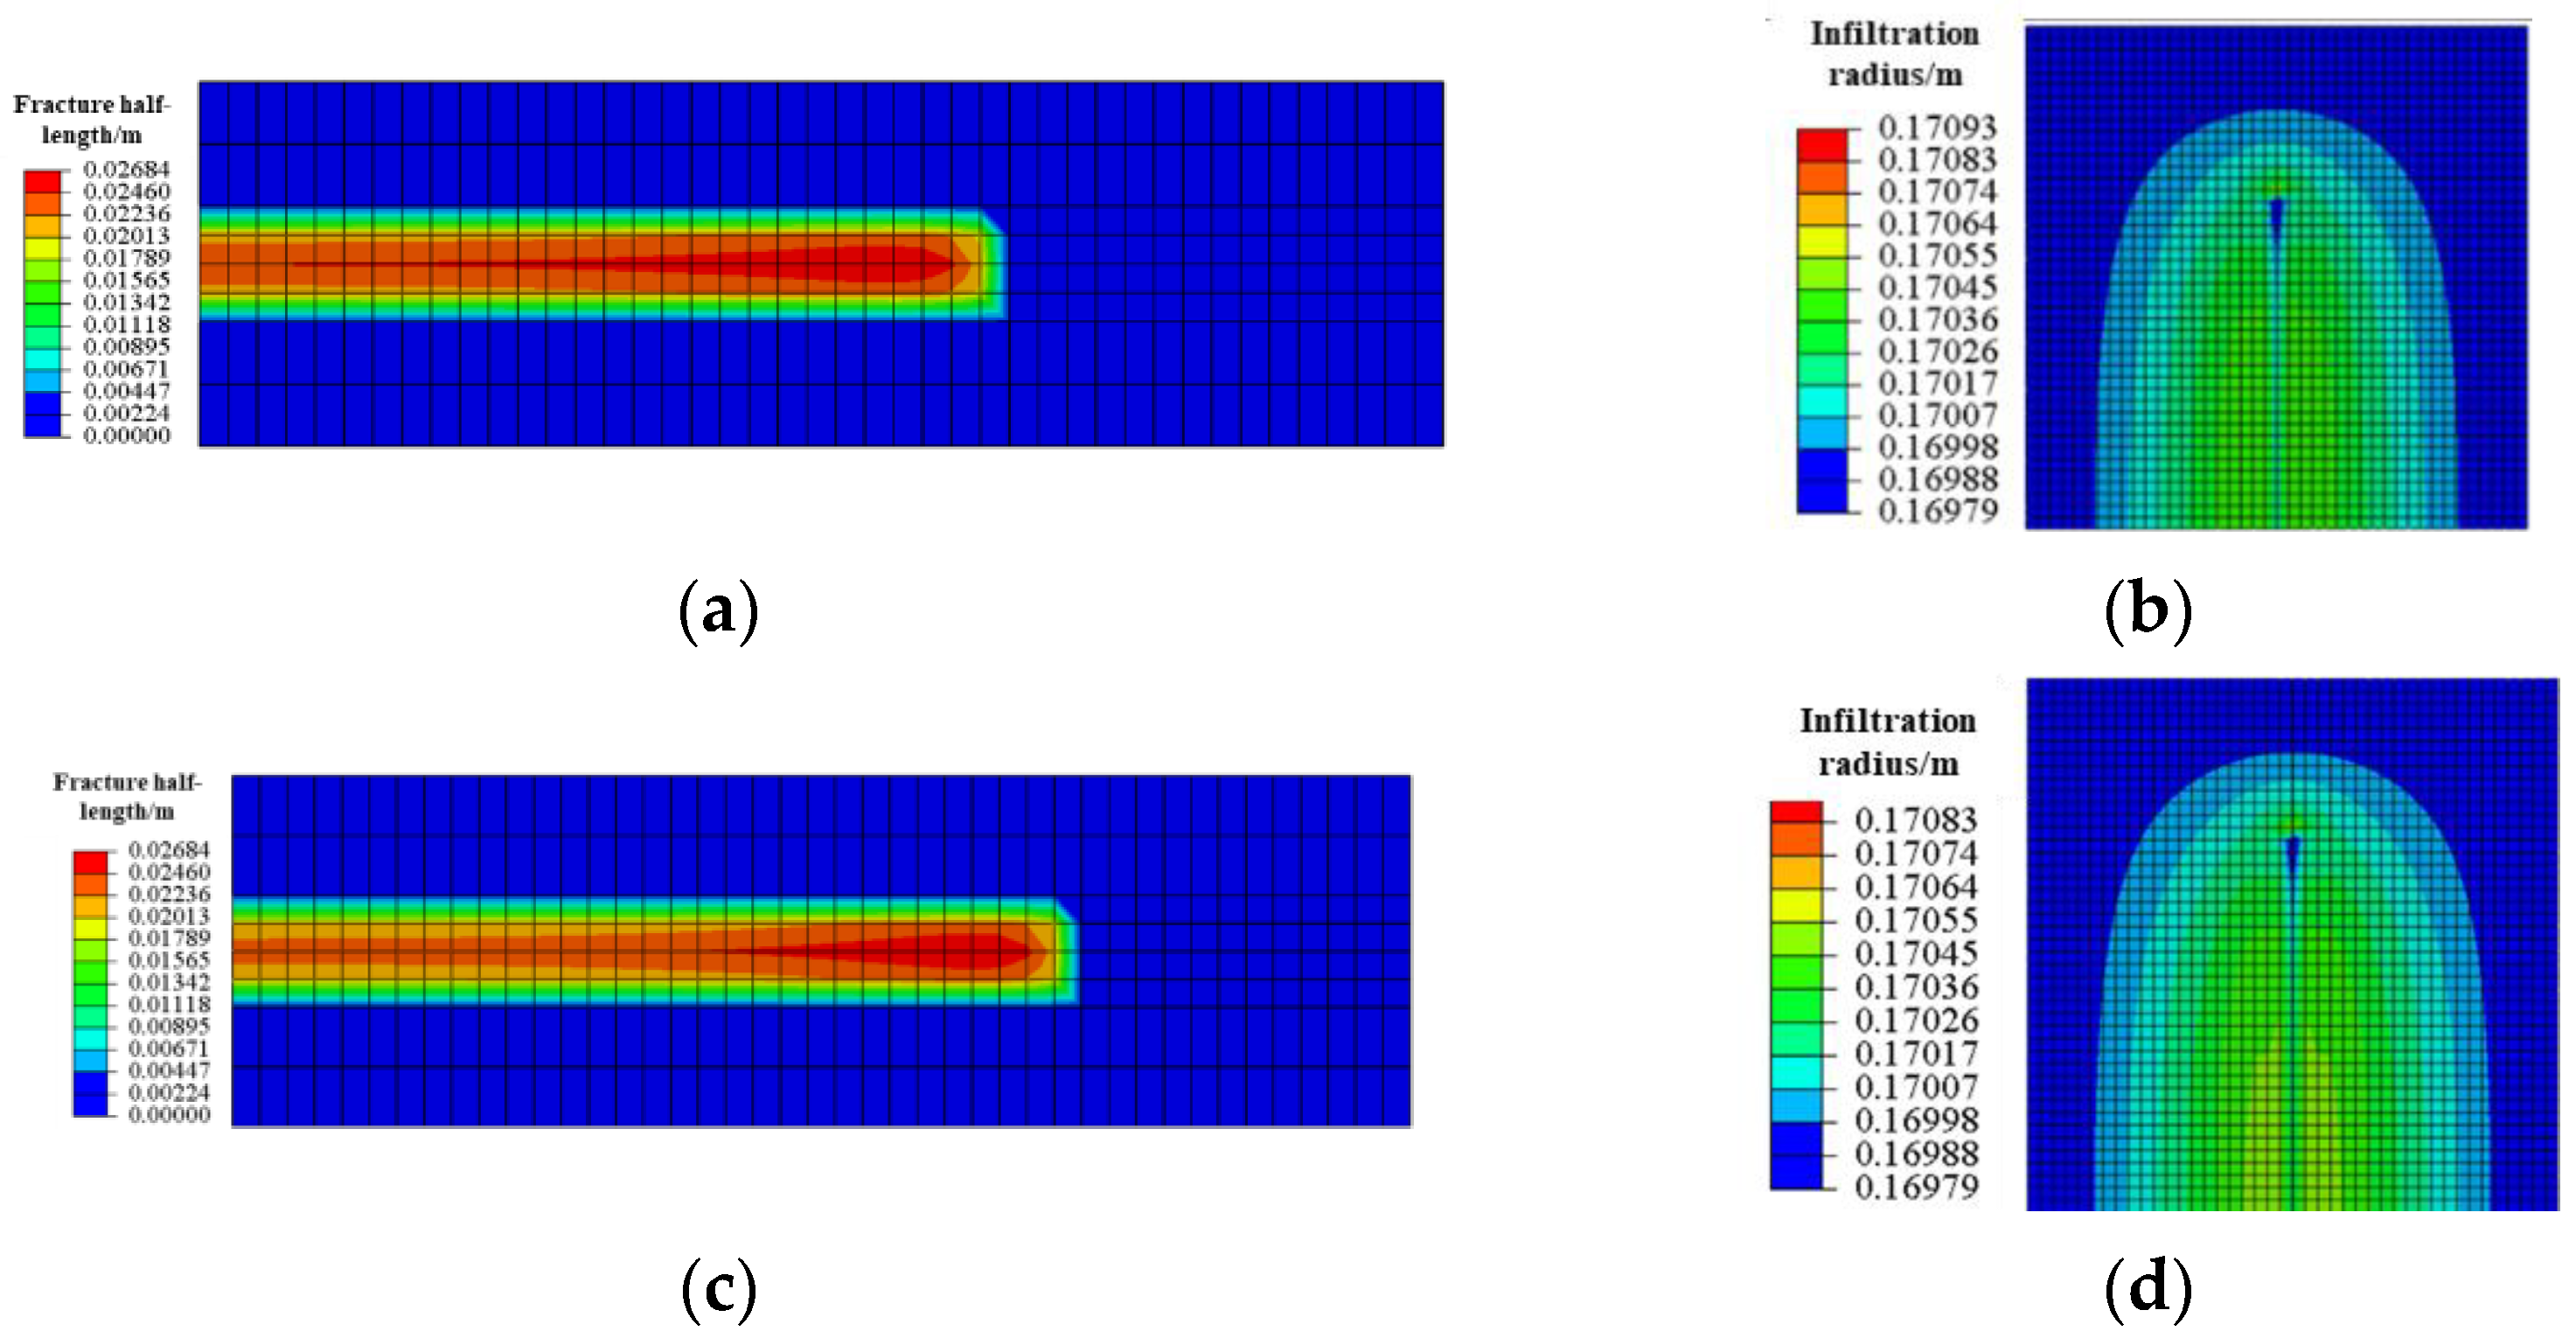
3.2. HFAOD Fracture Propagation and HFAOD Fluid Infiltration Law
4. Results and Discussion
4.1. Sensitivity Analysis
4.1.1. Geological Factors
- (1)
- Thickness
- (2)
- Permeability
- (3)
- Formation Pressure Coefficient before HFAOD
4.1.2. Construction Factors
- (1)
- Injection Rate
- (2)
- Viscosity
- (3)
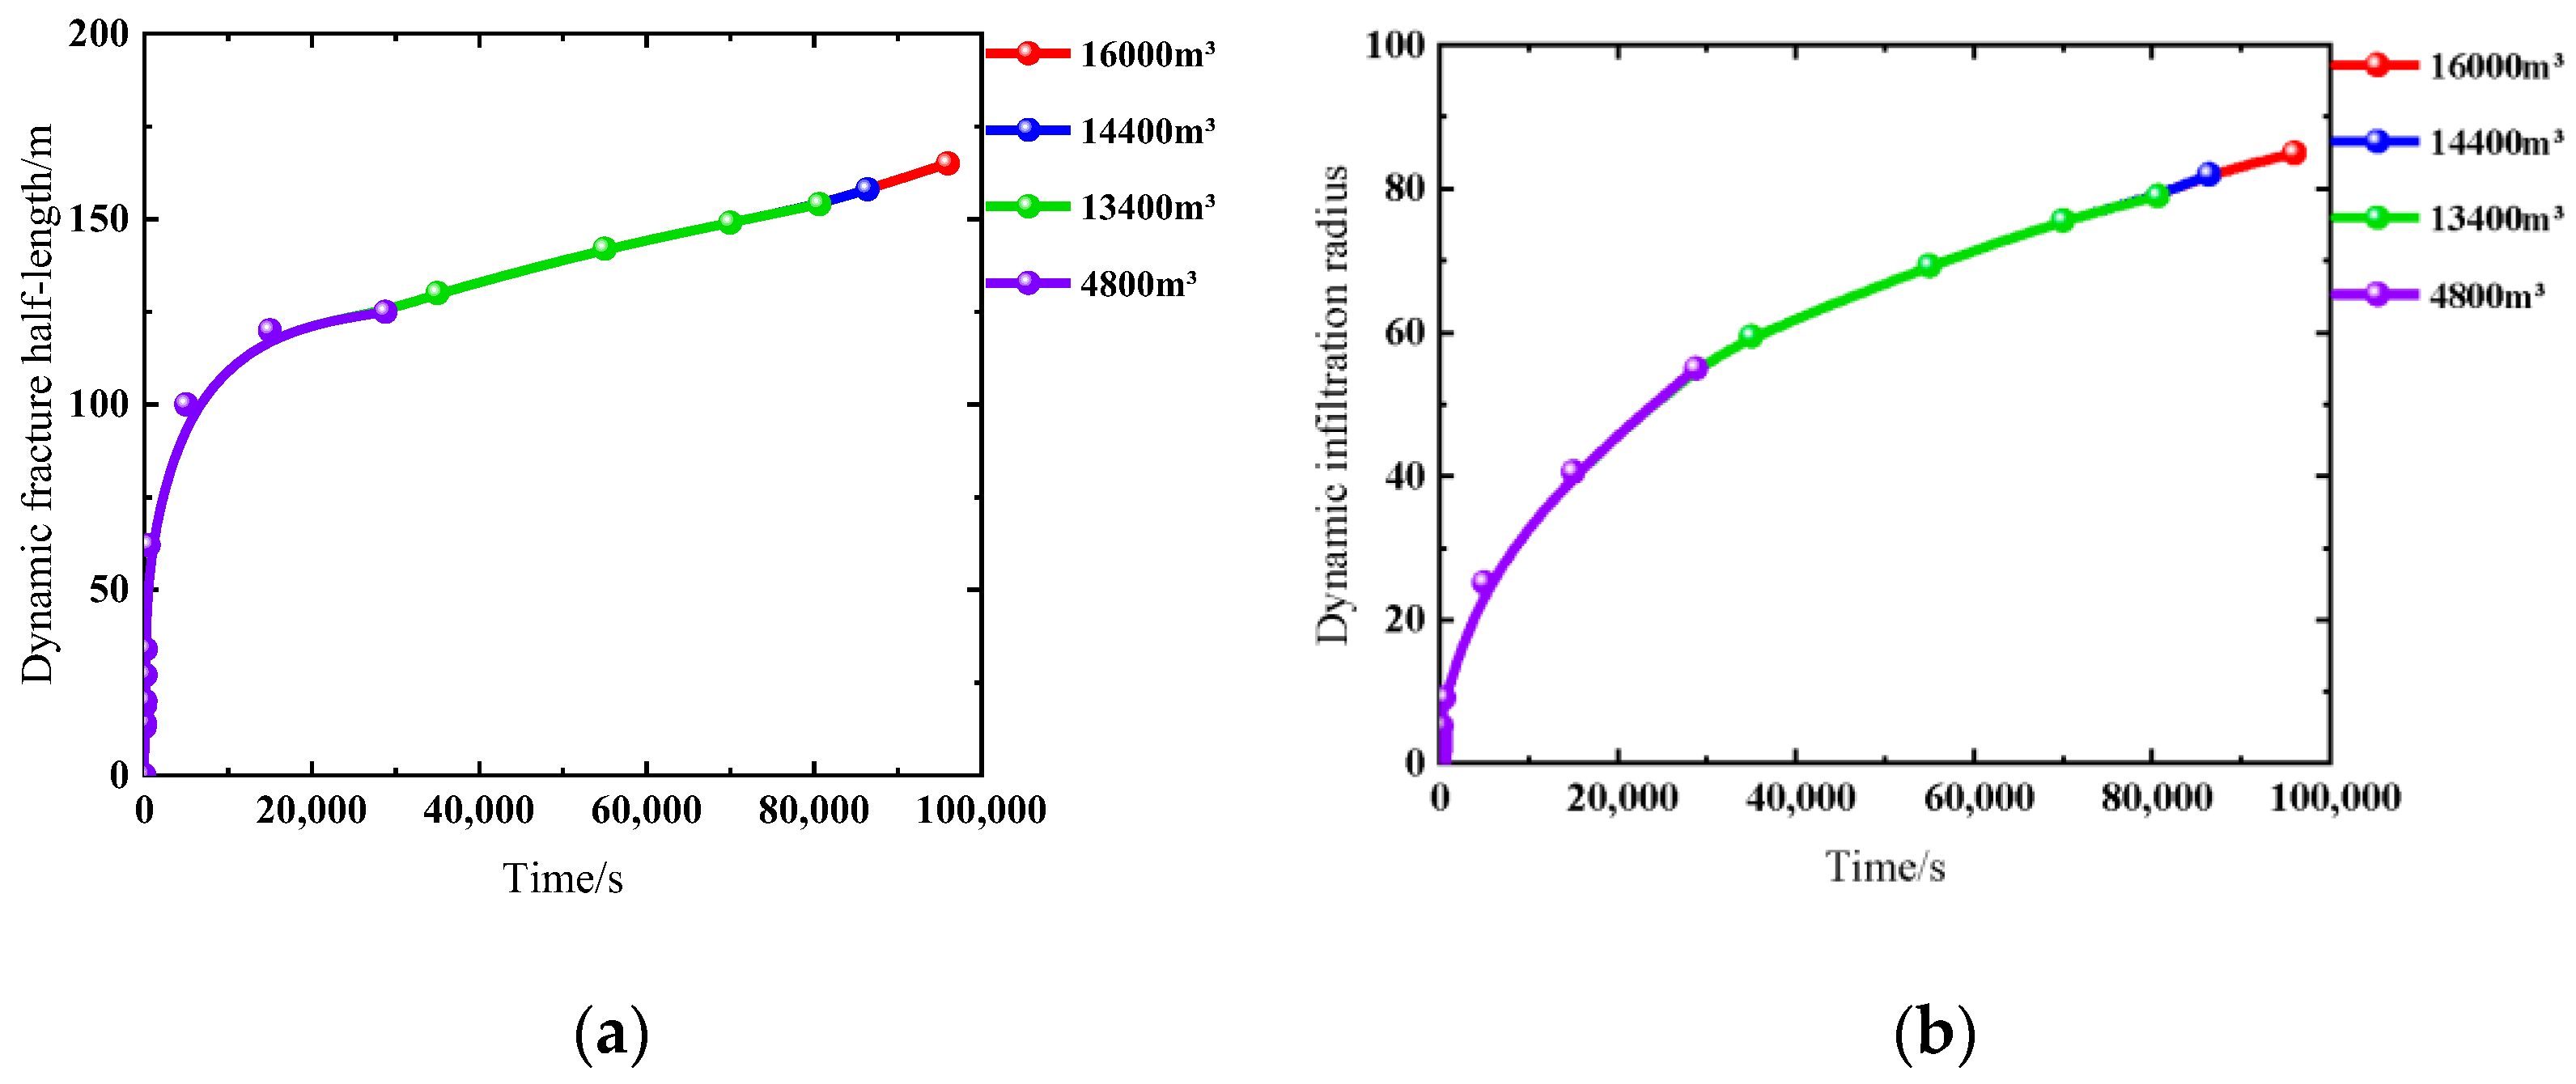
- Cumulative Injection Volume
4.2. Dominant Controlling Factors
4.3. Prediction of Fracture Half-Length and Infiltration Radius of HFAOD
5. Conclusions
- (1)
- Based on the HFAOD fluid-solid coupling mathematical model established in this paper, the fracture propagation pattern in offshore low-permeability oilfields was simulated, which shows good consistency with field data. The simulation accuracy of wellhead pressure for Well A and Well B reaches 86.3% and 85%, and the simulation accuracy of fracture half-length achieves 92.6% and 95.4%.
- (2)
- The fracture propagation of HFAOD and the infiltration pattern of HFAOD fluid exhibit nearly opposite trends. During the early stage of HFAOD, the HFAOD fluid primarily contributes to fracture creation, with rapid growth in fracture half-length and slower expansion of infiltration radius. In the mid-to-late stages, due to difficulty in energy accumulation at the fracture tip, the fracture propagation rate decreases, while the infiltration radius accelerates.
- (3)
- Using the entropy-weighted grey correlation method, the analysis indicates that the dominant controlling factors affecting HFAOD fracture half-length are reservoir thickness and injection rate, while the main controlling factors influencing the HFAOD infiltration radius are reservoir permeability and formation pressure coefficient before HFAOD. Additionally, higher HFAOD fluid viscosity and larger cumulative injection volume promote the growth of fracture length but retard the increase of infiltration radius.
- (4)
- Using multivariate linear regression, the relationships between fracture half-length/infiltration radius and their dominant controlling factors were quantified, enabling rapid prediction of HFAOD fracture half-length and infiltration radius.
Author Contributions
Funding
Data Availability Statement
Conflicts of Interest
References
- Li, Y.C.; Wang, Y.M.; Yang, G. On the Application of hydraulic fracturing assisted oil displacement technology in Daqing Oilfield. China Pet. Chem. Stand. Qual. 2017, 37, 163–164. [Google Scholar]
- Mud Logging Engineering. Hydraulic Fracturing Assisted Oil Displacement Pilot Test Post-Polymer Flooding in Daqing Lamadian Oilfield Achieves Initial Success. Newsletter. Mud Logging Eng. 2017, 28, 39. [Google Scholar]
- Ma, Y.J. Application of fracturing-flooding EOR technique in Type III oil reservoirs in Daqing Placanticline Oilfield. Pet. Geol. Oilfield Dev. Daqing 2021, 40, 103–109. [Google Scholar]
- Wu, Z.B.; Zeng, Q.; Li, J.; Wang, L. New effective energy-supplement development method of waterflood huff and puff for the oil reservoir with stimulated reservoir volume fracturing. Pet. Geol. Recovery Effic. 2017, 24, 78–83+92. [Google Scholar]
- Xu, J.D.; Wu, Y.S.; Xiong, Q.; Pu, X.H.; Feng, J.S.; Yue, S.J. Status and development trend of fracturing-flooding technology in low permeability reservoirs. Fault-Block Oil Gas Field 2023, 31, 1–16. [Google Scholar]
- Ma, F.Z.; Shao, Z.R.; Li, G.; Tang, L.; Yang, P.; Yan, B.F.; Chen, D.C.; Zhuang, D.; Zhang, H. Application of dilatant pressure flooding technology in low permeability reservoir in Bonan Oilfield. Unconv. Oil Gas 2023, 10, 58–66. [Google Scholar]
- Yang, Y.; Zhang, S.M.; Cao, X.P.; Lu, Q.; Wang, J.; Liu, H.C.; Yu, C.L.; Sun, H.X. Practice and understanding of pressure drive development technology for low-permeability reservoirs in Shengli Oilfield. Pet. Geol. Recovery Effic. 2023, 30, 61–71. [Google Scholar]
- He, J.Q.; Liu, Z.G.; Shen, T.Z.; Chen, G.; Wang, W.L. Research and Practice on Efficient Development Technology for Tight Oil Reservoirs in Wuqi Oilfield. China Pet. Chem. Stand. Qual. 2023, 43, 155–157. [Google Scholar]
- Huang, Y.; Jin, Z.R.; Qiao, C.G.; Zhang, H.L.; Ma, W. Practice of pressure drive water injection technology in small fault block reservoir of low permeability in Jiangsu oilfield. Petrochem. Ind. Appl. 2022, 41, 48–51. [Google Scholar]
- Cheng, Q.C. Mechanism and Technological Boundaries of Fracturing Displacement Production Enhancement in Extra-Low and Ultra-Low Permeability Sandstone Reservoirs. Ph.D. Thesis, Northeast Petroleum University, Daqing, China, 2023. [Google Scholar]
- Liu, Y.K.; Wang, F.J.; Wang, Y.M.; Li, H.B.; Zhang, D.; Yang, G.; Zhi, J.Q.; Sun, S.; Wang, X.; Deng, Q.J.; et al. The mechanism of hydraulic fracturing assisted oil displacement to enhance oil recovery in low and medium permeability reservoirs. Pet. Explor. Dev. 2022, 49, 752–759. [Google Scholar] [CrossRef]
- Wu, G.; Chen, X. Study on stimulation technology of low permeability oilfield. Oil Gas Prod. 2023, 49, 26–28. [Google Scholar]
- Zhang, Y.F.; Yang, Y.; Sun, Z.G.; Yu, C.L.; Sun, Q.; Bei, J.P. Physical simulation of fracturing-flooding and quantitative characterization of fractures in low-permeability oil reservoirs. Pet. Geol. Recovery Effic. 2022, 29, 143–149. [Google Scholar]
- Xu, B.; Liu, Y.; Wang, Y. A New Method and Application of Full 3D Numerical Simulation for Hydraulic Fracturing Horizontal Fracture. Energies 2018, 12, 48. [Google Scholar] [CrossRef]
- Ca, L.M.; Feng, Q.H.; Wang, S.; Xu, S.Q.; Liu, G.W.; Huang, W.H. Numerical simulation of fracture-flooding with virtual element method in a continuous damage model. Chin. J. Comput. Phys. 2023, 40, 81. [Google Scholar]
- Shen, H.Y.; Ma, Y.C.; Wang, Y.L.; Niu, J.L.; Liu, K.; He, Y.M. Application of pressure-drive integration technology of water injection well in tight sandstone reservoir. Petrochem. Ind. Appl. 2023, 42, 76–78. [Google Scholar]
- Fan, T.Y.; Song, X.M.; Wu, S.H.; Li, Q.Y.; Wang, B.H.; Li, X.B.; Li, H.; Liu, H.L. A mathematical model and numerical simulation of waterflood induced dynamic fractures of low permeability reservoirs. Pet. Explor. Dev. 2015, 42, 496–501. [Google Scholar] [CrossRef]
- Guo, Z.; Zhao, J.; Sun, X. A Novel Continuous Fracture Network Model: Formation Mechanism, Numerical Simulation, and Field Application. Geofluids 2022, 2022, 4026200. [Google Scholar] [CrossRef]
- Zhao, W.; Ji, G.; Li, K. A new pseudo 3D hydraulic fracture propagation model for sandstone reservoirs considering fracture penetrating height. Eng. Fract. Mech. 2022, 264, 108358. [Google Scholar] [CrossRef]
- Zhang, J.W.; Liu, X.J.; Xiong, J.; Liang, L.X.; Zhang, W.; Zhang, X. Fracture propagation law and main controlling factors of conglomerate hydraulic fracturing based on discrete element method. Pet. Geol. Oilfield Dev. Daqing 2023, 42, 48–57. [Google Scholar]
- He, Y.X.; Xu, Q.; Zhang, Z.G.; Bai, X.J.; Zhao, Y. Distribution characteristics and main controlling factors of hydraulic fracturing fractures of coalbed methane in the southwestern margin of Qinshui Basin. Coal Eng. 2023, 55, 141–147. [Google Scholar]
- Luo, P.; Wang, F.; Huang, H.; Sun, X.; Mu, J.F. Fluid loss model for dynamic propagation of hydraulic fractures. Pet. Geol. Eng. 2020, 34, 98–101. [Google Scholar]
- Wang, L.L.; Lin, X.B.; Leng, J.Y.; Zhou, C.J.; Ma, Z.G.; Xiao, Y.X. Quantitative prediction of fracturing fluid leak-off in shale gas reservoirs based on spontaneous imbibition model of fracturing fluid. Nat. Gas Ind. 2024, 44, 92–98. [Google Scholar]
- Zhou, T.; Wang, H.B.; Li, F.X.; He, B.; Zhou, T.; Li, N. Influence mechanism of fracturing fluid filtration on fracture initiation and dynamic closure process. Nat. Gas Ind. 2023, 43, 91–101. [Google Scholar]
- He, J.H.; Ding, W.L.; Wang, Z.; Lan, B.F.; Zhao, J.L.; Zhao, D. Main Controlling Factor of Fracture Network Formation of Volume Fracturing in Shale Reservoirs and Its Evaluation Method. Geol. Sci. Technol. Inf. 2015, 34, 108–118. [Google Scholar]


| Parameters | Reservoir | Interlayer |
|---|---|---|
| Young’s modulus/(GPa) | 26 | 18 |
| Poisson’s ratio | 0.24 | 0.32 |
| Tensile strength/(MPa) | 5 | 6 |
| Fluid infiltration coefficient/(m∙s1/2) | 2.56 × 10⁻¹³ | 2.56 × 10⁻¹⁴ |
| Formation stress/(MPa) | 41.50 | 45.54 |
| HFAOD fluid viscosity/(Pa∙s) | 0.001 | |
| Injection rate/(m3/s) | 0.08 | |
| Influencing Factors | Scheme | Parameters | Fracture Half—Length/(m) | Infiltration Radius/(m) | |
|---|---|---|---|---|---|
| Geological factors | Thickness/(m) | 1 | 4 | 262 | 102 |
| 2 | 13 | 215 | 87 | ||
| 3 | 28 | 153 | 76 | ||
| 4 | 40 | 97 | 63 | ||
| 5 | 50 | 75 | 57 | ||
| Permeability/(mD) | 6 | 10 | 216 | 74 | |
| 7 | 20 | 153 | 79 | ||
| 8 | 50 | 104 | 93 | ||
| 9 | 150 | 83 | 99 | ||
| 10 | 400 | 76 | 112 | ||
| Formation pressure coefficient before HFAOD | 11 | 0.5 | 153 | 79 | |
| 12 | 0.7 | 188 | 73 | ||
| 13 | 1 | 244 | 65 | ||
| 14 | 1.3 | 290 | 52 | ||
| Construction factors | Injection rate/(m3/min) | 15 | 2 | 77 | 105 |
| 16 | 5 | 153 | 79 | ||
| 17 | 6 | 187 | 65 | ||
| 18 | 8 | 244 | 47 | ||
| Viscosity/(mPa·s) | 19 | 1 | 153 | 79 | |
| 20 | 3 | 200 | 76 | ||
| 21 | 5 | 225 | 68 | ||
| 22 | 10 | 286 | 59 | ||
| Cumulative injection volume/(m3) | 23 | 4800 | 125 | 55 | |
| 24 | 13,440 | 153 | 79 | ||
| 25 | 14,400 | 158 | 82 | ||
| 26 | 16,000 | 165 | 85 |
| Scheme | Thickness/(m) | Permeability/(mD) | Pre-Measure Formation Pressure Coefficient | Injection Rate/(m3/min) | Viscosity/(mPa·s) | Cumulative Injection Volume/(m3) | Fracture Half—Length/(m) | Infiltration Radius/(m) |
|---|---|---|---|---|---|---|---|---|
| 1 | 4 | 20 | 0.5 | 5 | 1 | 6720 | 291 | 102 |
| 2 | 13 | 20 | 0.5 | 5 | 1 | 6720 | 260 | 96 |
| 3 | 28 | 20 | 0.5 | 5 | 1 | 6720 | 153 | 79 |
| 4 | 40 | 20 | 0.5 | 5 | 1 | 6720 | 97 | 63 |
| 5 | 50 | 20 | 0.5 | 5 | 1 | 6720 | 80 | 56 |
| 6 | 28 | 10 | 0.5 | 5 | 1 | 6720 | 216 | 74 |
| 7 | 28 | 20 | 0.5 | 5 | 1 | 6720 | 153 | 79 |
| 8 | 28 | 50 | 0.5 | 5 | 1 | 6720 | 104 | 93 |
| 9 | 28 | 150 | 0.5 | 5 | 1 | 6720 | 83 | 100 |
| 10 | 28 | 400 | 0.5 | 5 | 1 | 6720 | 76 | 112 |
| 11 | 28 | 20 | 0.5 | 5 | 1 | 6720 | 153 | 79 |
| 12 | 28 | 20 | 0.7 | 5 | 1 | 6720 | 174 | 70 |
| 13 | 28 | 20 | 1 | 5 | 1 | 6720 | 244 | 65 |
| 14 | 28 | 20 | 1.3 | 5 | 1 | 6720 | 295 | 45 |
| 15 | 28 | 20 | 0.5 | 2 | 1 | 6720 | 78 | 68 |
| 16 | 28 | 20 | 0.5 | 4 | 1 | 6720 | 118 | 74 |
| 17 | 28 | 20 | 0.5 | 5 | 1 | 6720 | 153 | 79 |
| 18 | 28 | 20 | 0.5 | 8 | 1 | 6720 | 244 | 86 |
| 19 | 28 | 20 | 0.5 | 5 | 1 | 6720 | 153 | 76 |
| 20 | 28 | 20 | 0.5 | 5 | 3 | 6720 | 208 | 66 |
| 21 | 28 | 20 | 0.5 | 5 | 5 | 6720 | 244 | 58 |
| 22 | 28 | 20 | 0.5 | 5 | 10 | 6720 | 286 | 56 |
| 23 | 28 | 20 | 0.5 | 5 | 1 | 2400 | 146 | 58 |
| 24 | 28 | 20 | 0.5 | 5 | 1 | 6720 | 153 | 79 |
| 25 | 28 | 20 | 0.5 | 5 | 1 | 7200 | 160 | 82 |
| 26 | 28 | 20 | 0.5 | 5 | 1 | 8000 | 165 | 85 |
| Scheme | Thickness | Permeability | Pre-Measure Formation Pressure Coefficient | Injection Rate | Viscosity | Cumulative Injection Volume | Fracture Half—Length | Infiltration Radius |
|---|---|---|---|---|---|---|---|---|
| 1 | 1.00 | 0.50 | 1.00 | 1.00 | 1.00 | 0.77 | 0.98 | 0.85 |
| 2 | 0.80 | 0.50 | 1.00 | 1.00 | 1.00 | 0.77 | 0.84 | 0.76 |
| 3 | 0.48 | 0.50 | 1.00 | 1.00 | 1.00 | 0.77 | 0.35 | 0.51 |
| 4 | 0.22 | 0.50 | 1.00 | 1.00 | 1.00 | 0.77 | 0.10 | 0.27 |
| 5 | 0.00 | 0.50 | 1.00 | 1.00 | 1.00 | 0.77 | 0.02 | 0.16 |
| 6 | 0.48 | 0.25 | 1.00 | 1.00 | 1.00 | 0.77 | 0.64 | 0.43 |
| 7 | 0.48 | 0.50 | 1.00 | 1.00 | 1.00 | 0.77 | 0.35 | 0.51 |
| 8 | 0.48 | 0.81 | 1.00 | 1.00 | 1.00 | 0.77 | 0.13 | 0.71 |
| 9 | 0.48 | 0.27 | 1.00 | 1.00 | 1.00 | 0.77 | 0.03 | 0.82 |
| 10 | 0.48 | 0.10 | 1.00 | 1.00 | 1.00 | 0.77 | 0.00 | 1.00 |
| 11 | 0.48 | 0.50 | 1.00 | 1.00 | 1.00 | 0.77 | 0.35 | 0.51 |
| 12 | 0.48 | 0.50 | 0.75 | 1.00 | 1.00 | 0.77 | 0.45 | 0.37 |
| 13 | 0.48 | 0.50 | 0.38 | 1.00 | 1.00 | 0.77 | 0.77 | 0.30 |
| 14 | 0.48 | 0.50 | 0.00 | 1.00 | 1.00 | 0.77 | 1.00 | 0.00 |
| 15 | 0.48 | 0.50 | 1.00 | 0.00 | 1.00 | 0.77 | 0.01 | 0.34 |
| 16 | 0.48 | 0.50 | 1.00 | 0.67 | 1.00 | 0.77 | 0.19 | 0.43 |
| 17 | 0.48 | 0.50 | 1.00 | 1.00 | 1.00 | 0.77 | 0.35 | 0.51 |
| 18 | 0.48 | 0.50 | 1.00 | 2.00 | 1.00 | 0.77 | 0.77 | 0.61 |
| 19 | 0.48 | 0.50 | 1.00 | 1.00 | 1.00 | 0.77 | 0.35 | 0.46 |
| 20 | 0.48 | 0.50 | 1.00 | 1.00 | 0.78 | 0.77 | 0.60 | 0.31 |
| 21 | 0.48 | 0.50 | 1.00 | 1.00 | 0.56 | 0.77 | 0.77 | 0.19 |
| 22 | 0.48 | 0.50 | 1.00 | 1.00 | 0.00 | 0.77 | 0.96 | 0.17 |
| 23 | 0.48 | 0.50 | 1.00 | 1.00 | 1.00 | 0.00 | 0.32 | 0.20 |
| 24 | 0.48 | 0.50 | 1.00 | 1.00 | 1.00 | 0.77 | 0.35 | 0.51 |
| 25 | 0.48 | 0.50 | 1.00 | 1.00 | 1.00 | 0.86 | 0.38 | 0.55 |
| 26 | 0.48 | 0.50 | 1.00 | 1.00 | 1.00 | 1.00 | 0.41 | 0.60 |
| Parameters | Cumulative Injection Volume (m3) | Thickness (m) | Injection Rate (m3/min) | Formation Pressure Coefficient | Permeability (mD) | Viscosity (mPa∙s) |
|---|---|---|---|---|---|---|
| Weigh of fracture half-length | 0.1329 | 0.2462 | 0.2046 | 0.1621 | 0.1364 | 0.1579 |
| Weigh of infiltration radius | 0.1199 | 0.0975 | 0.1642 | 0.2038 | 0.2999 | 0.1145 |
| Comparison Items | Zhang et al. [13] | Xu et al. [14] | This Research |
|---|---|---|---|
| Reservoir type | Onshore low-permeability oilfields | Different types of onshore oilfields | Offshore low—permeability oilfields |
| Principle | Fluid-rock coupling and three-dimensional CT reconstruction | Elastic rock mechanics equations, continuity equation of material flow finite element + Picca iteration | Rock mechanics equilibrium equation, Fluid seepage equation in the fracture, Fracture initiation criterion |
| Model | Ideal physical model | Ideal numerical model | Actual stratigraphic numerical model |
| Target parameters | HFAOD fracture pressure, Fracture width. | Fracture half-length, Fracture height, Vertical infiltration distance. | Fracture half—length, Infiltration radius |
| Verification means | / | Micro-seismic monitoring | Construction dynamics |
| Application scenarios | Quantitative characterization of micron-scale HFAOD fractures in onshore low-permeability oilfields. | Onshore oilfield HFAOD operation design. | Rapid prediction of HFAOD parameters in offshore low-permeability oilfields. |
Disclaimer/Publisher’s Note: The statements, opinions and data contained in all publications are solely those of the individual author(s) and contributor(s) and not of MDPI and/or the editor(s). MDPI and/or the editor(s) disclaim responsibility for any injury to people or property resulting from any ideas, methods, instructions or products referred to in the content. |
© 2025 by the authors. Licensee MDPI, Basel, Switzerland. This article is an open access article distributed under the terms and conditions of the Creative Commons Attribution (CC BY) license (https://creativecommons.org/licenses/by/4.0/).
Share and Cite
Yuan, H.; Peng, J.; Wu, S.; Li, Q.; Wan, X.; Liu, Y.; Shan, R.; Liang, S. Research on the Influencing Factors During Hydraulic Fracturing Assisted Oil Displacement Process in Offshore Low Permeability Oilfields and the Quantitative Characterization of Fracture Propagation and Liquid Infiltration. Processes 2025, 13, 1783. https://doi.org/10.3390/pr13061783
Yuan H, Peng J, Wu S, Li Q, Wan X, Liu Y, Shan R, Liang S. Research on the Influencing Factors During Hydraulic Fracturing Assisted Oil Displacement Process in Offshore Low Permeability Oilfields and the Quantitative Characterization of Fracture Propagation and Liquid Infiltration. Processes. 2025; 13(6):1783. https://doi.org/10.3390/pr13061783
Chicago/Turabian StyleYuan, Hui, Jianfeng Peng, Shaowei Wu, Qi Li, Xiaojin Wan, Yikun Liu, Ru Shan, and Shuang Liang. 2025. "Research on the Influencing Factors During Hydraulic Fracturing Assisted Oil Displacement Process in Offshore Low Permeability Oilfields and the Quantitative Characterization of Fracture Propagation and Liquid Infiltration" Processes 13, no. 6: 1783. https://doi.org/10.3390/pr13061783
APA StyleYuan, H., Peng, J., Wu, S., Li, Q., Wan, X., Liu, Y., Shan, R., & Liang, S. (2025). Research on the Influencing Factors During Hydraulic Fracturing Assisted Oil Displacement Process in Offshore Low Permeability Oilfields and the Quantitative Characterization of Fracture Propagation and Liquid Infiltration. Processes, 13(6), 1783. https://doi.org/10.3390/pr13061783