Abstract
Temperature and pressure coupling fluctuations are often encountered in oil and gas development processes, especially in the multi-stage volume fracturing process of shale gas development. The operations can lead to repeated changes in temperature and pressure within the casing due to the injection of large volumes of high-pressure fluids. The thermal–mechanical coupling alternating test of P110 and Q125 casings was carried out; meanwhile, a microstructure analysis was performed to investigate the relationship between yield strength variation law and the microstructure evolution of the casing material. The results indicate that as the number of thermal–mechanical coupling alternating cycles increases, the yield strength and ultimate strength of casing materials decrease, showing an initial rapid decrease, followed by a slower declining trend. And, comparing to the Q125 casing, the strength reduction in P110 is slightly greater. Moreover, the reduction in casing yield strength after different thermal–mechanical coupling alternating tests exhibits a significant mutual interaction mechanism of low cycle fatigue with thermal cycling aging, and a prediction model of yield strength under different TMCA cycles was established. Finally, from the perspective of the micro-analysis, the evolution of microstructures weakens the strengthening effects of fine grains, boundaries, and dislocation to the casing material, which is the fundamental cause of the strength reduction.
1. Introduction
Early research on the effects of alternating loads on casing performance primarily focused on cyclic steam stimulation operations in heavy oil thermal recovery [1,2]. The repeated high-temperature steam injection, soaking, and production processes subject casings to multiple heating–cooling cycles, i.e., thermal cyclic loading. Maruyama [3] and Hsu [4] conducted a statistical analysis on the relationship between casing failure rates and steam injection cycles, revealing that casing damage correlates with thermal cyclic loads and the number of steam stimulation cycles. In this field, Joao [5] experimentally simulated and recorded casing stress under multi-cycle thermal loading, concluding that residual tensile stress dominates after single heating–cooling cycles and that residual stress increases with casing material strength. T. Kasier [6] investigated the thermal–mechanical behavior of casing materials under thermal cyclic loads; they proposed that deformation limits after yielding provide more practical criteria than yield strength during fatigue failure design in thermal recovery casings. Gan Quan [7] further examined the cumulative residual stress changes in casings and cement during multi-cycle steam stimulation, combined with strength failure criteria, to conduct failure cycle predictions.
Gas storage well casings face severe operating conditions with high-flow-rate injection/production cycles [8,9], where their fatigue characteristics under temperature–pressure fluctuations become critical for operational safety. During gas storage operations, sustained alternating stresses from downhole pressure fluctuations induce casing string vibrations [10]. Moreover, constrained by wellbore geometry and affected by annulus pressure, vibrating casing strings may experience collisions, deformations, and even fatigue failures. Therefore, investigating the strength variation of casings under temperature–pressure cycling holds significant importance for gas storage well integrity studies.
In unconventional oil/gas well operations, casing strings are also subjected to thermal–mechanical cyclic loads during multi-stage volumetric fracturing processes. Liu He [11] divided the study on casing deformation failure under volume fracturing into four aspects. One of the research directions is that the temperature change and pressure fluctuation caused by the large volume fracturing fluid during the fracturing process lead to reductions in casing strength. Xi Yan [12,13,14] used a combined analytical and numerical method to study the influence of temperature–pressure coupling on the stress of casings and obtained that the stress of the casing shows an increasing and then decreasing pattern. Fan Mingtao [15,16] and Li Bin [17] studied the mechanical properties of a reservoir during shale volume fracturing, and the temperature field and pressure field changes of its wellbore based on the sequential coupling method and superimposed the transient temperature field change process of the wellbore onto the stress field of the wellbore during the fracturing process. Through numerical simulation, they concluded that injecting a large amount of fracturing fluid will cause the wellbore temperature to drop rapidly, resulting in a reduction in casing strength. Joao C.R. Placido [5] conducted a study on casing deformation in a high-temperature atmosphere and found that the tensile load of a casing was generated by alternating temperature conditions and increased with an increase in the API grade of the casing. The casing strength weakened, and deformation failure occurred. Yin Hu [18] focused on the fracturing construction technology and conditions of shale gas horizontal wells; proposed a thermal conduction control characterization model under hydraulic fracturing; and based on the finite difference method, obtained the variation values of the casing compressive strength of different material grades under different temperatures. It was pointed out that the temperature has a more obvious impact on the external compressive strength of the casing. Lu Caihong [19] conducted a thermal–mechanical coupling alternating test simulating multi-stage volume fracturing conditions and obtained the variation law of the residual yield strength of P110 casings. Research on the microscopic damage evolution of metal materials under temperature–load coupling is relatively rare. Zhao Lei [20,21] studied the microscopic damage evolution of heat-resistant material under the interaction of creep fatigue and pointed out that there were obvious decreases in the intragranular dislocation density, disappearances in the subgrain boundaries, and coarse graining of the plates. Gu Pengcheng [22] studied the thermal mechanical fatigue behavior of 4Cr5Mo2V hot-worked tool material and found that the more temperature and mechanical coupling cycles, the more severe the martensitic lamellar coarsening and carbide precipitation coarsening phenomena. Ge Renyue [23] conducted creep-fatigue tests on P92 material to study the damage evolution mechanism; the results showed that under short-term holding loads, the fracture surface of the specimen was mainly fatigue bands, while under long-term holding loads, in addition to fatigue striations, there were also creep holes. At the same time, due to long-term high temperatures, the carbides on the grain boundaries coarsen and become connected.
The thermal–mechanical coupling alternating loads caused by multi-stage volume fracturing leads to reductions in casing strength, increase the risk of casing damage, and affect the safety of oilfield production. However, the strength variation law and microstructure evolution mechanism of casing materials under TMCA loads are rarely reported.
Q125 and P110 casings with high strength are widely used in unconventional wells. This paper investigates their strength variation under TMCA conditions and reveals the mechanisms of their microstructure evolution, thus providing theoretical support for the strength evaluation and material selection of casings used in unconventional oil and gas development.
2. Materials and Methods
2.1. Materials
In order to compare the strength variation of the P110 and Q125 casing materials after the TMCA tests, the tensile samples were machined along the axis of the casings, according to the drawings shown in Figure 1. The main chemical composition (mass fraction, %) of the P110 and Q125 casing materials are shown in Table 1.
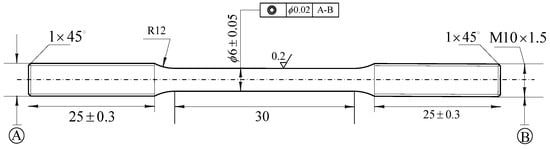
Figure 1.
Experimental materials and specimens.

Table 1.
Chemical compositions of the P110 and Q125 casing material (wt.%).
2.2. Thermal–Mechanical Coupling Cycle Test
The TMCA tests of P110 and Q125 were carried out using the same equipment and test methods. The MTS fatigue test equipment (MTS Systems corporation, Eden Prairie, MN, USA), with an independently installed environmental chamber and a temperature–load coupling electronic control system (shown in Figure 2), can be used to determine the temperature–load coupling alternating load, which is used to simulate the alternating temperature and pressure working conditions during multiple-stage volume fracture processes. In addition, the model of the extensometer was 634.12F-25, and its operating temperature range was −100 °C to 175 °C, as shown in Figure 2b. The specific equivalent test load calculation method and detailed test procedures are consistent with the description in Reference [20].
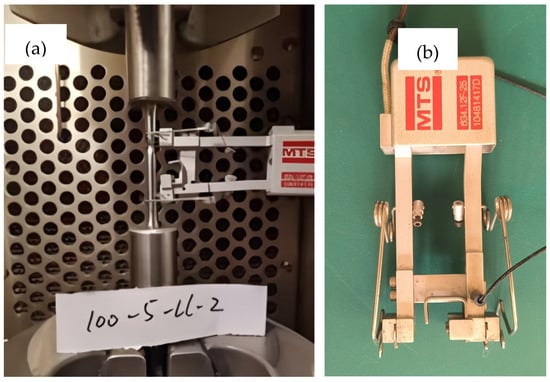
Figure 2.
Tensile sample in the environmental chamber. (a) the tensile sample, (b) the extensometer.
The single cycle test scheme of the TMCA test of P110 and Q125 casing materials was as follows:
- Tension and tension (T-T) cycles and temperature cycle coupling alternating test
For the tensile fatigue load, the peak-to-valley values were, respectively, 85% to 75% of the yield load of the casing materials, and the alternating frequency was 1 Hz. A T-T cycle lasted for 8 h, including two 4 h tensile cycles, and the load was reset to zero between each cycle.
The coupling temperature alternated in the range from 28 °C to 100 °C, or from 28 °C to 150 °C, and the frequency was alternated every 30 min, as shown in Figure 3.
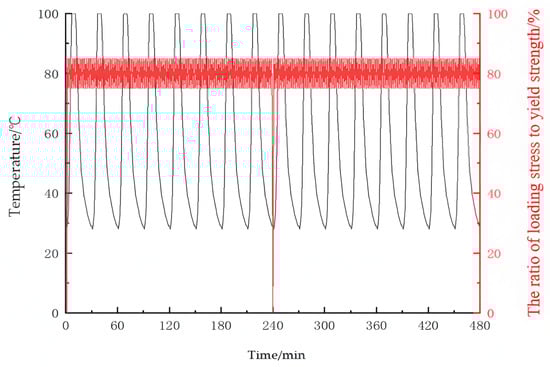
Figure 3.
Load curve of a single coupling alternating load in the T-T cycle and 28~100 °C temperature.
- 2.
- Tension and compression (T-C) cycles with temperature cycle coupling alternating test
For the tensile fatigue load, the peak-to-valley values were, respectively, 85% to 75% of the yield load of the casing materials, while for the compression fatigue load, the peak-to-valley values were, respectively, −40% to −59% of the yield load. The alternating frequency was 1 Hz. A T-C cycle lasted for 8 h, including 4 h tensile cycles and 4 h compression cycles, and the load was reset to zero between each cycle.
The coupling temperature was alternated in the range from 28 °C to 100 °C, or from 28 °C to 150 °C, and the frequency was alternated every 30 min, as shown in Figure 4.
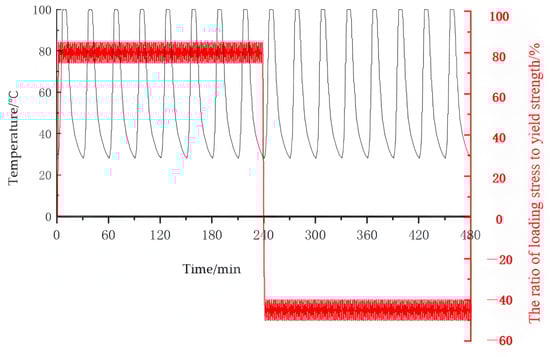
Figure 4.
Load curve of a single coupling alternating load in the T-C cycle and 28~100 °C temperature.
The TMCA test was conducted at 28~100 °C 10, 20, and 40 times and at 28~150 °C 10 and 30 times. Finally, the samples were stretched until fracture at room temperature, and the yield strengths of P110 and Q125 after the TMCA test were comparatively analyzed.
2.3. Microstructure Observation
The specimens used for microstructure observation were cut by electric discharge machining (EDM) from the tensile sample. The specific cutting position was within the gauge length section of the tensile test specimen, away from the fracture point.
2.3.1. EBSD Characterization
Sample preparation: The samples were ground with silicon carbide papers progressively up to 2000 grit. Subsequently, the samples were polished and etched with a 4% nital alcohol solution.
Testing method: The NordlysMax3 EBSD analysis equipment (Oxford Instruments, Abingdon, UK) was used for testing, with the default first coordinate system, where the z-axis direction corresponds to the fatigue tensile–compressive direction (TD). The scanning step size was 0.35 μm, and the scanned area was 120 μm × 120 μm. The EBSD acceleration voltage was set at 20 kV, and the current was 10 nA.
Data analysis: The HKL Channel 5 (Oxford instrument, Abingdon, UK) software was utilized to analyze the grain boundaries and local strain distribution of samples.
2.3.2. TEM Observation
Sample preparation: Samples with a thickness of 0.5 mm were cut by EDM, and then, its thickness was reduced to 80 μm by mechanical polishing. A punch machine was used to create holes in the thin sheet, resulting in circular pieces with a diameter of 3 mm. Subsequently, double-jet electrolytic polishing was employed to further thin the sample, creating a thinned area. The double-jet electrolyte mainly consists of a 10% perchloric acid alcohol solution, with a temperature of −30 °C and a constant current mode of 40 mA.
TEM analysis (JEMF200 TEM: Japanese electronic manufacturing, Tokyo, Japan) primarily focuses on analyzing dislocation density distributions.
3. Results and Discussion of Mechanical Properties
3.1. Mechanical Properties and Microstructure of Casing Material
3.1.1. Mechanical Properties of Casing Material
The static tensile test results of the P110 and Q125 casing material under different temperature are shown in Figure 5. Compared with at room temperature, the yield strength and tensile strength of P110 are reduced by 10.56% and 0.53%, respectively, at 100 °C, and by 10.51% and 0.28%, respectively, at 150 °C. While the yield strength and ultimate strength of Q125 at 100 °C are reduced by 5.18% and 3.20%, respectively, and by 7.70% and 4.10%, respectively, at 150 °C. The decrease in yield strength at high temperatures is greater than that in ultimate strength, while the yield strength reduction ratio of Q125 is lower than that of P110, whereas the ultimate strength is the opposite.
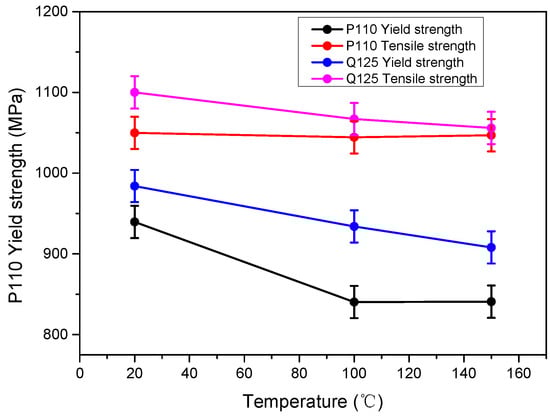
Figure 5.
Mechanical properties of the Q125 casing at different temperatures.
3.1.2. Microstructure of Casing Material
The mechanical properties of Q125 are significantly superior to those of P110, primarily due to distinct differences in their microstructures, as shown in Figure 6. The main strengthening methods of steel include solid solution strengthening, fine grain strengthening, precipitation strengthening, dislocation strengthening, etc. The finer the grain size, the narrower the martensitic slats, and the larger the total area of grain boundaries, the more significant the pinning effect on dislocation slip under external force. Additionally, the steel is less likely to undergo plastic deformation, thereby enhancing the yield strength of the steel. Similarly, the finer the second-phase carbide particles, the more dispersed distribution of carbide, the more significant the hindrance to dislocation slip under external forces, and the more enhanced the yield strength of steel. In addition, when the dislocation density is relatively high, dislocation entanglement occurs under external force, hindering dislocation sliding and exerting a dislocation strengthening effect on steel.
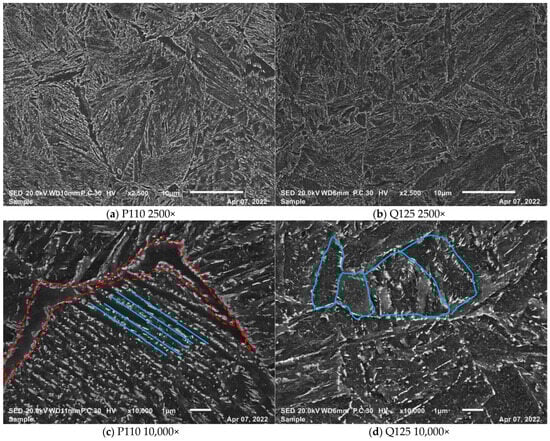
Figure 6.
Microstructure of the P110 and Q125 casing material.
The microstructure characteristics are shown in Figure 6. Figure 6a,b show the microstructure of the P110 casing, and Figure 6c,d show the microstructure of the P110 casing. Comparing Figure 6a,b, Q125 undergoes a quenching and tempering process, resulting in a more homogeneous microstructure dominated by tempered sorbite. In contrast, the microstructure of P110 contains tempered sorbite alongside a small amount of intergranular ferrite (outlined in red lines in Figure 6). This is attributed to a higher quenching temperature and a slower cooling rate of P110, which promote the formation of high-temperature ferrite along the grain boundaries during quenching. The presence of this low-strength ferritic structure is one of the reasons for the lower overall strength of P110. Furthermore, Q125 exhibits a notably smaller average grain size compared to P110, contributing to enhanced strength through grain refinement strengthening. As shown in Figure 6c,d, the secondary precipitates of Q125 are predominantly spherical, smaller in size, and more uniformly dispersed. However, the secondary phases of P110 are mostly rod-shaped, fewer in number, and concentrated at the grain or subgrain boundaries. This distribution weakens grain boundary cohesion and reduces the pinning effect on dislocations. Additionally, Q125 contains more lath bundles within its grains (as shown by the blue lines in Figure 6). These microstructural characteristic-refined grains, optimized precipitates, and homogeneously tempered sorbite collectively explain the fundamental reasons for the superior strength of Q125.
3.2. Mechanical Property Variation of Casing Material
3.2.1. Yield Strength Variation After TMCA Test
The yield strength data were obtained from the tensile tests of the P110 and Q125 casing materials after different numbers of TMCA tests. The yield strength variation curves are shown in Figure 7. With the increase in cycle number, the yield strength decreased, showing an initial rapid decrease, followed by a slower declining trend, and the overall curve presented an exponential decreasing distribution pattern. The yield strength attenuation ratio of P110, compared to the original strength value, was greater than that of Q125.
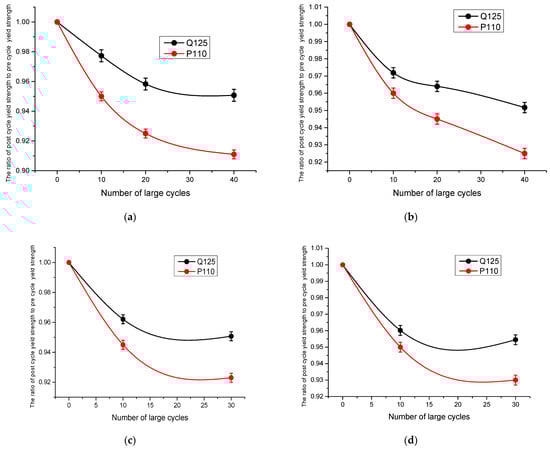
Figure 7.
Yield strength variation curves of P110 and Q125 after TMCA tests. (a) Yield strength variation curves of casing after T-T cycles with 28 °C to 100 °C temperature alternation. (b) Yield strength variation curves of casing after T-C cycles with 28 °C to 100 °C temperature alternation. (c) Yield strength variation curves of casing after T-T cycles with 28 °C to 150 °C temperature alternation. (d) Yield strength variation curves of casing after T-C cycles with 28 °C to 150 °C temperature alternation.
Comparing Figure 7a,b, with the same temperature alternating range from 28 °C to 100 °C, the T-T cycles led to a greater yield strength attenuation ratio than the T-C cycles. After 10 cycles, the yield strength of P110 decreased by 4.8% under the T-T cycle conditions and by 3.5% under the T-C cycle conditions, while the yield strength of Q125 decreased by 4.4% under the T-T cycle conditions and by 3.0% under the T-C cycle conditions. After 20 cycles, the yield strength of P110 reduced by 7.4% under the T-T cycle conditions and by 6.0% under the T-C cycle conditions, while the yield strength of Q125 reduced by 4.8% under the T-T cycle conditions and by 3.7% under the T-C cycle conditions. After 40 cycles, the yield strength of P110 declined by 8.6% under the T-T cycle conditions and by 7.8% under the T-C cycle conditions, while the yield strength of Q125 declined by 4.1% under the T-T cycle conditions and by 4.8% under the T-C cycle conditions.
Comparing Figure 7c,d, with the same temperature alternating range from 28 °C to 150 °C, the T-T cycles also led to a greater yield strength attenuation ratio than the T-C cycles. Comparing Figure 7a,c, with the same T-T cycles, the yield strength decreased more under higher temperatures than under lower temperatures. After 10 and 30 cycles, the yield strength of the P110 casing material decreased by 5.5% and 8.2%, while the yield strength of Q125 reduced by 3.8% and 4.9%. Comparing Figure 7b,d, under the T-C cycle conditions, the yield strength decline trend was similar to that of T-T cycle. After 10 and 30 cycles, the yield strength of the P110 casing material decreased by 5.1% and 7.3%, while the yield strength of Q125 reduced by 4.0% and 4.5%.
3.2.2. Ultimate Strength Variation After TMCA Test
Figure 8 shows the variation curves of the ultimate strength of the casing material after the TMCA test. As the number of cycles increases, the ultimate strength reduced, showing an initial rapid decrease, followed by a slower declining trend, and the overall curve presented an exponential decreasing distribution pattern. The variation in the ultimate strength of Q125 under the T-T and T-C cycle conditions was basically consistent, while the ultimate strength of P110 under the T-T cycle conditions decreased more than under the T-C cycle conditions. For P110, when the temperature alternates from 28 °C to 100 °C, comparing Figure 8a,b, under different numbers of T-T cycles, the ultimate strength reduced by 3.6%, 5.8%, and 7.5%, respectively, after 10, 20, and 40 cycles. While under the T-C cycle conditions, the ultimate strength declined by 3.2%, 4.7%, and 6.9%, respectively, after 10, 20, and 40 cycles. Comparing Figure 8c,d, when the temperature fluctuates from 28 °C to 150 °C, the ultimate strength attenuation ratio was greater than that of the temperature fluctuation from 28 °C to 100 °C. After 10 cycles and 30 cycles, the ultimate strength under the T-T cycle conditions dropped by 4.0% and 6.9%, while it declined by 4.1% and 6.8%.
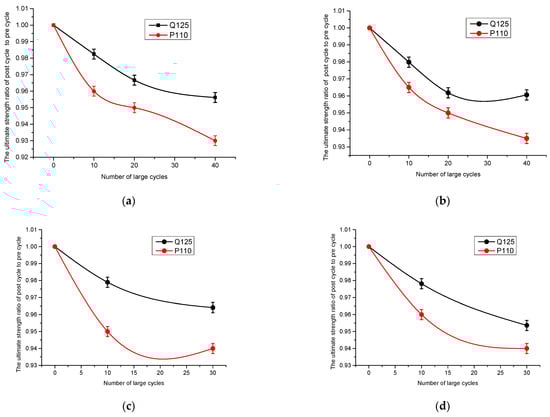
Figure 8.
Ultimate strength variation curves of P110 and Q125 after TMCA tests. (a) Ultimate strength variation curves of casing after T-T cycles with 28 °C to 100 °C temperature alternation. (b) Ultimate strength variation curves of casing after T-C cycles with 28 °C to 100 °C temperature alternation. (c) Ultimate strength variation curves of a casing after T-T cycles with 28 °C to 150 °C temperature alternation. (d) Ultimate strength variation curves of a casing after T-C cycles with 28 °C to 150 °C temperature alternation.
For Q125, the number of cycles has more impact on the ultimate strength variation. The temperature cycling from 28 °C to 150 °C and from 28 °C to 100 °C has almost no difference on the ultimate strength attenuation. Under different numbers of T-T cycles, the ultimate strength reduced by 2.3%, 3.6%, and 4.0%, respectively, after 10, 20 and 40 cycles. While under the T-C cycle conditions, ultimate strength declined by 2.2%, 3.4%, and 3.6%, respectively, after 10, 20, and 40 cycles.
3.2.3. Prediction of Yield Strength of Q125 Casing After TMCA Tests
According to the yield strength variation curve of the Q125 casing after the TMCA tests, the Allometric model was used to fit the Q125 casing yield strength variation. The equation of Allometric model [24] is shown in (1):
where σF is the yield strength of the material after low cycle fatigue, in MPa; m is the deformation coefficient; P is the deformation index related to the load level; Nc stands for the current fatigue cycle; and Nf is the fatigue failure cycle.
Meanwhile, the yield strength variation after the thermal cycling test is consistent with the ExpDec model [24] in Equation (2):
where σAT is the yield strength after thermal cycle aging; σ0 is the initial yield strength, in MPa; T is the temperature coefficient; and t0 stands for the temperature index.
The coupling effect on the yield strength of Q125 under different TMCA cycles exhibits a significant mutual interaction mechanism of low cycle fatigue with thermal cycling aging. Based on Equations (1) and (2), the yield strength prediction model [20] of the Q125 casing after the TMCA test is created as shown in Equation (3):
Employing Equation (3), the yield strength variation curve and parameter values of the Q125 casing after the TMCA test was fitted as shown in Figure 9 and Table 2. The experimental strength values are depicted as discrete points in Figure 9. The fitting result shows a good match with the experimental data, and the error is within 4.26%.
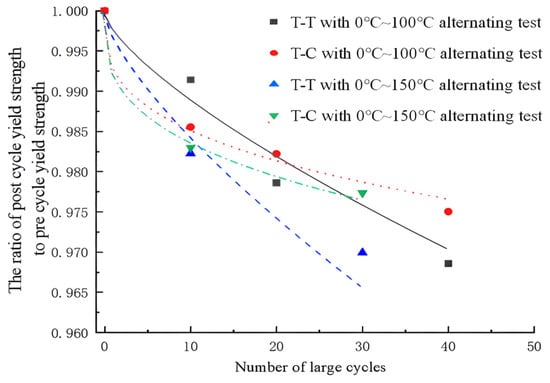
Figure 9.
Fitting curve of Q125 casing yield strength after TMCA tests.
Table 2.
Fitting results of the Q125 casing yield strength prediction model after the TMCA test.
4. Results and Discussion of Microstructure Evolution
The microstructure evolution of the Q125 casing material during the TMCA process with a temperature cycle from 28 °C to 100 °C was analyzed by SEM + EBSD. The microstructures of the Q125 casing material were comparatively characterized after 0 cycles, 40 T-T cycles, and 40 T-C cycles.
4.1. Evolution of Grain Orientation, Grain Size, and Aspect Ratio of Grains
The IPF maps of Q125 under different loading cycles are shown in Figure 10. The original grain orientation of the Q125 was randomly distributed, with no clear preferred orientation, as shown in Figure 10a. After 40 T-T cycles and 40 T-C cycles, the grains rotated to some extent, resulting in a slight preferred orientation parallel to the tensile direction (TD) in certain areas of the material, as shown in Figure 10b,c. After 0 cycles, 40 T-T cycles, and 40 T-C cycles, the grain sizes of the Q125 casing material were 2.555 μm, 6.271 μm, and 3.601 μm, respectively, as shown in Figure 11a,c,e, and the aspect ratios of the grains were 1.88, 2.603, and 2.305, respectively, as shown in Figure 11b,d,f. It is evident that after the TMCA test, both the grain size and the grain aspect ratio increased gradually with the increase in cycle number, and after 40 T-T cycles, the increase in grain size and aspect ratio is greater than after 40 T-C cycles.
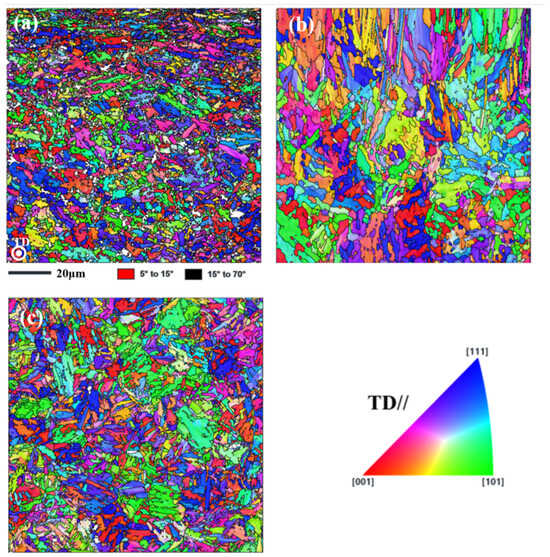
Figure 10.
IPF maps of Q125 after different loading cycles: (a) original state, (b) 40 T-T cycles, (c) 40 T-C cycles.
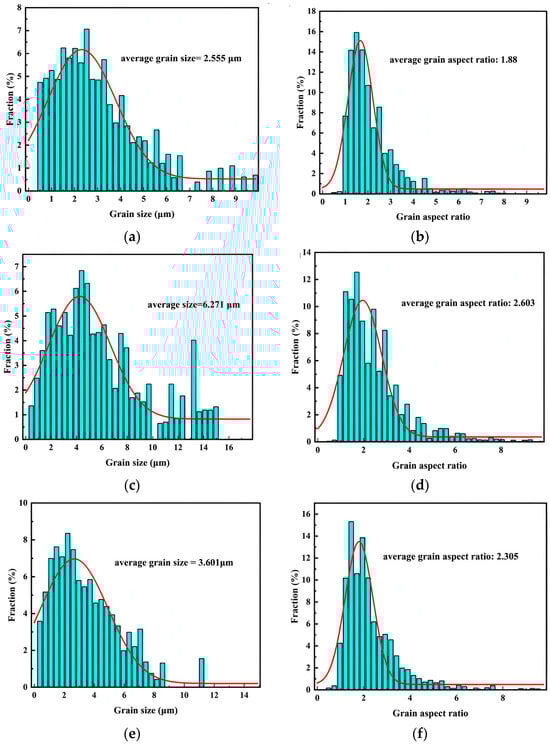
Figure 11.
Grain size distribution maps and grain aspect ratio distribution maps of Q125 after different loading cycles: (a,b) original state, (c,d) 40 T-T cycles, (e,f) 40 T-C cycles. (The red lines are auxiliary lines.)
Since the yield strength of the material has an inverse relationship with the grain size, described in the Hall-–Petch formula, the yield strength of Q125 gradually decreases as grain size increases, and elongated and deformed grains indicate that plastic deformation accumulation occurred in the Q125 casing material during the TMCA cycles.
4.2. Evolution of Grain Boundary Distribution Characteristics
The grain boundaries distribution of the Q125 casing material after different loading cycles are shown in Figure 12a–c. Grain boundaries with misorientation angles between 2 and 15° are defined as low-angle grain boundaries (indicated by red lines), while those with misorientation angles between 15 and 60° are defined as high-angle grain boundaries (indicated by black lines), and an in-grain misorientation axis (IGMA) proportion of 50~63°of the Q125 material (outline with red dotted line) under different loading cycles was calculated, as shown in Figure 13d–f. Before and after the test, the Q125 exhibited high-angle grain boundary characteristics (50~63°). The Taylor axes of these high-angle grain boundaries were mostly concentrated around <111>~<110>. However, the original direction of the Taylor axes of the high-angle grain boundaries was more scattered, while after different loading cycles, it became more concentrated. This indicates that under alternating loads, the grains rotated, making the grain boundary orientation more uniform. Figure 13 shows the proportion of coincidence site lattice (CSL) boundary fractions of Q125 after different loading cycles. It is evident that with an increase in the number of TMCA cycles, the more high-energy grain boundaries transformed into low-energy CSL grain boundaries, and the increase in CSL grain boundaries after 40 T-T cycles is greater than after 40 T-C cycles. These low-energy CSL grain boundaries reduce the pinning effect of dislocations at the grain boundaries and lower the plastic deformation resistance of the material, thereby resulting in a slight decrease in strength.
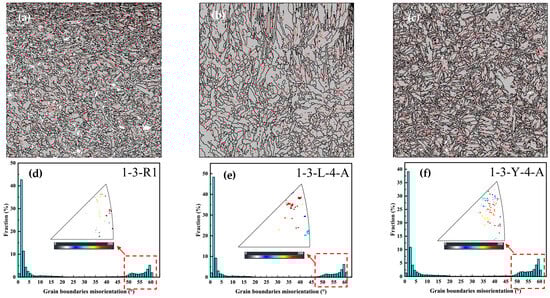
Figure 12.
Grain boundary distribution maps of Q125 after different loading cycles: (a,d) 0 cycles, (b,e) 40 T-T cycles, (c,f) 40 T-C cycles.
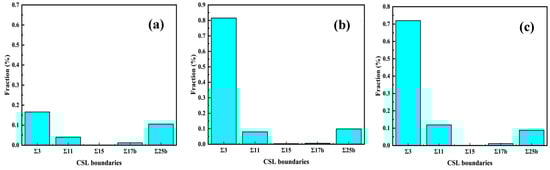
Figure 13.
CSL boundary proportion of Q125 after different loading cycles: (a) 0 cycles, (b) 40 T-T cycles, (c) 40 T-C cycles.
4.3. Evolution of Dislocation Density and Block Width
The geometric necessary dislocations (GNDs) were calculated based on the local orientation difference date. The local misorientation of every single point was determined by the 24 surrounding points. The general grain boundary misorientation limit of the GND was defined as 3°, and any misorientation greater than 3° was excluded. According to Formula (4), we extrapolated the GND density information:
where ρGND is the GND density, θ represents the local misorientation, b is Burger’s vector (0.25 nm), and µ is the unit length (100 nm) of the point. The GND distribution of the Q125 casing material after different loading cycles is shown in Figure 14a,c,e. And, the average GNDs after 0 cycles, 40 T-T cycles, and 40 T-C cycles were 3.1 × 10¹⁴ m−2, 2.37 × 10¹⁴ m−2, and 1.874 × 10¹⁴ m−2 respectively, as shown in Figure 14b,d,f. GND can be approximately considered as dislocations, and it is indicated that the dislocation density decreases with an increase in the number of cycles.
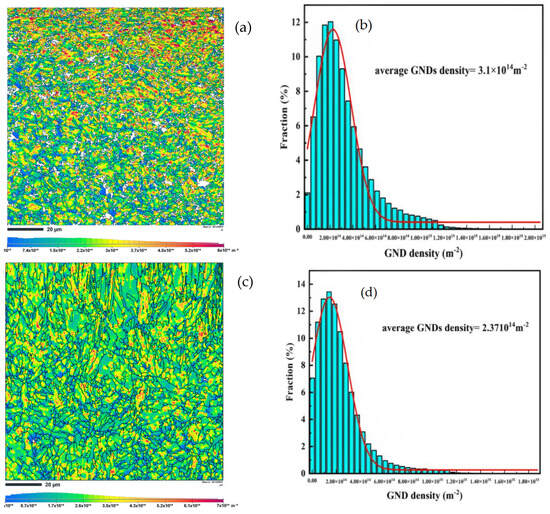
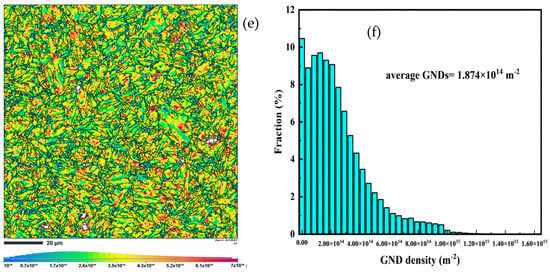
Figure 14.
GND distribution maps of Q125 material after different loading cycles: (a,b) 0 cycles, (c,d) 40 T-T cycles, (e,f) 40 T-C cycles. (The red lines are auxiliary lines.).
The dislocation distribution of the Q125 casing material after different loading cycles was analyzed by TEM, as shown in Figure 14. The dislocation density decreased with the number of loading cycles, and the laths retaining the martensitic phase in the Q125 casing material gradually widened, as shown in Figure 15a–c. However, Figure 14d–f show that the dislocation density near the grain boundaries is significantly higher than that within the grains.
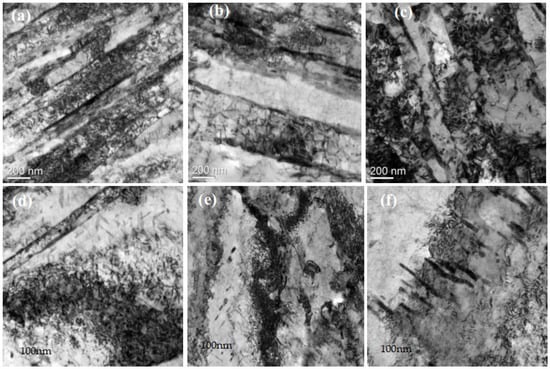
Figure 15.
Dislocation distribution of Q125 after different loading cycles: (a,d) 0 cycles, (b,e) 40 T-T cycles, (c,f) 40 T-C cycles.
As the number of TMCA cycles increased, dislocations glided and migrated toward grain boundaries, and ultimately piled up at the grain boundaries, resulting in a reduction in dislocation density within the grains. Under external load conditions, the non-uniformity of dislocation density distribution is prone to cause local deformation within the grains, thereby leading to a yield strength decrease. Meanwhile, due to the dislocation entanglement on the grain boundaries causing local stress concentration and nucleation of voids or cracks, the ultimate strength of the material also decreased.
5. Conclusions
- The TMCA loads significantly leads to reductions in yield strength and ultimate strength of the P110 and Q125 casing materials. The yield strength and ultimate strength variations show an initial rapid decrease, followed by a slower declining trend, and the overall variation curve presents an exponential decreasing distribution pattern. A yield strength prediction model of Q125 casing under different cycles of TMCA load was established.
- The reduction in casing yield strength after different thermal–mechanical coupling alternating tests exhibits a significant mutual interaction mechanism of low cycle fatigue with thermal cycling aging.
- As the number of TMCA cycles increases, the size and aspect ratio of grains and the CSL grain boundary proportion of the Q125 casing material increase, the ferrite laths gradually widen, and the dislocation density decreases. The dislocation density is significantly more distributed at grain boundaries than within the grains.
- The microstructure evolution fundamentally weakens the fine grain strengthening, grain boundary strengthening, and dislocation strengthening of the casing material, ultimately resulting in a strength reduction.
Author Contributions
C.L., H.Z., S.Y. and J.W. conceived and designed the experiments; C.L., L.S. and H.Z. performed the experiments; C.L., L.S., F.L. and L.H. analyzed the data; Y.Q. and B.C. contributed the analysis tools; C.L. wrote the paper. All authors have read and agreed to the published version of the manuscript.
Funding
This research was funded by the National Key R&D Program of China grant number 2023YFB3711700, and Scientific Research and Technology Development of CNPC grant number 2023ZZ11 and 2021ZG14.
Data Availability Statement
The data presented in this study are available on request from the corresponding author.
Conflicts of Interest
Yue Qi and Baishan Chen were employed by the company Drilling Engineering Technology Research Institute of Daqing Drilling Engineering Company. The remaining authors declare that the research was conducted in the absence of any commercial or financial relationships that could be construed as a potential conflict of interest.
References
- Zhou, K.; Hou, J.; Yu, B.; Du, Q.; Liu, Y. Production analysis of sequential multi-well cyclic steam stimulation in heterogeneous heavy oil reservoir. Int. J. Oil Gas Coal Technol. 2017, 16, 311–328. [Google Scholar] [CrossRef]
- Han, L.; Wang, H.; Wang, J.; Xie, B.; Tian, Z.; Wu, X. Strain-Based Casing Design for Cyclic-Steam-Stimulation Wells. SPE Prod. Oper. 2017, 33, 409–418. [Google Scholar] [CrossRef]
- Maruyama, K.; Tsuru, E.; Ogasawara, M.; Inoue, Y.; Peters, E.J. An experimental study of casing performance under thermal cycling conditions. SPE Drill. Eng. 1990, 5, 156–164. [Google Scholar] [CrossRef]
- Hsu, S.-Y.; Searles, K.H.; Liang, Y.; Wang, L.; Dale, B.A.; Grueschow, E.R.; Spuskanyuk, A.; Templeton, E.; Smith, R.J.; Lemoing, D.R. Casing Integrity Study for Heavy-Oil Production in Cold Lake. In Proceedings of the SPE Annual Technical Conference and Exhibition, Florence, Italy, 19–22 September 2010; p. 134329. [Google Scholar]
- Plácido, J.C.; Ademar, P., Jr.; Paulo, L.A.; Pasqualino, I.P.; Estefen, S.F. Stress-Analysis of Casing String Submitted to Cyclic Steam Injection. In Proceedings of the Latin American and Caribbean Petroleum Engineering Conference, Rio de Janeiro, Brazil, 30 August–3 September 1997; p. 38978. [Google Scholar]
- Kaiser, T.M.V. Post-Yield Material Characterization for Thermal Well Design. In Proceedings of the SPE International Thermal Operations and Heavy Oil Symposium, Calgary, Canada, 1–3 November 2005; p. 97730. [Google Scholar]
- Quan, G. Casing Damage Mechanism of Thermal Recovery Wells. Ph.D. Thesis, Southwest Petroleum University, Chengdu, China, 2017. [Google Scholar]
- Li, J.L.; Yang, C.H.; Shi, X.L.; Xu, W.J.; Li, Y.P.; Daemen, J.J.K. Construction modeling and shape prediction of horizontal salt caverns for gas/oil storage in bedded salt. J. Pet. Sci. Eng. 2020, 190, 107058. [Google Scholar] [CrossRef]
- Li, J.L.; Shi, X.L.; Zhang, S. Construction modeling and parameter optimization of multi-step horizontal energy storage salt caverns. Energy 2020, 203, 117840. [Google Scholar] [CrossRef]
- Yan, H.; Yan, Y.; Yan, X. A study on nonlinear vibration characteristics of gas storage well string based on the wavelet multiscale transform. J. Vib. Shock 2019, 38, 51–60. [Google Scholar]
- Liu, H.; Liu, W.; Wang, S.; Dong, K. Research status and development trend of mechanisms of casing failure caused by volume fracturing in horizontal wells. J. China Univ. Pet. 2020, 44, 53–62. [Google Scholar]
- Xi, Y.; Li, J.; Liu, G.; Liu, G.; Tao, Q.; Lian, W. Integrity analysis of cement ring during fracturing of horizontal shale gas wells. Bull. Pet. Sci. 2019, 4, 57–68. [Google Scholar]
- Xi, Y.; Li, J.; Liu, G.; Zeng, Y.; Li, J. Review of casing deformation in horizontal shale gas wells during multistage fracturing. Spec. Reserv. 2019, 26, 1–6. [Google Scholar]
- Xi, Y.; Liu, G.; Li, J.; Cha, C.; Lian, W.; Li, G. Study on the transient change of casing stress under the action of force thermal coupling. Pet. Mach. 2017, 45, 8–12. [Google Scholar]
- Fan, M. Study on Casing Deformation and Cementring Seal Failure Mechanism of SRV Fracturing in Shale Gas Wells. Ph.D. Thesis, China University of Petroleum, Beijing, China, 2018. [Google Scholar]
- Fan, M.; Li, J.; Liu, G.; Chen, X. Research on casing damage mechanism during volume fracturing of horizontal shale gas wells. Pet. Mach. 2018, 46, 82–87. [Google Scholar]
- Li, B. Research on Casing Damage Mechanism of Horizontal Shale Gas Wells. Ph.D. Thesis, Southwest Petroleum University, Chengdu, China, 2018. [Google Scholar]
- Yin, H.; Zhang, Y. A quantitative evaluation method for the effect of temperature on casing collapsing strength—A case study of large-scale hydraulic fracturing in shale gas horizontal wells. Nat. Gas Ind. 2016, 36, 73–77. [Google Scholar]
- Lu, C.; Yang, S.; Wang, J.; Han, L.; Zhao, X.; Qi, Y.; Zhang, H. Experimental Study on Yield Strength Variation Law of Casing Materials under Alternating Thermal-mechanical Coupling. Processes 2024, 12, 708. [Google Scholar] [CrossRef]
- Zhao, L.; Zhang, L.; Song, K.; Xu, L.; Han, Y.; Hao, K. Research on Creep-fatigue Cyclic Deformation of New Martensitic Heat Resistant material. J. Mech. Eng. 2024, 60, 118–129. [Google Scholar]
- Zhao, L.; Xu, L.; Han, Y.; Jing, H.; Gao, Z. Modelling creep-fatigue behaviours using a modified combined kinematic and isotropic hardening model considering the damage accumulation. Int. J. Mech. Sci. 2019, 161, 105016. [Google Scholar] [CrossRef]
- Gu, P.; Wu, B.; Wu, X. Effect of lower limit temperature an thermo-mechanical fatigue behavior of 4Cr5Mo2V material. Heat Treat. Met. 2024, 49, 202–213. [Google Scholar]
- Ge, R. Microstructure and High-Temperature Creep Analysis of P92 Material. Ph.D. Thesis, Zhejiang University of Technology, Hangzhou, China, 2020. [Google Scholar]
- Yang, J.; Ma, H.; Wang, H.; Hu, Y.; Yang, K.; Zhou, X.; Wei, W. Residual Strength of P110H Casing Steel under High Temperature Service Condition. Hot Work. Technol. 2022, 51, 142–145. [Google Scholar]
Disclaimer/Publisher’s Note: The statements, opinions and data contained in all publications are solely those of the individual author(s) and contributor(s) and not of MDPI and/or the editor(s). MDPI and/or the editor(s) disclaim responsibility for any injury to people or property resulting from any ideas, methods, instructions or products referred to in the content. |
© 2025 by the authors. Licensee MDPI, Basel, Switzerland. This article is an open access article distributed under the terms and conditions of the Creative Commons Attribution (CC BY) license (https://creativecommons.org/licenses/by/4.0/).