Article

Operational Risk Assessment of Power Imbalance for Power Systems Considering Wind Power Ramping Events

1
State Key Laboratory of Power Transmission Equipment Technology, Chongqing University, Chongqing 400044, China
2
Chongqing Huizhi Energy Co., Ltd., Chongqing 400044, China
*
Author to whom correspondence should be addressed.
Processes 2025, 13(6), 1779; https://doi.org/10.3390/pr13061779
Submission received: 22 March 2025 / Revised: 17 May 2025 / Accepted: 25 May 2025 / Published: 4 June 2025
(This article belongs to the Section Energy Systems)

Abstract

:
Wind power ramping events refer to sustained unidirectional and large-magnitude fluctuations in wind power output over short durations, exhibiting distinct temporal characteristics and imposing significant impacts on power balance. To address the strong temporal dependency of wind power ramping events, a time-sequential outage model for conventional generators was derived and system operational states were sampled using non-sequential Monte Carlo simulation. Considering the frequency dynamics caused by active power imbalances, dynamic frequency security constraints were formulated. An optimal power flow model was developed to minimize wind curtailment and load shedding comprehensive losses, incorporating these dynamic frequency constraints. The optimal power flow model was employed to solve line power flows for sampled system states and compute comprehensive loss risk indices. Case studies on the IEEE RTS-79 system evaluated and compared operational risks across multiple scenarios, validating the effectiveness of the proposed methodology.

1. Introduction

Against a dual-carbon-policy background and with continuous improvement in wind power penetration in power grids, the randomness and volatility of wind power pose great challenges to the safe operation of a system [1,2]. Under extreme and adverse weather conditions, the active power output of wind farms can experience rapid and significant fluctuations within a short time frame, giving rise to high-risk wind power ramping events. These events can severely disrupt the active power balance of the power system, potentially leading to frequency instability, wind power curtailment, load shedding, and other operational incidents [3,4]. When coupled with failures of other components within the power system, such events may trigger cascading failures, ultimately resulting in large-scale blackouts, as exemplified by the February 2021 blackout in Texas, USA, caused by extreme cold weather. Investigating the operational risks posed by wind power ramping events is essential for understanding the potential impacts of extreme power fluctuations on system performance. Such studies contribute to enhancing the monitoring and mitigation strategies during high-risk periods and play a critical role in the assessment of power system reliability and the development of effective early-warning mechanisms.
Traditional risk assessment is grounded in conventional planning perspectives, typically employing annual or monthly time scales. It relies on reliability parameters such as average failure rates and repair rates derived from long-term statistical data [5], while load profiles and wind power output models are established based on extended historical datasets [6]. Traditional risk assessment predominantly utilizes fundamental metrics like loss-of-load probability [7] and expected demand not supplied [8]. In recent years, novel risk evaluation methodologies have emerged for power systems with large-scale wind integration, focusing on operational dispatch scenarios. These approaches adopt shorter time resolutions (minutes, hours, or days) to support short-term scheduling decisions and emphasize comprehensive risk factors including line overloading, expected load shedding, and wind curtailment during real-time operations [9,10]. Reference [11] accounted for both positive and negative fluctuations in wind power to calculate risk indices for loss of load and wind curtailment in the generation system. Reference [12] considered wind power prediction errors and load forecast errors, reflecting uncertainties in wind power and load, and calculated frequency exceedance risk and active power over limit risk indices for lines after wind power integration. Reference [13] used a comprehensive risk index to assess the short-term operational risk of a system under varying wind power penetration levels. Reference [14] redefined risk indices such as loss of load and voltage exceedance based on t conditional value-at-risk theory, evaluating risks caused by multiple wind power uncertainty scenarios. Reference [15] proposed an optimal power flow model considering the ramp rates of conventional units to calculate comprehensive economic loss risks resulting from wind power and load uncertainties.
However, the above references predominantly focused on conventional stochastic fluctuations in wind power when assessing system risks. Unlike stochastic wind power variations, ramp events exhibit strong temporal characteristics, manifesting as sustained unidirectional large-scale fluctuations in wind power over 30 min to 5 h [16,17]. Research on power system operational risk assessment under wind power ramp events remains in its nascent stage. References [18,19] investigated the temporal coupling relationships between wind power ramp events and conventional unit outages, analyzing the risks caused by insufficient system frequency response capability during such events. Reference [20] proposed a wind and photovoltaic ramp event prediction method based on meteorological zoning theory and evaluated system risks using cumulative prospect theory.
Existing studies on the operational risk assessment of power systems under wind power ramp events primarily focus on the static frequency response capability, with limited attention to the modeling and analysis of dynamic frequency response rates. As a result, the actual impact of ramp events on the system may be inadequately represented. Furthermore, the modeling of the temporal characteristics of ramp events remains insufficiently explored, often neglecting the influence of temporal correlations on the outage behavior of system components. In addition, current operational risk indicators are insufficient to comprehensively quantify the economic losses associated with wind power curtailment and load shedding caused by ramp events. To more accurately characterize the impact of wind power ramp events on power system operational risk, this paper proposes a novel risk assessment method that comprehensively considers temporal characteristics, dynamic frequency response behavior, and associated economic losses. The main contributions of this research are as follows.
(1)
A conventional generator outage model incorporating temporal correlations is developed, in which two key factors—the outage time and outage probability—are introduced. The temporal characteristics of generator outages are sampled using a non-sequential Monte Carlo method.
(2)
An operational risk index that accounts for the economic losses associated with both load shedding and wind power curtailment is proposed. Based on the index, an optimal power flow model is formulated with the objective of minimizing the total combined loss.
(3)
Based on the dynamic frequency response process of the power system, two types of dynamic frequency security constraints—the initial rate of change of frequency constraint and the maximum frequency deviation constraint—are derived and incorporated into the optimal power flow model.
The rest of the paper is structured as follows. In Section 2, the risk assessment principles for wind power ramp events are elucidated, encompassing the proposal of comprehensive loss risk indices, the establishment of a power system output state model, and the derivation of a time-sequential outage model for conventional generating units. In Section 3, an optimal power flow model is constructed to minimize wind curtailment and load shedding comprehensive losses, incorporating dynamic frequency security constraints. The detailed risk assessment process is described in Section 4. Section 5 describes a case study to validate the effectiveness of the proposed methodology. Section 6 concludes the paper and provides future research directions.

2. Operation Risk Assessment Principle of Wind Power Ramp Events

2.1. Operational Risk Assessment Indicators

The definition of power system operational risk is the comprehensive measurement of the probability and severity of uncertain factors in power system operation. These uncertain factors consist of two parts: system output states and system operating states. The mathematical expression can be formulated as:
R t = m n p ( E m t ) p ( C n t ) S ( E m t , C n t )
where R t is the risk value of the power system at time t. m is the index of the system operating state, n is the index of the system operating output state. E m t is the system operating state at time t, representing the combination of operational statuses of all components in the system at time t. p( E m t ) represents the probability of the system operating state occurring at time t. C n t indicates the system output state at time t, encompassing wind power output and load levels at time t. p( C n t ) denotes the probability of the system output state at time t. S( E m t , C n t ) quantifies the risk severity under the operating state and output state at time t, with distinct severity functions corresponding to different risk metrics. This research employs a comprehensive loss risk index Re to evaluate the operational risk of power systems under wind power ramping events. The corresponding severity function Se is formulated as:
S e = i = 1 N G a g , i P g , i P g i , 0 t + i = 1 N W b P c w , i + c i = 1 N D P c d , i
where ag,i is the output adjustment cost coefficient for conventional generators at node i, b and c represent wind curtailment cost coefficient and load shedding cost coefficient. NG, NW, and ND represent total number of nodes connected to conventional generators, wind turbines, and loads, respectively.   P g i , 0 t is the scheduled output of conventional unit i at time t. P g , i is the post-frequency-response output of the conventional unit at node i under a specific system state. Pcd,i is the load shedding amount at node i. P c w , i is the wind curtailment amount at node i. The comprehensive loss risk index integrates economic losses from wind curtailment and load shedding, along with the adjustment costs of conventional unit outputs. This index holistically quantifies the impacts of wind power ramping events on power system stability and operational economics.

2.2. Probabilistic Modeling of Wind Power and Load Level

The power system output state model comprises a wind power output model and a load level model. A wind power ramp event is characterized by unidirectional large-scale variations in wind power output over short time intervals. In the wind power output model considering ramp events, minor stochastic fluctuations during the ramp process can be neglected, with the assumption that wind farm output aligns with forecast values both before and after the ramp event. The wind power output model is established as follows:
P W t = t P W T s ± P amp t T s T d , T s t T s + T r P W , 0 t + Δ P W , err t ,   otherwise
where Ts is the start time of the ramping events. Td is the duration of the ramping events. Pamp is the magnitude of the ramping events. The “+” sign indicates positive ramping and the “−” sign negative ramping. P W t and P W , 0 t represent actual and forecast wind power output at time t. P W   T s is the forecast wind power at the ramping start time.   Δ P W , err t is the forecast error of wind power at time t under non-ramping conditions. In engineering applications, the prediction of wind power ramp events is typically provided by a high-risk wind ramp event forecasting system and represented in the form of probability distributions. Let the three characteristic variables of a wind power ramp event—start time Ts, duration Td, and ramp magnitude Pamp—follow the probability distributions p(Ts), p(Td), and p(Pamp), respectively. In this study, these variables are assumed to be mutually independent. The start time Ts is assumed to follow a uniform distribution over the entire assessment period, while the duration Td and ramp magnitude Pamp are assumed to follow normal distributions, with the parameters of their probability density functions drawn from [16]. During the simulation of wind power ramp events, sampling is performed using the Monte Carlo method based on their respective probability distributions.
The load level model can be expressed as the sum of the forecast load and the forecast error, as follows:
P d , i t = P d i , 0 t + Δ P d i , err t
where P d , i t and P d i , 0 t represent the actual active load and forecast load at node I at time t. Δ P d i , err t is the load forecast error. The wind power forecast error Δ P W , err t and the load forecast error Δ P d i , err t under non-ramping conditions, both follow normal distributions and can be generated via Monte Carlo sampling.

2.3. Conventional Unit Outage Model Considering Time-Series Characteristics

The operational state model of a power system is defined as the set of different operating states of all system components. This research focuses on conventional generating units. The units adopt a two-state outage model, defined as operating and failed states. The risk assessment period is set to T = 24 h with a time resolution of Δt = 1 h, resulting in 24 assessment intervals. Since the assessment period is significantly shorter than the repair time of conventional units, they are treated as non-repairable components within this period. In day-ahead generation scheduling, conventional units may undergo multiple planned startups or shutdowns. Consequently, their real-time outage probability depends not only on time but also on the startup success rate. The mathematical expression for the outage probability of a single conventional unit at node i at time t is as follows [18]:
p g , i t = 1 p g , i , u p e λ g , i ( t   t g , i , o n )     t g , i , o n t t g , i , o f f
where p g , i t is the probability of the conventional unit at node i being in the outage state at time t. pg,i,up and λg,i represent the startup success rate and failure rate of the unit. tg,i is the cumulative operating duration of the unit up to time t. tg,i,on and tg,i,off represent the scheduled startup and outage times of the unit.
However, Equation (5) does not distinguish the outage times of conventional units. Its value represents not the probability of a unit failing at time t, but the cumulative sum of outage probabilities at all prior committed time intervals up to t. Wind power ramping events exhibit strong time-series dependencies. When a negative ramping event coincides with unit outages, it can cause significant power imbalance, severely impacting the dynamic frequency stability of the power system. Therefore, risk assessment under wind power ramping events requires the outage model of conventional units to incorporate time-series characteristics—specifically, both outage timing and outage probabilities. The mathematical expressions for these two features are proposed as follows:
p g , i ( t i ) = 1 t g , i , o f f - t g , i , o n t g , i , o n t i t g , i , o f f
p g , i ( t ) = T ( 1 p g , i , u p ) Δ t t i = t g , i , o n λ g , i p g , i , u p T t g , i , o n < t i t g , i , o f f
p ( u g , i ) = ( t g , i , o f f t g , i , o n ) Δ t T u g , i ( t g , i , o n ) = 1
where ti is the possible outage timing of conventional units.   p g , i ( t i ) is the probability that an outage event occurs at the time ti after the unit is committed. p g , i ( t ) is the outage probability of unit i at time t. ug,i(tg,i,on) represents the binary operational status indicator of unit i, where ug,i(tg,i,on) = 1 denotes the unit is scheduled to be online at tg,i,on.
The simulation process for conventional units considering time-series characteristics is as follows. First, sample ug,i(tg,i,on). If ug,i(tg,i,on) = 1, sample the outage timing ti based on p g , i ( t i ) , then sample the operational status ug,i(ti) at ti using p g , i ( t ) . For units that remain operational without status changes (always online), skip sampling ug,i(tg,i,on). Directly sample ti and ug,i(ti) using predefined parameters tg,i,on = 1 and tg,i,off = 24.
The rationale for constructing and sampling outage timing is as follows. First, the construction of outage timing: when a unit involves commitment and decommitment, outages can only occur during its committed period; therefore, the operational status ug,i(tg,i,on) must be sampled first to determine whether the unit is online. Within the committed period, outages are assumed to be equiprobable at all time points. Since the committed period is typically short, the probability of multiple outages occurring within this period is negligible, meaning at most one outage event can occur. Consequently, the probability distribution of the unit’s outage timing is defined as shown in Equation (10). Second, the construction of outage probability: when the number of samples N is sufficiently large, the sum of outage samples during tg,i,on to ti based on the existing real-time outage probability Formula (5) is N i = N p g , i ( t i )   = N ( 1     p g , i , u p e λ g , i ( t i   -   t g , i , o n ) Δ t ) . If the sum of outage samples during tg,i,on to ti calculated by the proposed outage probability formula equals Ni, it demonstrates the validity of the proposed construction.
Outage samples at tg,i,on cased on the proposed model are as follows:
N i , o n = N p ( u g , i ) p g , i ( t i ) p g , i ( t g , i , o n ) = N ( 1 p g , i , u p )
If the model is properly constructed, the sum of outage samples in the remaining period tg,i,on+1 to ti should satisfy:
N i , 2 = N i N i , 1 = N × p g , i , u p × ( 1 e λ g , i ( t i t g , i , o n ) Δ t )
Since the operational risk assessment period T is very short, the probability of unit outages during this period is extremely small, and ( t i t g , i , o n ) Δ t     T . 1     e λ g , i ( t i   t g , i , o n ) Δ t can be approximated by retaining only the first-order term of its Taylor series expansion, as:
N i , 2 N × p g , i , u p λ g , i ( t i t g , i , o n ) Δ t = N p g , i , u p Δ t t = t g , i , o n + 1 t i λ g , i = t = t g , i , o n + 1 t i N × p g , i , u p λ g , i Δ t = t = t g , i , o n + 1 t i N × p g , i , u p λ g , i Δ t = t = t g , i , o n + 1 t i N p ( u g , i ) p g , i ( t ) p g , i ( t ) = t = t g , i , o n + 1 t i N ( t )
Equation (11) shows that the sum of outage samples from tg,i,on+1 to ti and the outage samples at tg,i,on, calculated using the proposed outage probability formula, equals Ni. It fully demonstrates the validity of the model.

3. Optimal Power Flow Model Considering Dynamic Frequency Constraints

3.1. Frequency Dynamic Response Process and Dynamic Frequency Security Constraints

Uncertainties such as wind power ramping events and conventional unit outages can cause significant fluctuations in system active power output, leading to power imbalance and subsequent dynamic frequency deviations. Under a specific system state ( E m t , C n t ) at time t, the frequency dynamic response process—considering load shedding and wind curtailment—can be modeled using a first-order swing equation:
2 H s y s d f ( t ) d t = P F R ( t ) + Δ P i m D Δ f ( t )
Δ P i m = i = 1 N G u g , i P g i , 0 t + ( i = 1 N W P w , i i = 1 N W P c w , i ) ( i = 1 N D P d , i i = 1 N D P c d , i )
H s y s = i = 1 N g u g , i H g P g , i , max f 0
where Hsys is the system inertia. Δf(t) is the frequency deviation, defined as Δf(t) = f(t) − f0, where f0 = 50 Hz is the rated frequency. PFR(t) is the primary frequency regulation output adjustment of conventional units. ΔPim is the active power imbalance under the given system state. D is the load damping coefficient. i = 1 N G u g , i P g i , 0 t is the total pre-primary frequency regulation output of conventional units in the system state, where u g , i indicates whether the unit is in a fault state. i = 1 N W P w , i is the total wind power output under the given system state. i = 1 N W P c w , i is the total load demand under the given system state. i = 1 N W P c w , i is the total wind curtailment in the system. i = 1 N D P d , i is the total load shedding in the system. Hg is the inertia constant of the generator. Pg,i,max is the maximum output limit of unit i.
Conventional generating units initiate primary frequency response only when the system frequency deviation exceeds the frequency deadband ΔfDB. Let tDB denote the time interval from the onset of power imbalance to the moment the frequency reaches the deadband. The time-dependent power adjustment of units during the primary frequency response phase can be represented as a piecewise linear function, formulated as follows:
P F R ( t ) = 0   t t D B C s y s ( t t D B ) t D B t t D B + T D
C s y s = i = 1 N g χ g , i t c g , i
where Csys is the system-wide primary frequency regulation response rate. χ g , i t is the binary indicator for whether conventional unit i participates in primary frequency regulation response at time t. cg,i is the governor’s maximum ramp rate of unit i. TD is the system’s primary frequency regulation response time.
From the frequency dynamic response process, two key indicators characterizing dynamic frequency security can be extracted: the rate of change of frequency RoCoF and the maximum frequency deviation Δfnadir. To ensure system security, the following constraints must be satisfied:
(1)
RoCoF
The rate of change of frequency RoCoF is defined as the frequency derivative at the initial moment t = 0+ following a disturbance. To prevent excessive frequency decline rates, the following constraint must be satisfied:
R oCoF = d f ( t ) d t t = 0 + | = Δ P i m 2 H s y s R oCoF , max
where RoCoF,max is the maximum allowable initial rate of change of frequency for the system. This constraint can be translated into a bound on the active power imbalance ΔPim, expressed as:
2 H s y s R oCoF , max Δ P i m 2 H s y s R oCoF , max
(2)
Δfnadir
The maximum frequency deviation Δfnadir occurs at the frequency nadir fnadir during the primary frequency response phase, where the frequency derivative satisfies df(t)/dt = 0. By solving Equation (16) under this condition, the expression for Δfnadir and its security constraint can be derived:
Δ f nadir = Δ f D B + Δ P i m D + 2 C s y s H s y s D 2 T d ln ( 2 C s y s H s y s D T d Δ P i m + 2 C s y s H s y s ) Δ f T , max
where ΔfT,max is the system’s maximum allowable dynamic frequency deviation. This constraint can be translated into a bound on the active power imbalance ΔPim, expressed as:
Δ P i m D + 2 C s y s H s y s D 2 T d ln ( 2 C s y s H s y s D T d Δ P i m + 2 C s y s H s y s ) Δ f T , max Δ f D B
The inequality is nonlinear and cannot be directly applied to optimal power flow models. To enable integration into linear or convex optimization frameworks, it must first be linearized. The left-hand side of the inequality can be expressed as:
f ( Δ P i m ) = Δ P i m D 2 C s y s H s y s D 2 T d ln ( 1 + D T d Δ P i m 2 C s y s H s y s )
Since 2 C s y s H s y s     D T d Δ P i m , the logarithmic term ln ( 1 + D T d Δ P i m 2 C s y s H s y s ) can be approximated using a second-order Taylor series expansion, yielding:
f ( Δ P i m ) Δ P i m D 2 C s y s H s y s D 2 T d ( D T d Δ P i m 2 C s y s H s y s 1 2 ( D T d Δ P i m 2 C s y s H s y s ) 2 ) = T d Δ P i m 2 4 C s y s H s y s
Therefore, the original inequality can be simplified to:
T d Δ P i m 2 4 C s y s H s y s Δ f T , max Δ f D B
Consequently, the linearized constraint on active power imbalance ΔPim can be derived as:
2 C s y s H s y s ( Δ f T , max Δ f D B ) T d Δ P i m 2 C s y s H s y s ( Δ f T , max Δ f D B ) T d

3.2. Optimal Power Flow Model

The primary objective of power systems is to ensure uninterrupted power supply. Consequently, risk assessments traditionally employ optimal power flow models that prioritize minimizing load shedding. However, under dual carbon goals, enhancing wind energy utilization and reducing wind curtailment losses have become equally critical. To address this, this research proposes an optimal power flow model that minimizes comprehensive losses from conventional unit output adjustments, load shedding, and wind curtailment, while integrating line power flow constraints and dynamic frequency security constraints to ensure operational stability. The proposed optimal power flow model is formulated as follows.
  • Objective function
min ( t = 1 24 i = 1 N G a g , i P g , i t P g i , 0 t + i = 1 N W b P c w , i t + c i = 1 N D P c d , i t )
Here, P c d , i t is the load shedding amount at node i and time t. P c w , i t is the wind curtailment amount at node i and time t. Given the 1 h assessment interval, the power at time t and the corresponding energy are numerically equivalent. Therefore, i = 1 N G a g , i P g , i t P g i , 0 t represents the output adjustment cost of conventional units participating in the frequency response process. i = 1 N W b P c w , i t represents the wind curtailment cost. c i = 1 N D P c d , i t represents the load shedding cost. The formulation aims to minimize the comprehensive losses over the entire assessment period.
2.
Constraint condition
(1) The node power balance constraints are:
P g , i t + P w , i t P c w , i t + l L i + P l t l L i P l t = P d , i t P c d , i t i , t
where P l t is the active power transmitted on line l at time t. l L i + P l t is the sum of active power transmitted by all lines with node i as the sending end at time t. l L i - P l t is the sum of active power transmitted by all lines with node i as the receiving end at time t.
(2) The conventional generator output constraints are:
P g , i , min P g , i t P g , i , max i , t
where Pg,i,max and Pg,i,min represent the upper and lower limits of the active power output of the conventional unit at node i.
(3) The transmission line capacity constraints are:
P l , max P l t P l , max l , t
where Pl,max is the maximum allowable active power transmission capacity of line l.
(4) Load shedding constraints:
0 P c d , i t P d , i t i , t
(5) Wind power curtailment constraints:
0 P c w , i t P w , i t i , t
(6) Dynamic frequency constraints:
Equations (18) and (24) proposed in Section 3.1.

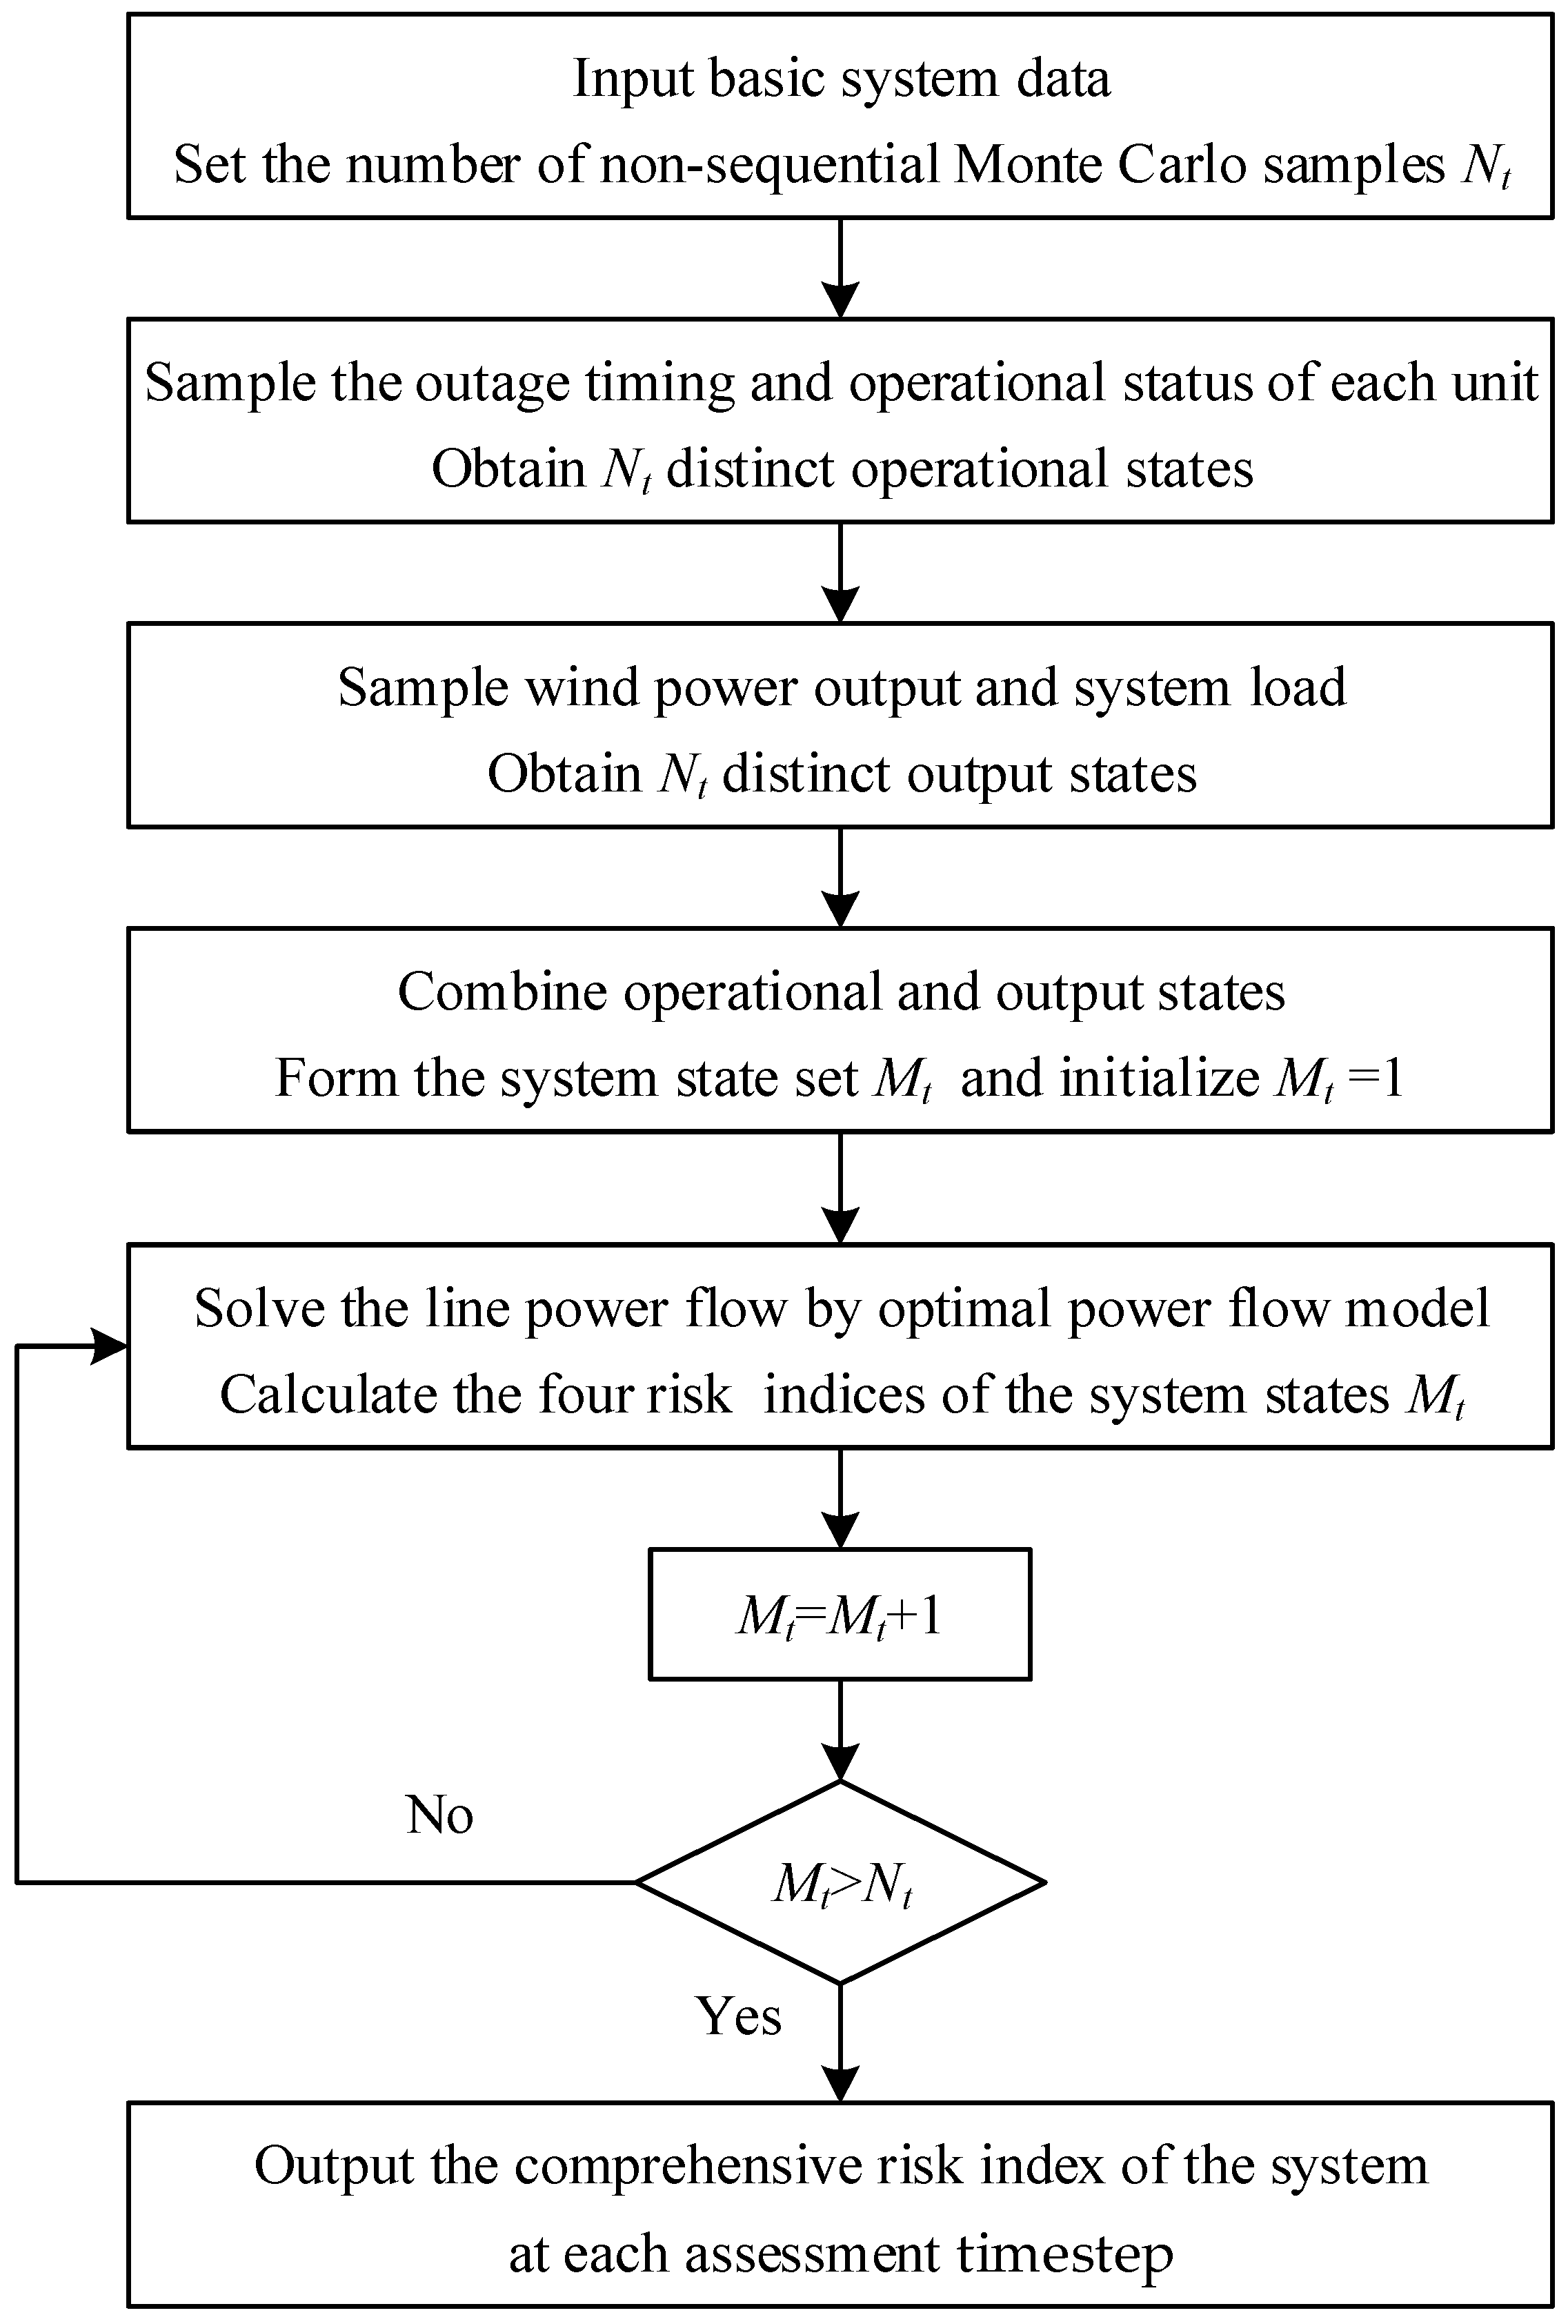
4. Process of Operational Risk Assessment for Power Systems Under Wind Power Ramping Events

This research employs a non-sequential Monte Carlo method to sample system operational states and power output conditions. An optimal power flow model is utilized to calculate operational risk indices. The risk assessment workflow is illustrated in Figure 1.
(1)
Input basic system data, including conventional unit generation schedules, wind power, and load day-ahead forecast outputs; set the number of non-sequential Monte Carlo samples Nt.
(2)
Perform non-sequential Monte Carlo sampling. Sample the outage timing and operational status of each unit based on the time-series outage model of conventional units, obtaining Nt distinct operational states throughout the entire assessment period.
(3)
Simultaneously, sample wind power output using ramping event characterization parameters and forecast errors during non-ramping periods, along with system load forecast errors, yielding Nt distinct output states.
(4)
Combine operational and output states to form system states for the entire assessment period, assign a system state index Mt, and initialize Mt = 1.
(5)
Solve the line power flow, load shedding amount, and wind curtailment for system state Mt using the optimal power flow model. Substitute these results into the operational risk index severity formula to calculate the four operational risk index values at each time step under scenario Mt.
(6)
Increment Mt = Mt + 1, compare Mt with Nt. If Mt > Nt, output the comprehensive risk index of the system at each assessment time step; otherwise, return to Step 5.

5. Case Study

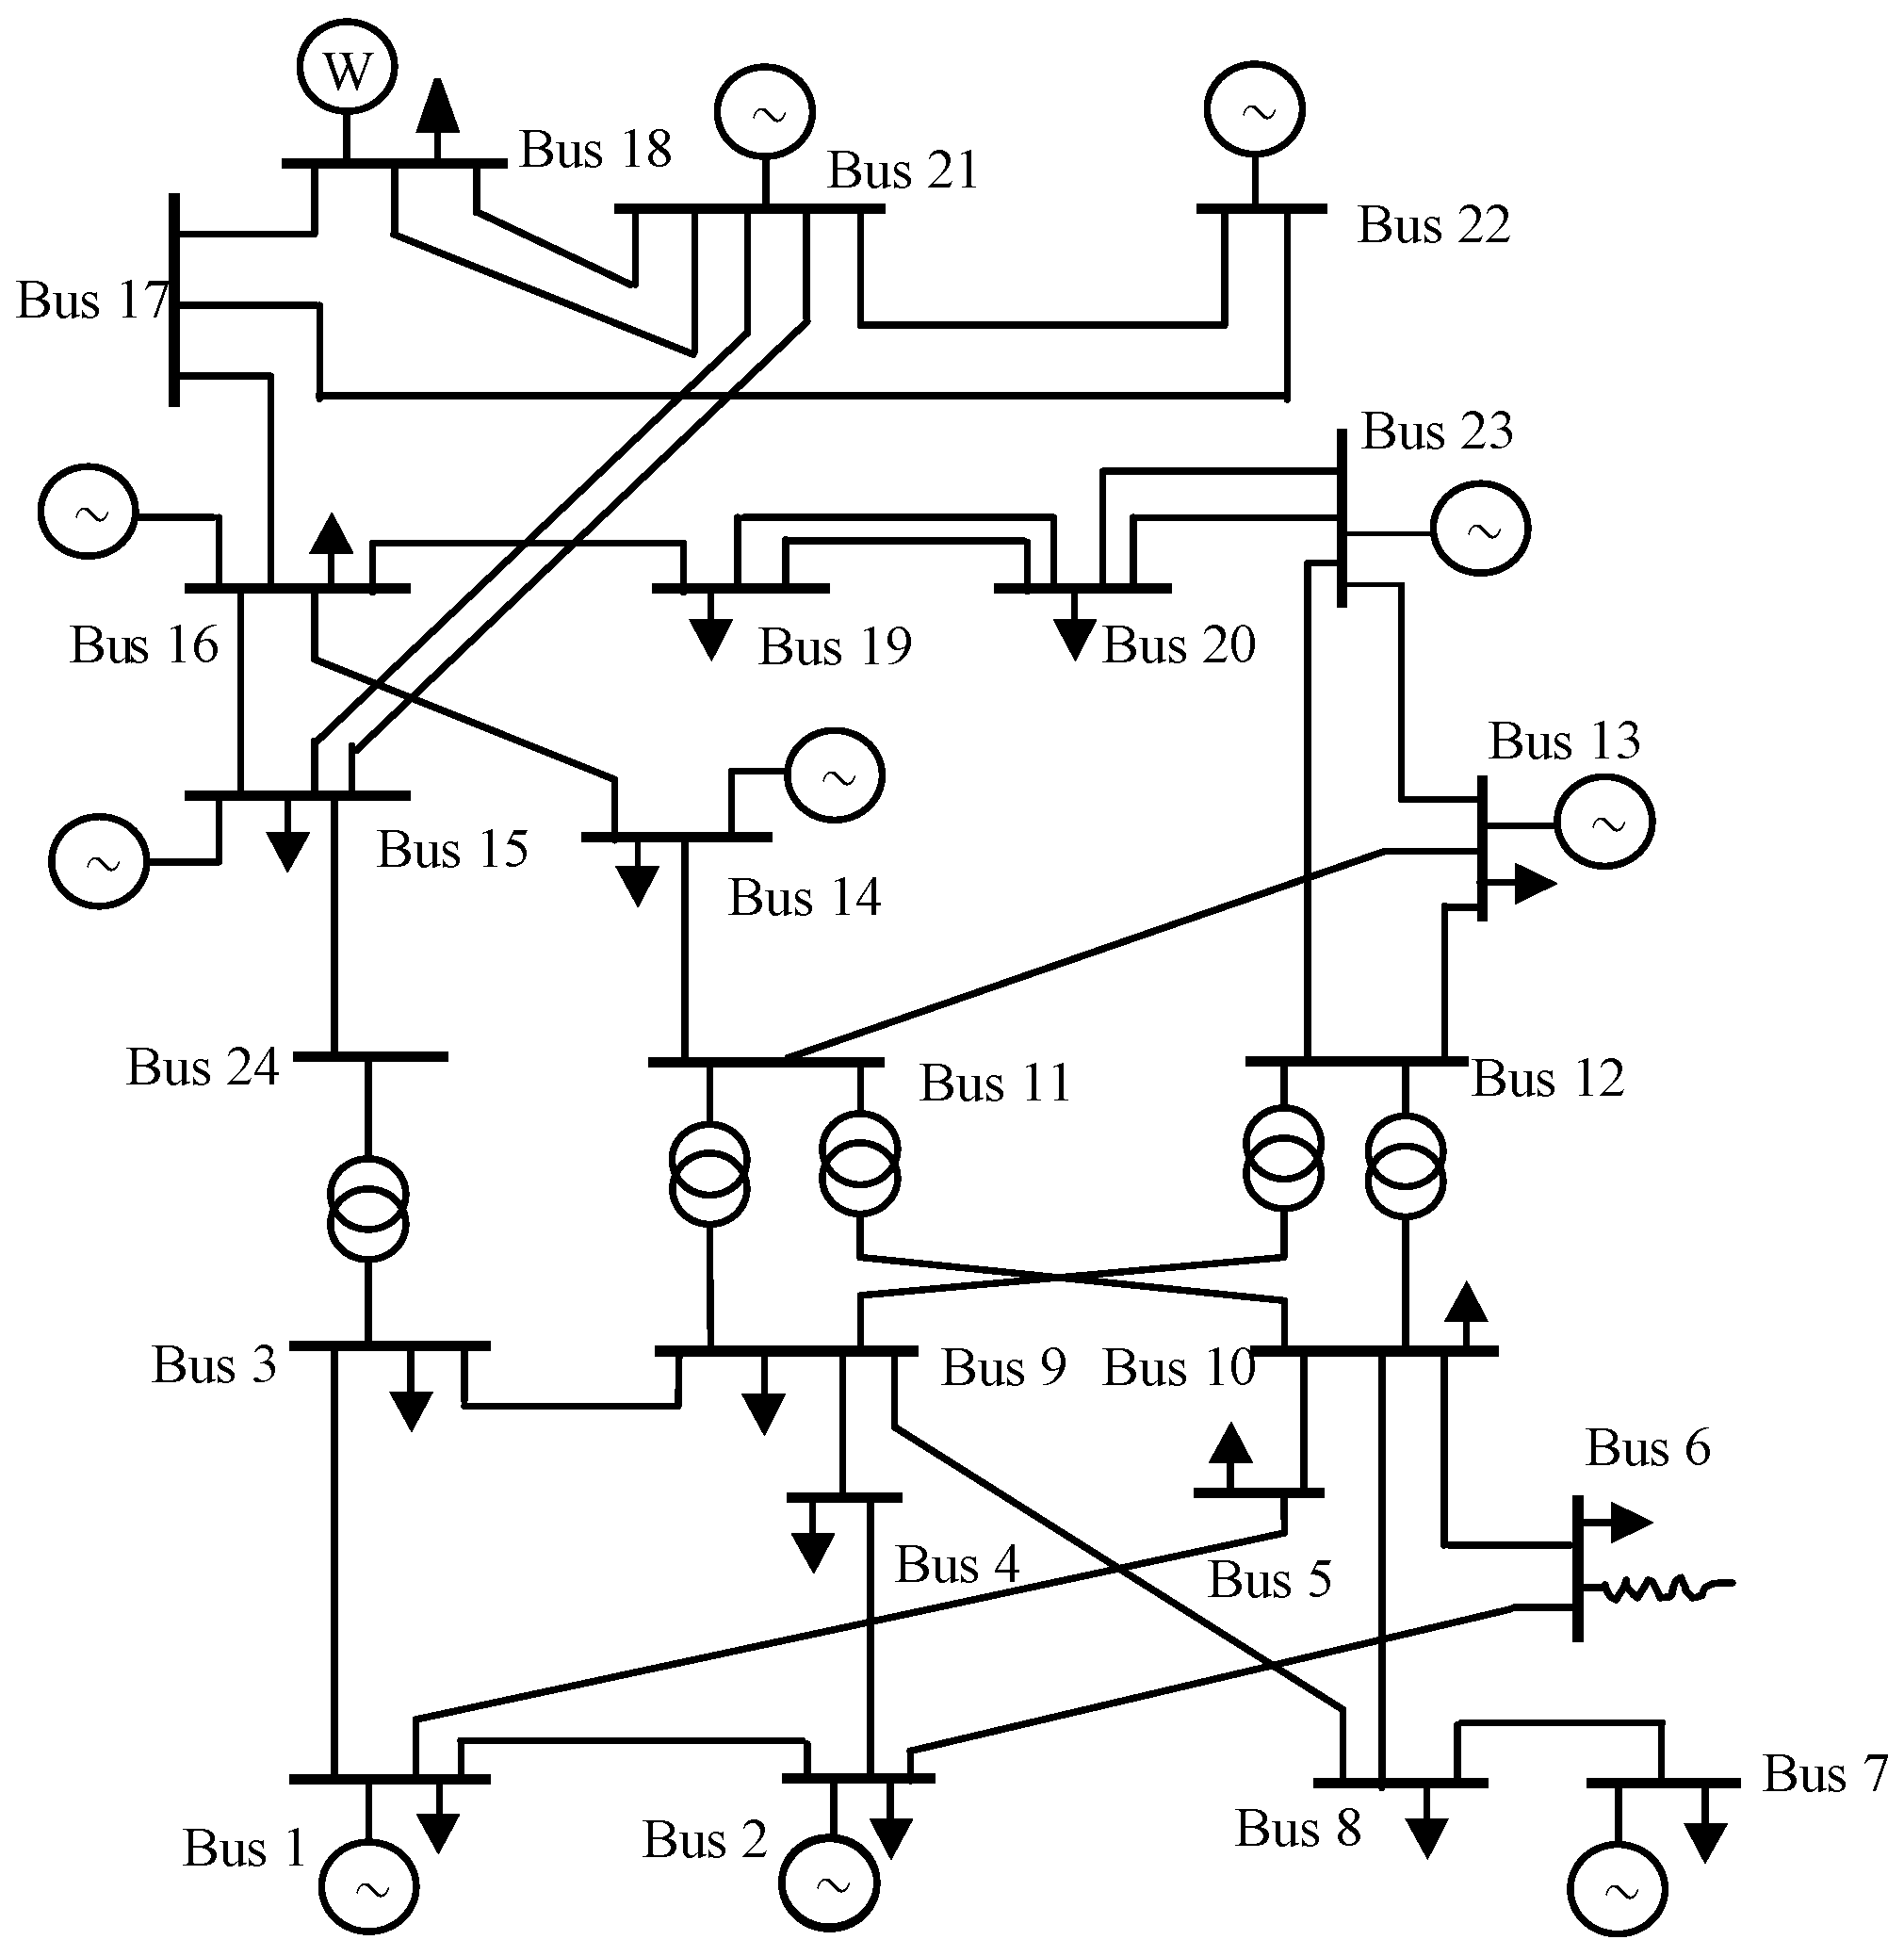
5.1. Parameter Settings

The simulation program was developed on the MATLAB R2024b platform, with Gurobi 10.0.3 employed to solve the optimal power flow problem. To validate the proposed model, the IEEE RTS-79 test system was adopted, and its structure is illustrated in Figure 2. Node 18 in the original system was replaced with a wind farm with a total installed capacity of 400 MW. The load data and daily generation schedule for the IEEE RTS79 system followed [18], and the governor ramp rate parameters for conventional units were adopted from [20]. Only negative wind power ramping events were considered, with their start time Ts following a uniform distribution within 0–24 h. Duration and magnitude data followed [16]. Standard deviations of wind power and load forecast errors under non-ramping conditions were set at 5% and 1%, respectively. The parameters for the dynamic frequency regulation process were configured as follows: Hg = 5 s, ΔfDB = 15 mHz, ΔfT,max = 0.8 Hz, TD = 25 s, RoCoF,max = 0.25 Hz/s. According to the electricity price in China, the wind curtailment coefficient is USD 50/MWh and the load shedding coefficient is USD 80/MWh. The day-ahead wind power forecast was obtained based on measured data from a wind farm in northwest China for March 2019 using a hybrid neural network modeling approach. The forecasting results are presented in Table 1.

5.2. Assessment Results

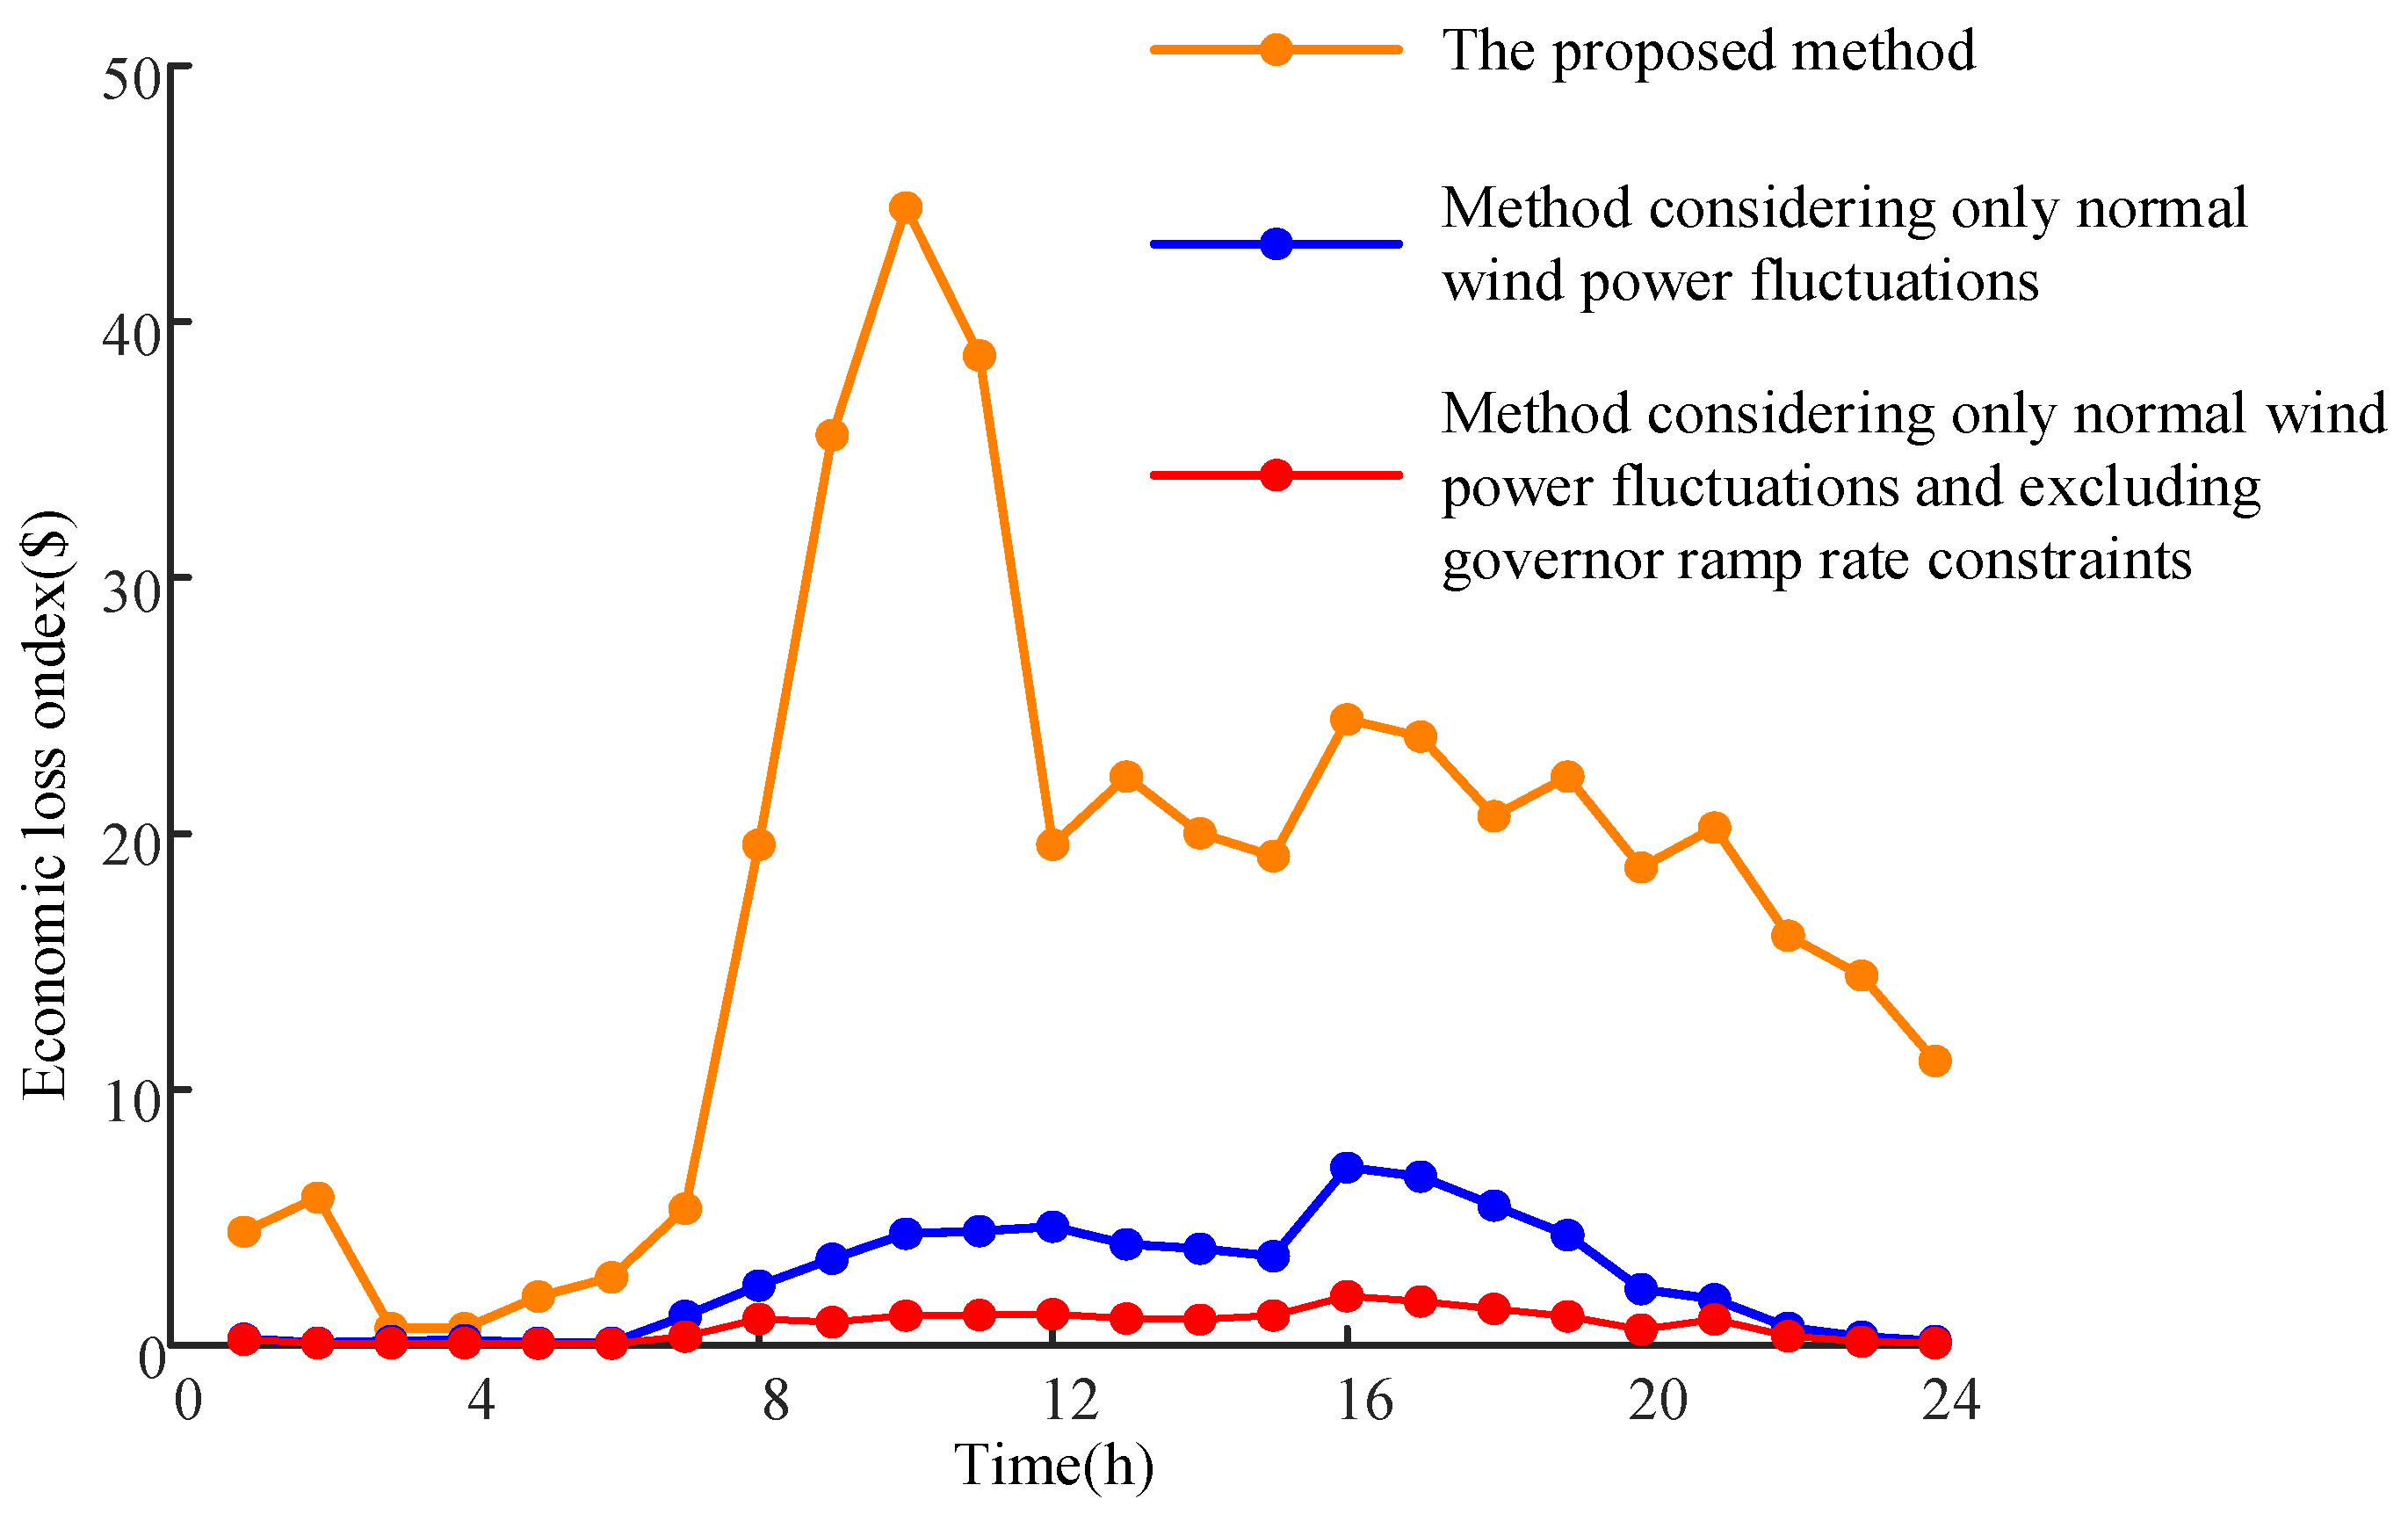
  • Comparison of the results of different methods
Figure 3 presents the comprehensive loss risk index calculated using the methodology proposed in this study. As can be observed in the figure, the temporal evolution of system operational risk under wind power ramping events exhibits strong correlations with load levels and their variation trends. Lower risk levels correspond to periods of low load demand (e.g., early morning and night hours), while higher risk levels occur during peak load periods (e.g., daytime hours). The maximum comprehensive loss risk index observed during 9:00–11:00 arises because this interval coincides with a significant load ramping phase. The concurrent occurrence of wind power ramping events during this period amplifies active power imbalances, thereby maximizing operational risks. Notably, even under comparable load levels and variation trends (e.g., hour 24 vs. hour 1), discrepancies in risk indices emerge. Although both hours share identical conventional unit commitment schedules, the higher risk index at hour 24 originates from the increased probability of conventional unit outages compared to hour 1.
This study designed two additional scenarios for comparison with the proposed method, as detailed below.
Scenario 1: Wind power ramp events are not considered; only normal fluctuations in wind power output are modeled. Apart from the differences in wind power scenarios, all other modeling components—such as input parameters and the optimal power flow model incorporating dynamic frequency security constraints—remain consistent with the proposed method.
Scenario 2: Similar to Scenario 1, this scenario does not account for wind power ramp events and only considers normal wind power fluctuations. In addition, it neglects the dynamic frequency response of the system and instead adopts static frequency security constraints in the OPF model. All other parameters and modeling structures are consistent with those used in the proposed method.
The system-wide risk indicators of aggregated economic loss calculated under these two scenarios are presented in Figure 3. A comparison between the proposed method and Scenario 1 reveals that the presence of wind power ramp events significantly increases the system’s comprehensive loss risk. This indicates that although such events occur with relatively low probability, they can have a substantial impact on system operation and thus warrant close attention from system operators and dispatching authorities.
Furthermore, a comparison between the methods with dynamic and static frequency constraints demonstrates that under normal wind fluctuations, the inclusion of dynamic frequency constraints results in a higher estimated risk. This suggests that the proposed OPF model, which accounts for dynamic frequency security constraints, provides a more stringent and realistic assessment of operational risk, effectively avoiding the underestimation that may result from ignoring frequency response speed.
2.
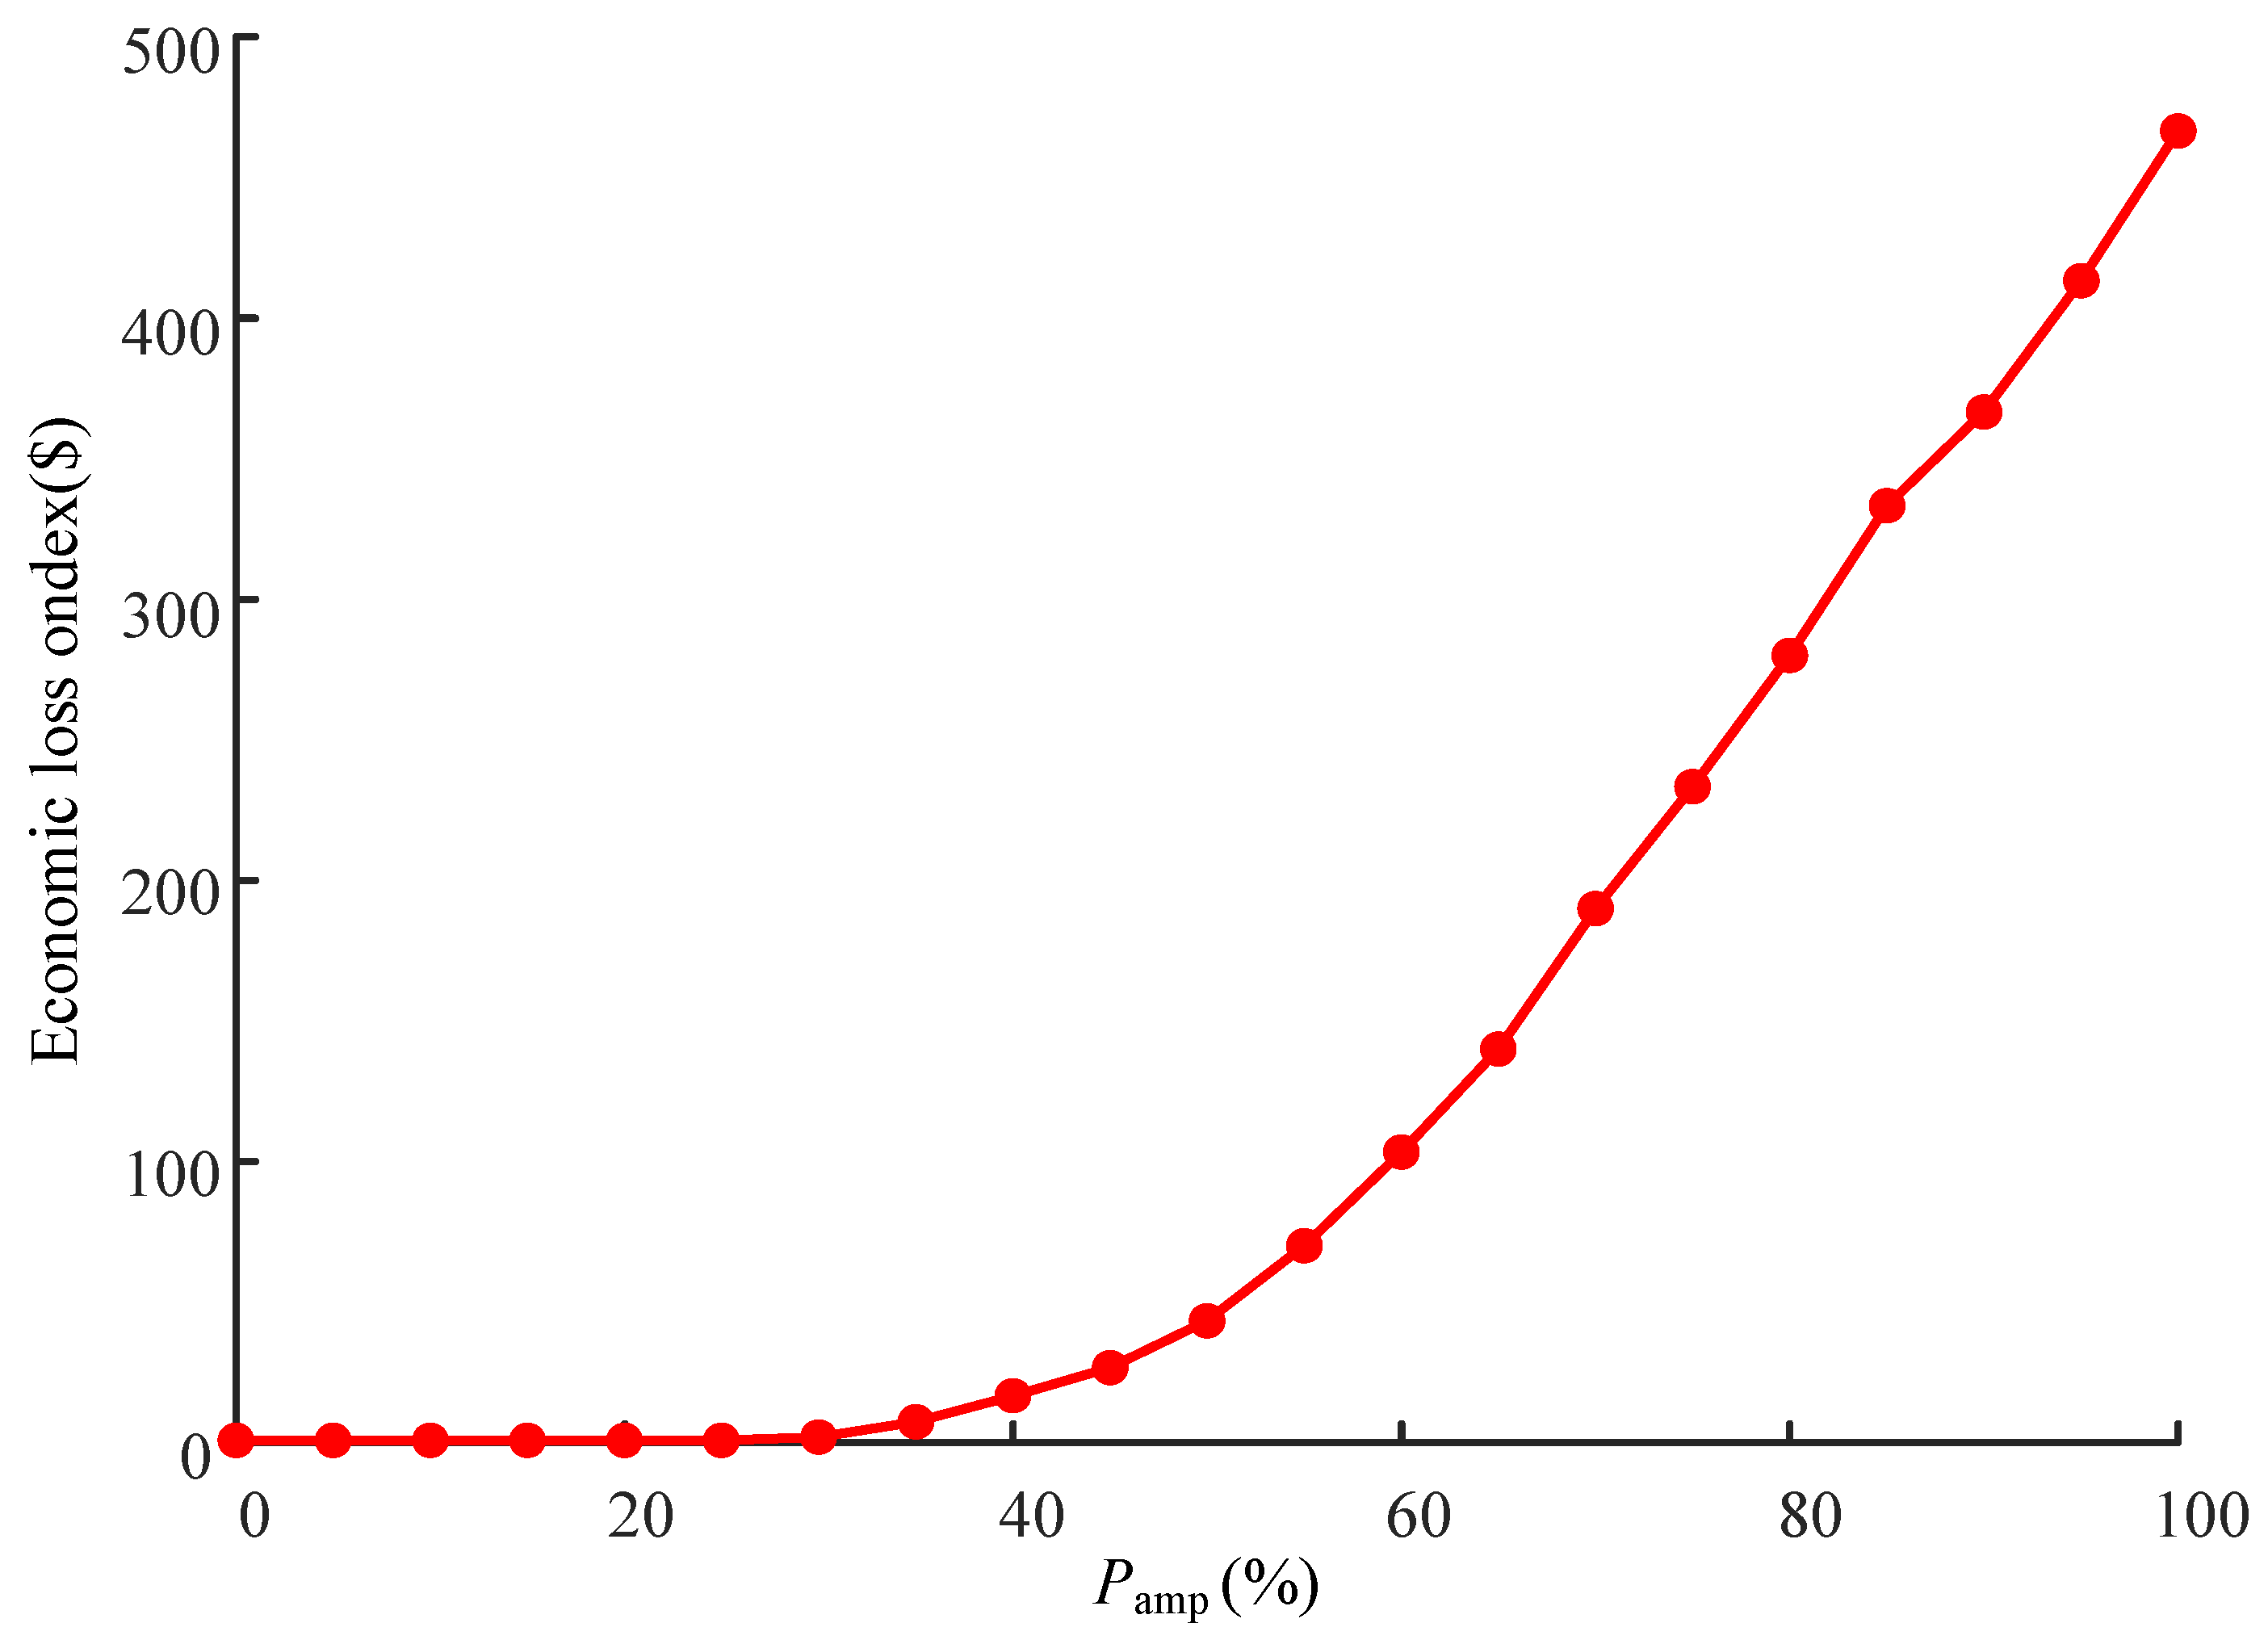
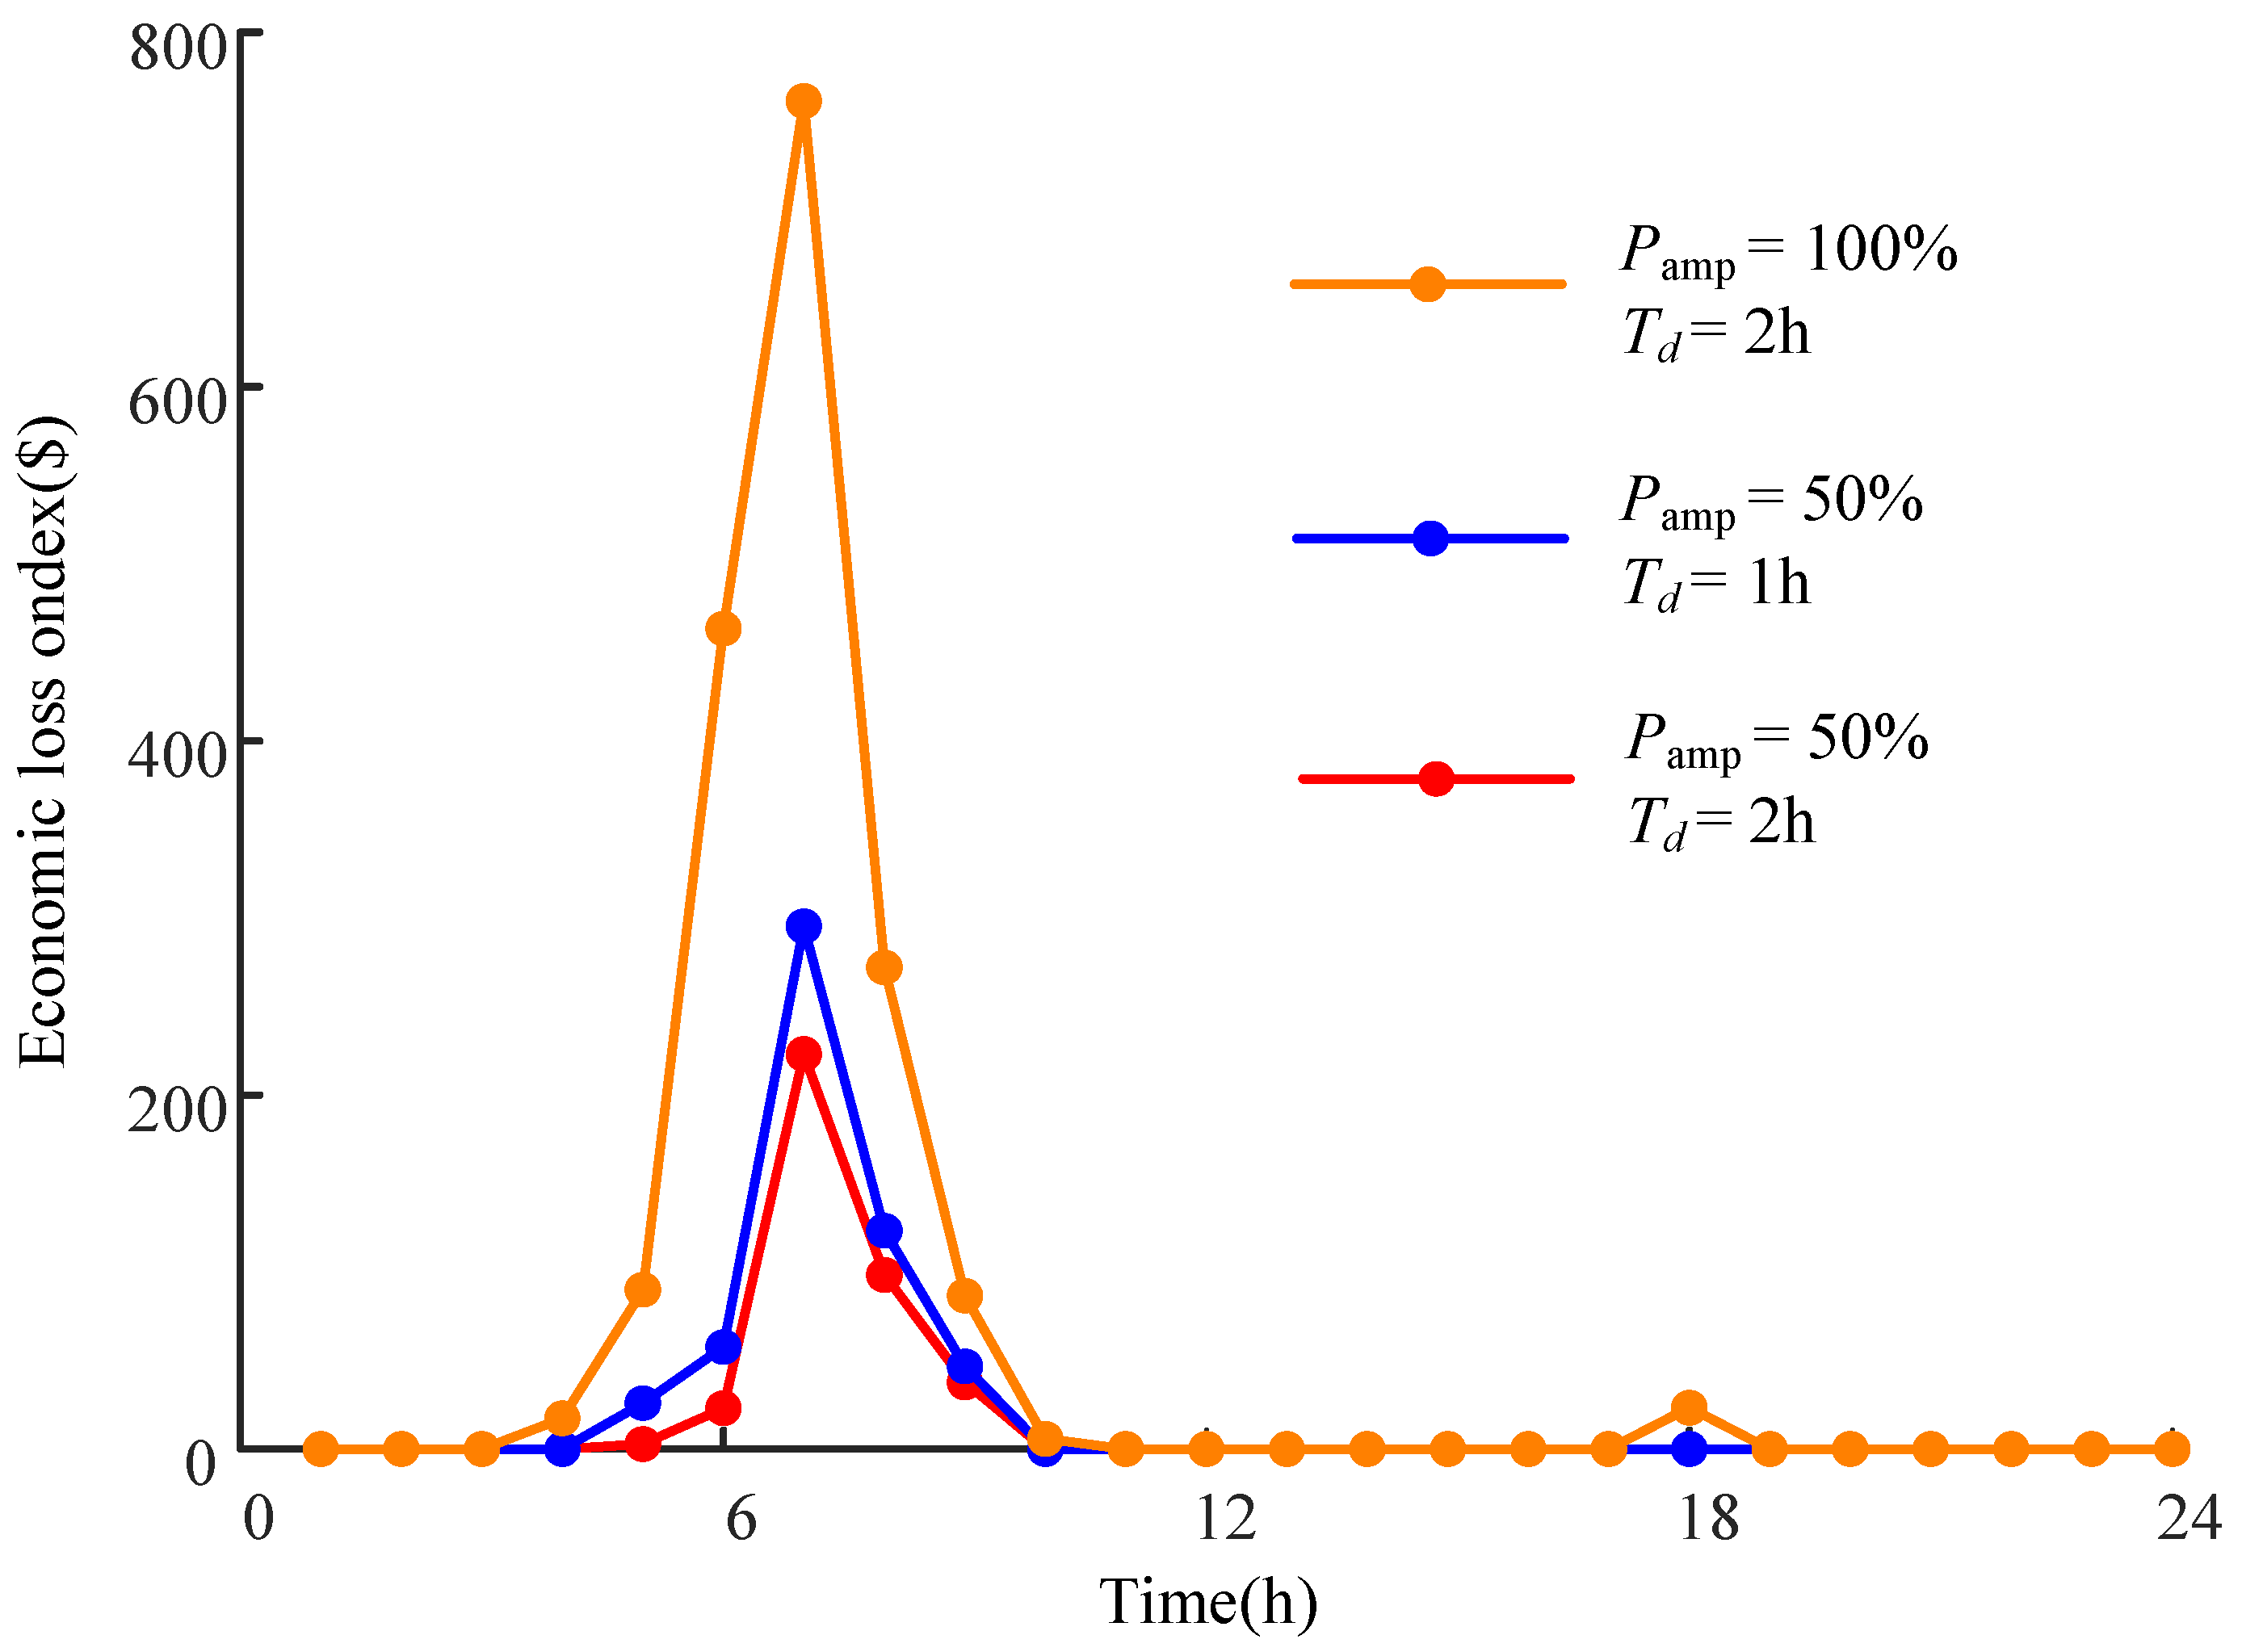
Impact of magnitude, duration, and start time of wind power ramping events on system risk indices.
Wind power ramping events are characterized by three parameters: start time Ts, duration Td, and ramp magnitude Pamp. Analyzing the impacts of these parameters on system operational risks is essential. First, the influence of ramp magnitude Pamp is investigated. The comprehensive loss risk indices calculated under varying Pamp values are shown in Figure 4. When Pamp < 30%, the system risk remains comparable to that under normal wind power fluctuations. In this range, the frequency regulation capability of conventional units suffices to balance active power imbalances, making incidents of wind curtailment or load loss less likely, thus resulting in lower risk indices. As Pamp increases beyond 50%, the risk index rises significantly. This escalation occurs because the primary frequency regulation capacity of conventional units reaches its limit under large active power imbalances, forcing the system to implement substantial load shedding, which drastically increases the comprehensive loss risk index.
To further investigate the impacts of the start time, duration, and ramp magnitude of wind power ramping events on risk indices, three scenarios are defined:
(a)
Pamp = 50%, Td = 2 h;
(b)
Pamp = 50%, Td = 1 h;
(c)
Pamp = 100%, Td = 2 h.
The system risk indices over the evaluation period were calculated under different start times of wind power ramping events, and the results are shown in Figure 5.
As shown in Figure 5, the comprehensive risk indices vary across different wind power ramping scenarios. The risk indices exhibit an increasing trend with larger ramp magnitudes and shorter durations. However, compared to the ramp magnitude, the duration has a relatively smaller impact on risk indices. This is because the ramp magnitude directly represents the severity of ramping events, serving as the primary determinant. In scenario (c), where the ramp magnitude reaches 100%, the ramping event may cause substantial losses to the system, which aligns with the findings in Figure 4.
Additionally, the impact of the start time of wind power ramping events on the comprehensive risk index cannot be overlooked, primarily due to its correlation with system load variation trends. During the periods of 5:00–10:00 and 17:00–19:00, when load demand undergoes significant upward ramping, the occurrence of negative wind power ramping events (sudden power reduction) would result in substantial active power deficits, thereby triggering load shedding and significantly elevating the comprehensive risk index. In contrast, during other periods characterized by declining or slightly increasing load trends, conventional units possess sufficient frequency response capability to prevent load loss, leading to comparatively lower operational risks in these intervals.

6. Conclusions

In this paper, we propose a method to assess power system operational risks under wind power ramping events. To address the strong temporal characteristics of wind power ramping events, we developed a time-sequential outage model for conventional generators that incorporates outage timing and probability and employed non-sequential Monte Carlo simulations to sample their temporal operational states. Considering the frequency dynamics caused by an active power imbalance, we derived dynamic frequency security constraints and formulated an optimal power flow model aimed at minimizing wind curtailment and load shedding comprehensive losses while enforcing these frequency constraints. By solving the optimal power flow model, we computed comprehensive loss risk indices to quantify the impact of wind power ramping events on system risks.
In the case study, the comprehensive loss risk index calculated by the proposed method is significantly higher than that obtained from the method considering only normal wind power fluctuations, highlighting the substantial impact of wind power ramping events on system risks. The comparison between dynamic and static frequency-constrained methods demonstrates that the dynamic frequency-constrained approach enforces stricter risk assessments, avoiding the conservatism of static methods. Analysis of the three parameters of wind power ramping events—start time, duration, and ramp magnitude—reveals their distinct influences on operational risks. The temporal evolution of system risks under wind power ramping events strongly correlates with load levels and load variation trends. When a negative wind power ramping event with a large ramp magnitude and short duration occurs during periods of significant load increase, it imposes the greatest impact on system risks.
The case study demonstrates that the proposed methodology accurately quantifies operational risks in wind-integrated power systems under wind power ramping events. Practically, the assessment results can guide grid operators in implementing risk-preventive control measures, showcasing significant engineering applicability for real-world power system operations.
Future research can incorporate more accurate probabilistic forecasting models for wind power ramp events and conduct operational risk assessments based on actual power system data and network topology, thereby enhancing the model’s capability to reflect real-world operating conditions and improving the reliability of the assessment results. Furthermore, improving computational efficiency to enable online risk assessment under wind power ramp scenarios represents another critical direction for advancing real-time grid security management.

Author Contributions

Conceptualization, W.W.; methodology, W.W.; software, D.Y.; validation, X.X.; formal analysis, S.W.; investigation, S.W.; resources, D.Y.; data curation, X.D.; writing—original draft preparation, W.W.; writing—review and editing, X.X.; visualization, W.W.; supervision, X.X. All authors have read and agreed to the published version of the manuscript.

Funding

This research was funded by Chongqing Municipal Science and Technology Bureau Projects (grant CSTB2024TIAD-KPX0088).

Data Availability Statement

The raw data supporting the conclusions of this article will be made available by the authors on request.

Conflicts of Interest

Authors Di Yang and Song Wang were employed by Chongqing Huizhi Energy Co., Ltd. The remaining authors declare that the research was conducted in the absence of any commercial or financial relationships that could be construed as a potential conflict of interest.

Abbreviations

The following abbreviations are used in this manuscript:
R t risk value of the power system at time t
E m t system operating state at time t
p( E m t )probability of the system operating state occurring at time t
C n t system output state at time t
p( C n t )probability of the system output state at time t
S( E m t , C n t )risk severity under the operating state and output state at time t
Recomprehensive loss risk index
Seseverity function corresponding to Re
ag,ioutput adjustment cost coefficient for conventional generators at node i
bwind curtailment cost coefficient
cload shedding cost coefficient
NGtotal number of nodes connected to conventional generators
NWtotal number of nodes connected to wind turbines
NDtotal number of nodes connected to loads
P g , i post-frequency-response output of the conventional unit at node i
P c d , i load shedding at node i
P c w , i wind curtailment at node i
Tsstart time of wind power ramping events
Tdduration of wind power ramping events
Pampmagnitude of wind power ramping events
P W t actual wind power output at time
P W , 0 t forecast actual wind power output at time
P W   T s forecast wind power at ramping start time
Δ P W , err t forecast error of wind power at time t under non-ramping conditions
P d , i t actual active load at node i at time t
P d i , 0 t forecast load at node i at time t
Δ P d i , err t load forecast error
P g , i t probability of conventional unit at node i being in outage state at time t
pg,i,upstartup success rate of unit
λg,ifailure rate of unit
tg,icumulative operating duration of unit up to time t
tg,i,onscheduled startup time of unit
tg,i,offscheduled outage time of unit
tipossible outage timing of conventional units
p g , i ( t i ) probability that an outage event occurs at time ti after unit is committed
p g , i ( t ) outage probability of unit i at time t
ug,i(tg,i,on)binary operational status indicator of unit i
Hsyssystem inertia
Δf(t)frequency deviation
PFR(t)primary frequency regulation output adjustment of conventional units
ΔPimactive power imbalance under the given system state
ΔfDBfrequency deadband
tDBtime from power imbalance onset to frequency reaching the deadband
Csyssystem-wide primary frequency regulation response rate
χ g , t binary variable denoting unit i’s primary frequency response participation at time t
cg,igovernor’s maximum ramp rate of unit i
TDsystem’s primary frequency regulation response time
RoCoFrate of change of frequency
Δfnadirmaximum frequency deviation
RoCoF,maxmaximum allowable initial rate of change of frequency for the system
ΔfT,maxsystem’s maximum allowable dynamic frequency deviation
P l t active power transmitted on line l at time t
l L i + P l t total active power sent from node i at time t
l L i - P l t total active power received at node i at time t
Pg,i,maxupper limits of active power output of unit at node i
Pg,i,minlower limits of active power output of unit at node i
Pl,maxmaximum allowable active power transmission capacity of line l
Ntnumber of non-sequential Monte Carlo samples
Mtsystem state index under Monte Carlo sampled scenario

References

  1. Shi, J.; Qin, J.; Li, H.; Li, Z.; Ge, Y.; Liu, B. Probabilistic Power and Energy Balance Risk Scheduling Method Based on Distributed Robust Optimization. Energies 2024, 17, 4894. [Google Scholar] [CrossRef]
  2. Li, J.; Fang, J.; Wen, I.; Pan, Y.; Ding, Q. Optimal Trade-off between Regulation and Wind Curtailment in the Economic Dispatch Problem. CSEE J. Power Energy Syst. 2015, 1, 37–45. [Google Scholar] [CrossRef]
  3. Kamath, C. Associating Weather Conditions with Ramp Events in Wind Power Generation. In Proceedings of the 2011 IEEE/PES Power Systems Conference and Exposition, Phoenix, AZ, USA, 20–23 March 2011. [Google Scholar]
  4. Li, J.; Wang, X.; Liu, B. Event-Based Deep Reinforcement Learning for Smoothing Ramp Events in Combined Wind-Storage Energy Systems. IEEE Trans. Ind. Inform. 2024, 20, 7871–7882. [Google Scholar] [CrossRef]
  5. Garip, S.; Özdemir, Ş.; Altin, N. Power System Reliability Assessment—A Review on Analysis and Evaluation Methods. J. Energy Syst. 2022, 6, 401–419. [Google Scholar] [CrossRef]
  6. Chang, Y.; Liu, C.; Huang, S.; Liu, W.; Liu, Z.; Shao, J.; Li, R.; Lv, Y. Risk Assessment of Generation and Transmission Systems Considering Wind Power Penetration. In Proceedings of the 2018 International Conference on Power System Technology (POWERCON), Guangzhou, China, 6–8 November 2018. [Google Scholar]
  7. Dai, Y.; Preece, R.; Panteli, M. Risk Assessment of Cascading Failures in Power Systems with Increasing Wind Penetration. Electr. Power Syst. Res. 2022, 211, 108392. [Google Scholar] [CrossRef]
  8. Tomasson, E.; Soder, L. Generation Adequacy Analysis of Multi-Area Power Systems with a High Share of Wind Power. IEEE Trans. Power Syst. 2018, 33, 3854–3862. [Google Scholar] [CrossRef]
  9. Li, H.; Lu, Z.; Qiao, Y.; Wang, W. Risk Assessment of Power System with High Penetration of Wind Power Considering Negative Peak Shaving and Extreme Weather Conditions. In Proceedings of the 2014 IEEE PES General Meeting|Conference & Exposition, National Harbor, MD, USA, 27–31 July 2014. [Google Scholar]
  10. Yang, X.; Yang, Y.; Liu, Y.; Deng, Z. A Reliability Assessment Approach for Electric Power Systems Considering Wind Power Uncertainty. IEEE Access 2020, 8, 12467–12478. [Google Scholar] [CrossRef]
  11. Li, X.; Wang, H. Operation Risk Assessment of Wind Farm Integrated System Influenced by Weather Conditions. In Proceedings of the 2013 IEEE Power & Energy Society General Meeting, Vancouver, BC, Canada, 21–25 July 2013. [Google Scholar]
  12. Negnevitsky, M.; Nguyen, D.H.; Piekutowski, M. Risk Assessment for Power System Operation Planning with High Wind Power Penetration. IEEE Trans. Power Syst. 2015, 30, 1359–1368. [Google Scholar] [CrossRef]
  13. Nguyen, D.H.; Negnevitsky, M.; Piekutowski, M. A Risk Assessment Approach for Power System with Significant Penetration Levels of Wind Power Generation. In Proceedings of the 2013 Australasian Universities Power Engineering Conference (AUPEC), Hobart, TAS, Australia, 29 September–3 October 2013. [Google Scholar]
  14. Deng, W.; Ding, H.; Zhang, B.; Lin, X.; Bie, P.; Wu, J. Multi-period Probabilistic-scenario Risk Assessment of Power System in Wind Power Uncertain Environment. IET Gener. Transm. Distrib. 2016, 10, 359–365. [Google Scholar] [CrossRef]
  15. Wang, Y.; Sun, Y.; Li, Y.; Feng, C.; Chen, P. Risk Assessment of Power Imbalance for Power Systems with Wind Power Integration Considering Governor Ramp Rate of Conventional Units. Electr. Power Syst. Res. 2023, 217, 109111. [Google Scholar] [CrossRef]
  16. Sevlian, R.; Rajagopal, R. Detection and Statistics of Wind Power Ramps. IEEE Trans. Power Syst. 2013, 28, 3610–3620. [Google Scholar] [CrossRef]
  17. Cui, Y.; He, Y.; Xiong, X.; Chen, Z.; Li, F.; Xu, T.; Zhang, F. Algorithm for Identifying Wind Power Ramp Events via Novel Improved Dynamic Swinging Door. Renew. Energy 2021, 171, 542–556. [Google Scholar] [CrossRef]
  18. He, C.; Tang, Q.; Yang, J. Risk Assessment of Power System with Large-Scale Wind Power Connected Considering the Time-Sequence Characteristic of Wind Power Ramp Event. In Proceedings of the 2018 2nd IEEE Conference on Energy Internet and Energy System Integration (EI2), Beijing, China, 20–22 October 2018. [Google Scholar]
  19. Xu, C.; Wei, Z.; He, C.; Wang, H. Risk Assessment of Wind Power Ramp Event Considering Time-Sequence Characteristic. In Proceedings of the 2014 IEEE PES Asia-Pacific Power and Energy Engineering Conference (APPEEC), Hong Kong, China, 7–10 December 2014. [Google Scholar]
  20. Qiu, W.; Huang, Y.; Zhai, X.; Ma, J.; Zhang, T.; Liu, S.; Lin, Z. Operational Risk Assessment on Power System Based on Weather Regionalization Considering Power Ramp of Renewable Energy Generation. Energy Rep. 2023, 9, 396–408. [Google Scholar] [CrossRef]
Figure 1. Process of operational risk assessment for power systems under wind power ramping events.
Processes 13 01779 g001
Figure 2. IEEE RTS79.
Processes 13 01779 g002
Figure 3. Comprehensive risk index of different methods.
Processes 13 01779 g003
Figure 4. Curves of system risk index vs. ramp magnitudes.
Processes 13 01779 g004
Figure 5. Curves of system risk under different wind power ramping scenarios.
Processes 13 01779 g005
Table 1. Daily wind power forecast curve data.
Time123456789101112
Wind Power Forecast (p.u)0.760.800.981.000.950.930.850.680.570.580.520.50
Time131415161718192021222324
Wind Power Forecast (p.u)0.440.380.340.360.420.510.470.480.440.530.630.76
Disclaimer/Publisher’s Note: The statements, opinions and data contained in all publications are solely those of the individual author(s) and contributor(s) and not of MDPI and/or the editor(s). MDPI and/or the editor(s) disclaim responsibility for any injury to people or property resulting from any ideas, methods, instructions or products referred to in the content.

