Author Contributions
Conceptualization, E.Ç., V.B. and S.G.-D.; methodology, E.Ç. and V.B.; software, V.B.; validation, E.Ç., V.B. and S.G.-D.; formal analysis, E.Ç., V.B. and S.G.-D.; investigation, E.Ç. and V.B.; resources, E.Ç., V.B. and S.G.-D.; data curation, E.Ç., V.B. and S.G.-D.; writing—original draft preparation, E.Ç., V.B. and S.G.-D.; writing—review and editing, S.G.-D.; visualization, E.Ç. and S.G.-D.; supervision, E.Ç.; project administration, E.Ç.; funding acquisition, E.Ç. and V.B. All authors have read and agreed to the published version of the manuscript.
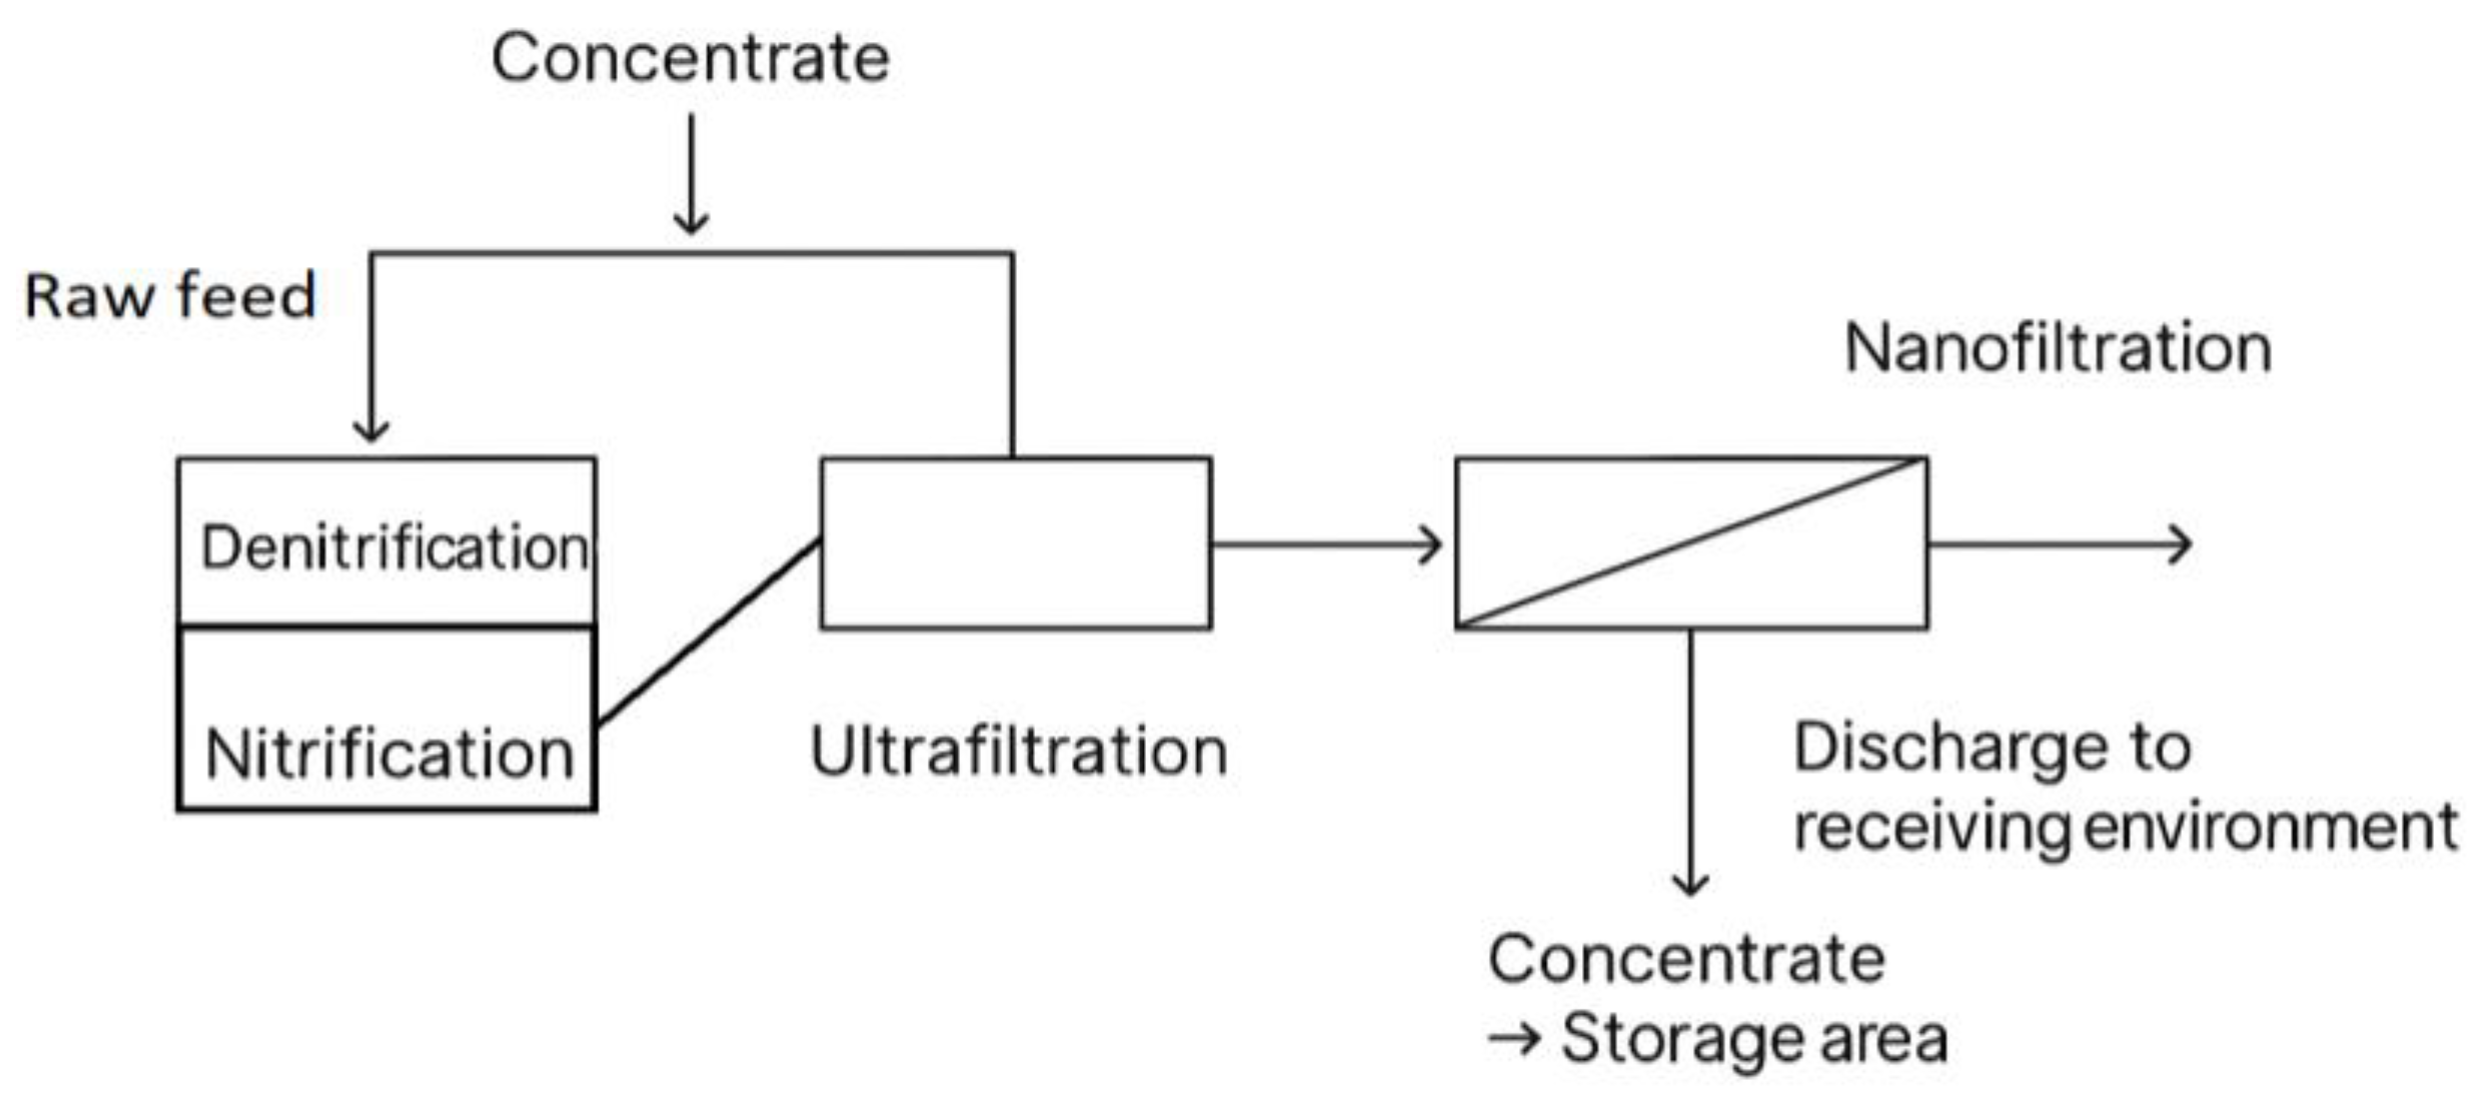
Figure 1.
Treatment plant process flow chart.
Figure 1.
Treatment plant process flow chart.
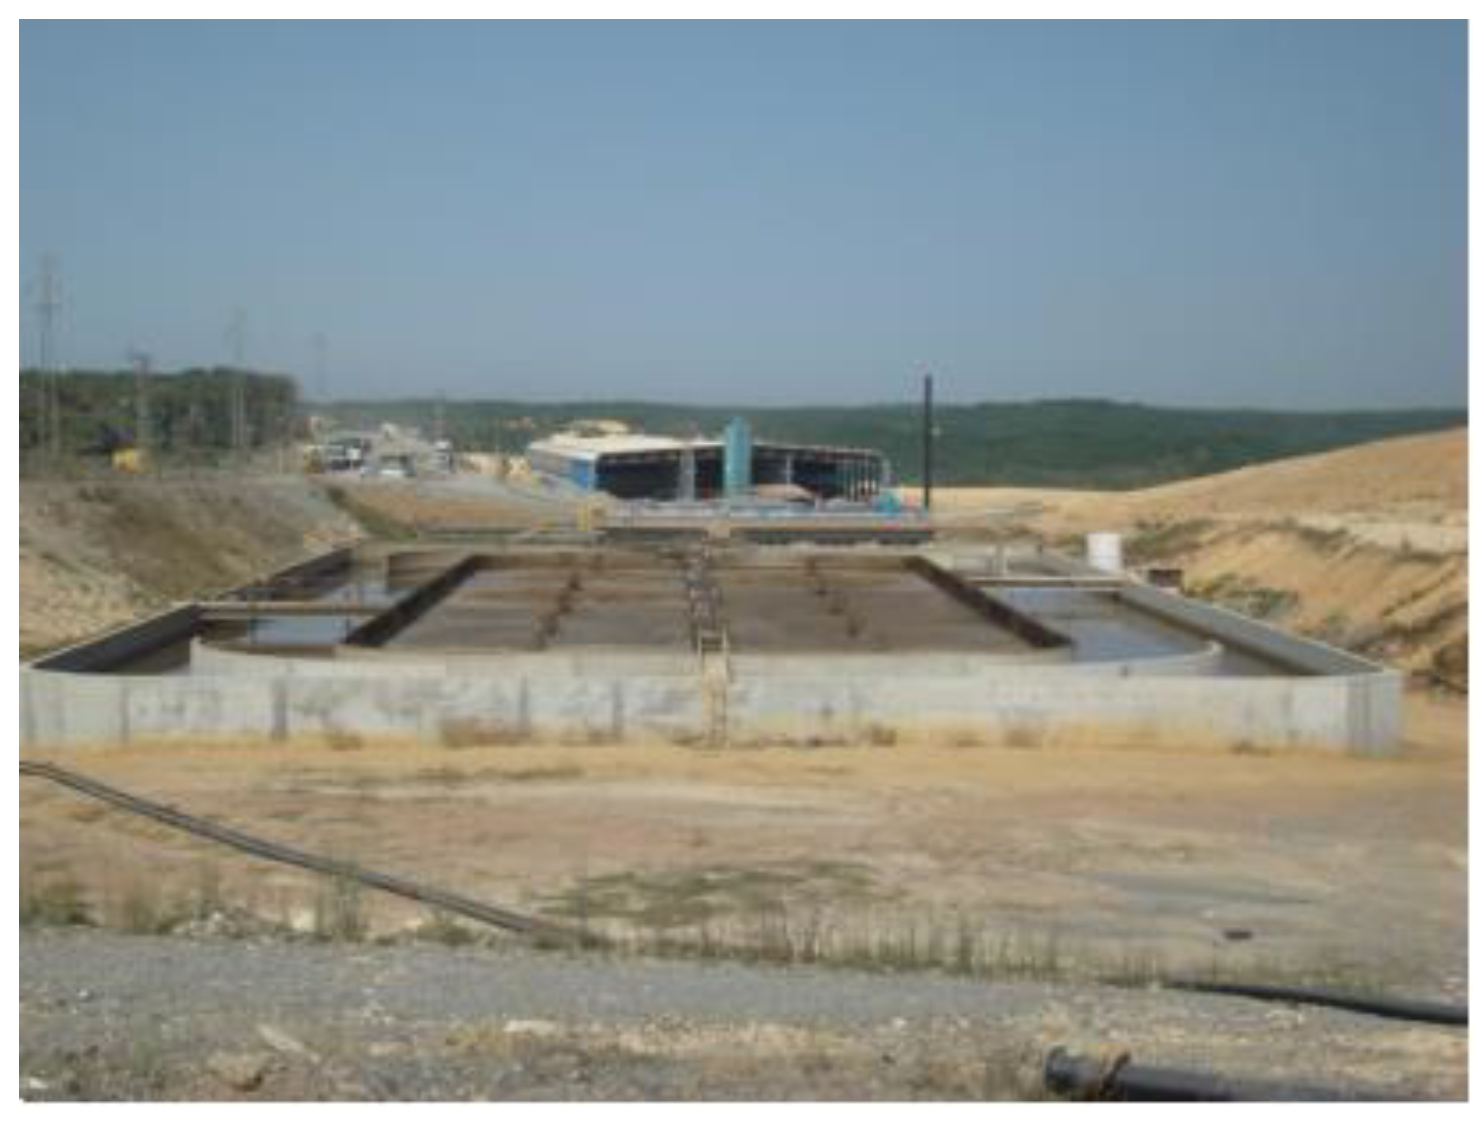
Figure 2.
Bioreactor view.
Figure 2.
Bioreactor view.
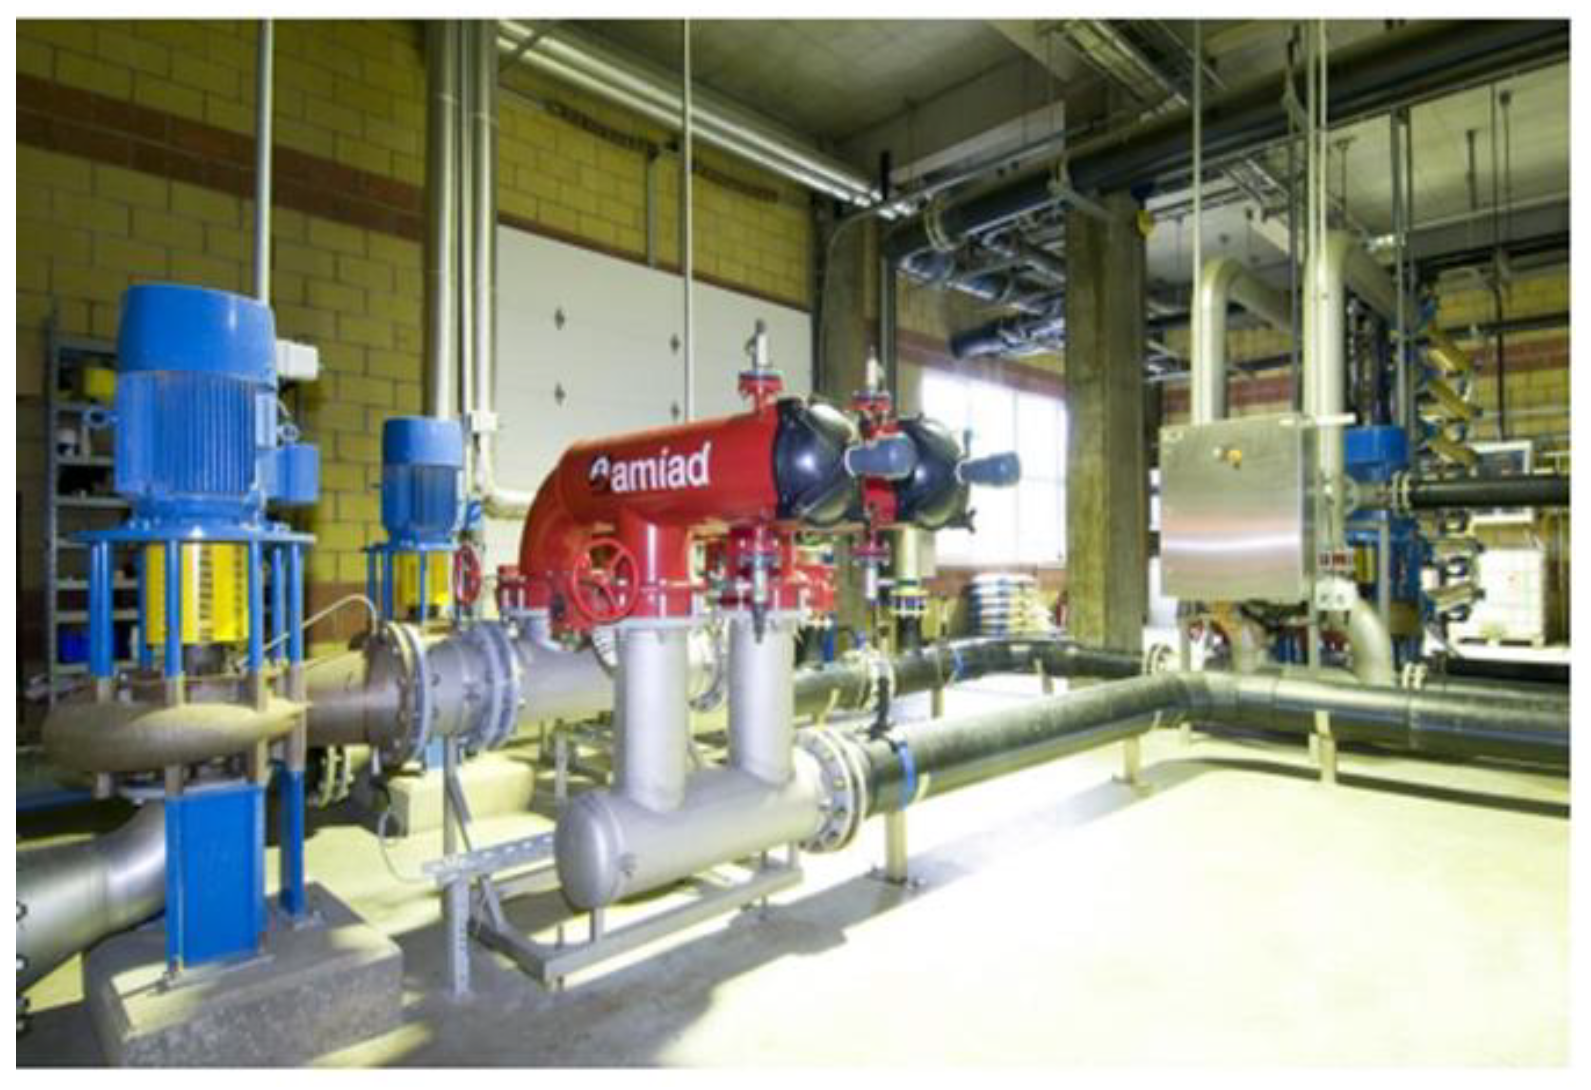
Figure 4.
Ultrafiltration membrane unit.
Figure 4.
Ultrafiltration membrane unit.
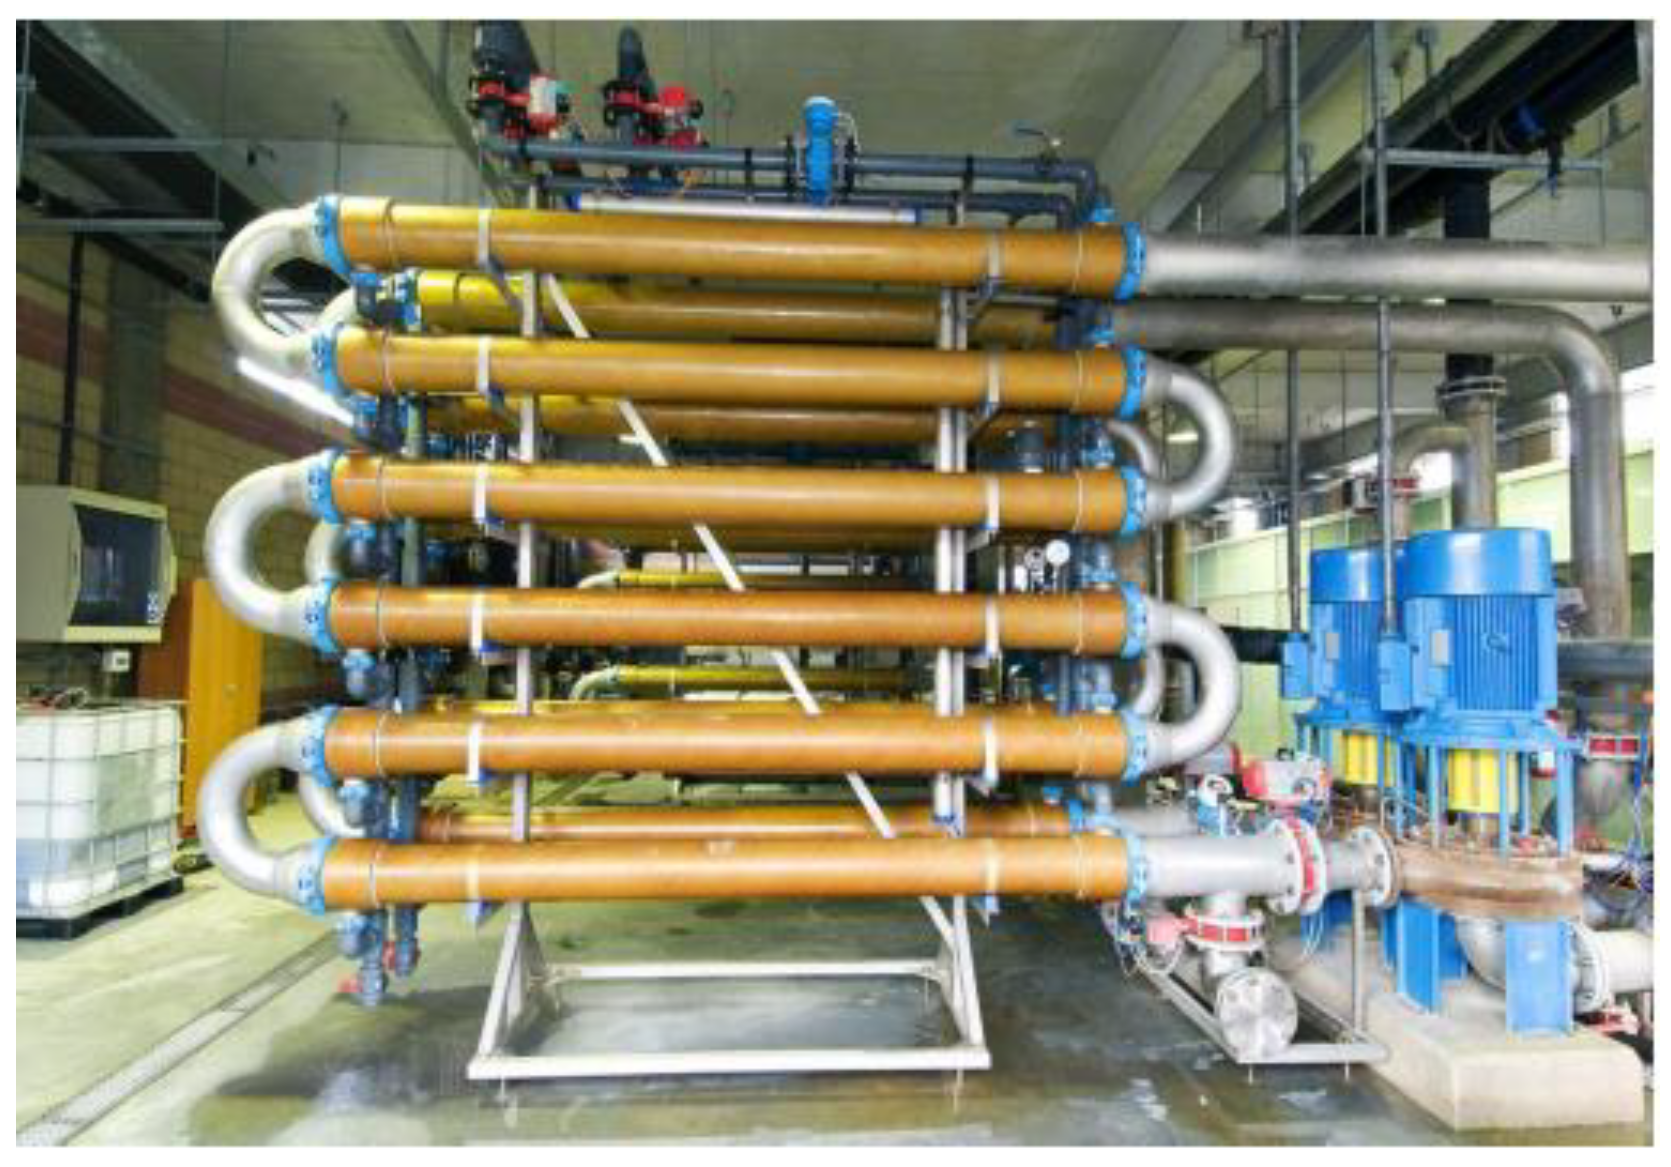
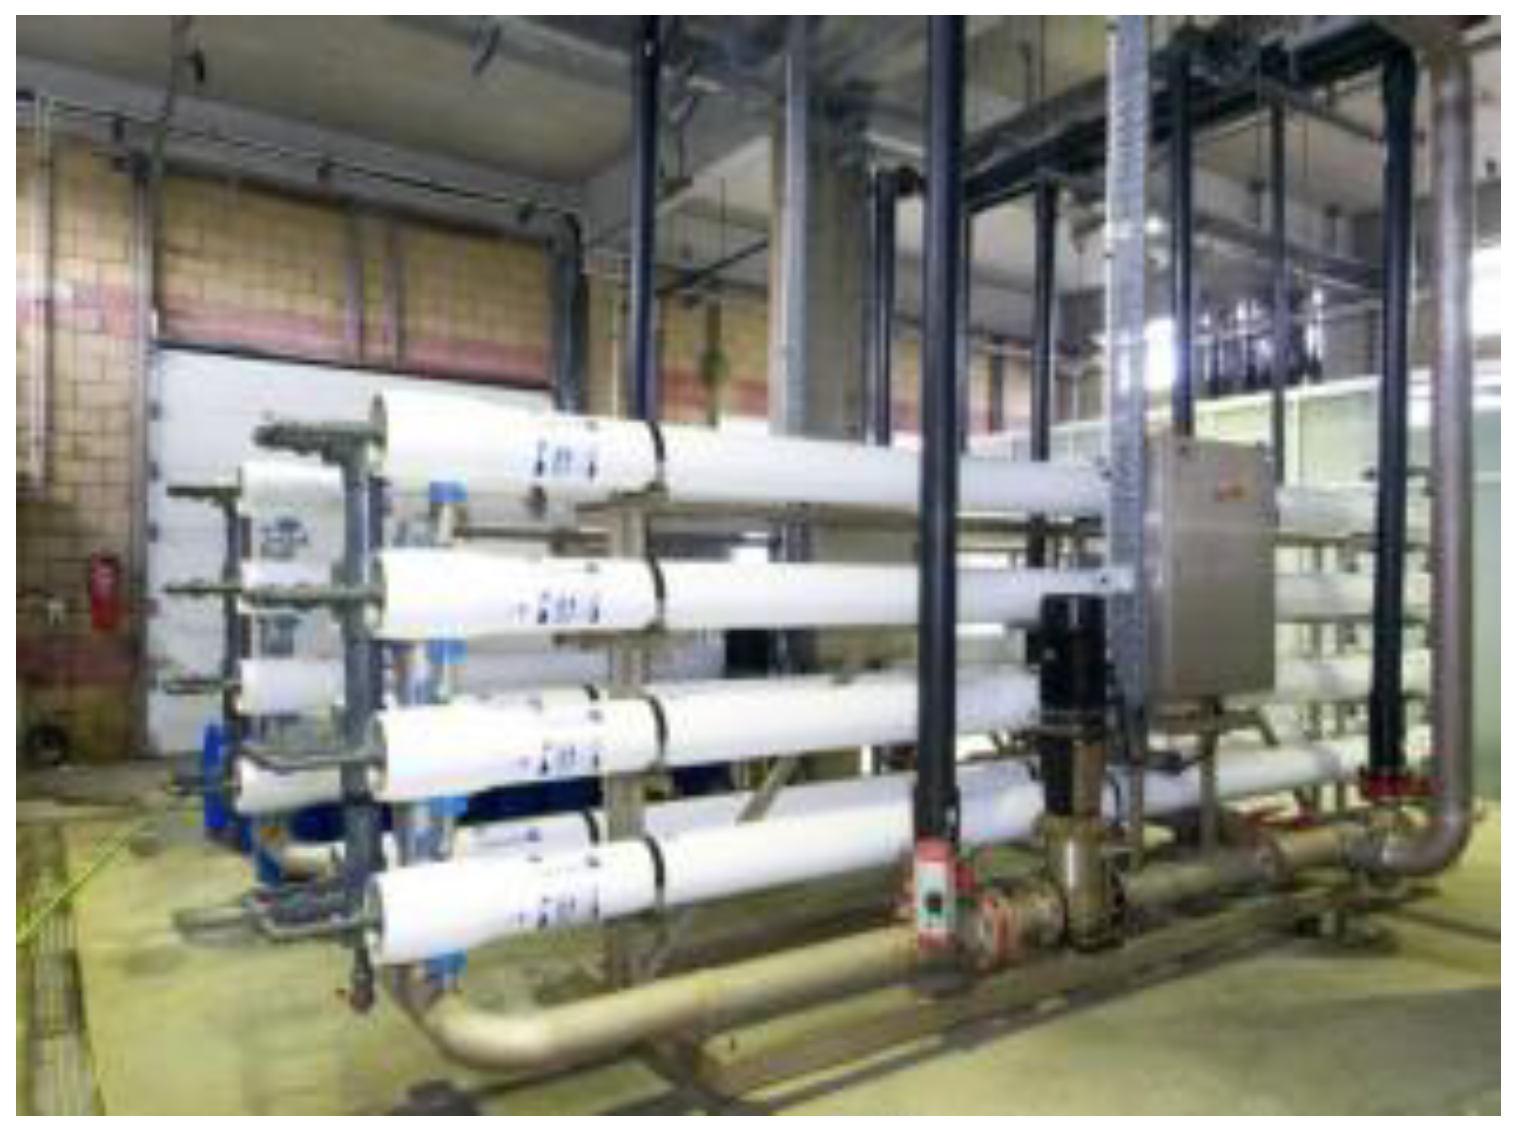
Figure 5.
Nanofiltration membrane unit.
Figure 5.
Nanofiltration membrane unit.
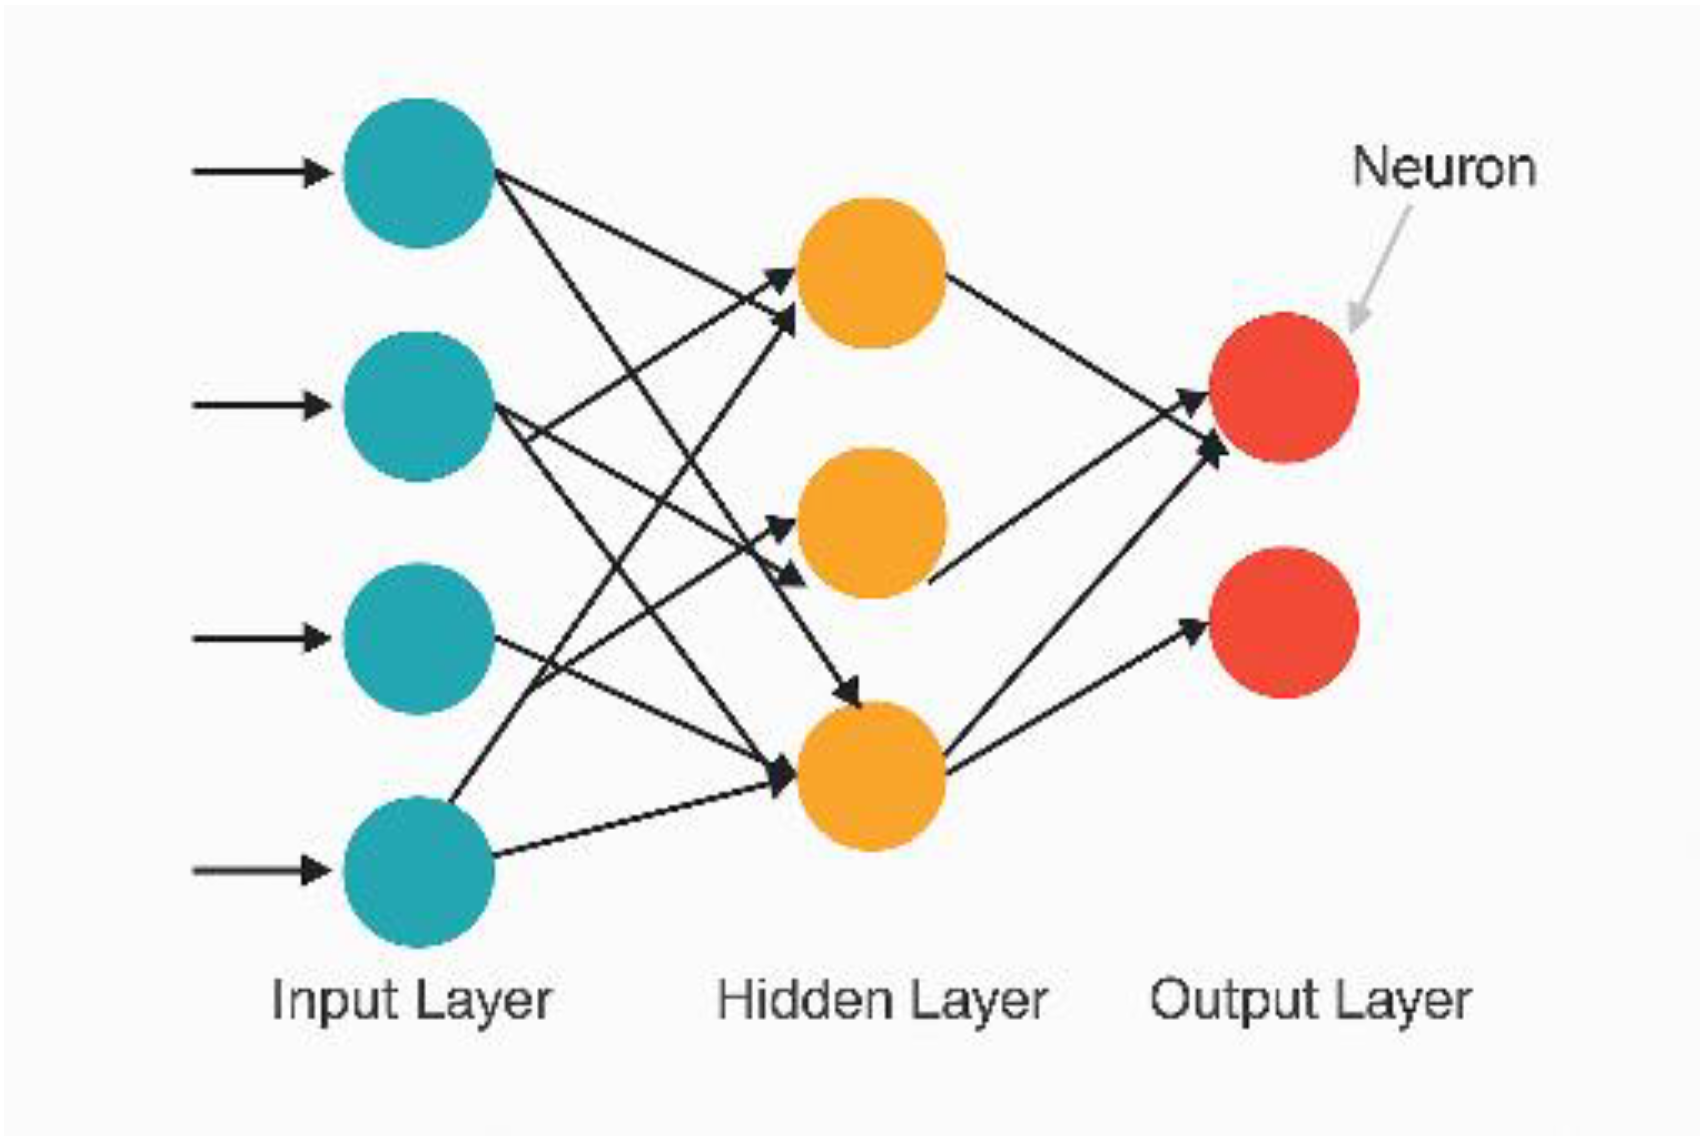
Figure 6.
Schematic architecture of a feedforward ANN model.
Figure 6.
Schematic architecture of a feedforward ANN model.
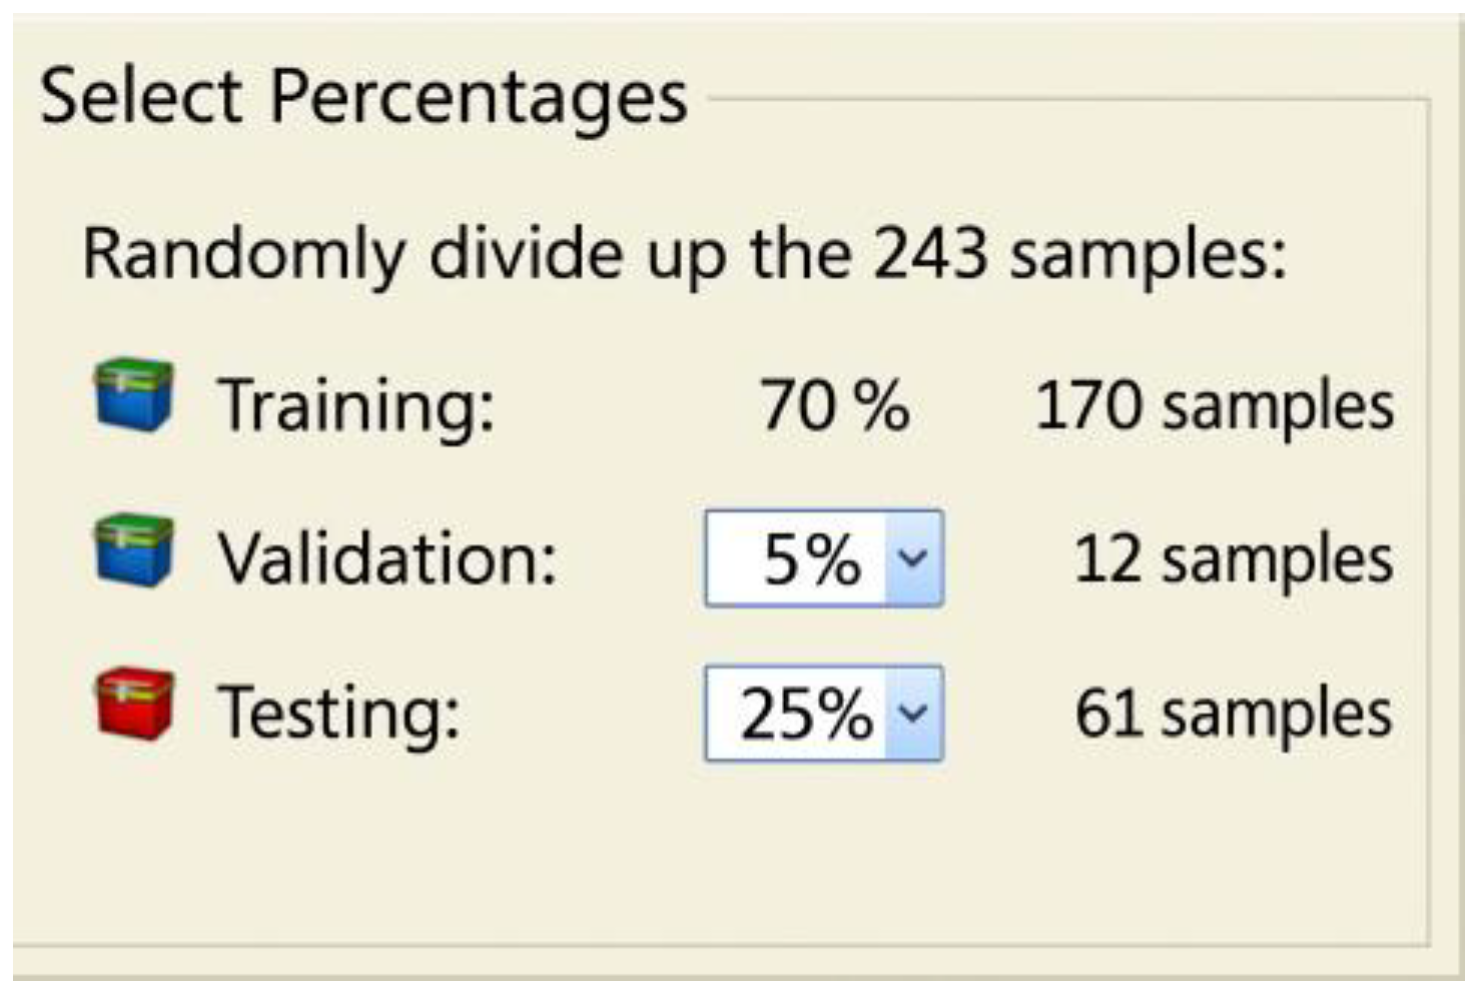
Figure 7.
Data distribution for training, testing, and validation.
Figure 7.
Data distribution for training, testing, and validation.
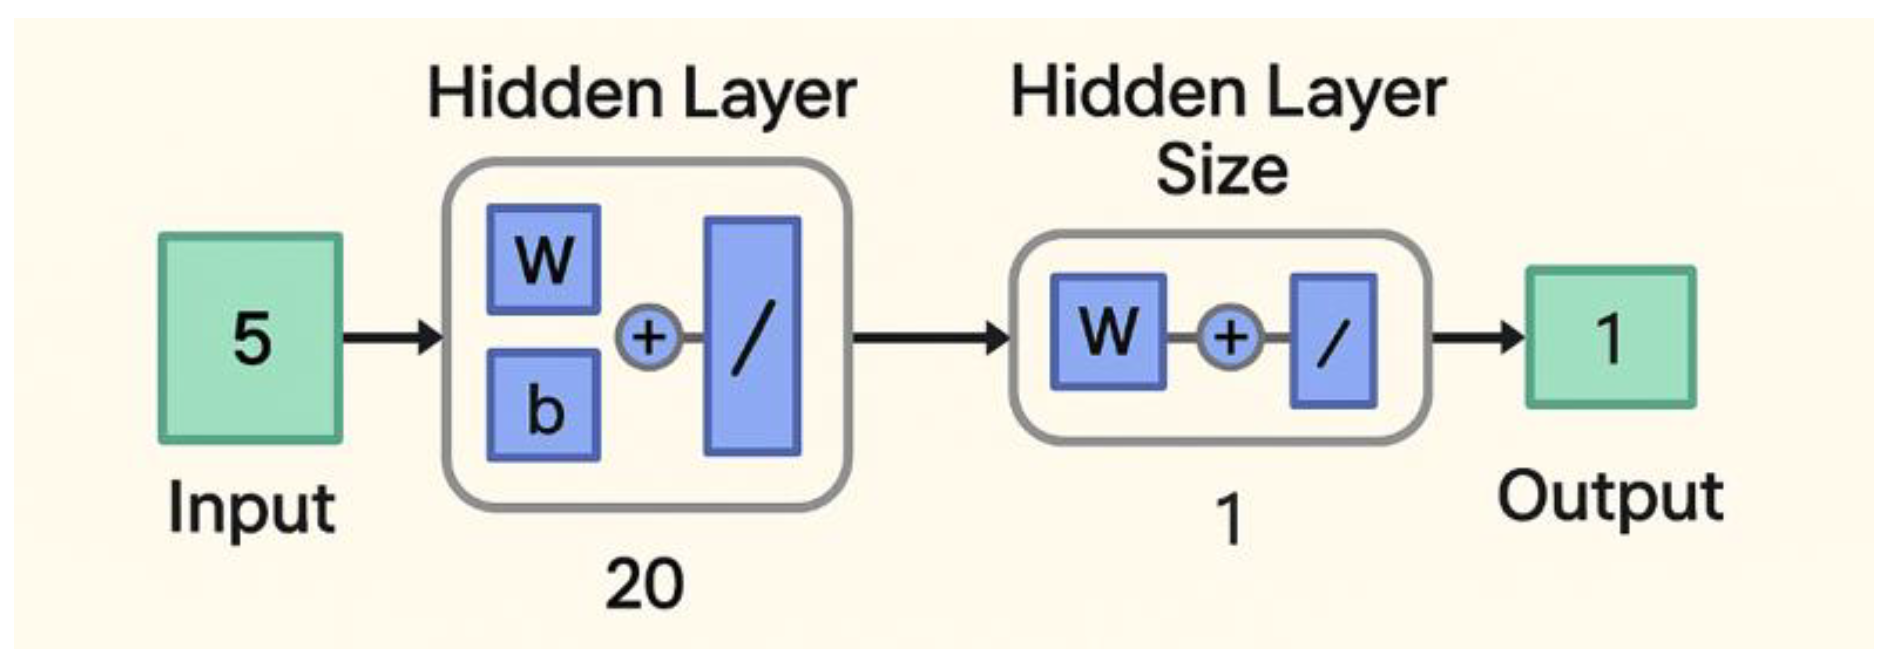
Figure 8.
Feedforward back-propagation model structure.
Figure 8.
Feedforward back-propagation model structure.
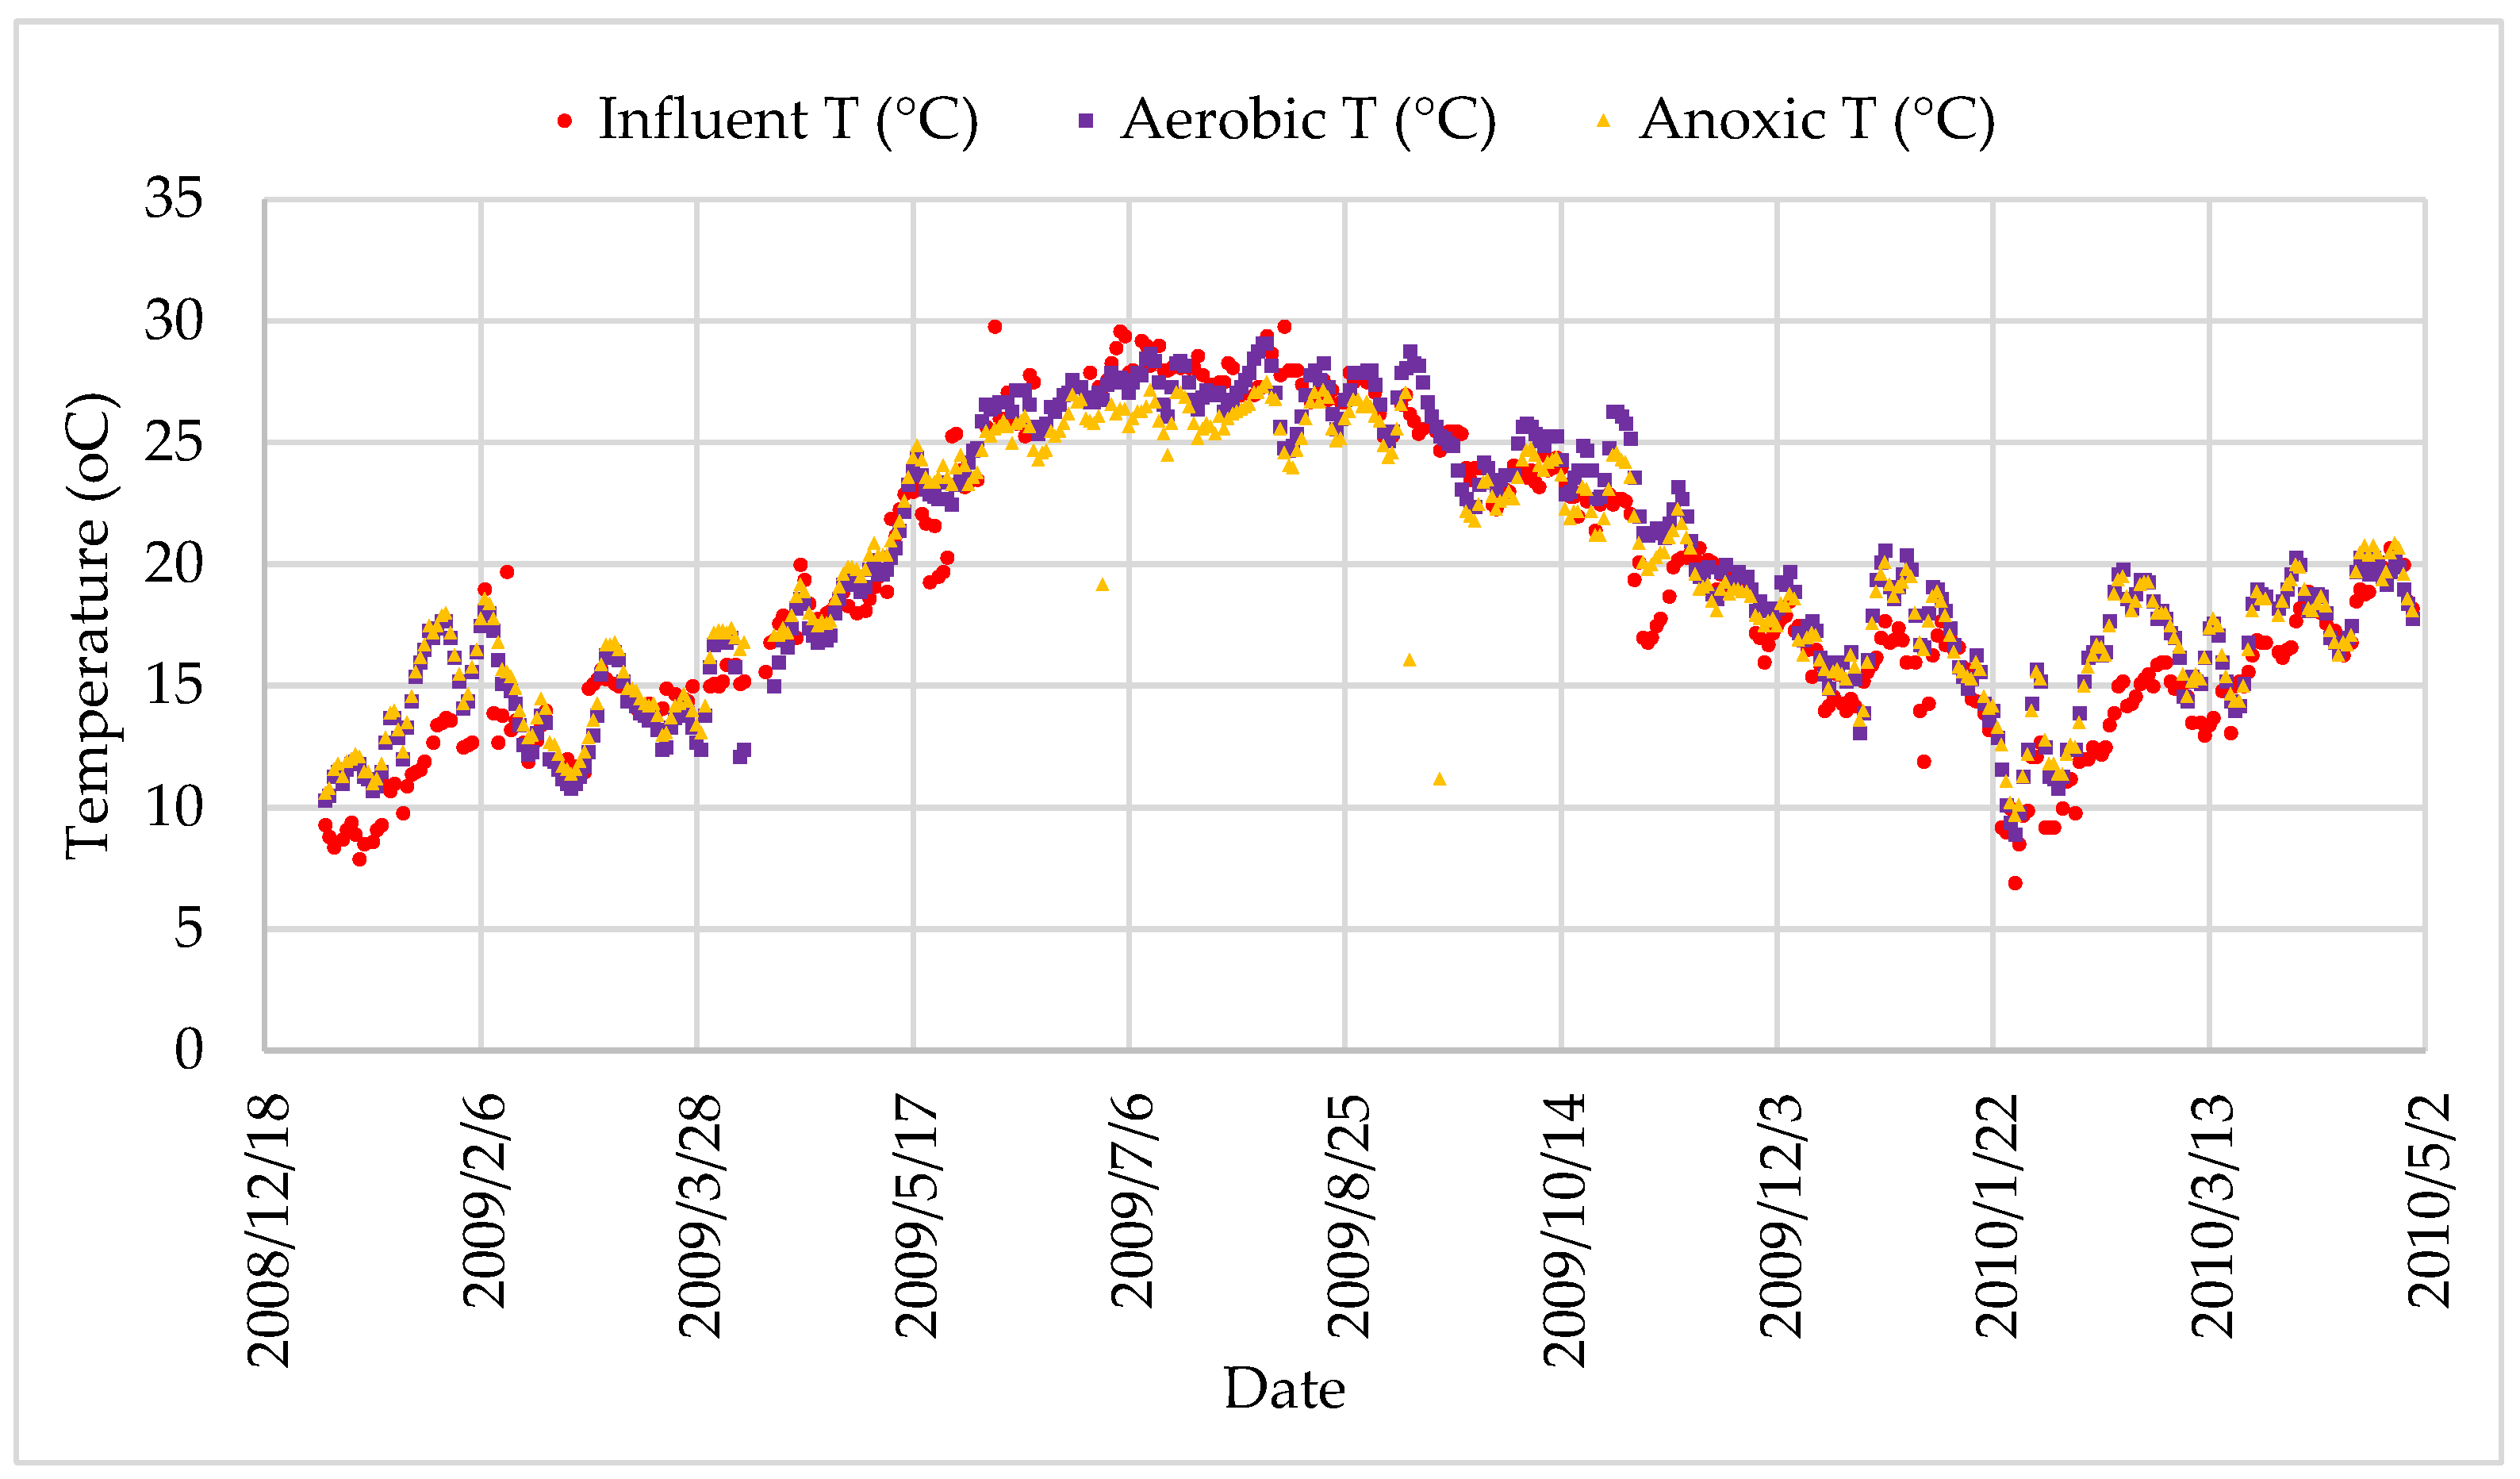
Figure 9.
Daily temperature changes.
Figure 9.
Daily temperature changes.
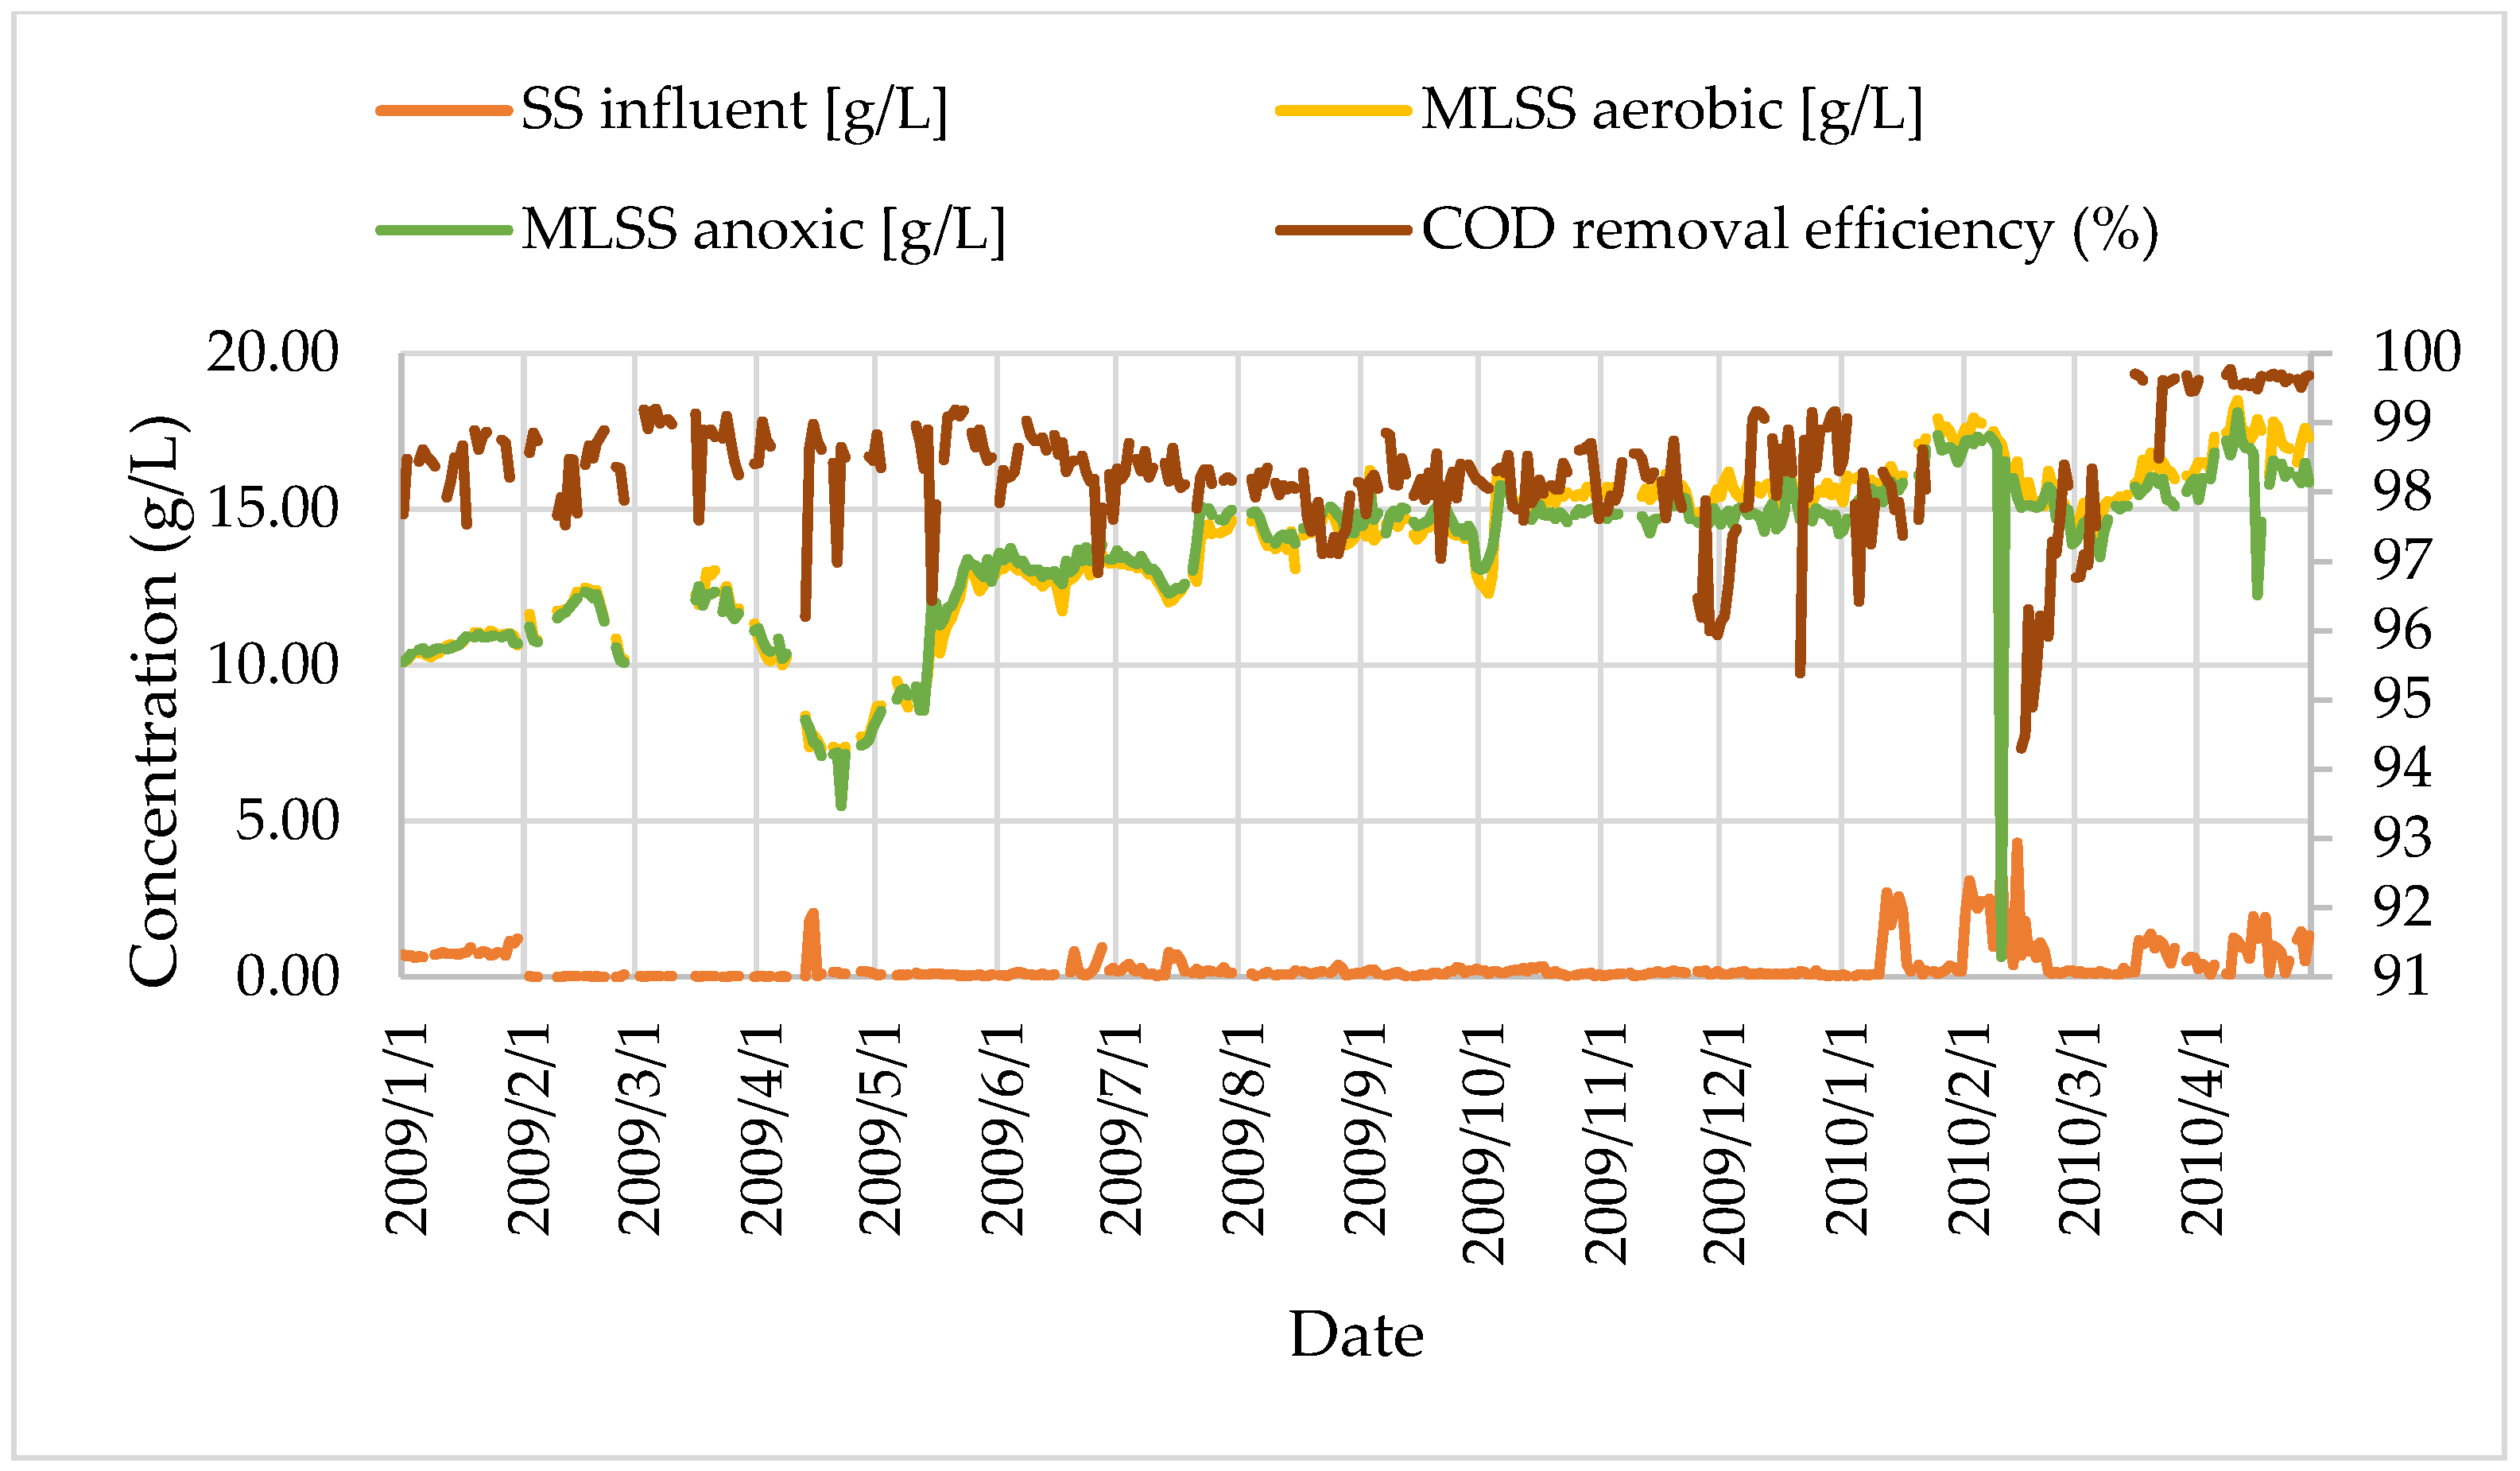
Figure 10.
The time-dependent change in SS influent and MLSS concentrations.
Figure 10.
The time-dependent change in SS influent and MLSS concentrations.
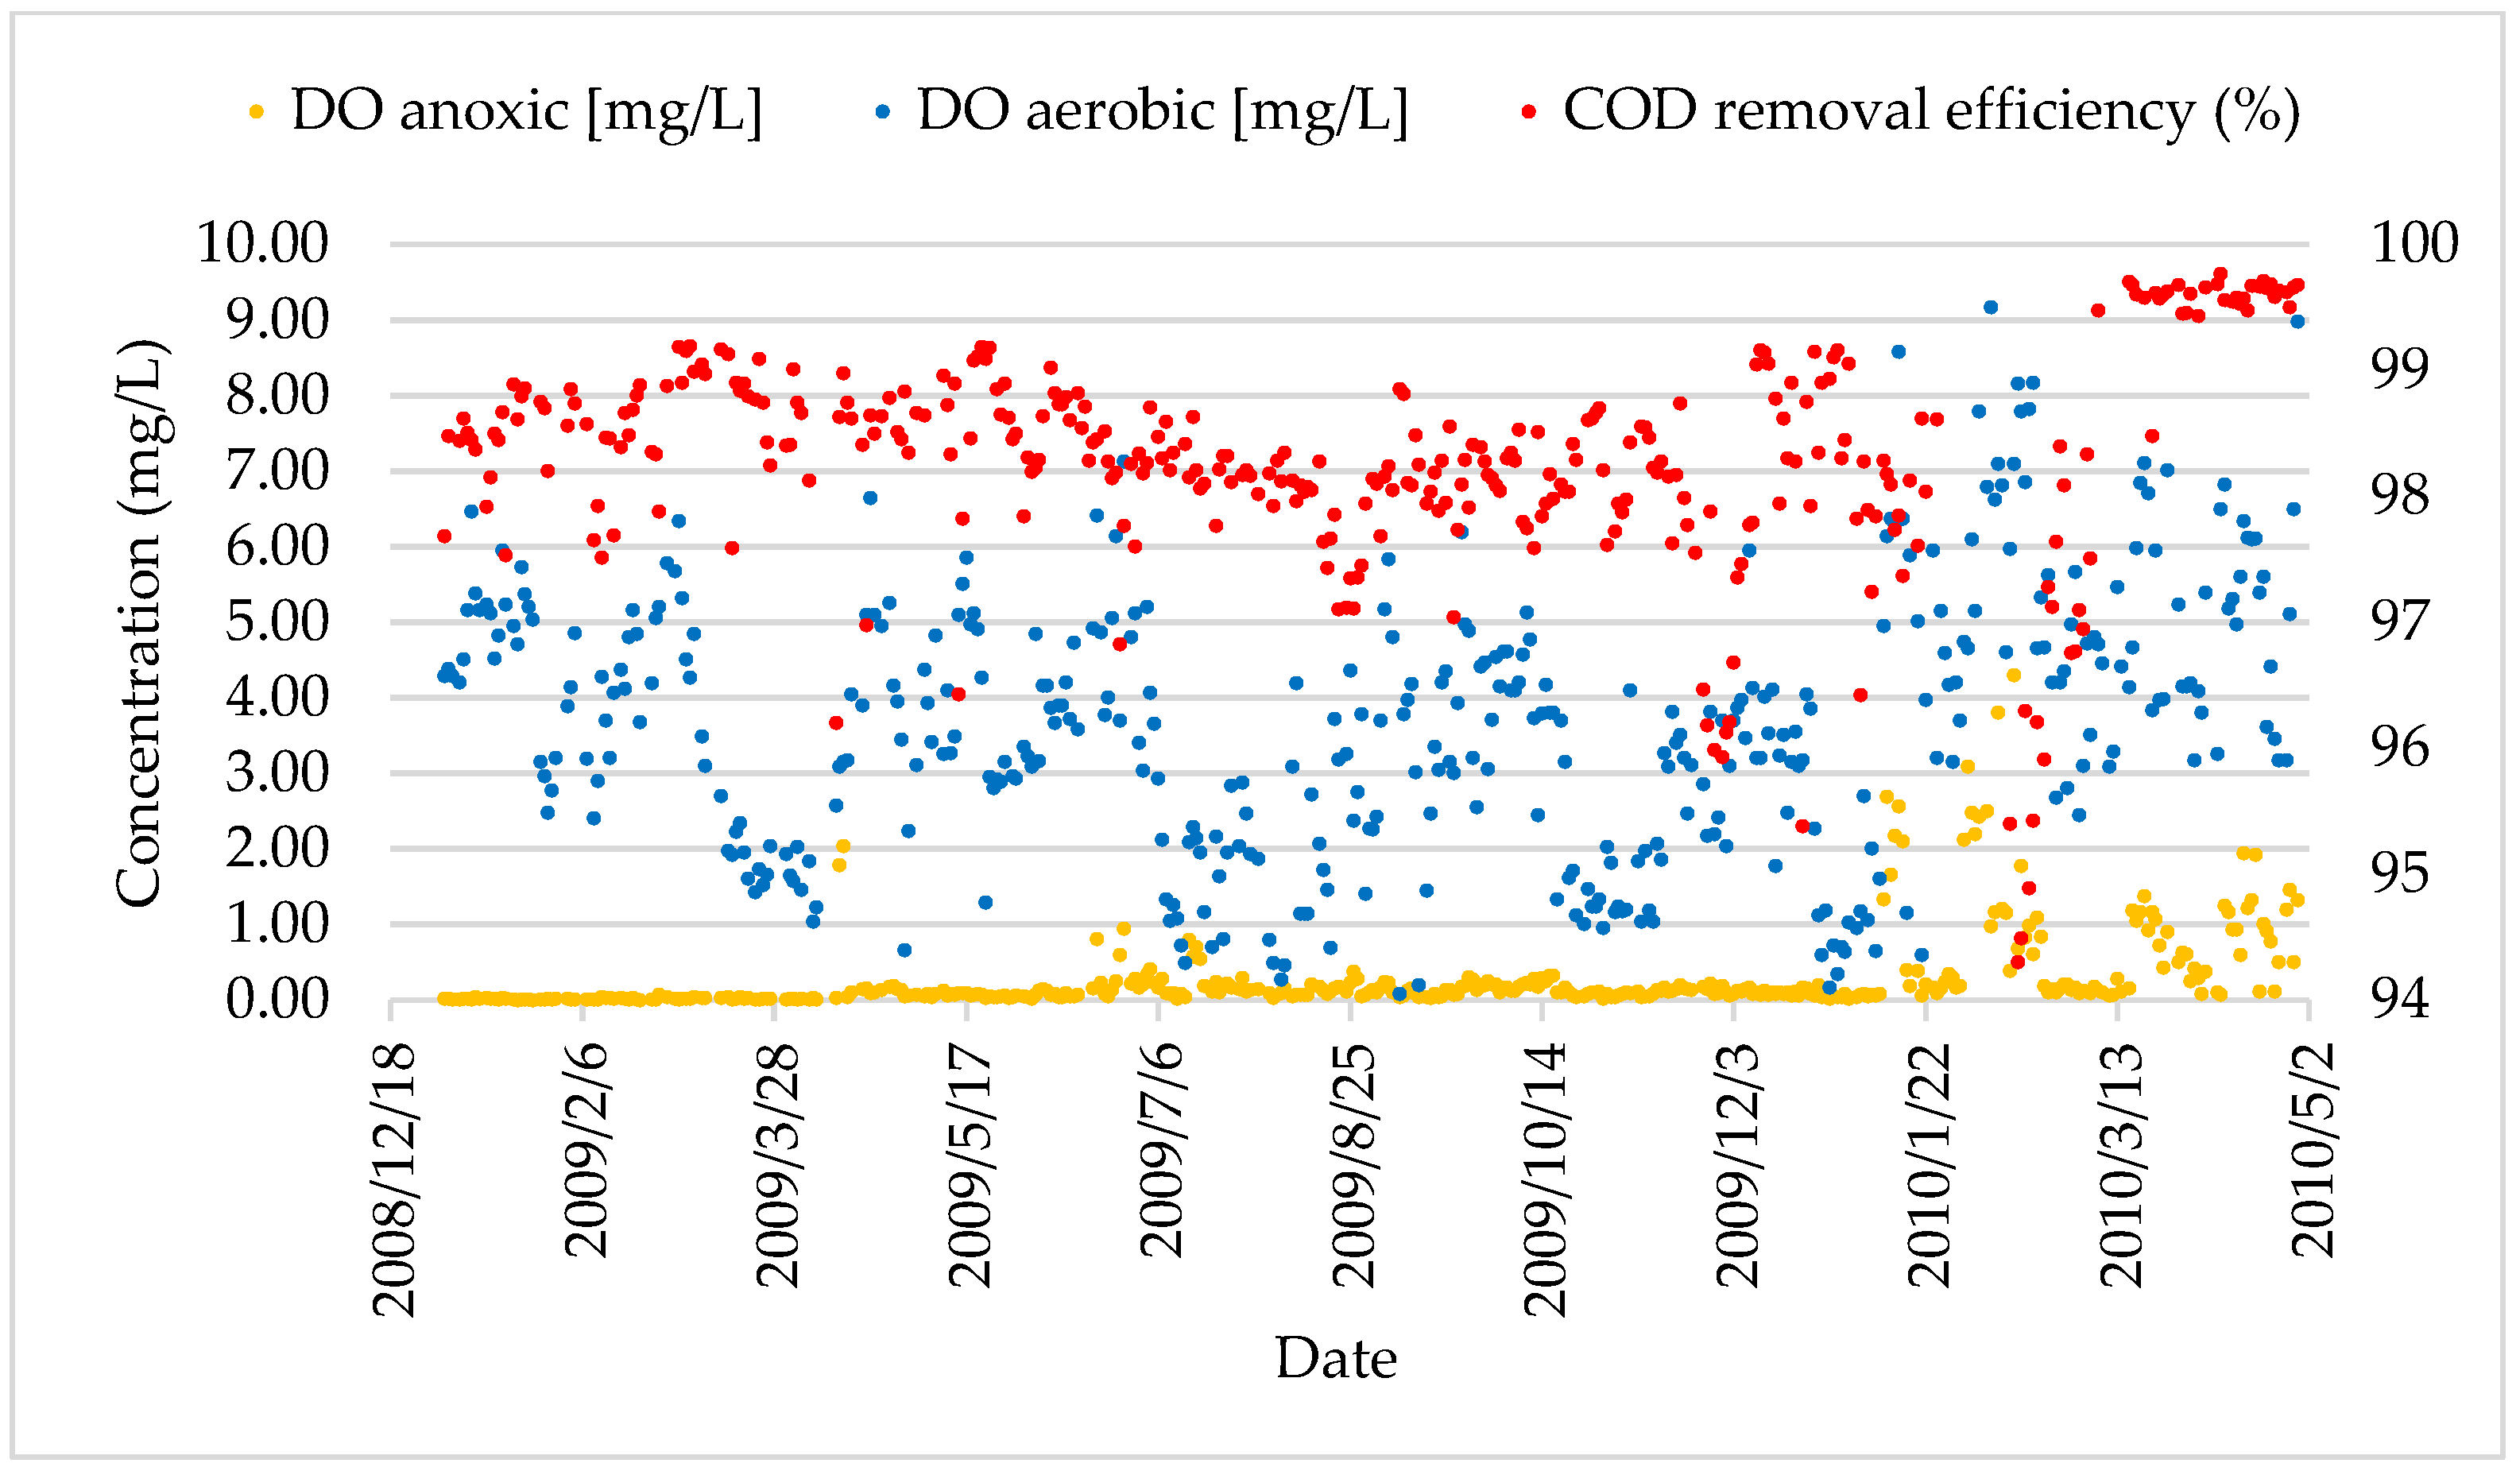
Figure 11.
Relationship between DO values in anoxic and aeration tank with COD removal efficiency.
Figure 11.
Relationship between DO values in anoxic and aeration tank with COD removal efficiency.
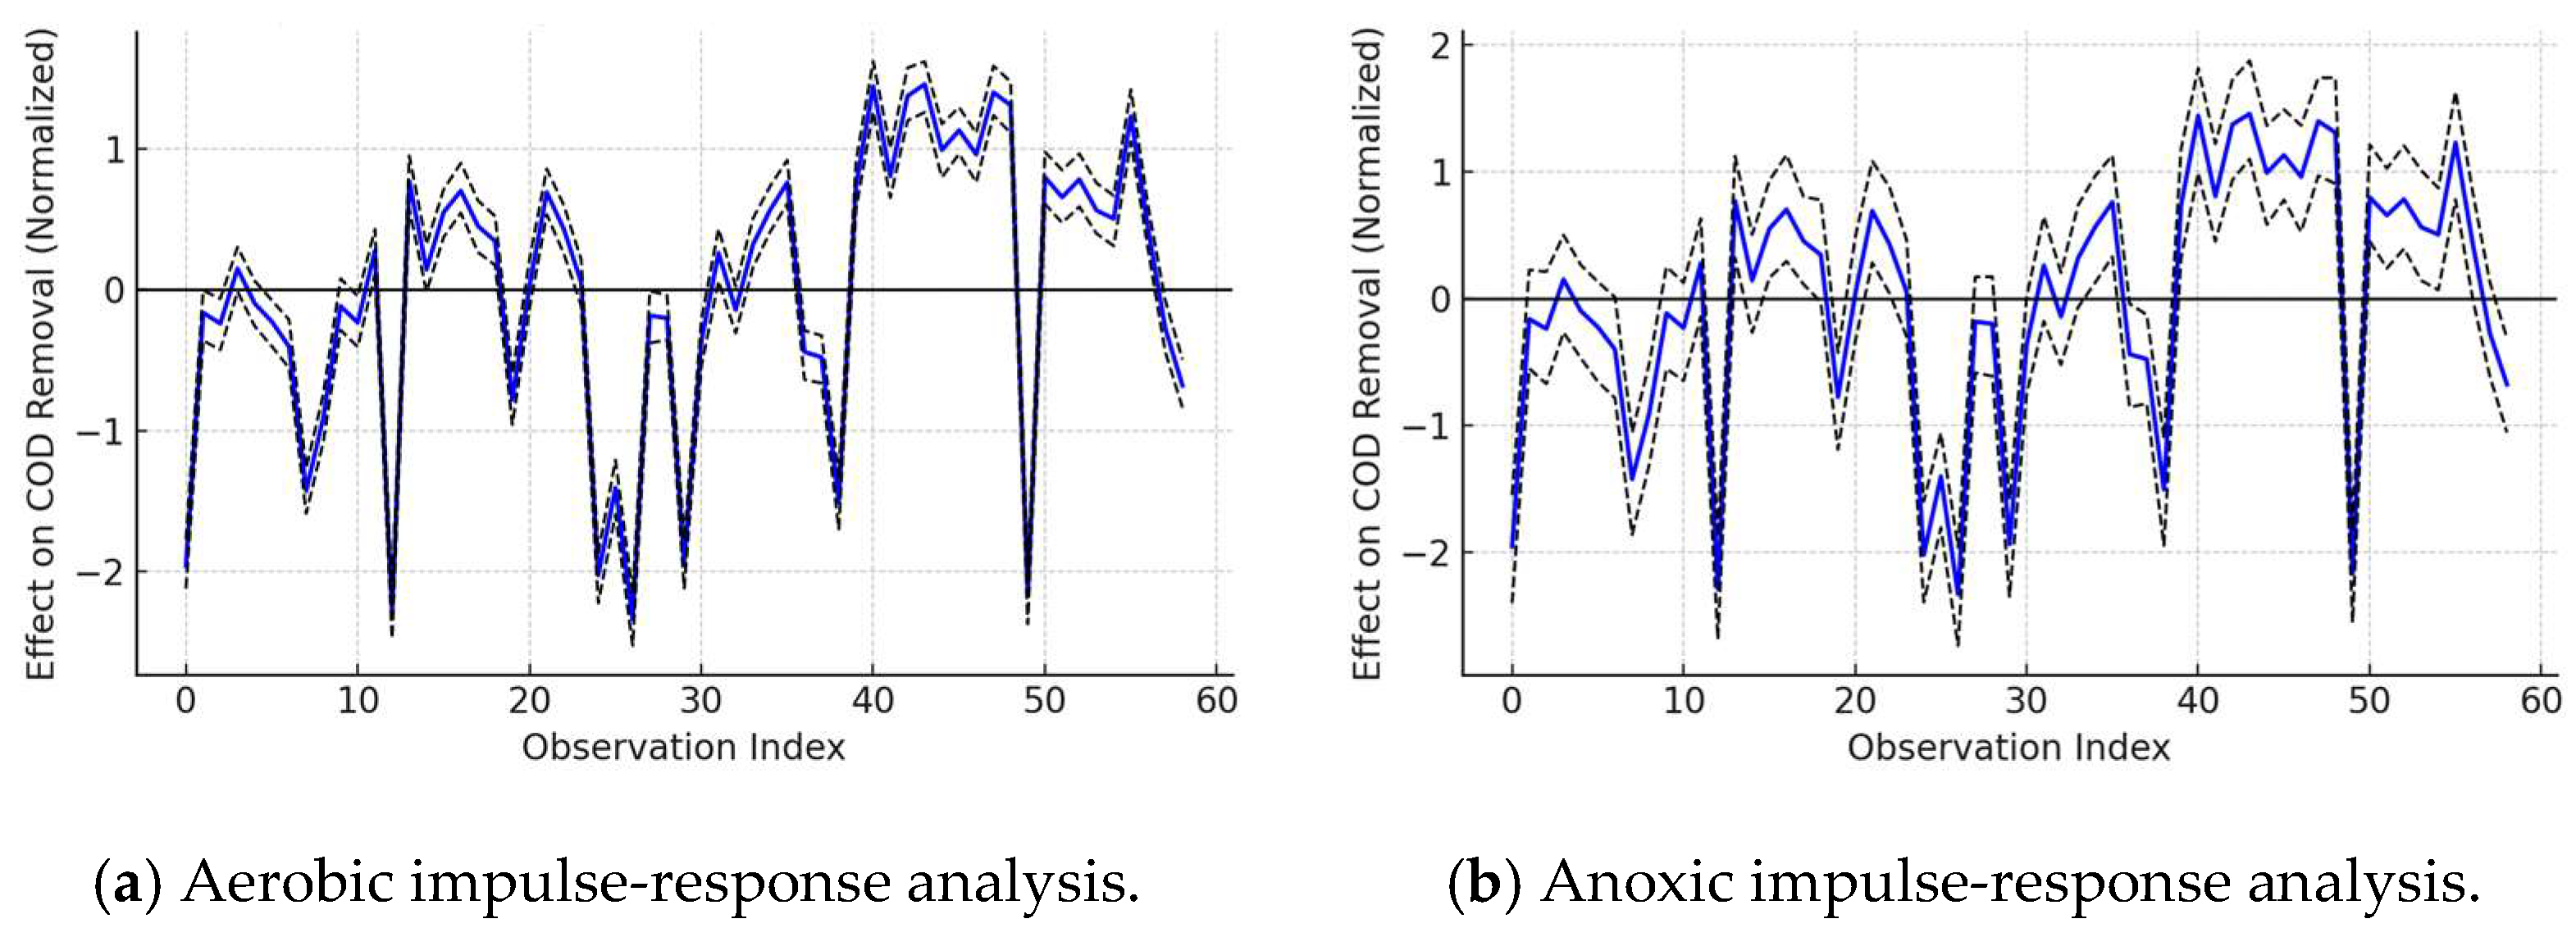
Figure 12.
Effect–response analysis between dissolved oxygen and COD removal efficiency under aerobic and anoxic conditions.
Figure 12.
Effect–response analysis between dissolved oxygen and COD removal efficiency under aerobic and anoxic conditions.
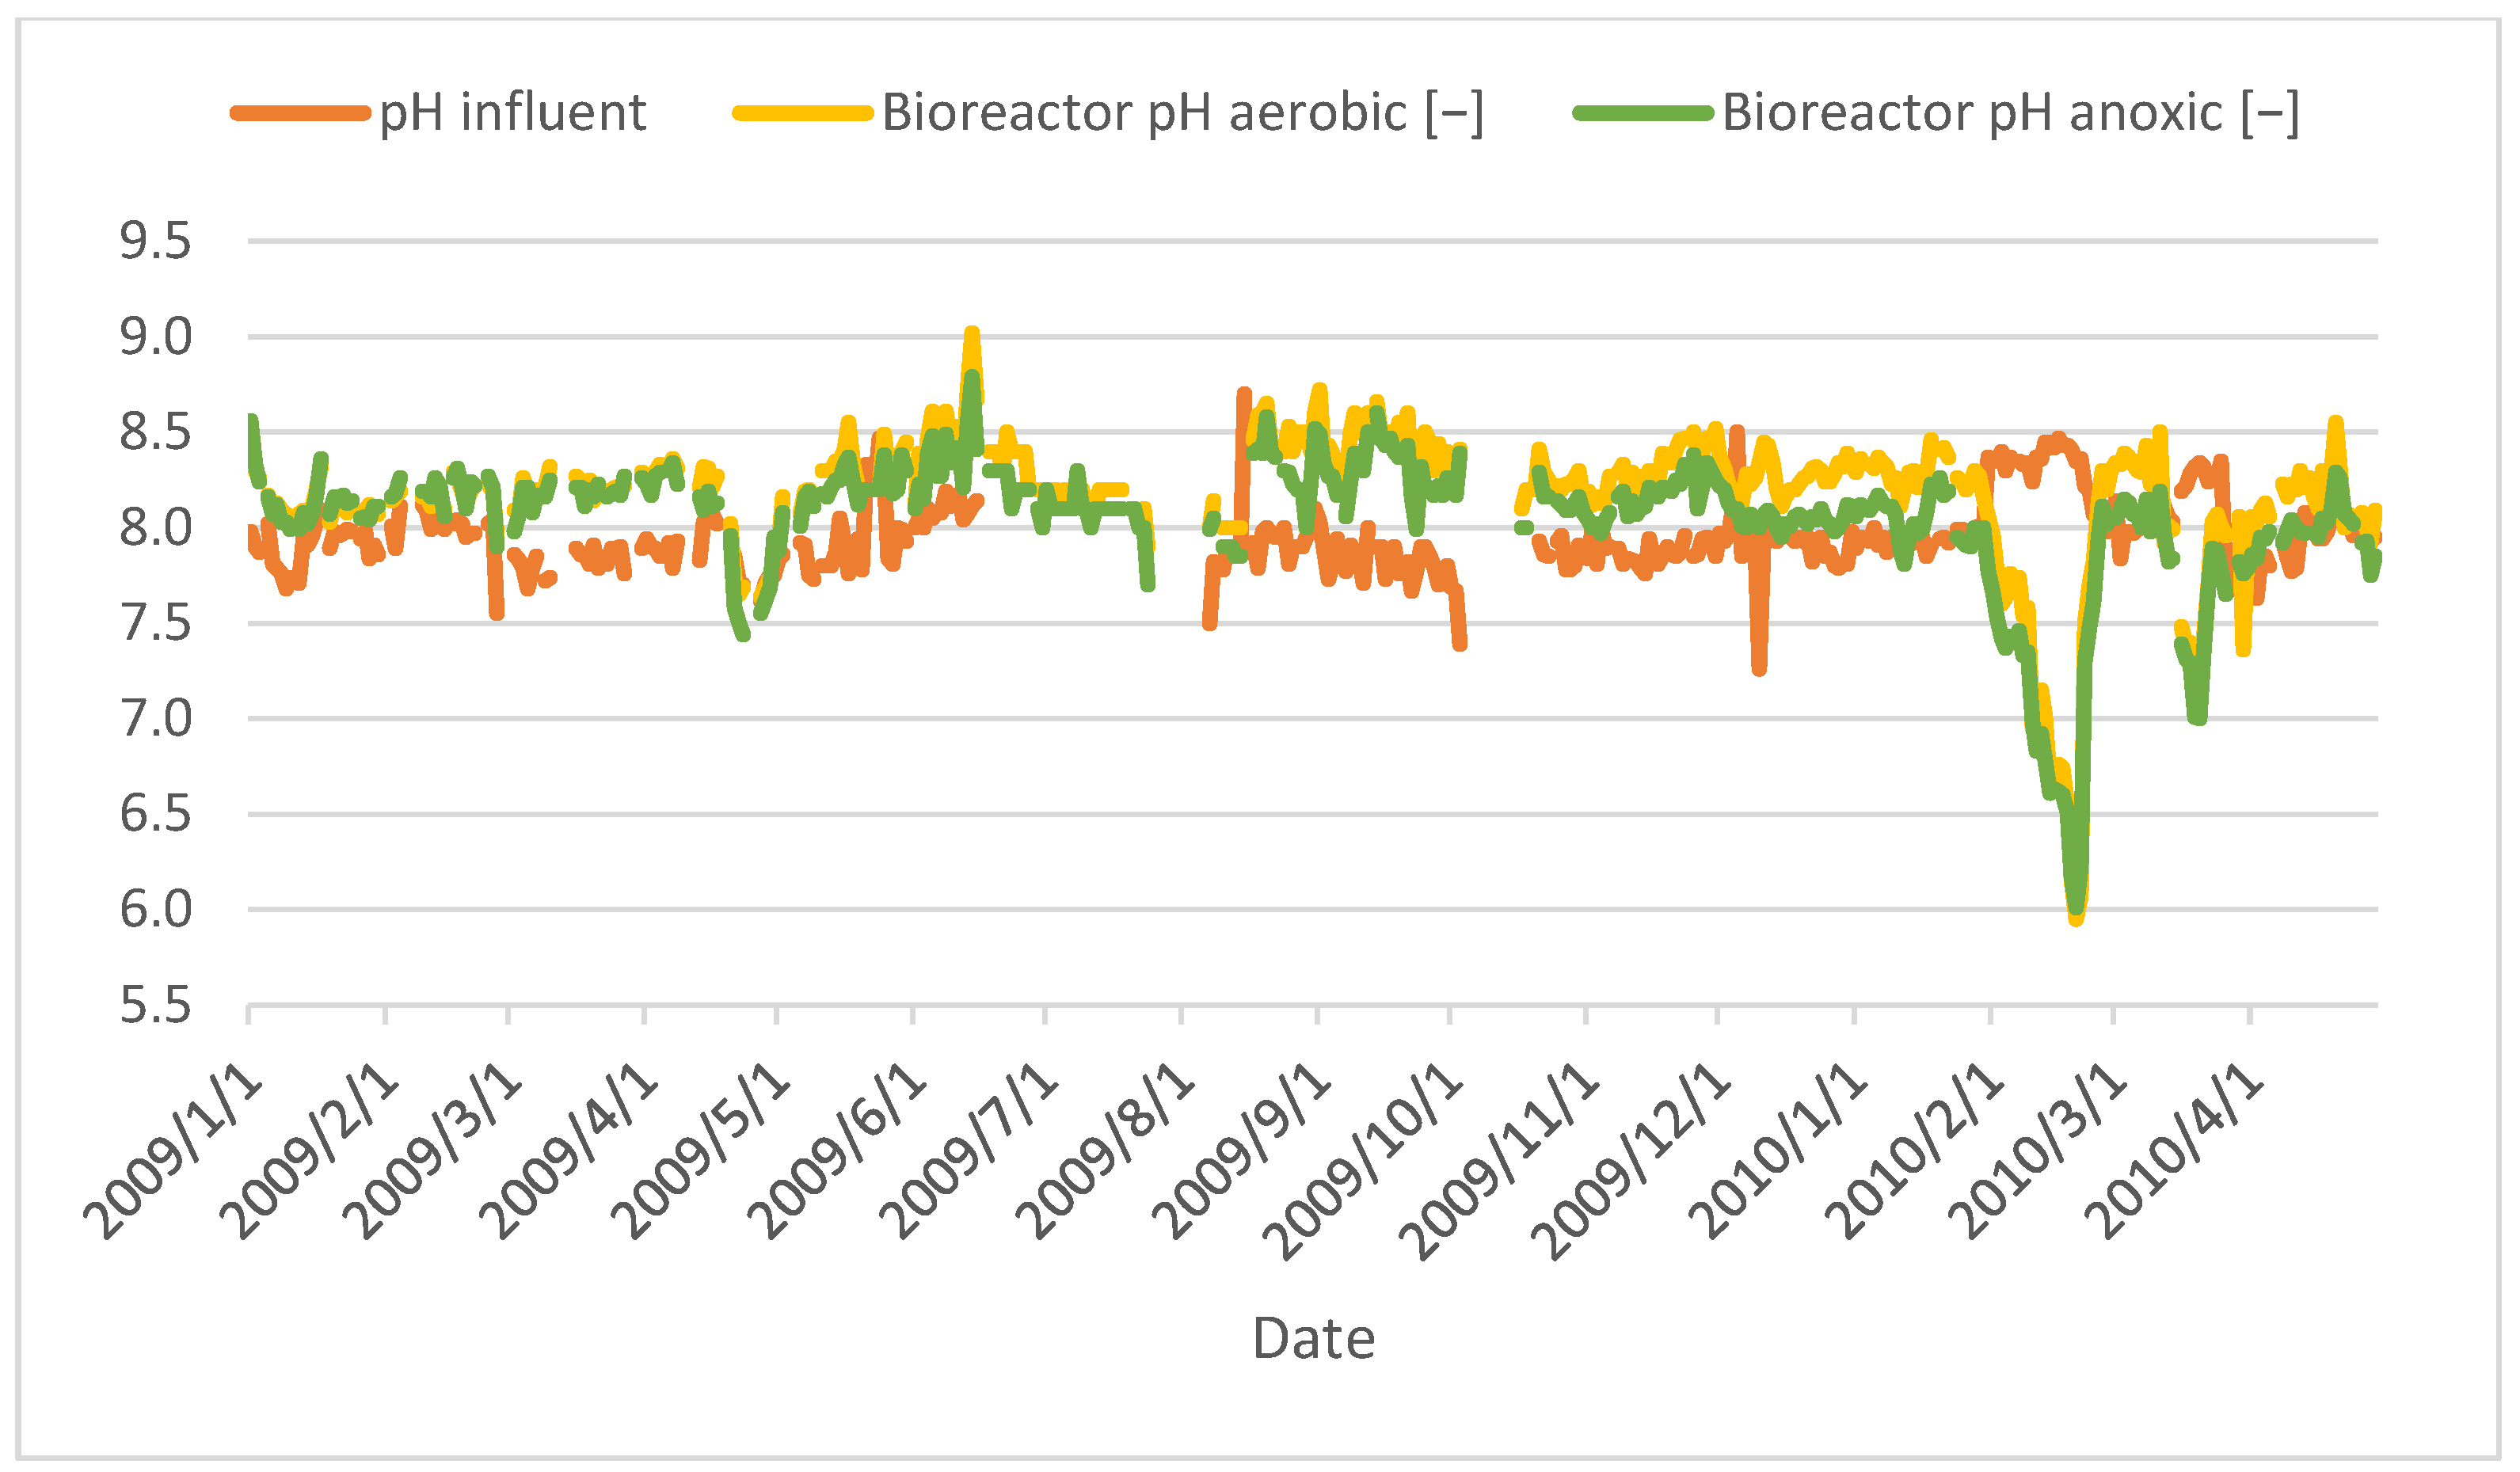
Figure 13.
Variation in pH values of MBR under aerobic and anoxic conditions.
Figure 13.
Variation in pH values of MBR under aerobic and anoxic conditions.
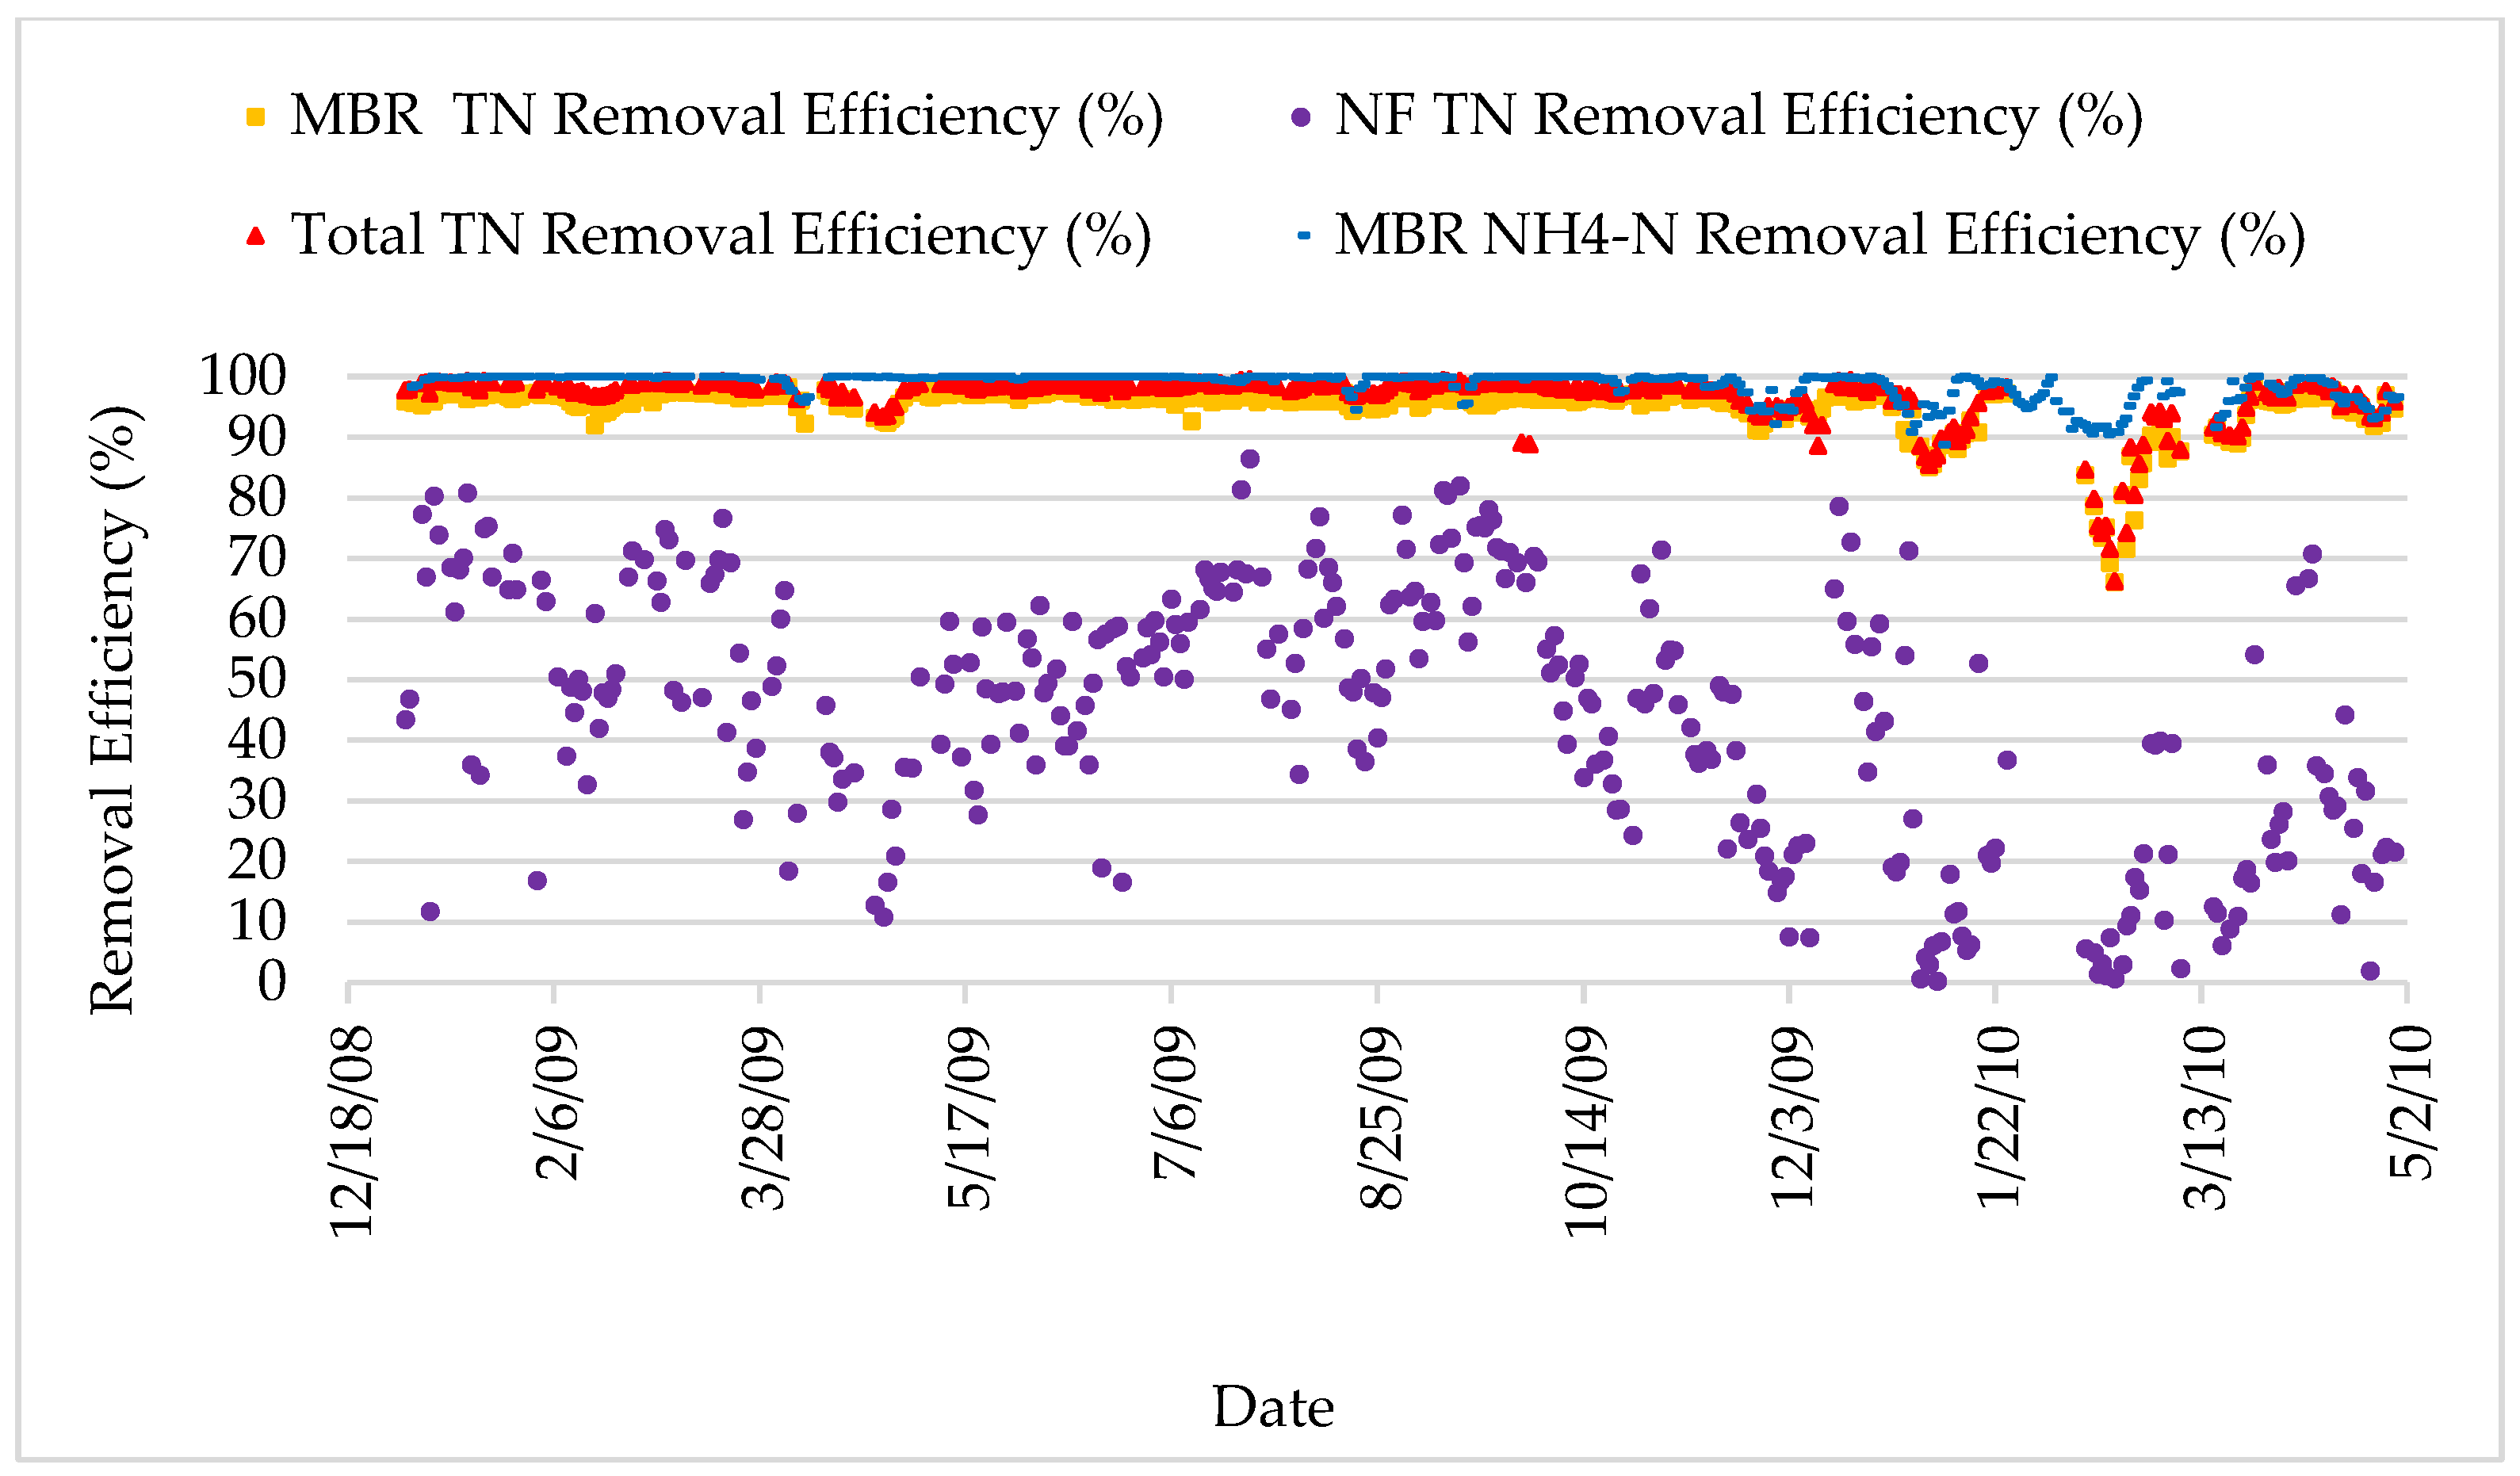
Figure 14.
Total nitrogen and ammonium nitrogen removal efficiency.
Figure 14.
Total nitrogen and ammonium nitrogen removal efficiency.
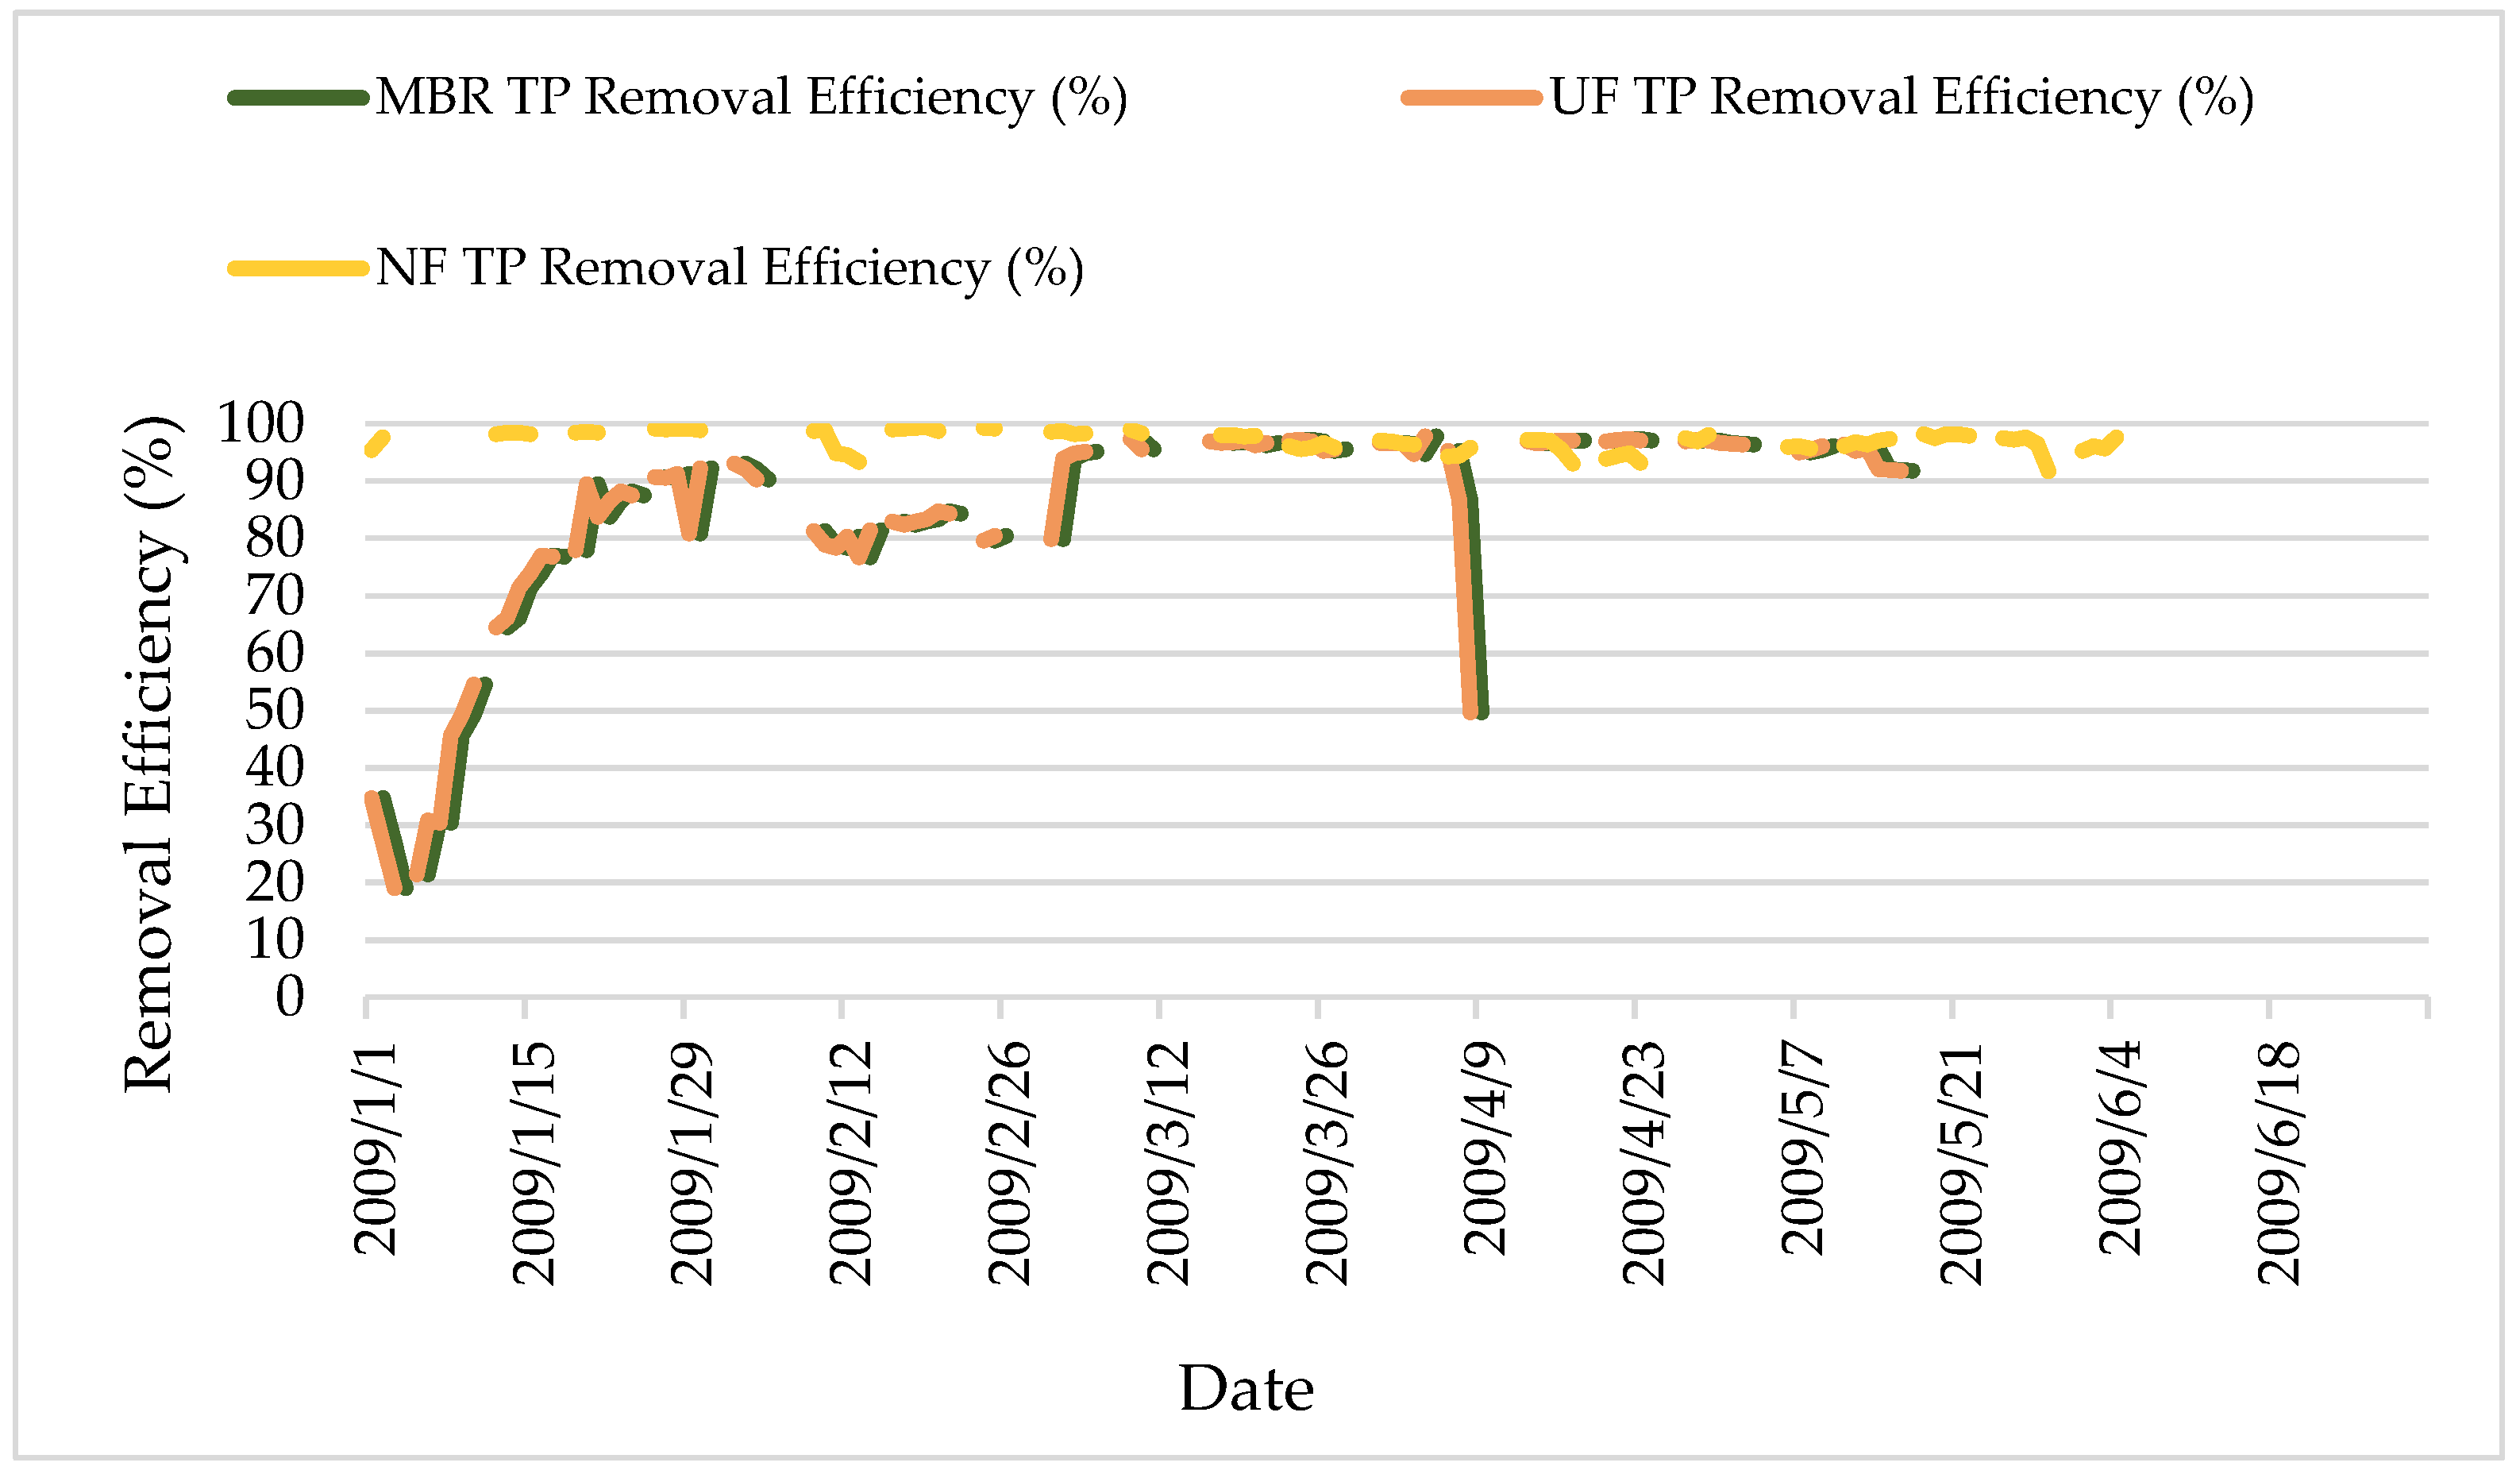
Figure 15.
TP removal efficiency.
Figure 15.
TP removal efficiency.
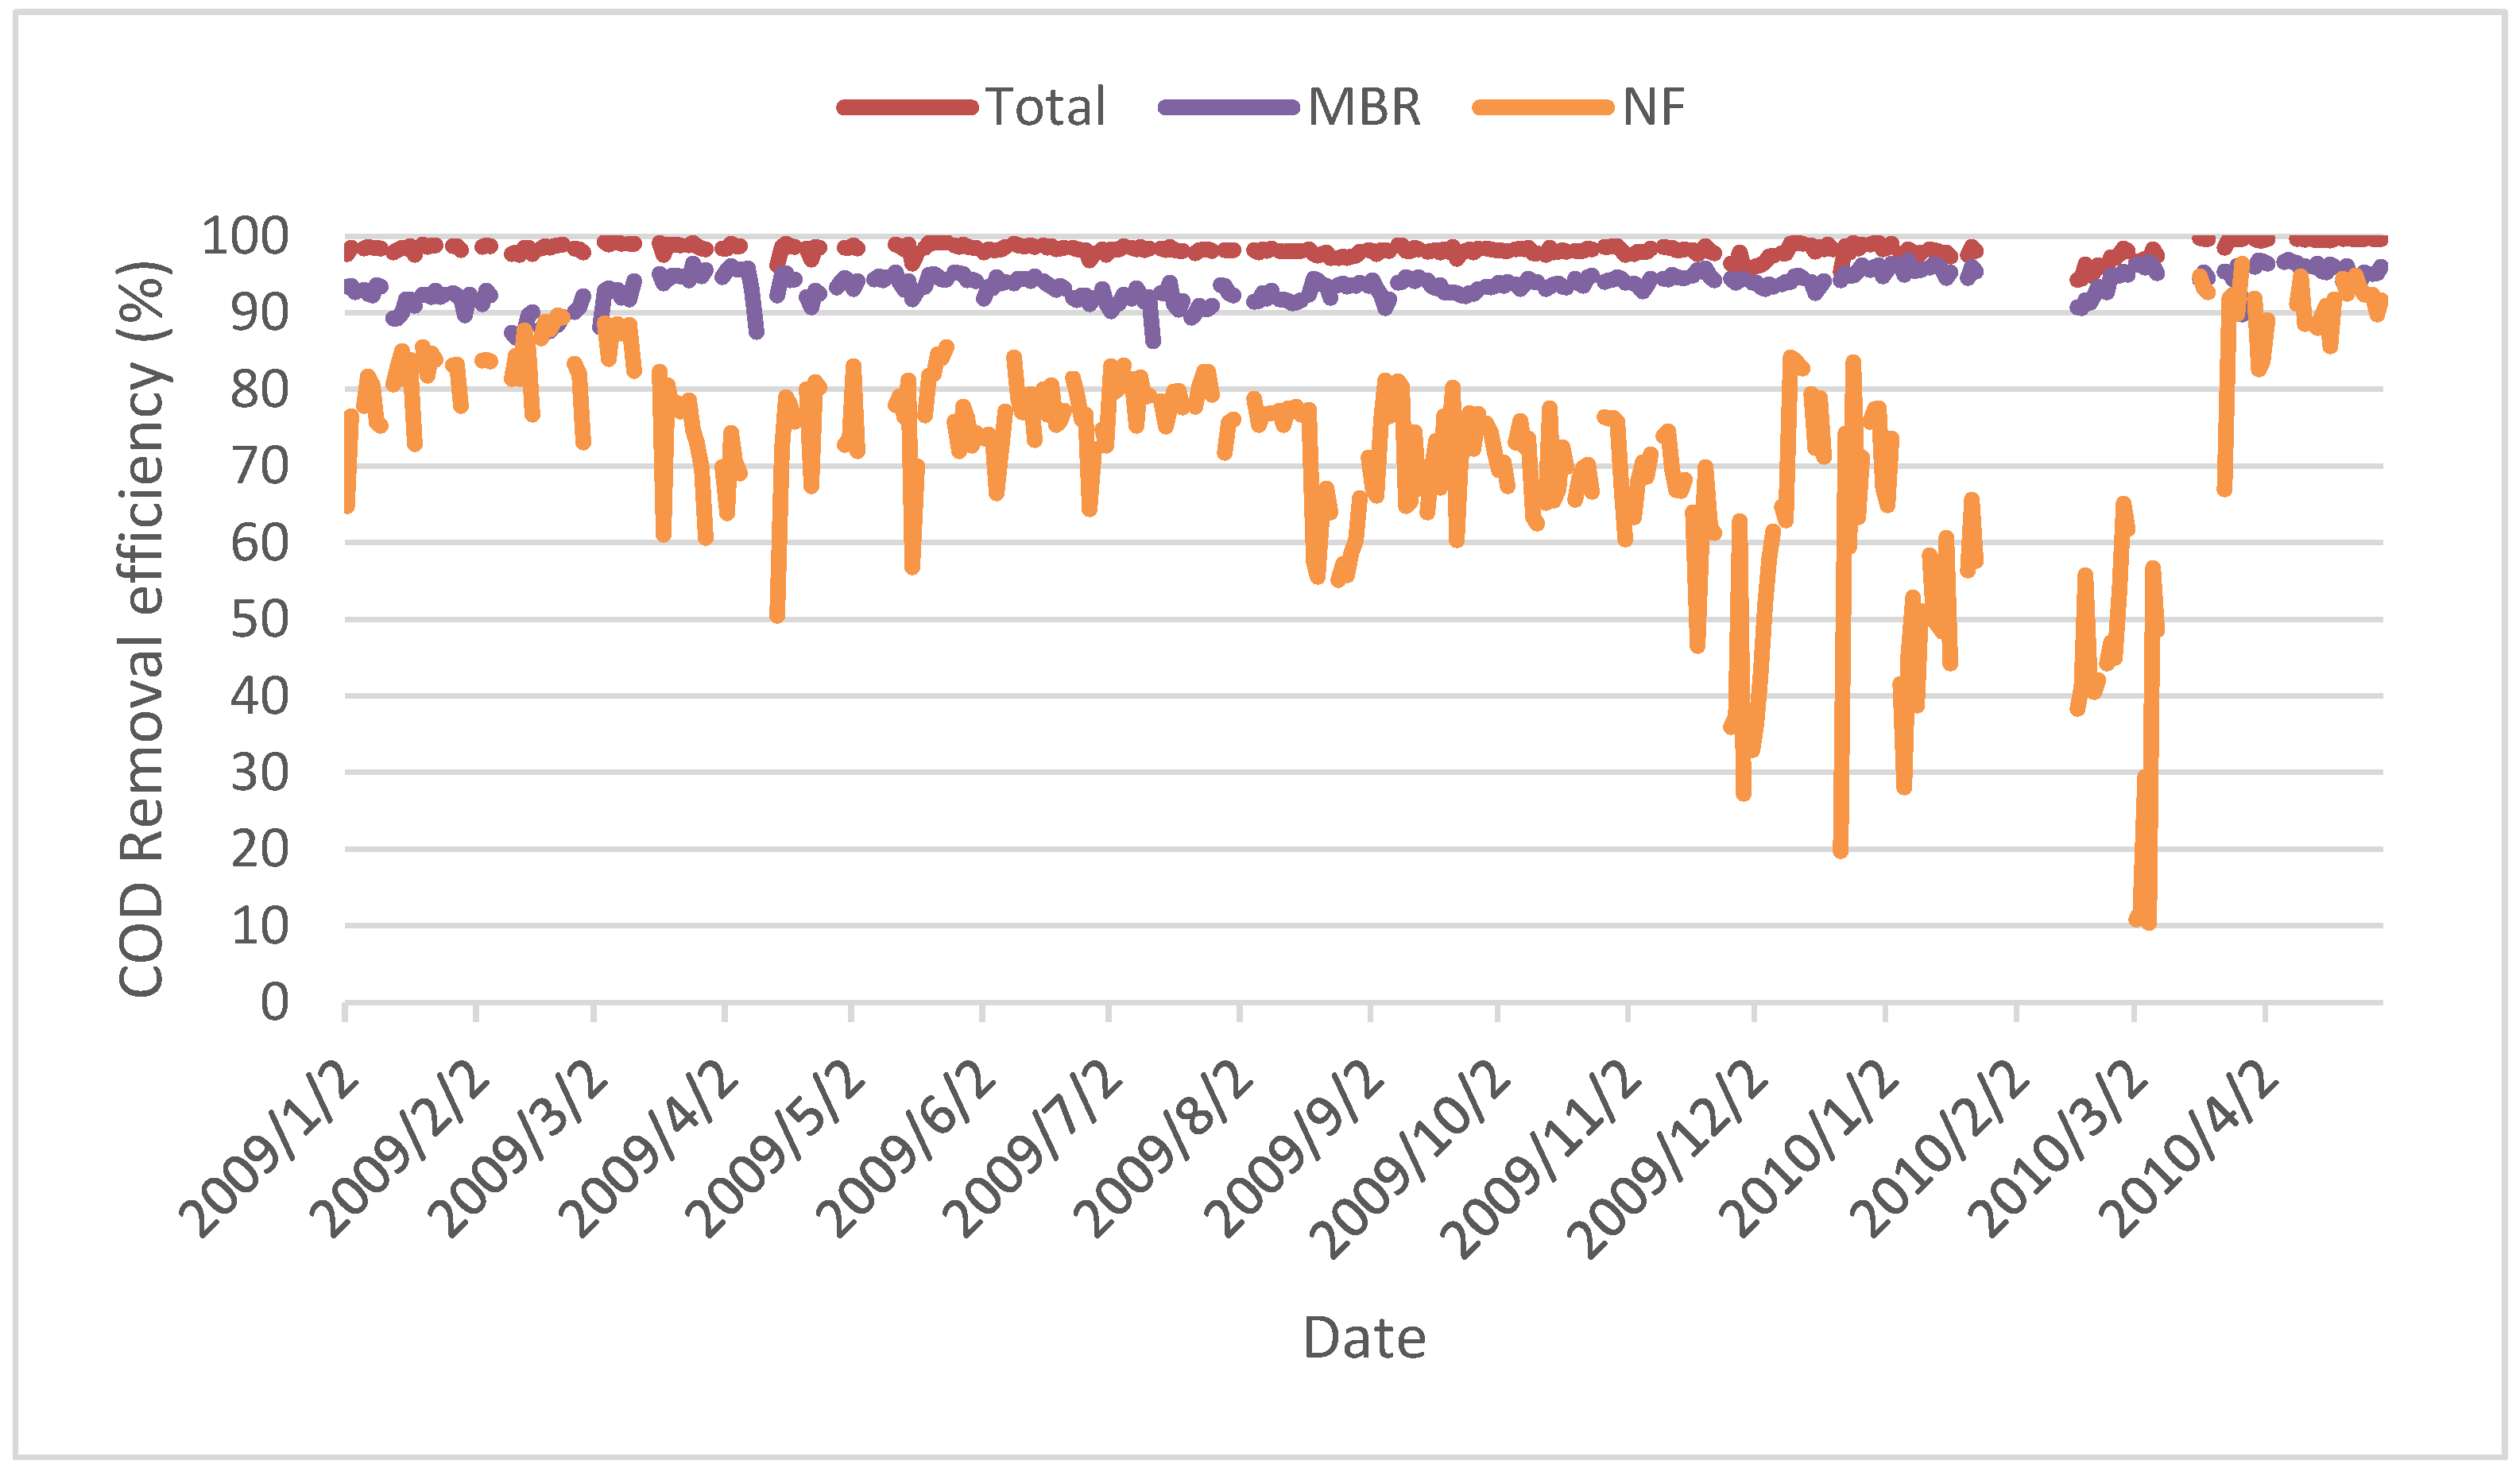
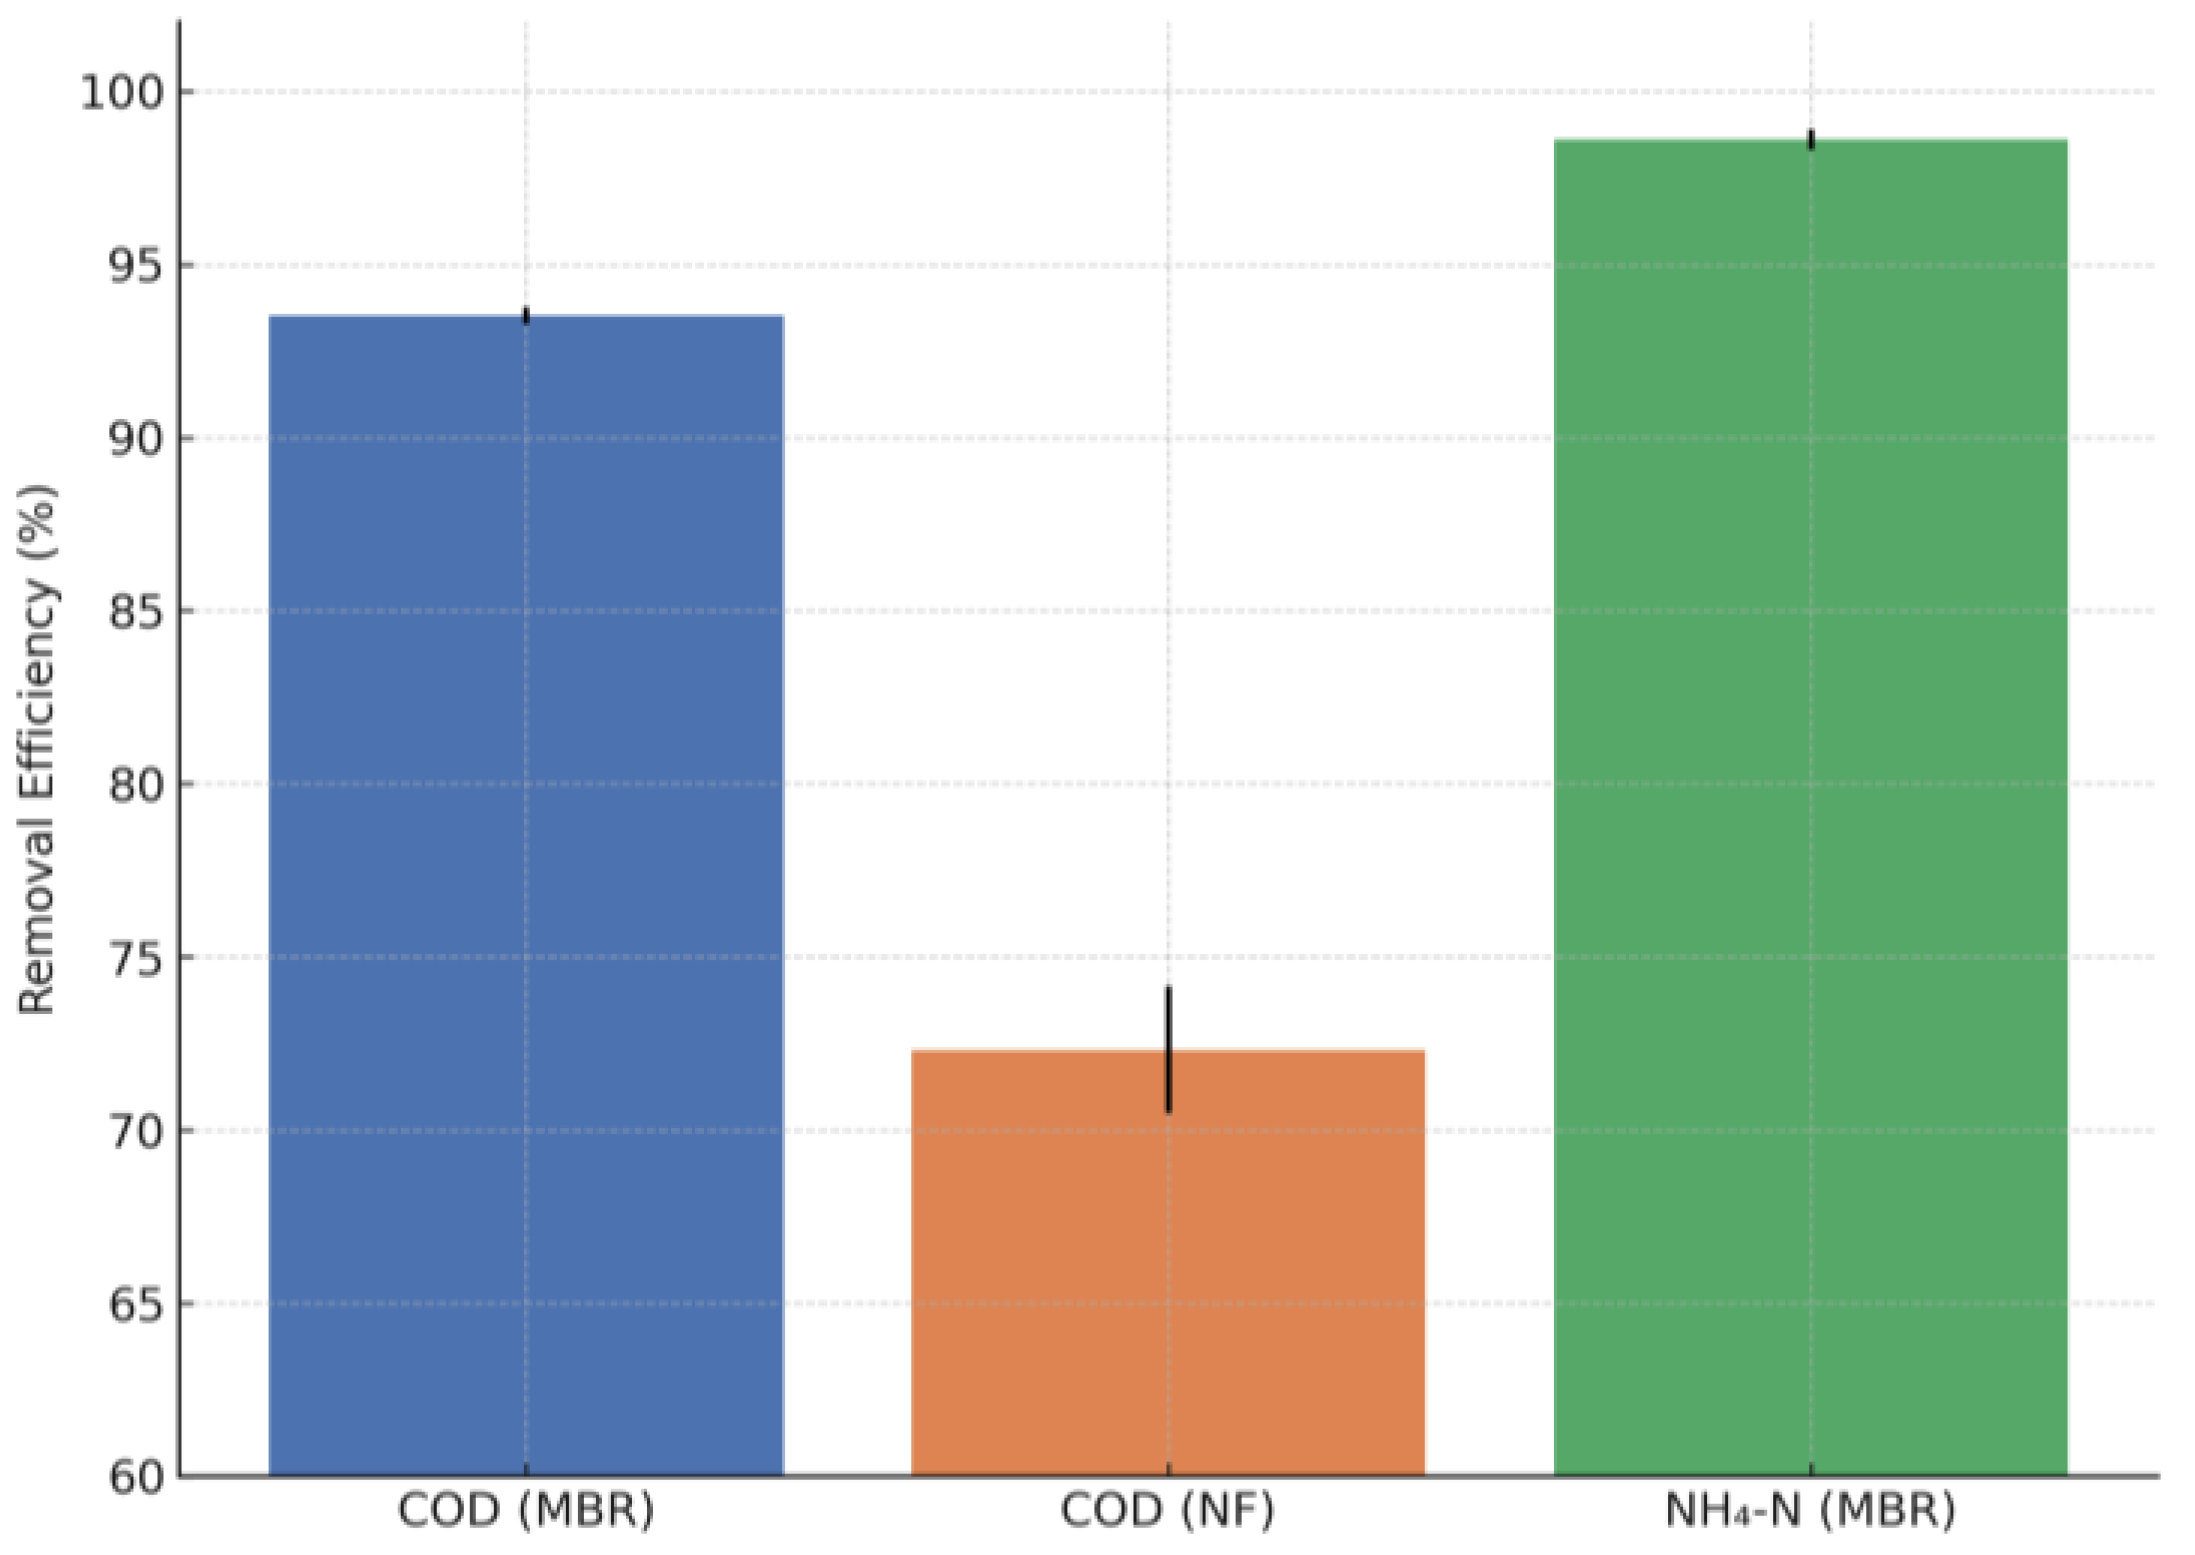
Figure 16.
COD removal efficiencies of MBR, NF and total system.
Figure 16.
COD removal efficiencies of MBR, NF and total system.
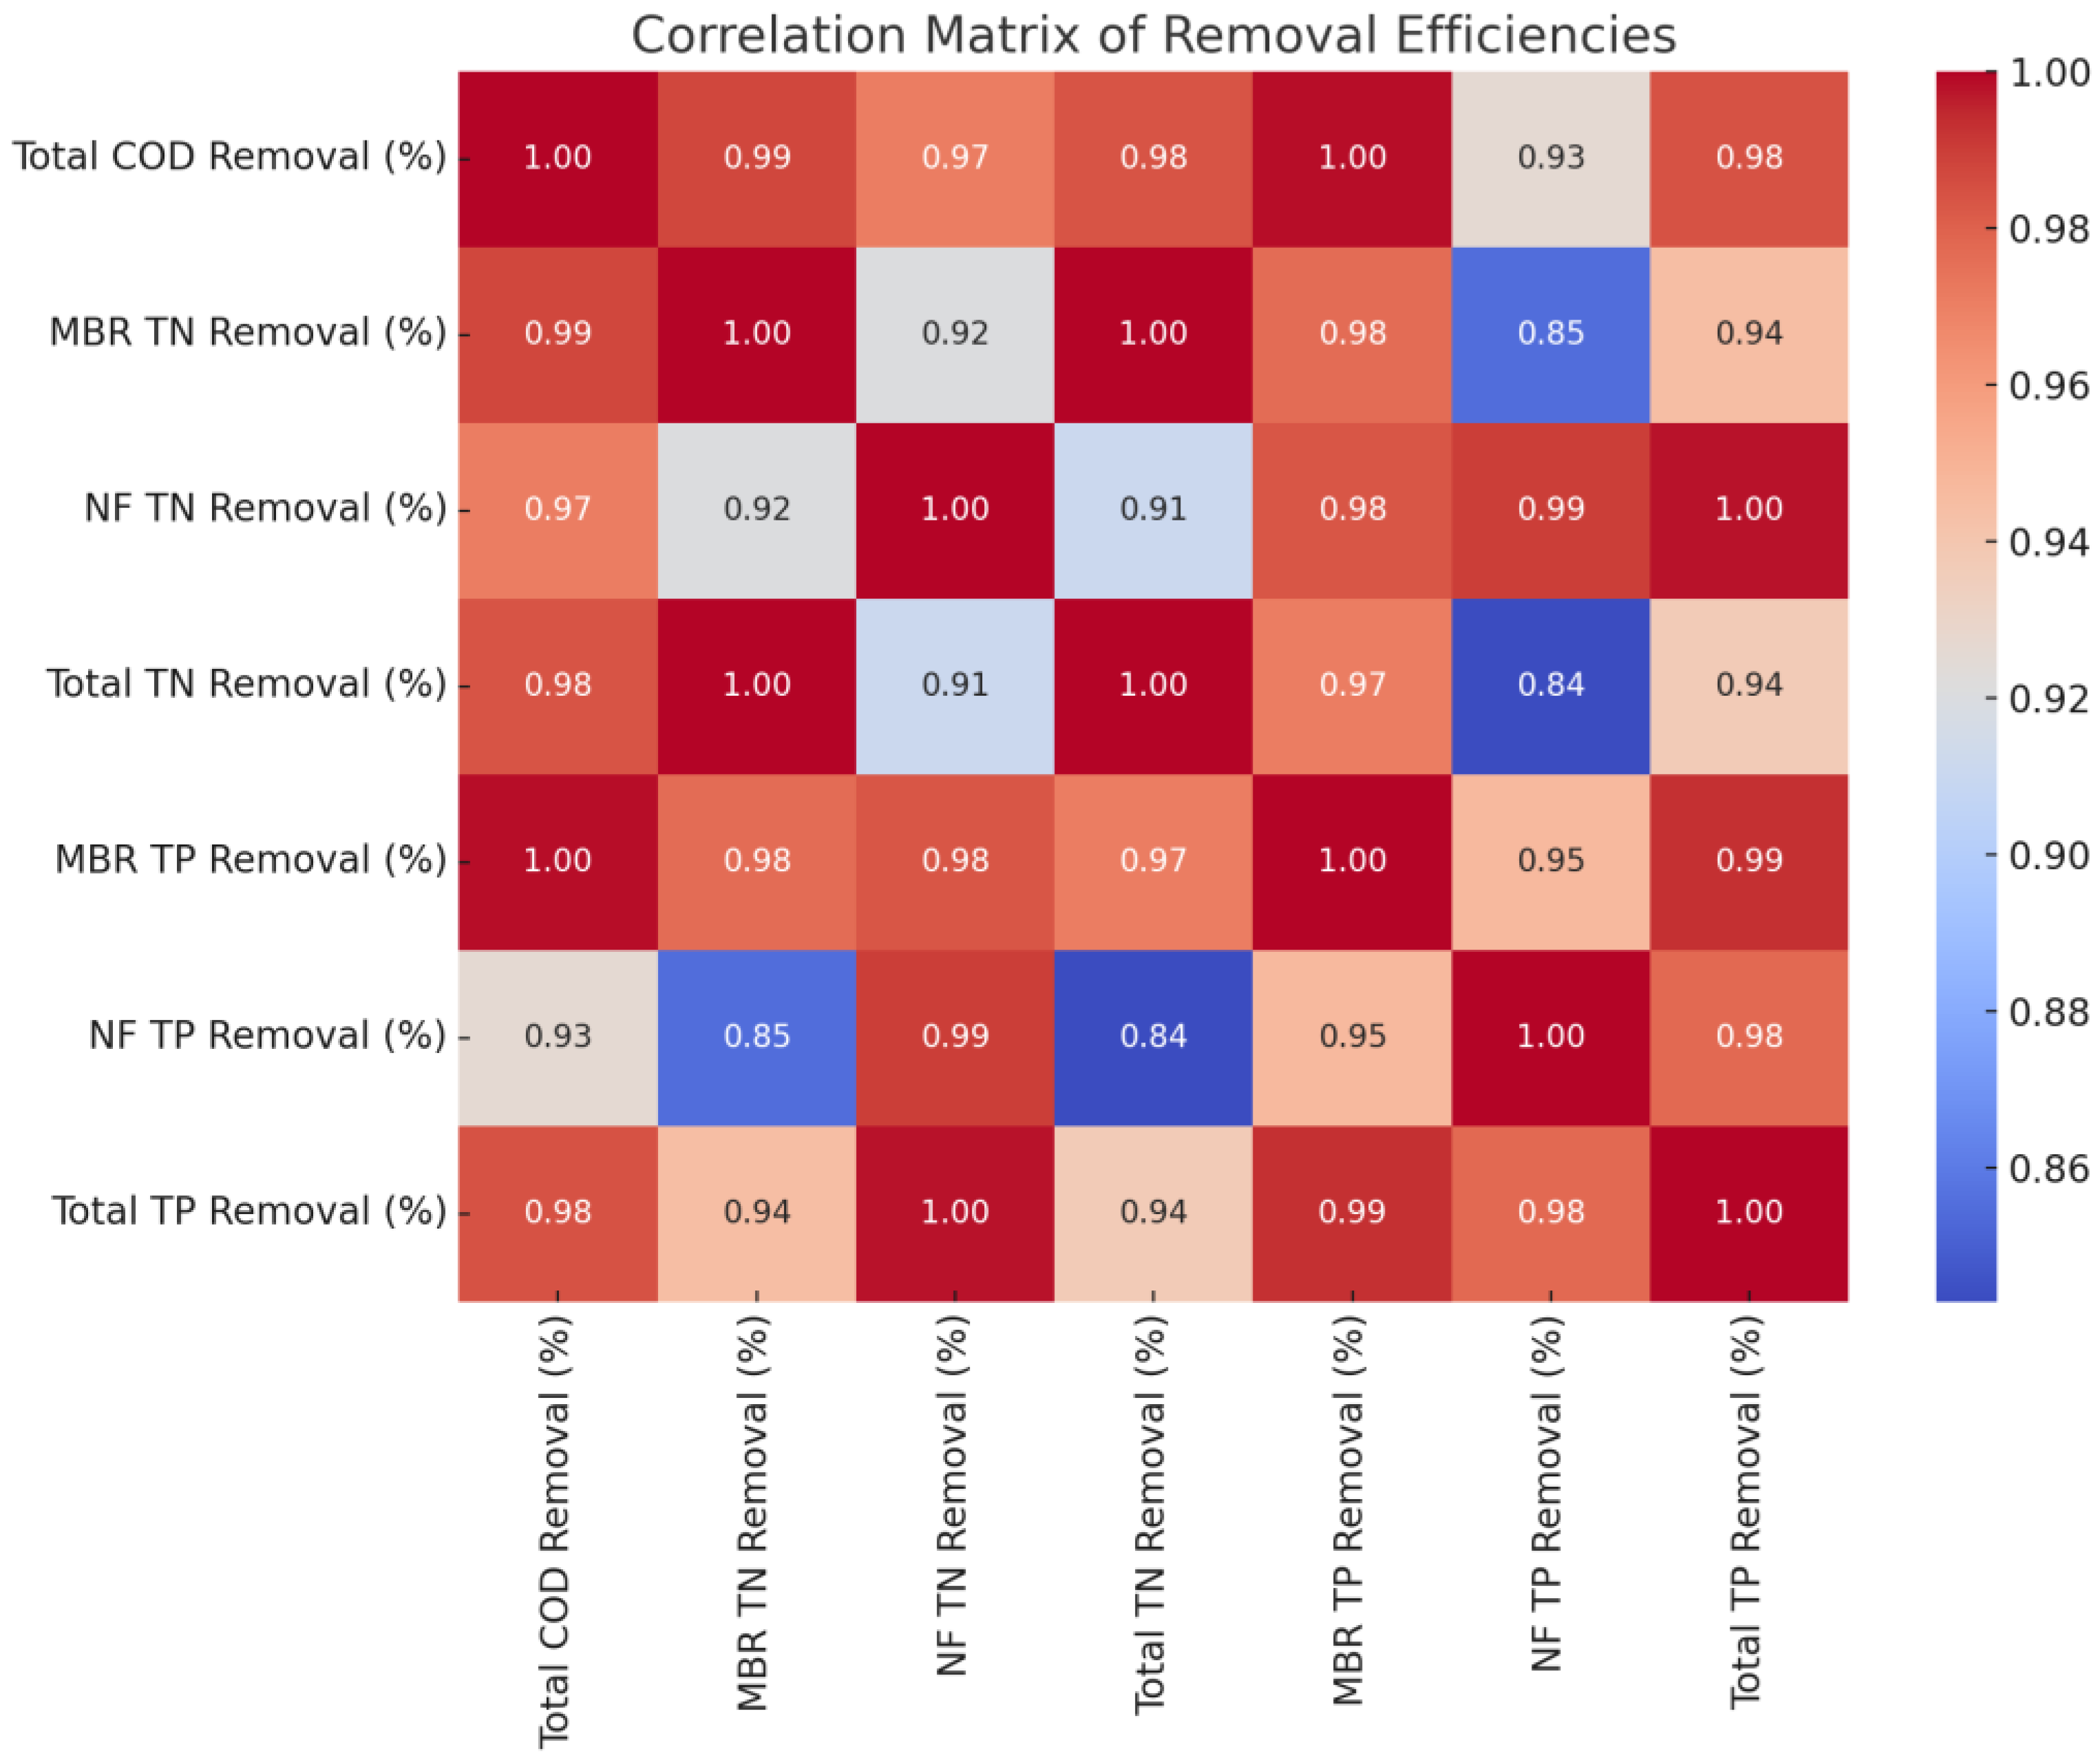
Figure 17.
The correlation matrix between the total COD, TN and TP removal efficiencies.
Figure 17.
The correlation matrix between the total COD, TN and TP removal efficiencies.
Figure 18.
Statistical analyses of the removal efficiencies of MBR and NF.
Figure 18.
Statistical analyses of the removal efficiencies of MBR and NF.
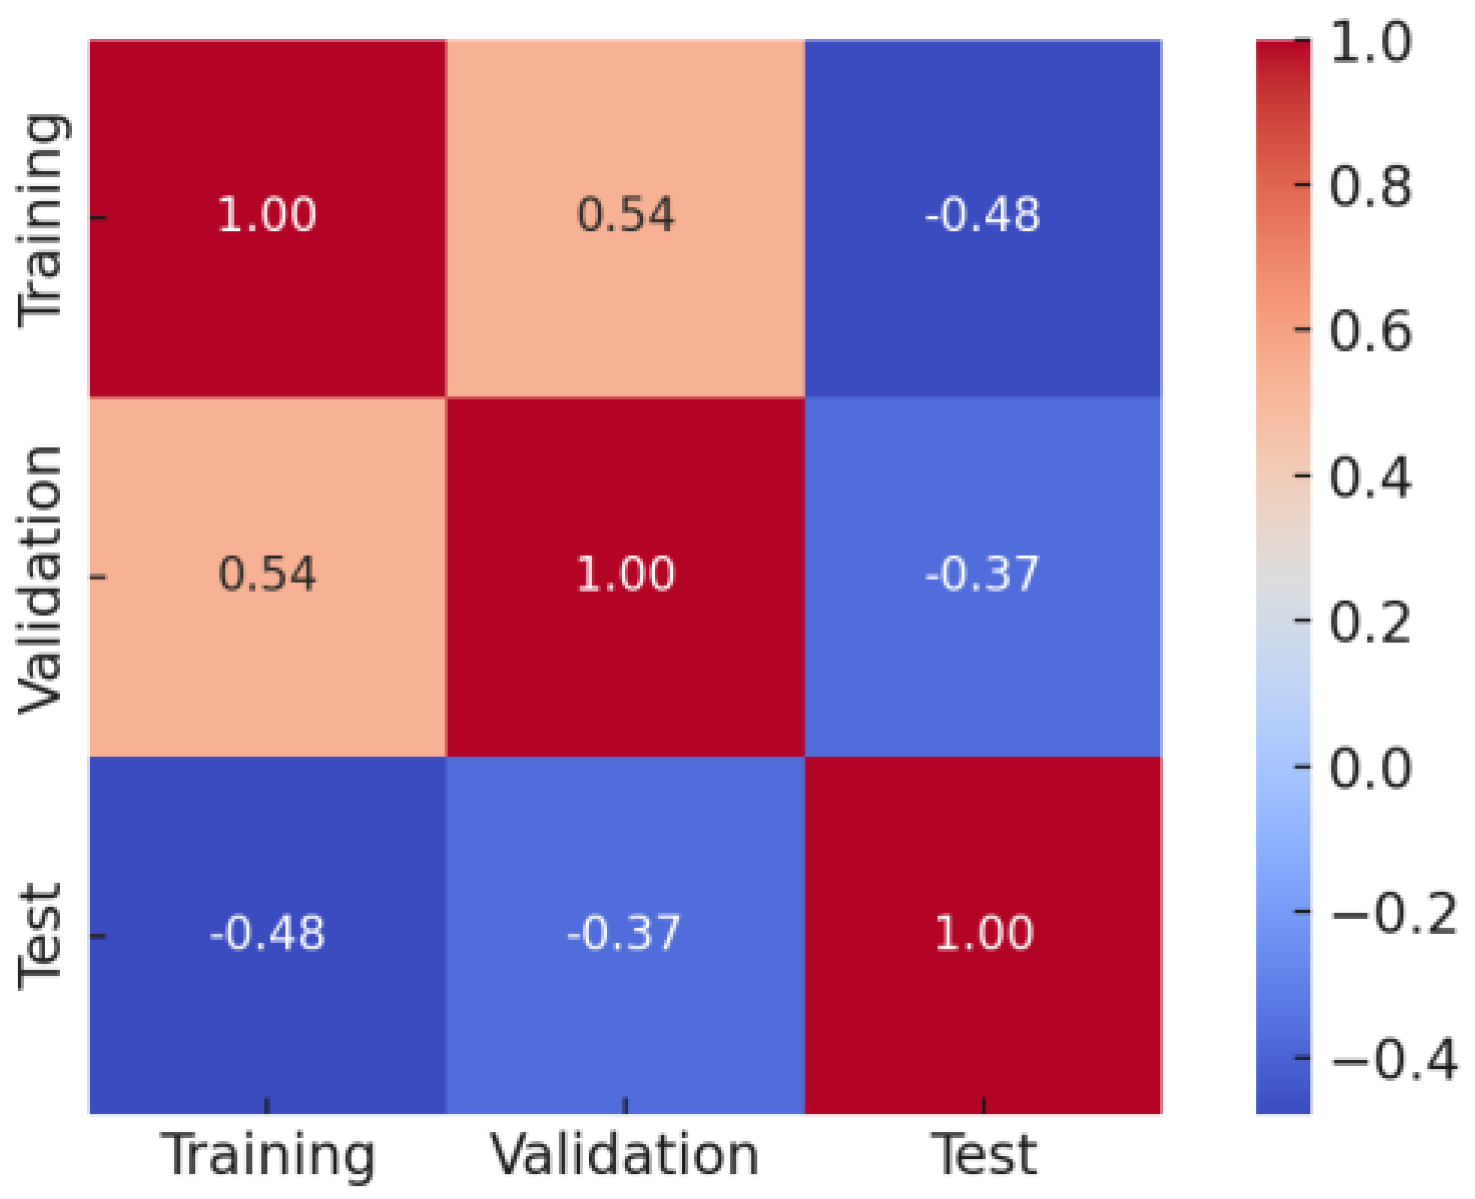
Figure 19.
Correlation matrix of MSE values for CODeffluent prediction.
Figure 19.
Correlation matrix of MSE values for CODeffluent prediction.
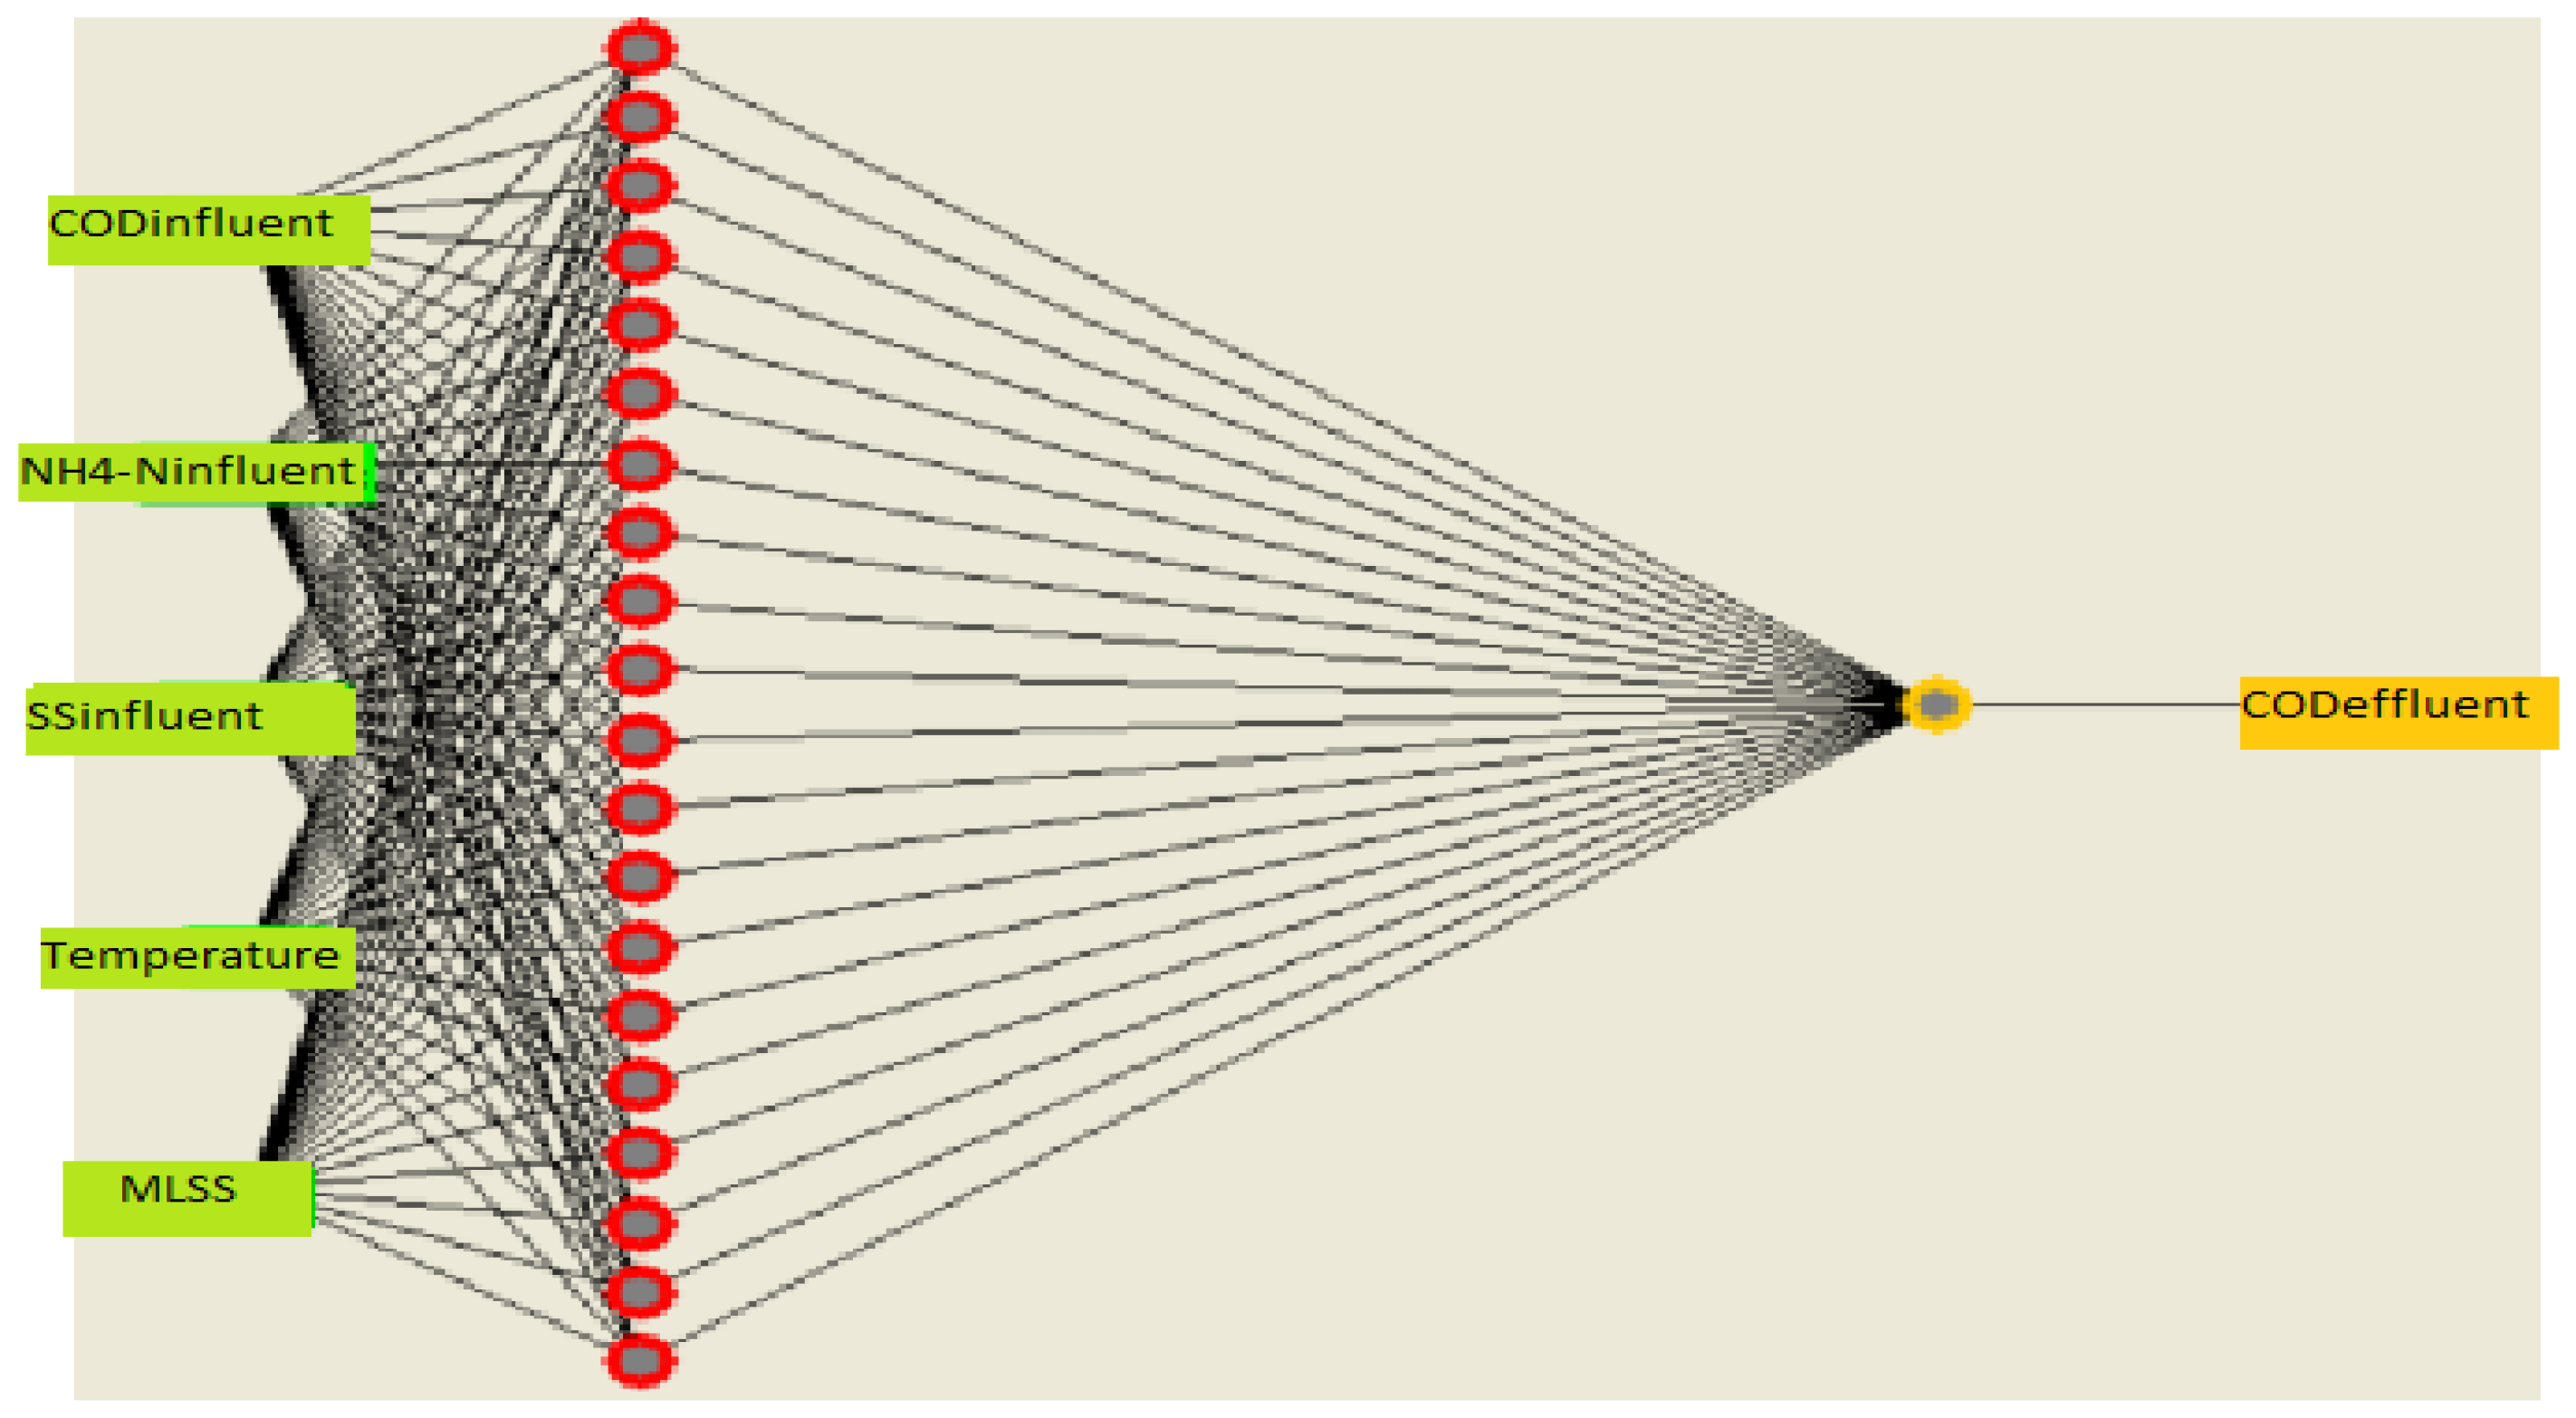
Figure 20.
ANN Model No.1 architecture for COD prediction.
Figure 20.
ANN Model No.1 architecture for COD prediction.
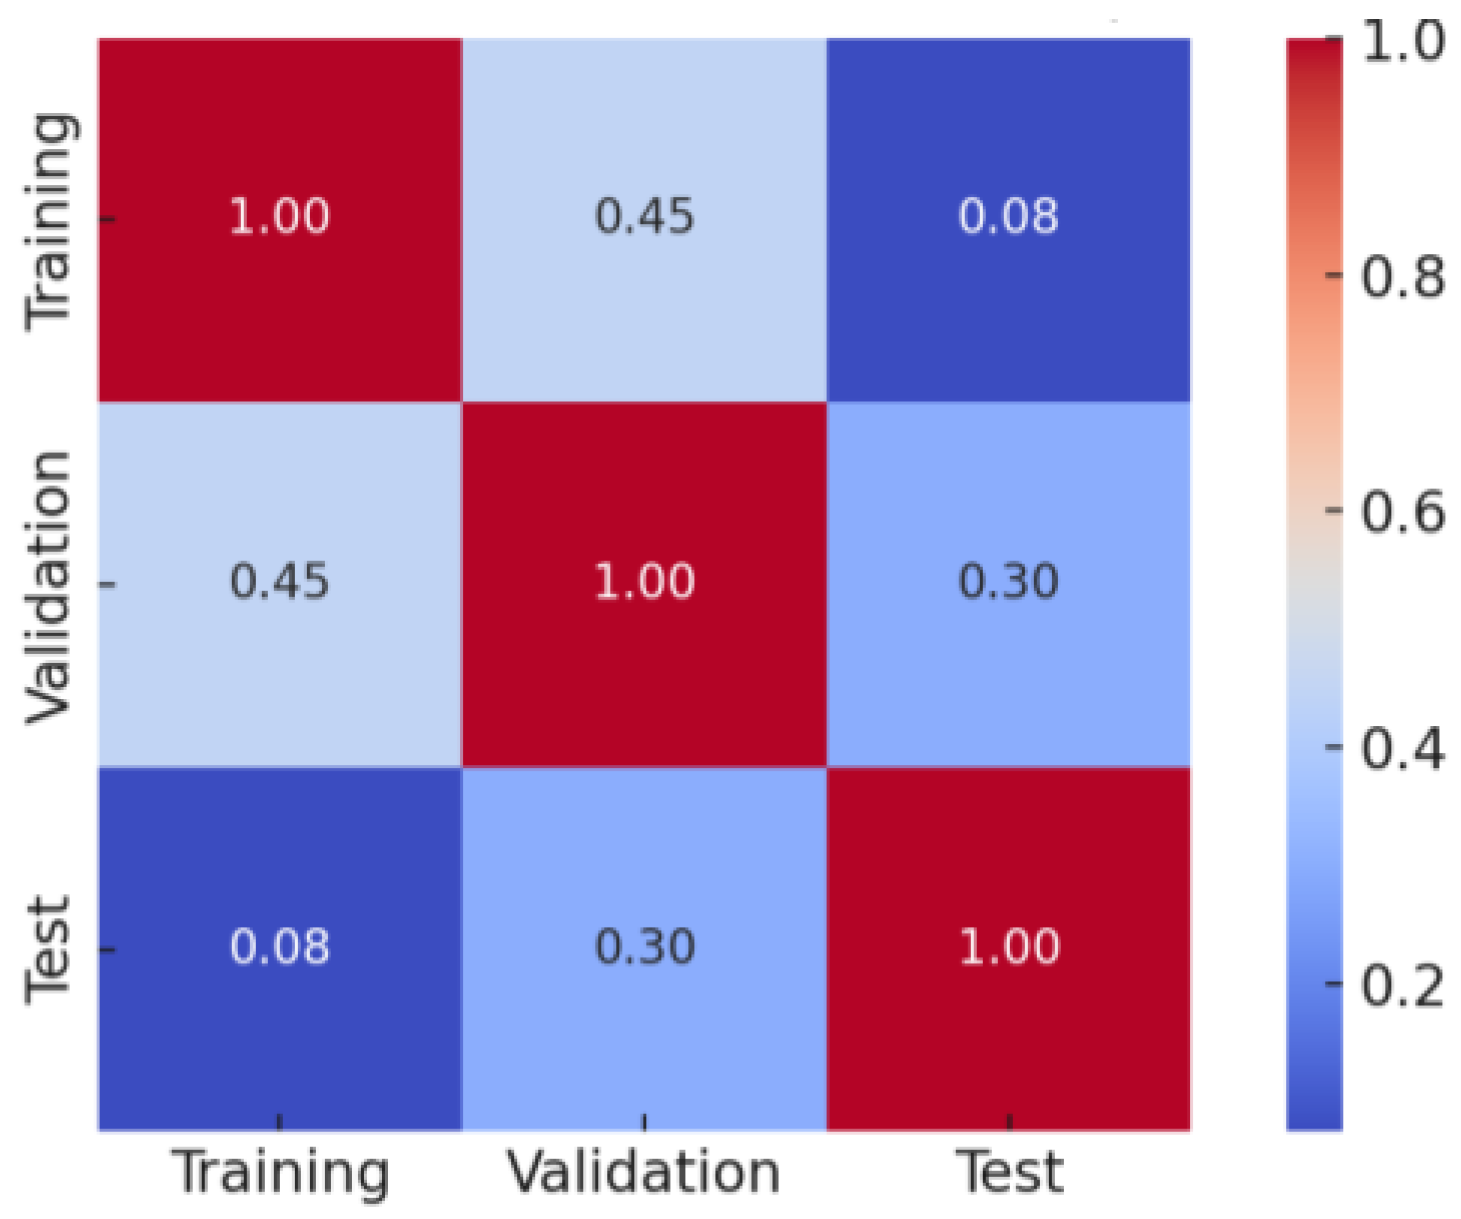
Figure 21.
Correlation matrix of MSE values for NH4-Neffluent prediction.
Figure 21.
Correlation matrix of MSE values for NH4-Neffluent prediction.
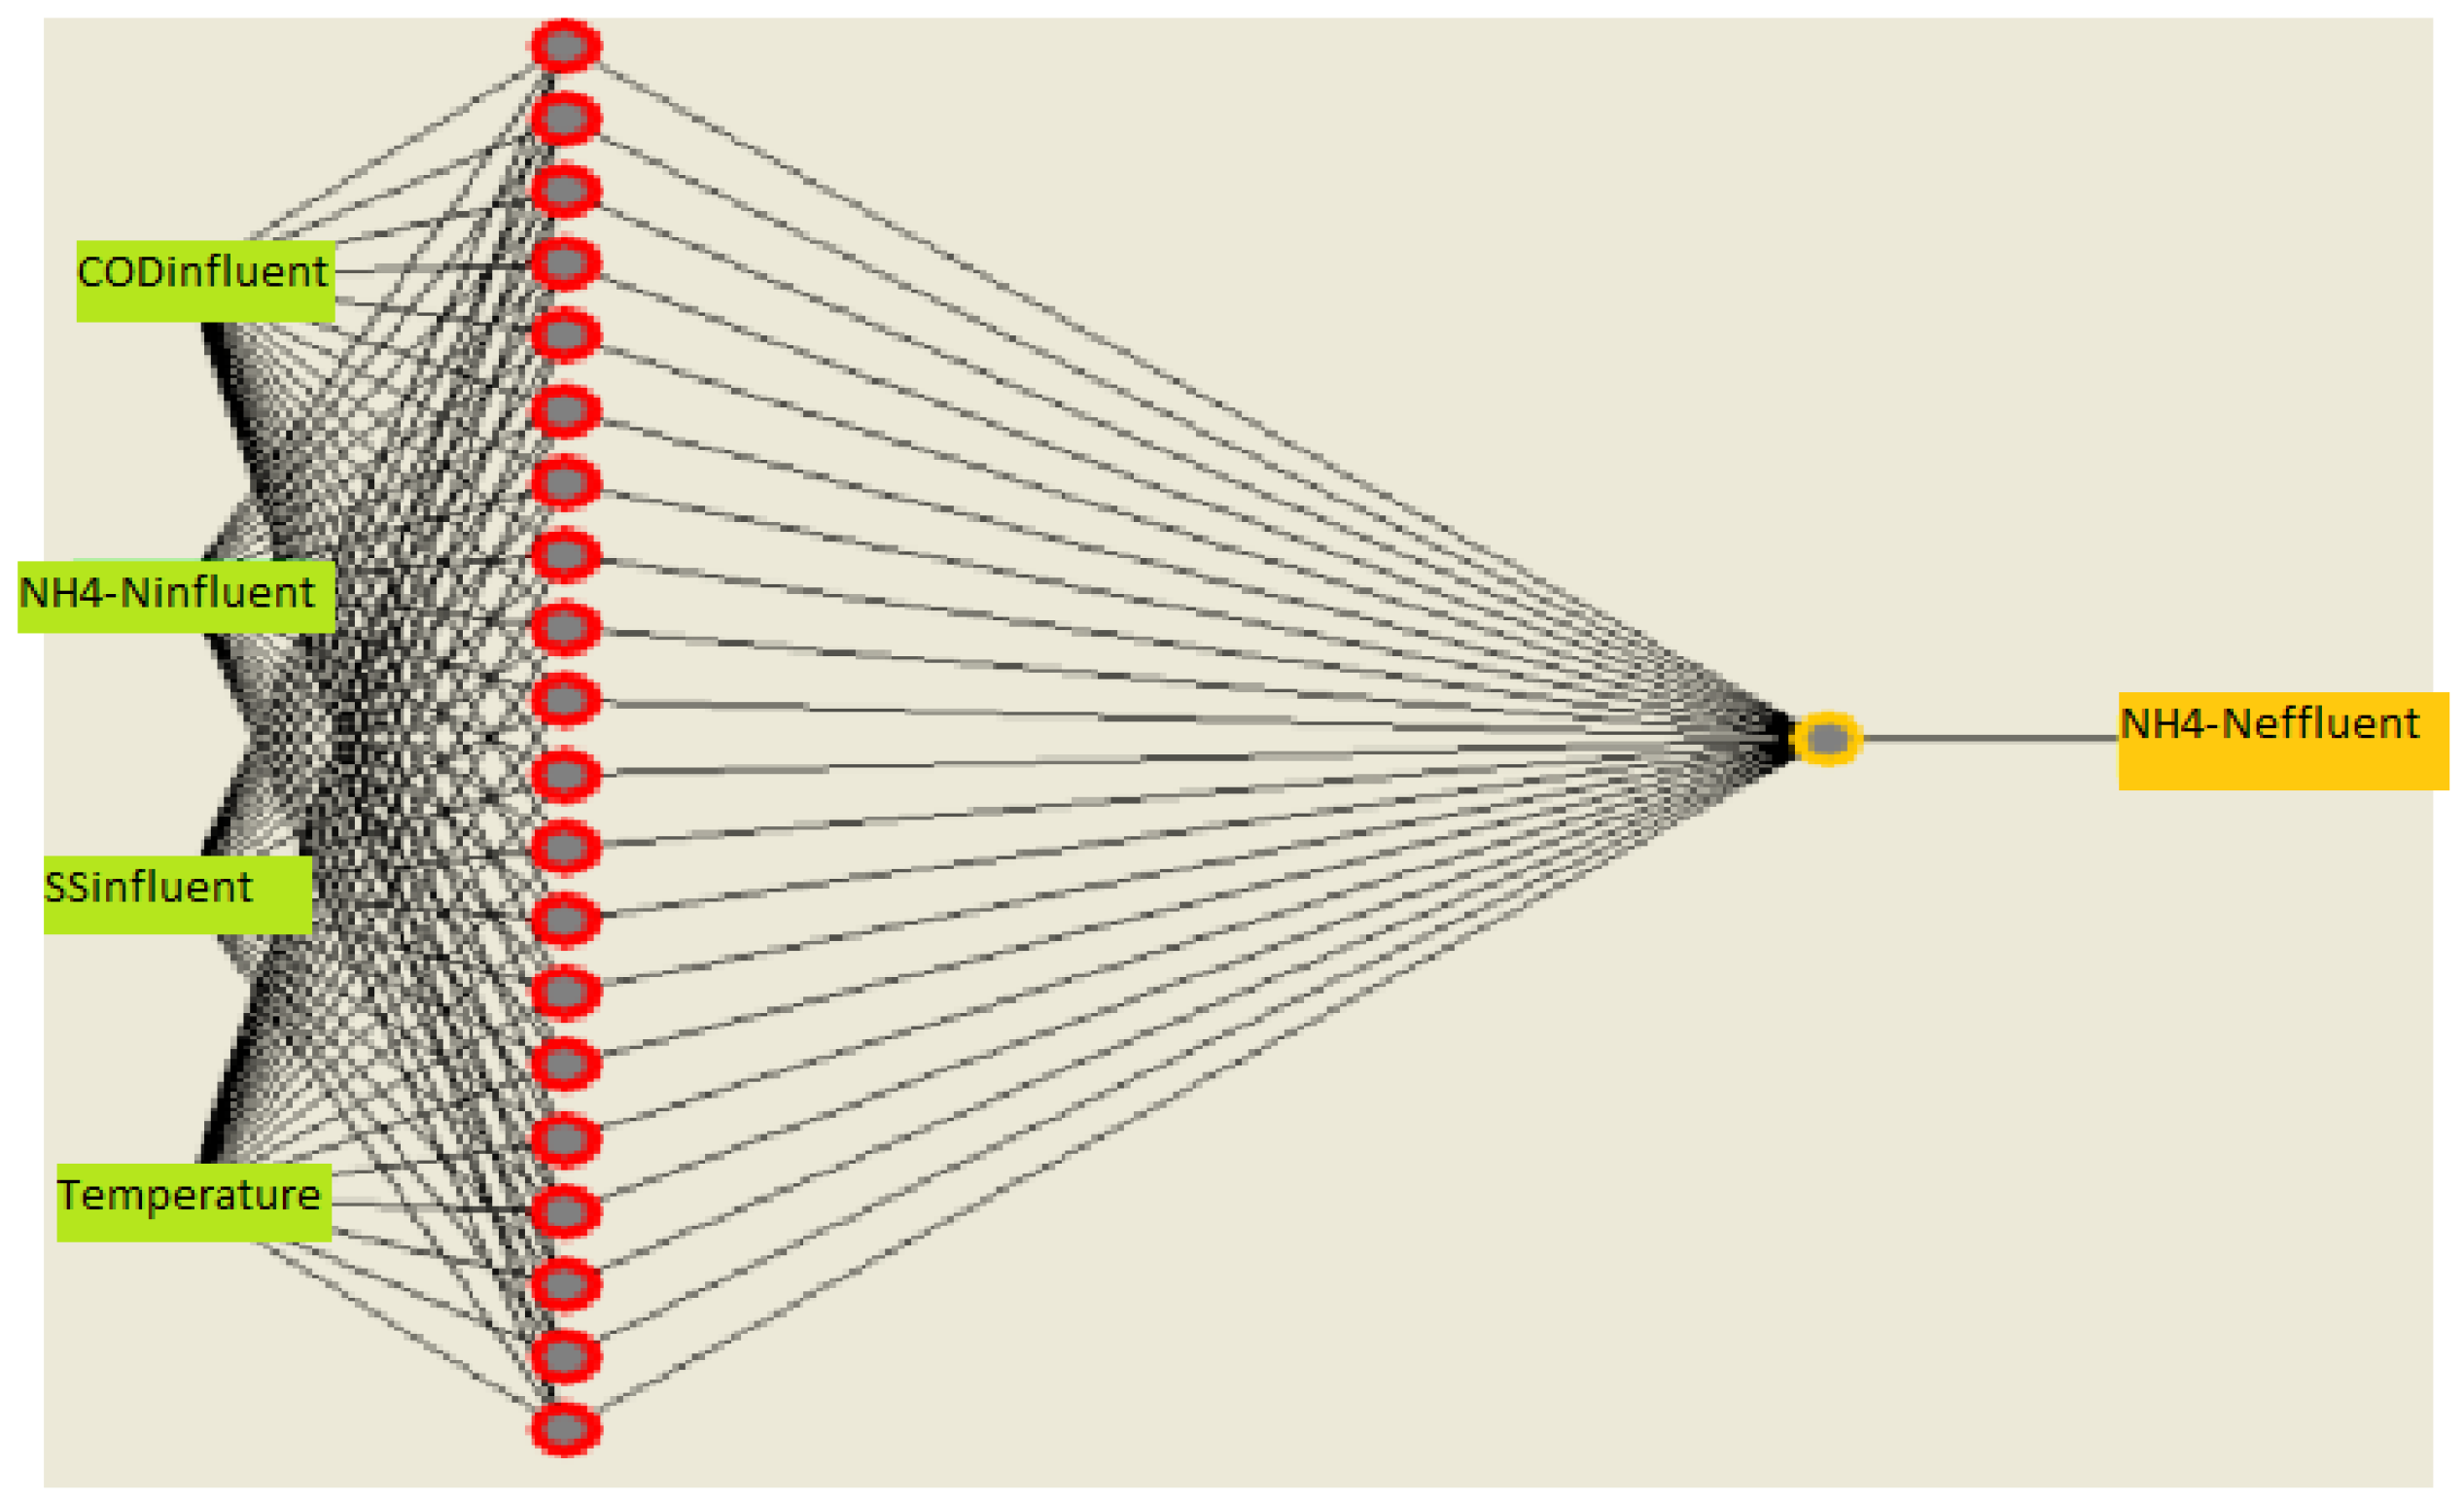
Figure 22.
ANN Model No.2 architecture for NH4-N prediction.
Figure 22.
ANN Model No.2 architecture for NH4-N prediction.
Table 1.
Characteristics of the influent wastewater.
Table 1.
Characteristics of the influent wastewater.
| Parameter | Unit | Value |
|---|
| Flow rate | m3/day | 1200 ± 50 |
| Temperature | °C | 20 ± 0.5 |
| pH | - | 5.5–8.5 (±0.1 per reading) |
| COD | mg/L | 20,000 ± 1000 |
| BOD5 | mg/L | 13,000 ± 800 |
| TKN | mg/L | 3000 ± 200 |
| Total Phosphorus | mg/L | 5 ± 0.3 |
| SO4− | mg/L | 500 ± 25 |
| TSS | mg/L | 1500 ± 100 |
| Total Hardness | mg CaCO3/L | 2500 ± 150 |
| Conductivity | µmhos/cm | 40,000 ± 2000 |
| Alkalinity | mg CaCO3/L | 13,000 ± 600 |
Table 2.
Effluent design criteria for wastewater treatment plant.
Table 2.
Effluent design criteria for wastewater treatment plant.
| Parameter | Unit | Maximum |
|---|
| Temperature | °C | 35 ± 0.5 |
| pH | - | 6.0–9.0 (±0.1 per reading) |
| COD | mg/L | 125 ± 5 |
| BOD5 | mg/L | 50 ± 3 |
| TN | mg N/L | 400 ± 20 |
| TKN | mg N/L | 50 ± 3 |
| TP | mg P/L | 2 ± 0.1 |
| TSS | mg/L | 35 ± 2 |
Table 3.
Analysis methods.
Table 3.
Analysis methods.
| Parameter | Method | Device/Test Kit | Manufacturer Country | Typical Error |
|---|
| Influent | | | | |
| pH | | Hach-Lange HQ40dPortable multimeter | Germany | ±0.002 |
| Temperature | | Hach-Lange HQ40dPortable multimeter | Germany | ±0.2 °C |
| TSS | Gravimetric Method | Standard Method ST 2540 D [24] | Germany | ±5–10% |
| COD | Photometric Method | Hach Lange Test Kit Method COD 1000–10,000 mg/L (LCK 014) | Germany | ±5–10% |
| NH4+-N | Photometric Method | Hach Lange Test Kit Method NH-N, 47–130 mg/L (LCK302) | Germany | ±5–10% |
| TN | Photometric Method | Hach Lange Test Kit Method 20–100 mg/L (LCK 338) | Germany | ±5–10% |
| Phosphate (PO4-P) | Photometric Method | Hach Lange Test Kit Method 2–20 mg/L (LCK 350) | Germany | ±5–10% |
| UF Unit | | | Germany | ±5–10% |
| COD | Photometric Method | Hach Lange Test Kit Method COD 100–2000 mg/L (LCK 514) | Germany | ±5–10% |
| NH4-N | Photometric Method | Hach Lange Test Kit Method NH4-N 1–12 mg/L (LCK 305), 2–47 mg/L (LCK 303) | Germany | ±5–10% |
| TN | Photometric Method | Hach Lange Test Kit Method | Germany | ±5–10% |
| PO4-P | Photometric Method | Hach Lange Test Kit Method | Germany | ±5–10% |
| DO | Photometric Method | Hach Lange HQ40d-Hach LDO-Lange SC 1000 differential online | Germany | ±5–10% |
| Nitrate (NO3-N) | Photometric Method | Hach Lange Test Kit Method NO3-N 0.23–13.5 mg/L (LCK 339) | Germany | ±5–10% |
| Nitrite (NO2-N) | Photometric Method | Hach Lange Test Kit Method NO2-N 0.6–6 mg/L (LCK 514) | Germany | ±5–10% |
| NF Unit | | | Germany | ±5–10% |
| COD | Photometric Method | Hach Lange COD 15–150 mg/L (LCK 314) | Germany | ±5–10% |
| NH4+-N | Photometric Method | Hach Lange NH4-N 1–12 mg/L (LCK 305), 0.015–2 mg/L (LCK 304) | Germany | ±5–10% |
| TN | Photometric Method | Hach Lange Test Kit Method | Germany | ±5–10% |
| PO4-P | Photometric Method | Hach Lange Test Kit Method | Germany | ±5–10% |
| pH | | Online pH Meter (Endress Hauser) | Switzerland | ±0.01 |
Table 4.
Bioreactor design criteria.
Table 4.
Bioreactor design criteria.
| Parameter | Unit | Value |
|---|
| Design capacity | m3/day | 1200 ± 50 |
| Reactor volume | m3 | 20,000 ± 1000 |
| MLVSS | mg/L | 8000–15,000 ± 500 |
| Biomass yield coefficient | kg solids/kg COD | 0.25 ± 0.02 |
| Sludge loading (F/M) | kg COD/kg TSS | 0.08–0.15 ± 0.01 |
| Sludge age | day | >20 ± 2 |
| Hydraulic Retention Time (HRT) | day | 16.7 ± 0.5 |
Table 5.
Ultrafiltration unit design criteria.
Table 5.
Ultrafiltration unit design criteria.
| Parameter | Unit | Value |
|---|
| Design Capacity, max | m3/day | 1200 |
| Unit | piece | 4 |
| Module per Unit | piece | 6 |
| Total Module | piece | 24 |
| Membrane Area | m2 | - |
| Membrane Area per Unit | m2 | 162 |
| Total Membrane Area | m2 | 648 |
| Operating Flux | lmh | 77 |
| Average Permeate Flow Rate | m3/hour | 50 |
| UF Concentration Factor | - | 1.2 |
| Flow Velocity | m/s | 4 |
Table 6.
Nanofiltration unit design criteria.
Table 6.
Nanofiltration unit design criteria.
| Parameter | Unit | Value |
|---|
| Capacity | m3/day | 1200 |
| Unit | piece | 2 |
| Pressure Vessel per Unit | - | 10 |
| Module per Pressure Vessel | - | 6 |
| Total Module | - | 120 |
| Membrane Area per Module | m2 | 25.3 |
| Membrane Area per Unit | m2 | 1518 |
| Total Membrane Area | m2 | 3036 |
| Operating Flux | Lmh | 16.5 |
| Average Feed Flow Rate | m3/h | 50 |
| Recovery Rate | % | ≥90 |
| Recirculation Flow Rate per Unit | m3/h | 30 |
Table 7.
Minimum and maximum values of the study parameters.
Table 7.
Minimum and maximum values of the study parameters.
| Parameter | Unit | Max | Min | Avg | Std. Dev. |
|---|
| CODinlet | (mg/L) | 33,925 | 14,055 | 23,080 | 4145 |
| NH4-Ninlet | (mg/L) | 3000 | 1525 | 2250 | 300 |
| SSinlet | (mg/L) | 1870 | 350 | 731 | 202 |
| Temperature | (°C) | 29.8 | 9 | 21.3 | 7.9 |
| MLSSMBR | (mg/L) | 18,500 | 12,010 | 15,040 | 1346 |
| NH4-NMBR outlet | (mg/L) | 234 | 0.4 | 45 | 56.8 |
| CODMBR outlet | (mg/L) | 2345 | 815 | 1365 | 265.5 |
Table 8.
Leachate measurements.
Table 8.
Leachate measurements.
| Parameter | Unit | Maximum | Minimum | Average | Standard Deviation | CV (%) |
|---|
| COD | mg/L | 33,925 | 9555 | 20,795 | 4980 | 23.9 |
| NH4-N | mg/L | 3300 | 1237 | 2195 | 315 | 14.3 |
| PO4-P | mg/L | 24.5 | 1.7 | 11.3 | 3.3 | 29.2 |
| TP | mg/L | 26.3 | 9.4 | 16.8 | 2.98 | 17.7 |
| TSS | mg/L | 1870 | 350 | 720 | 190 | 26.4 |
| Temperature | °C | 29.8 | 6.9 | 18.4 | 5.74 | 31.2 |
| pH | - | 8.7 | 7.3 | 8 | 0.18 | 2.3 |
Table 9.
Temperature variation in the bioreactor.
Table 9.
Temperature variation in the bioreactor.
| Temperature, °C | Max | Min | Avg | Std. Dev. |
|---|
| Aeration Tank | 29.1 | 8.9 | 19.8 | 5.28 |
| Anoxic Tank | 27.5 | 9.7 | 19.4 | 4.67 |
Table 10.
Concentration values of MLSS in aerobic and anoxic tanks.
Table 10.
Concentration values of MLSS in aerobic and anoxic tanks.
| Tank | Max (mg/L) | Min (mg/L) | Mean (mg/L) | Std. Dev. (mg/L) |
|---|
| Aeration Tank | 18,500 | 7200 | 13,900 | 2460 |
| Anoxic Tank | 18,100 | 7000 | 13,700 | 2250 |
Table 11.
Variation in dissolved oxygen concentration in the bioreactor.
Table 11.
Variation in dissolved oxygen concentration in the bioreactor.
| Dissolved Oxygen Concentration (mg/L) | Max | Min | Average | Std. Deviation |
|---|
| Anoxic Tank | 1.30 | 0.00 | 0.30 | 0.55 |
| Aeration Tank | 9.17 | 0.09 | 3.66 | 1.73 |
Table 12.
Variation in pH in bioreactors.
Table 12.
Variation in pH in bioreactors.
| Reactor Type | Max pH | Min pH | Average pH | Std. Deviation |
|---|
| Aeration Tank | 9.0 | 5.9 | 8.2 | 0.36 |
| Anoxic Tank | 8.8 | 6.0 | 8.0 | 0.35 |
Table 13.
PO4-P variation in the bioreactor.
Table 13.
PO4-P variation in the bioreactor.
| Concentration (PO4-P), mg/L | Max | Min | Avg | Std. Dev. |
|---|
| MBR Effluent (UF) | 15 | 0.06 | 1.43 | 1.99 |
Table 14.
TP variation in the bioreactor.
Table 14.
TP variation in the bioreactor.
| Concentration (TP), mg/L | Max | Min | Avg | Std. Dev. |
|---|
| NF Effluent | 11.8 | 0.12 | 0.69 | 1.16 |
Table 15.
Treatment efficiency based on parameters.
Table 15.
Treatment efficiency based on parameters.
| Parameter | Treatment Type | Max | Min | Avg | Std. Dev. |
|---|
| COD (%) | MBR Removal Efficiency | 96.92 | 86.31 | 93.52 | 1.97 |
| | NF Removal Efficiency | 96.40 | 10.40 | 72.31 | 14.62 |
| | Total Removal Efficiency | 99.77 | 94.30 | 98.29 | 0.86 |
| NH4-N (%) | MBR Removal Efficiency | 99.98 | 88.67 | 98.60 | 2.31 |
| TP (%) | MBR Removal Efficiency | 97.84 | 19.06 | 84.78 | 18.63 |
| | Total Removal Efficiency | 99.14 | 90.71 | 97.44 | 1.92 |
Table 16.
To compare the performance of MBR and NF treatment stages.
Table 16.
To compare the performance of MBR and NF treatment stages.
| Test Type | Test Statistic | p-Value | Comment |
|---|
| Paired t-test | 26.18 | 2.85 × 10−84 | Significant difference between MBR and NF |
| One-way ANOVA | 726.51 | 3.89 × 10−110 | In general, there is a difference between the groups. |
Table 17.
R2 values of ANN models using different input parameter combinations.
Table 17.
R2 values of ANN models using different input parameter combinations.
| No | Input Parameters | R2
(NH4+-NMBReffluent) | R2
(CODMBReffluent) |
|---|
| 1 | CODinfluent, NH4+-Ninfluent, TSSinfluent, Temperatureinfluent, MLSSMBR | 0.610 | 0.861 |
| 2 | CODinfluent, NH4+-Ninfluent, TSSinfluent, Temperatureinfluent | 0.796 | 0.847 |
| 3 | CODinfluent, NH4+-Ninfluent, TSSinfluent, MLSSMBR | 0.523 | 0.821 |
| 4 | CODinfluent, TSSinfluent, Temperatureinfluent, MLSSMBR | 0.717 | 0.812 |
| 5 | NH4+-Ninfluent, TSSinfluent, Temperatureinfluent, MLSSMBR | 0.710 | 0.844 |
| 6 | NH4+-Ninfluent, Temperatureinfluent, MLSSMBR | 0.735 | 0.847 |
| 7 | CODinfluent, NH4+-Ninfluent, Temperatureinfluent | 0.736 | 0.800 |
| 8 | CODinfluent, NH4+-Ninfluent, MLSSMBR | 0.630 | 0.810 |
| 9 | TSSinfluent, Temperatureinfluent, MLSSMBR | 0.703 | 0.810 |
| 10 | CODinfluent, NH4+-Ninfluent | 0.650 | 0.580 |
Table 18.
MSE values of 10 ANN trials for CODeffluent prediction.
Table 18.
MSE values of 10 ANN trials for CODeffluent prediction.
| No | Training | Validation | Test |
|---|
| 1 | 0.0026 | 0.0017 | 0.0062 |
| 2 | 0.0026 | 0.0010 | 0.0050 |
| 3 | 0.0022 | 0.0082 | 0.0011 |
| 4 | 0.0031 | 0.0031 | 0.0064 |
| 5 | 0.0029 | 0.0027 | 0.0069 |
| 6 | 0.0031 | 0.0026 | 0.0054 |
| 7 | 0.0023 | 0.0017 | 0.0068 |
| 8 | 0.0027 | 0.0083 | 0.0099 |
| 9 | 0.0035 | 0.0037 | 0.0037 |
| 10 | 0.0069 | 0.0099 | 0.0013 |
Table 19.
MSE values from 10 ANN trials for NH4-Neffluent prediction.
Table 19.
MSE values from 10 ANN trials for NH4-Neffluent prediction.
| Trial | Training | Validation | Test |
|---|
| 1 | 0.00159 | 0.00162 | 0.00147 |
| 2 | 0.00102 | 0.00166 | 0.00723 |
| 3 | 0.00315 | 0.00322 | 0.00762 |
| 4 | 0.00233 | 0.00453 | 0.00401 |
| 5 | 0.00131 | 0.00309 | 0.00981 |
| 6 | 0.00179 | 0.00262 | 0.00532 |
| 7 | 0.00165 | 0.00241 | 0.00519 |
| 8 | 0.00205 | 0.00241 | 0.00529 |
| 9 | 0.00264 | 0.00196 | 0.00424 |
| 10 | 0.00123 | 0.00195 | 0.00104 |
Table 20.
PCA loadings for CODeffluent.
Table 20.
PCA loadings for CODeffluent.
| | PC1 | PC2 | PC3 | PC4 | PC5 |
|---|
| CODinfluent (mg/L) | 0.6035 | 0.0070 | 0.0794 | −0.45688 | 0.6485 |
| NH4-Ninfluent (mg/L) | 0.4111 | −0.1865 | 0.0090 | 0.8630 | 0.2263 |
| Temperatureinfluent (°C) | 0.25623 | 0.4798 | −0.8292 | 0.0232 | −0.1256 |
| MLSS (g/L) | 0.6274 | 0.0363 | 0.3180 | −0.1105 | −0.7011 |
| CODeffluent (mg/L) | 0.0856 | −0.8564 | −0.4524 | −0.1833 | −0.1441 |
Table 21.
PCA loadings for NH4-Neffluent.
Table 21.
PCA loadings for NH4-Neffluent.
| | PC1 | PC2 | PC3 | PC4 |
|---|
| CODinfluent (mg/L) | 0.2895 | −0.5119 | −0.6908 | −0.18800 |
| NH4-Ninfluent (mg/L) | 0.2812 | 0.7172 | −0.0650 | −0.4820 |
| SSinfluent (g/L) | 0.3447 | 0.3322 | −0.2724 | 0.8267 |
| Temperatureinfluent (°C) | −0.5295 | 0.0731 | −0.2621 | 0.0458 |
| MLSS (g/L) | 0.5430 | −0.0097 | −0.1013 | −0.1950 |
| NH4-Neffluent (mg/L) | −0.3780 | 0.3281 | −0.6043 | −0.0930 |
Table 22.
Model validation results for CODeffluent prediction.
Table 22.
Model validation results for CODeffluent prediction.
| Data Set | RMSE (mg/L) | MAE (mg/L) | 95% CI (RMSE) | 95% CI (MAE) |
|---|
| Model 1 | | | | |
| Training | 0.051 | 0.063 | 0.051–0.107 | 0.040–0.086 |
| Validation | 0.041 | 0.033 | 0.026–0.055 | 0.021–0.045 |
| Test | 0.078 | 0.063 | 0.050–0.106 | 0.040–0.086 |
| Model 2 | | | | |
| Training | 0.051 | 0.057 | 0.045–0.107 | 0.037–0.077 |
| Validation | 0.032 | 0.025 | 0.020–0.042 | 0.016–0.034 |
| Test | 0.071 | 0.057 | 0.045–0.096 | 0.037–0.077 |
Table 23.
Model validation results for NH4-N effluent prediction.
Table 23.
Model validation results for NH4-N effluent prediction.
| Data Set | RMSE (mg/L) | MAE (mg/L) | 95% CI (RMSE) | 95% CI (MAE) |
|---|
| Model 1 | | | | |
| Training | 0.039 | 0.032 | 0.025–0.054 | 0.020–0.043 |
| Validation | 0.040 | 0.032 | 0.025–0.054 | 0.020–0.043 |
| Test | 0.038 | 0.031 | 0.024–0.052 | 0.019–0.041 |
| Model 2 | | | | |
| Training | 0.032 | 0.026 | 0.020–0.043 | 0.016–0.034 |
| Validation | 0.041 | 0.033 | 0.026–0.055 | 0.020–0.044 |
| Test | 0.085 | 0.068 | 0.054–0.115 | 0.043–0.092 |


