1. Introduction
Micro-turbojet engines are aviation engines characterized by their simple structure, light weight, and fast response speed. The combustion chamber, which is one of the core components of a turbojet engine, converts the chemical energy of the fuel into the thermal energy of the gas. However, due to the harsh working environment of this component, the flame tube exhibits the shortest lifespan [
1]. The fuel undergoes heated atomization in the evaporation tube. Constrained by a small space, the evaporation rate of fuel in an oil-gas mixture sprayed from an evaporation tube typically ranges between 80% and 95% [
2]. The oil-gas mixture, combined with high-pressure air from the compressor, flows into the flame tube along the length of the combustion chamber for combustion. The air flow distribution in the combustion chamber of an aviation engine forms the foundation for the aerodynamic and thermal design, significantly influencing the combustion performance, including ignition, flame stability, combustion efficiency, total pressure loss, flame tube wall cooling, outlet temperature distribution, and pollutant emissions. Flow distribution is typically calculated using semi-empirical formulas and flow coefficient relationships [
3,
4]. Incorrect flow ratios significantly reduce combustion efficiency in a combustion chamber, potentially leading to an inability to sustain a stable combustion [
5].
H. Ma employed k-
turbulence model with numerical simulation technology to simulate the combustion process in the combustion chamber of a new type of turbojet engine [
6]. Mangra et al. focused on the design and numerical analysis of a combustion chamber for micro gas turbines and verified through mathematical simulation that the combustion efficiency of a novel combustion chamber reached 99.9% [
7]. Agarwal utilized numerical simulation methods to examine the fluid flow and combustion characteristics in the combustion chamber of an aero-engine and compared the performance differences between single and dual fuel inlet configurations [
8]. Previous studies have derived results related to combustion efficiency, temperature distribution, and pressure characteristics solely through simulations. Due to the assumptions and simplifications in the models, the lack of measured data to validate or refine the accuracy of the numerical simulations directly impacts the reliability of the simulation outcomes, resulting in deviations or errors.
This study integrates numerical simulations and experimental methods to investigate the effects of varying flow distributions in an evaporator tube on flame tube combustion characteristics. Combustion tests are conducted by altering the flow distribution at each inlet. The analysis of temperature contour maps at critical cross-sections and key parameters at the combustion chamber outlet enables the evaluation of combustion characteristics under different flow ratios. Experiments with identical air-fuel ratios are performed to observe the flame state and color in the combustion chamber, with the outlet temperature recorded [
9]. Combustion efficiency calculations validate the reliability of the numerical simulation results, providing valuable guidance for the design and optimization of miniature combustion chambers [
10].
2. Materials and Methods
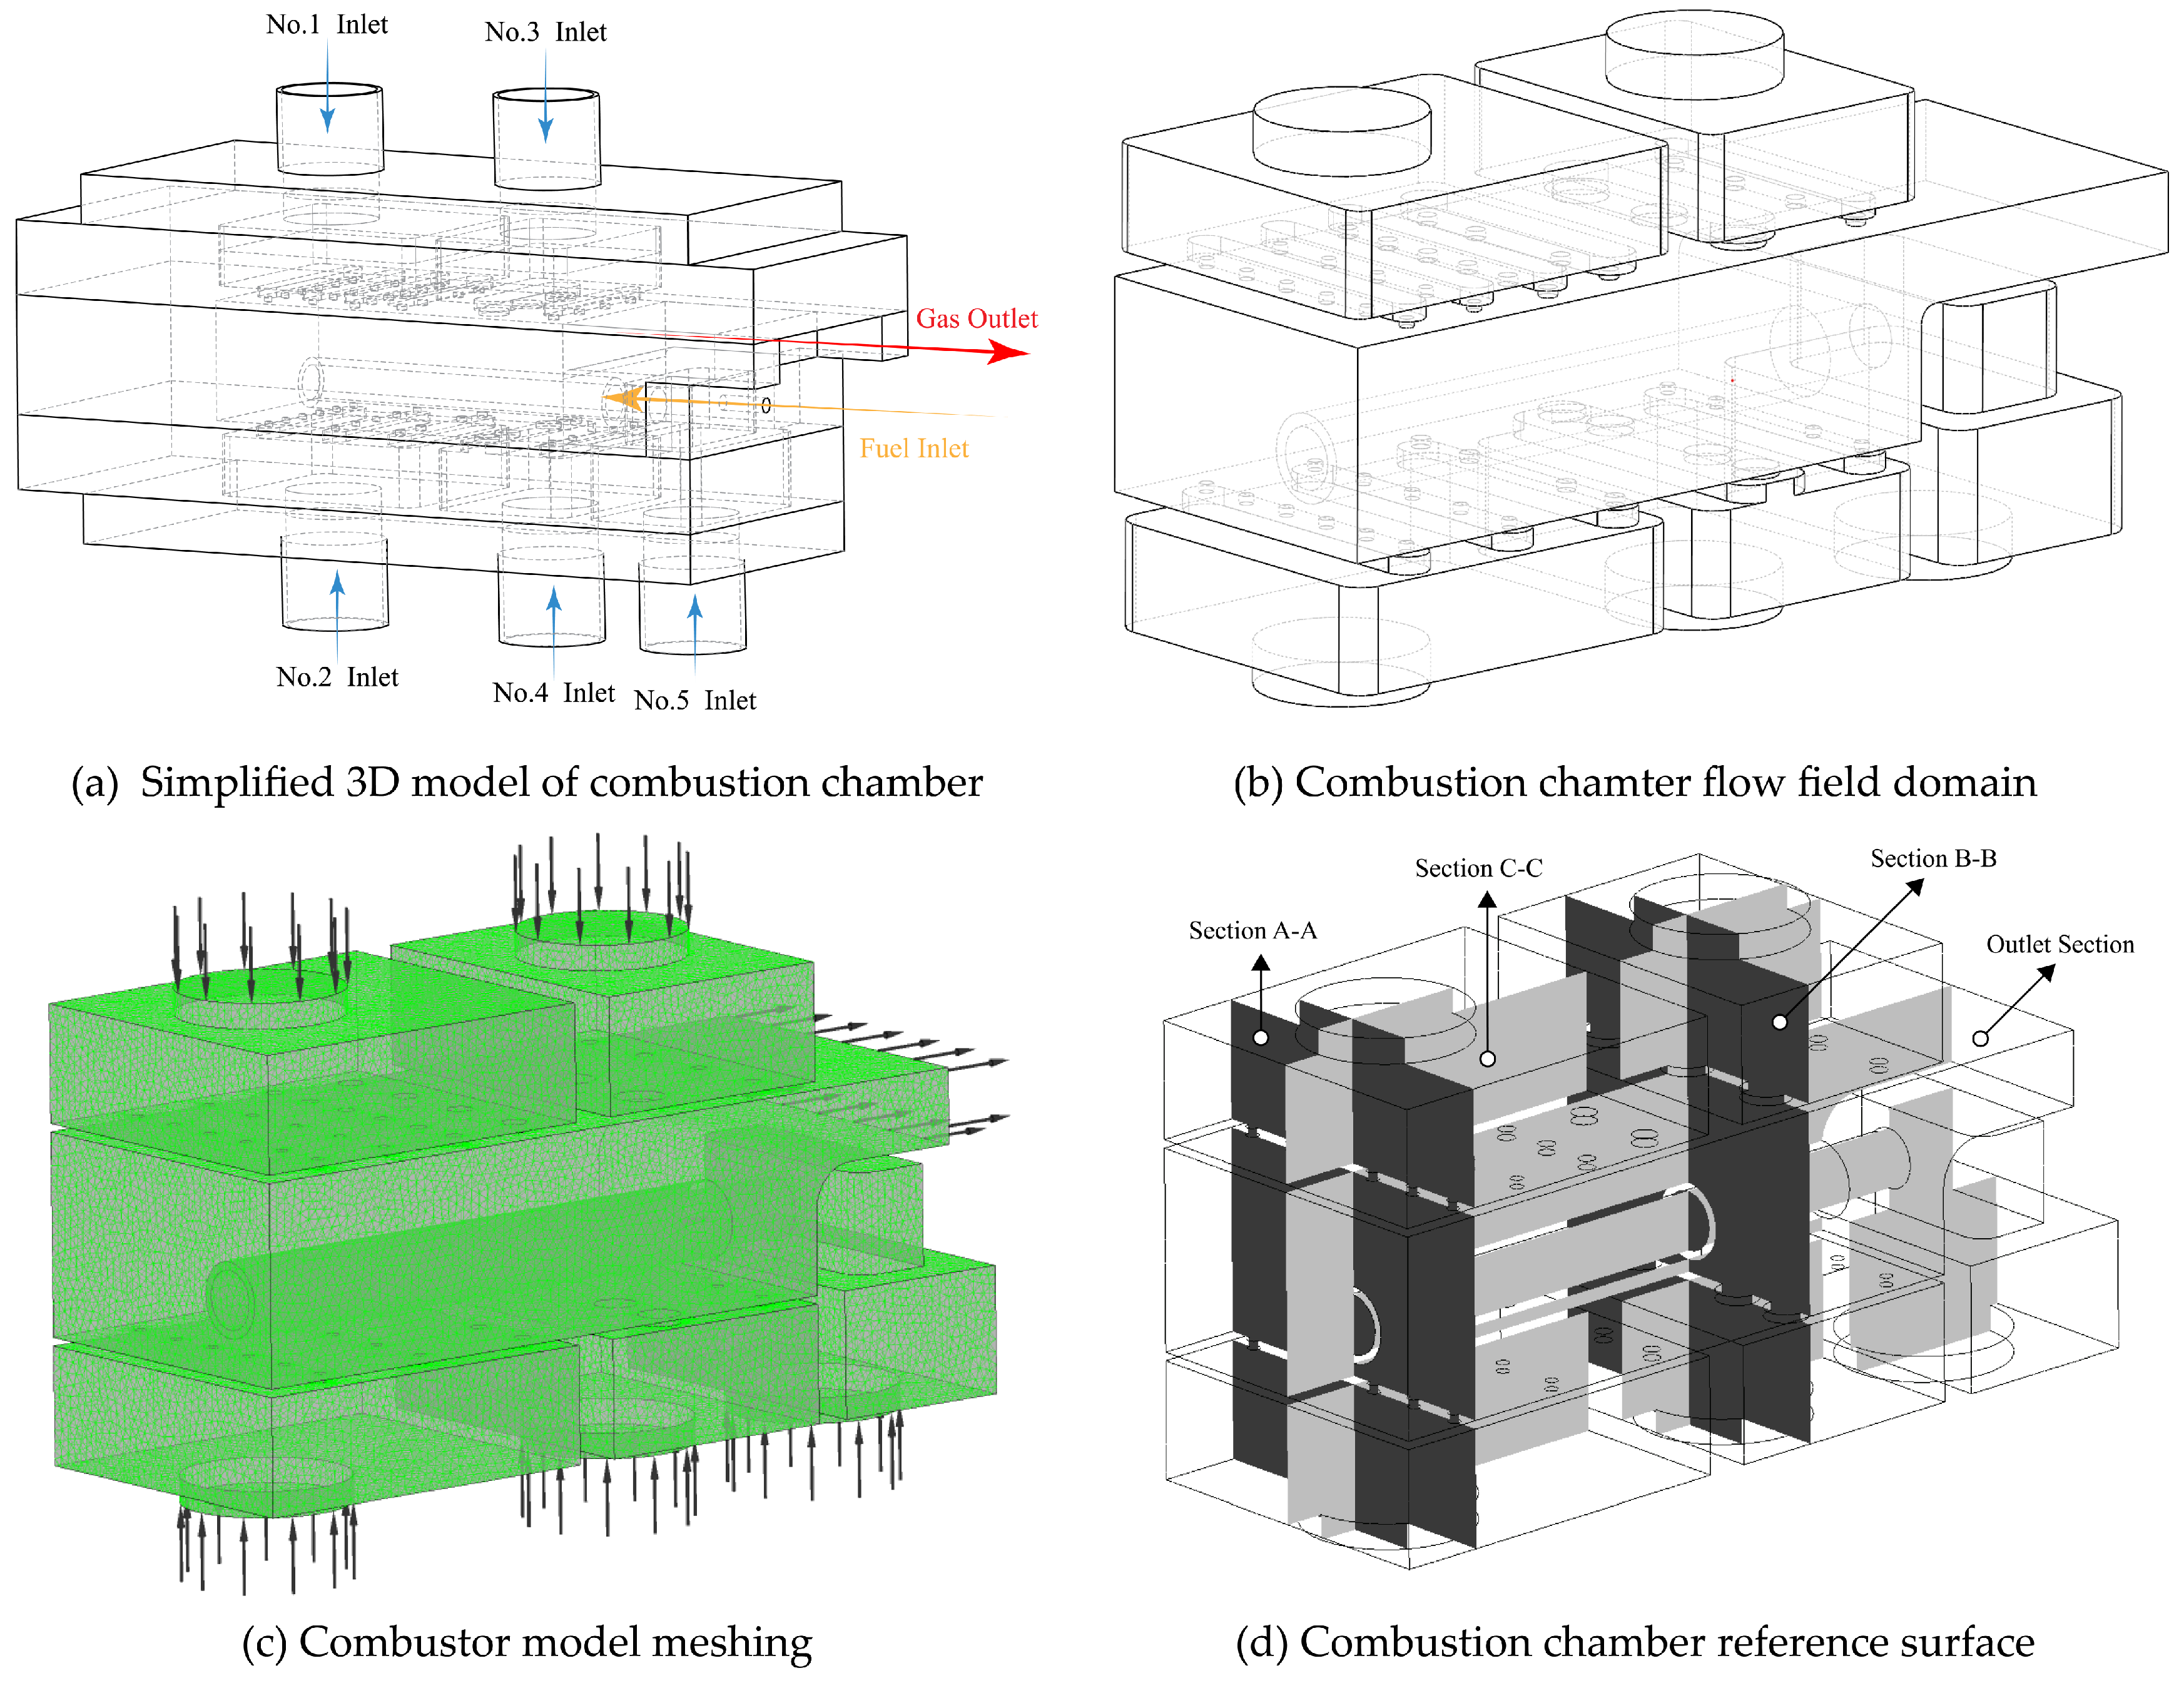
The typical structural configuration of a small annular combustion chamber with evaporation tubes is shown in
Figure 1a. Such combustion chambers generally exhibit radial dimensions ranging from 10 to 20 cm and utilize evaporation tubes to facilitate fuel atomization. To ensure a uniform temperature distribution at the combustion chamber outlet, multiple evaporation tubes are strategically positioned, resulting in a circumferentially repeating structure based on these tubes. For research purposes, the model of the micro0combustion chamber was simplified by isolating a segment of the annular configuration—specifically, a fan-shaped cyclic unit of the combustion chamber—as depicted in
Figure 1b.
The flame tube wall is perforated with openings that permit airflow, therebycooling the wall surface. Within the main combustion zone, the air passing through the primary combustion holes contributes to the formation of a recirculation zone, which enhances combustion stability. Larger apertures on the flame tube wall, commonly termed dilution holes, allow a substantial volume of air to flow through and mix with combustion gases. This process promotes complete combustion and mitigates the formation of pollutants. Furthermore, the significant airflow from the dilution holes reduces the outlet temperature and safeguards the combustion chamber walls [
11]. In the experimental setup, precise control of the airflow through each jet hole is achieved by separating the air supply for the ignition zone and the dilution zone, as shown in the schematic in
Figure 1c.
Combustion occurs within the flame tube, where air enters through various jet holes, and the combustion tube is located on the flame tube wall, mixing with the fuel to sustain the combustion process. The positioning and dimensions of the jet holes dictate the location and flow rate of the incoming air, thereby establishing a distinct flow-field structure. As illustrated in
Figure 1c, the blue arrows represent the air and fuel at ambient temperature. The red arrows within the air distribution chamber signify the incoming air that passes through the chamber and enters the flame tube via the jet holes. The purple arrow indicates the ambient-temperature fuel entering the evaporation tube through the fuel delivery pipe, where it mixes with air. Inside the evaporation tube, the fuel is heated and atomized to produce an oil-gas mixture. This mixture is subsequently ejected from the evaporation tube and combines with air entering through the surrounding jet holes in the flame tube at the location marked by the red arrows, initiating combustion. Following ignition, the combustion process advances from the combustion zone at the front of the flame tube toward the outlet, as indicated by the yellow arrows. The mixture traverses the dilution zone—depicted by arrows transitioning from red to blue in the figure—facilitating further combustion before exiting through the outlet, which is equipped with temperature measurement instruments.
To precisely delineate the regional combustion characteristics within the combustion chamber and regulate the airflow through each jet hole, the experimental configuration incorporates independent distribution chambers for the combustion chamber inlet ports. These distribution chambers separate the primary zone and dilution zone of the combustion chamber. Air enters the distribution chambers via designated inlets and is subsequently directed into the flame tube of the combustion chamber through jet holes positioned on the distribution chamber. The arrangement and allocation of the distribution chambers and jet holes are shown in
Figure 1d.
In
Figure 1d, the Upper Distribution Chamber is segmented into two distinct sections: the front section corresponds to the primary zone of the combustion chamber, and the rear section aligns with the dilution zone. The Lower Distribution Chamber is divided into three sections: the foremost section supplies the ignition zone of the combustion chamber, the middle section feeds the dilution zone, and the rearmost section serves as the Evaporation Tube Channel, which controls the mass flow rate of air entering the evaporation tube.
As illustrated in the three-dimensional model of the combustion chamber in
Figure 1d, air enters the distribution chambers through five inlets. The air is then diverted by the jet holes into the flame tube of the combustion chamber. The specific configuration of the jet holes used in the experiment is presented in
Table 1.
2.1. Numerical Simulation
The combustion chamber model is derived from an engine with a diameter of 12 cm, representing one-eighth of the circumferential segment of the combustion chamber. The constructed model has a circumferential dimension of 40 mm, while its radial and axial dimensions mirror those of the prototype engine’s combustion chamber, measuring 24 mm radially and 80 mm axially. The evaporation tube is designed with an inner diameter of 6 mm and an outer diameter of 8 mm. The resulting three-dimensional model is shown in
Figure 2. In this configuration, air is introduced through inlets 1 to 5, while fuel enters via the fuel inlet, mixing with air from inlet 5 within the evaporation tube, and then entering the combustion chamber. The mixture subsequently blends with air from the remaining four inlets and is expelled through the gas outlet following combustion.
Based on the combustion chamber model, the air flow field of the micro-combustion chamber is constructed using SolidWorks 2022 software, as shown in
Figure 2b. A three-dimensional model of the numerically simulated gas flow field is shown, allowing the observation of the extension length and thickness of the evaporation tube.
Unlike most CFD software, CFX employs a finite element-based finite volume method, ensuring the conservation properties of the finite volume method while incorporating the numerical accuracy of the finite element method [
12]. The finite element-based finite volume method uses 24-point interpolation for hexahedral mesh elements, whereas traditional finite volume methods use only 6 points. For tetrahedral mesh elements, it uses 60-point interpolation, compared to only 4 points in traditional methods. These enhanced interpolation techniques facilitate the handling of complex combustion chamber models, support advanced turbulence modeling and multiphysics simulations, and are suitable for complex fluid dynamics problems in combustion processes within micro-combustion chambers, enhancing the accuracy and stability of the model.
Due to the high-speed airflow and significant temperature changes involved in the combustion process within the confined space of the micro-combustion chamber, the Reynolds number is often high, leading to turbulent vortices and recirculation zones in the internal airflow, resulting in turbulent flow conditions. This paper primarily investigates the temperature variation characteristics of the internal airflow in the combustion chamber, with lower requirements for near-wall accuracy. Compared to the k-omega model, the k-epsilon model is suitable for high Reynolds numbers, offers high computational efficiency, and exhibits strong robustness, meeting the requirements of numerical simulation.
The flow domain model is meshed using ANSYS ICEM CFD software. Given the complex geometry of the combustion chamber, an unstructured grid is adopted. Grid refinement is applied at the combustion chamber outlet and various jet holes to enhance the computational accuracy [
13]. The meshing configuration is shown in
Figure 3c.
To determine a reasonable number of grids, simulations were conducted on models with 1.83 million, 2.47 million, and 3.75 million grids. During the numerical simulation, the working medium was set as ideal air, the inlet temperature was 318 K, the outlet pressure was 1 atm, the wall surface was smooth, the lower heating value of the fuel was 43 MJ/kg, the density was 780 kg/m
3, and the molar mass was 167.3 kg/kmol. Under identical operating conditions, grid independence was verified by comparing the combustion efficiency of the main combustion chamber model with different grid numbers to determine the final grid size. Complete Combustion Theoretical Temperature of the fuel was calculated using the temperature rise method.
Table 2 illustrates the impact of different numbers of elements on the experimental results. The chart formed by the data is shown in the
Figure S1.
Comparing the numerical simulation results of the three different grid numbers reveals that the errors in the combustion efficiency, outlet pressure, and outlet gas velocity of the micro-combustion chamber under the three grid numbers were all within 1% and are close to the actual combustion efficiency of the micro-combustion chamber. Considering the key data required for this study, a grid number of 1.83 million is selected for subsequent calculations.
To enhance the study of combustion characteristics within a micro-combustion chamber, the simulation process emphasizes the influence of the flow distribution in the evaporation tube on the combustion characteristics of the combustion model. The observation planes are established at the central axis of the combustion chamber, the inlet of the combustion zone, inlet of the dilution zone, and the outlet of the combustion chamber, designated as section A-A, section B-B, section C-C, and outlet section, respectively, with specific positions illustrated in
Figure 3d.
Section A-A can capture the initial mixing state of the fuel and air, as well as whether the initial state of the combustion reaction is ideal. Section B-B can capture the uniformity of air mixing and combustion in the ignition zone, providing a reference for the mixing, combustion, and cooling effects in the dilution zone. The outlet section can be used to evaluate the overall efficiency of the combustion chamber and the mixing and cooling effects in the dilution zone based on the flow distribution. The temperature contour of section C-C can observe the temperature propagation characteristics along the central axis of the combustion chamber, which can be analyzed in combination with the combustion characteristics summarized in section A-A and section B-B. Comparing section A-A and section B-B can better understand the combustion situation in the ignition zone of the combustion chamber, while comparing section B-B and the outlet section can better understand the mixing situation in the dilution zone of the combustion chamber.
Monitoring the temperature and velocity field distribution characteristics at the critical cross-sections of a combustion chamber enables the analysis of the thermal state evolution under experimental conditions. For the actual combustion conditions, a combustion scenario is selected where the air mass flow rates in the ignition and mixing zones are comparable. The air and fuel mass flow ratios within the evaporator tube are controlled using the air-fuel ratio (AFR) as a reference. AFR serves as a key parameter for evaluating combustion efficiency and engine performance in aviation applications [
14,
15].
The air-fuel flow ratio is defined as the ratio of the mass flow rate of air to the mass flow rate of fuel, expressed mathematically as
In Equation (1), ma denotes the mass flow rate of air, mf denotes the mass flow rate of fuel.
Experimental boundary conditions are shown in
Table 3 below.
By integrating the actual operating conditions of the micro turbojet engine and conducting multiple combustion tests on the combustion model, the experiments demonstrate that when the airflow in the ignition zone, Inlet No. 1, constitutes 23% of the total intake air, Inlet No. 2 constitutes 20%, and in the dilution zone, Inlet No. 3 constitutes 28%, and Inlet No. 4 constitutes 21%, the combustion chamber outlet temperature reaches a maximum, and the combustion efficiency achieves peak performance under this ratio.
2.2. Combustion Experiment
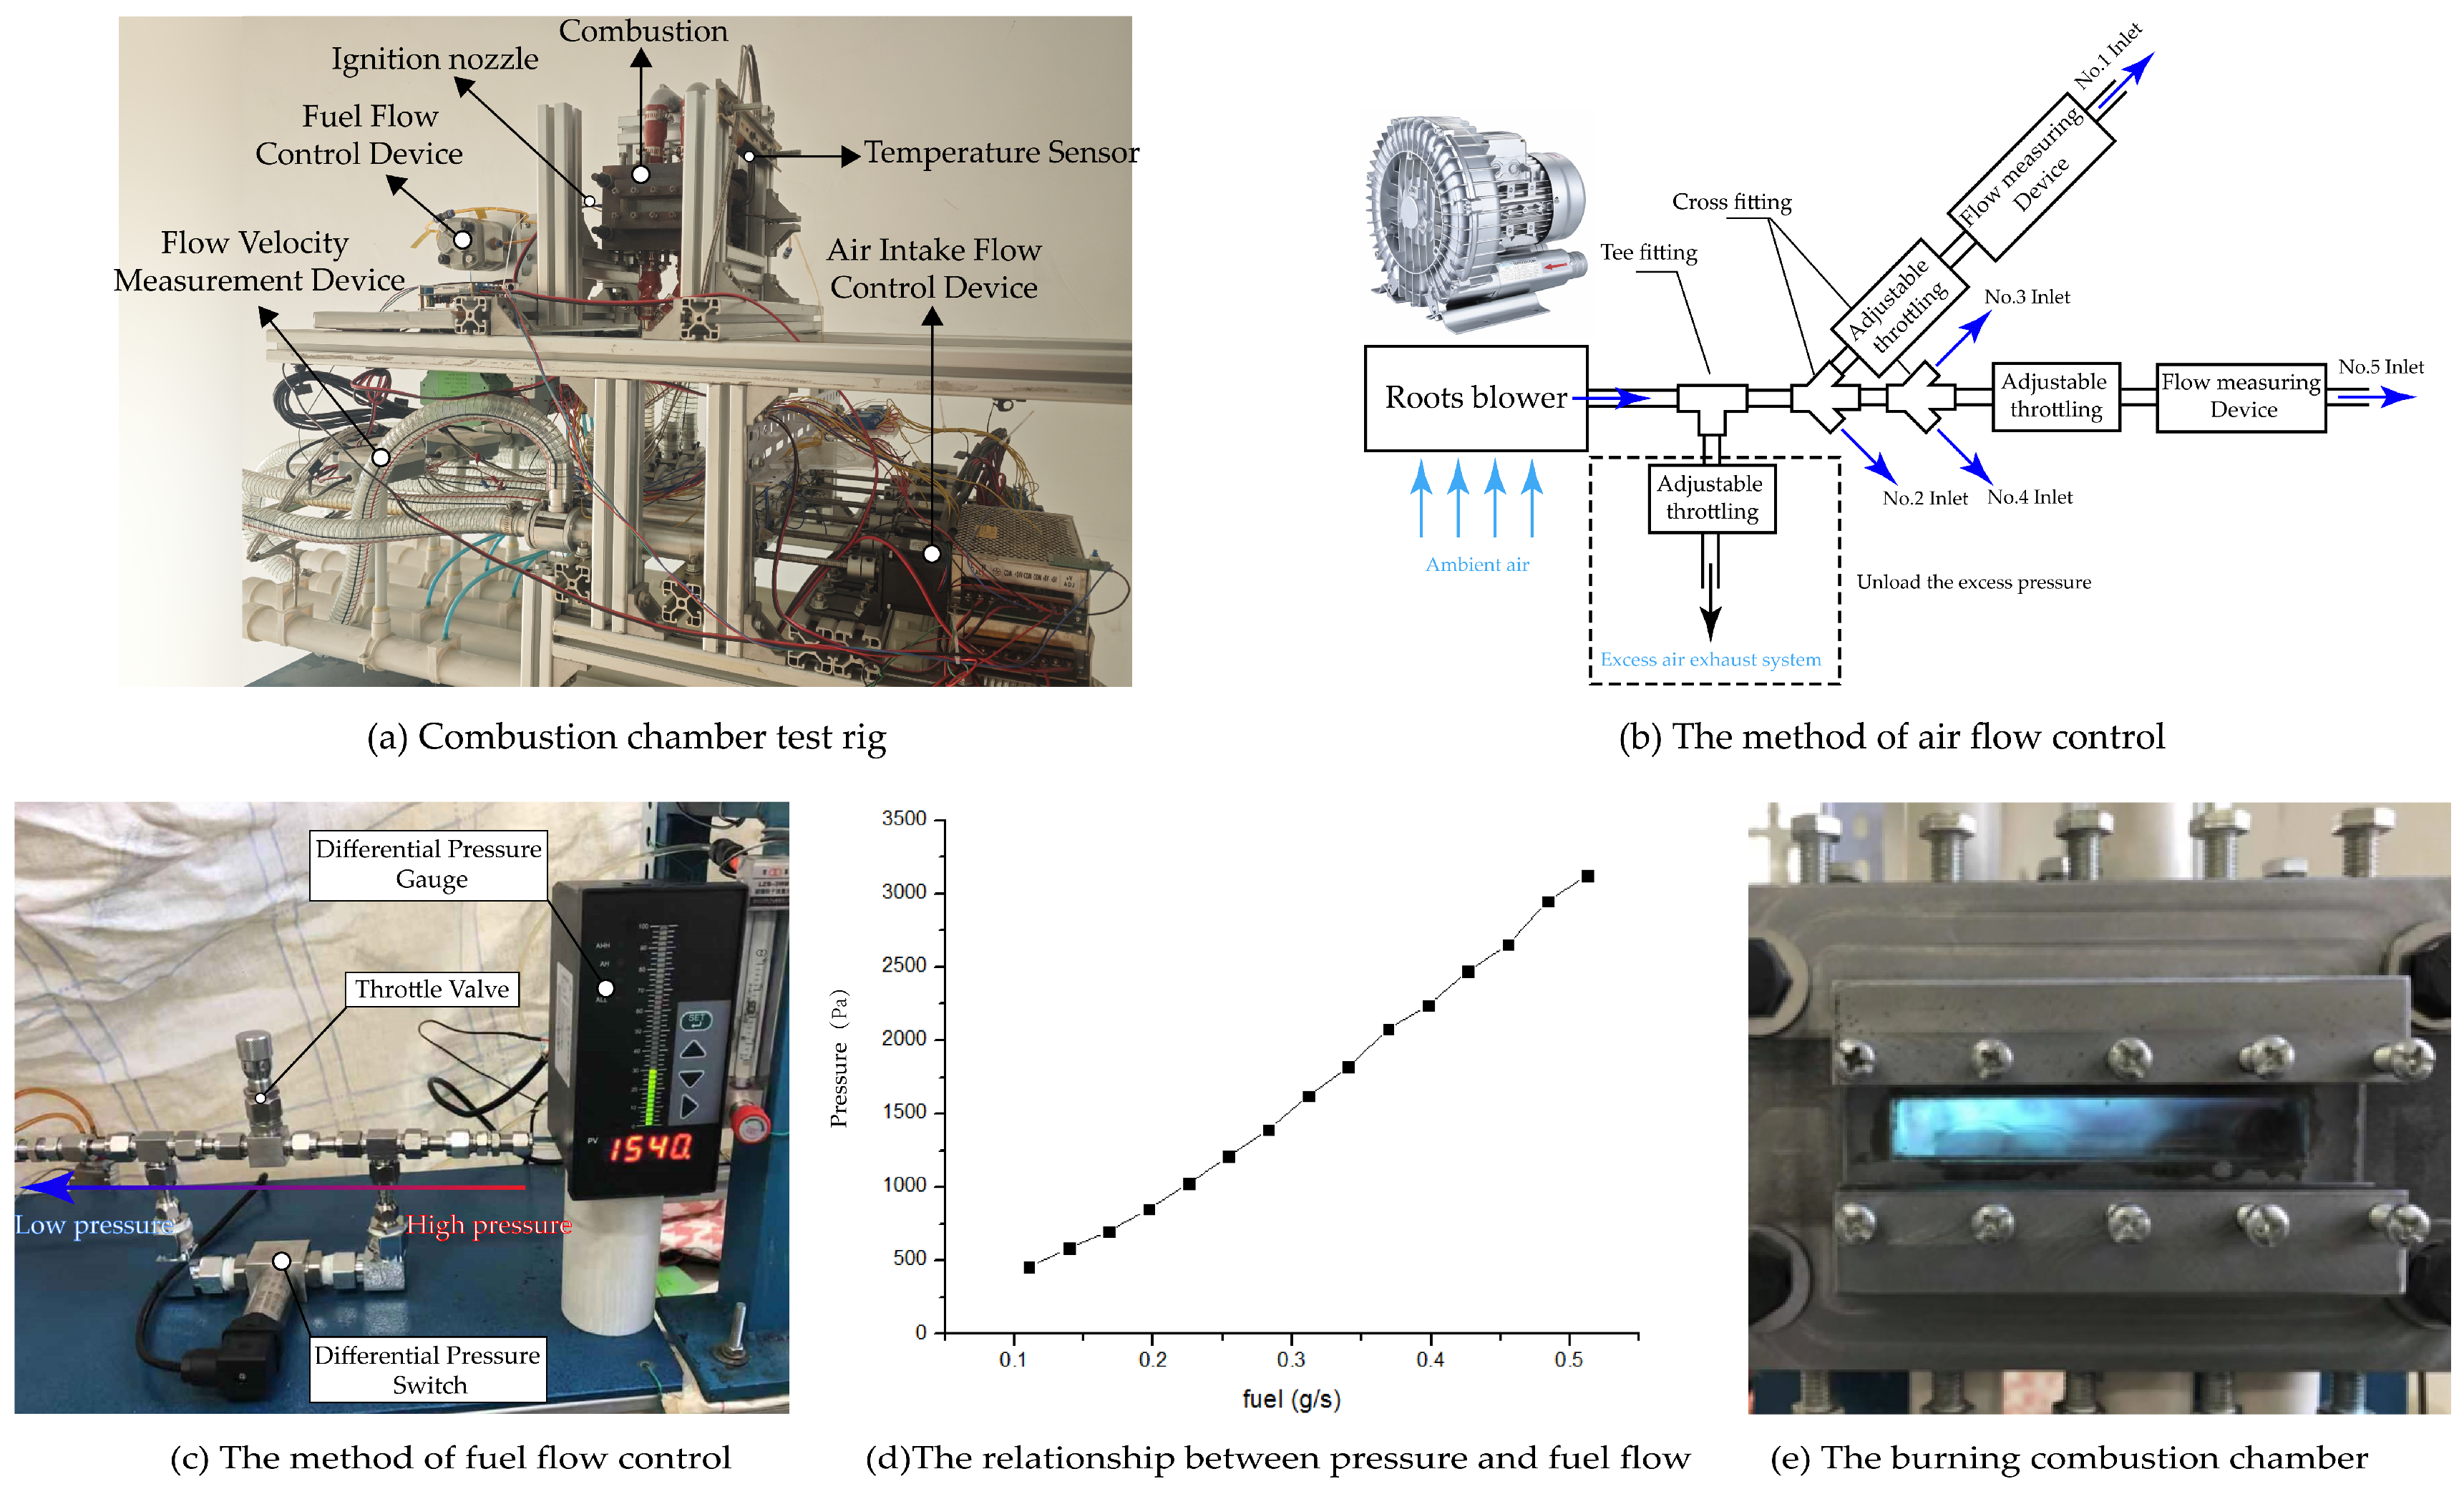
This study constructs a combustion simulation device for a micro-annular combustion chamber, as depicted in
Figure 3a. The test bench frame utilizes aluminum alloy profiles for assembly. Since the main part of the combustion chamber is susceptible to deformation from combustion heating, carbon steel with low deformation is selected as the material. To further minimize the deformation, the wall thickness is increased in the design. An observation window was incorporated on the side of the combustion chamber, employing high-temperature-resistant glass for the window, with a high-temperature-resistant sealant applied between the glass and metal wall to prevent air leakage. The temperature sensors consist of K-type armored thermocouples, offering an effective temperature measurement range of 313.15 K to 1423.15 K. Three temperature sensors are arranged horizontally to measure the area-averaged temperature at the combustion chamber outlet.
An air supply system delivers air within a designed range to the combustion chamber, and a schematic of its components is shown in
Figure 3b. Air is sourced from a Roots blower, capable of providing a maximum airflow of approximately 20 g/s under the peak operating conditions of the combustion chamber. The airflow in each path is regulated via adjustable throttling, employing an FS400-ZY-01 pipeline air velocity transmitter, which operates within a range of 0–50 m/s, with a response time below 0.1 s, a temperature coefficient of typically 0.3%/K, and an operating temperature range of 253.15 K to 333.15 K. A flow measurement device provides real-time flow data to a microcontroller, which converts the air velocity information into the mass flow rate and adjusts it in real time based on the target values.
The fuel system comprises a fuel tank, fuel filter, fuel pump, fuel measurement system, and fuel injector. The connection pipes consist of 4 mm plastic hoses with joints employing quick-connect fittings. The fuel injector is constructed from a thin steel tube with an inner diameter of 0.6 mm. The fuel filter adopts a small fuel filter commonly used in model aircrafts. The fuel pump employs a gear pump with a rated pressure of 20 MPa and a nominal displacement of 1 mL/r, delivering fuel into the combustion chamber through a control device, as shown in
Figure 3c. To regulate the fuel flow, a differential pressure sensor with a measurement range of 0–5000 Pa is utilized. During operation, increasing the fuel pump voltage increases the fuel quantity, which is measured using a float flowmeter, and the fuel flow into the combustion chamber is determined using the pressure difference/fuel quantity relationship curve illustrated in
Figure 3d.
Regarding the air input control device, to minimize the error in the gas flow during the setup process, the control of gas flow velocity is achieved by adjusting the opening of the gas control valve. The joints utilized variable diameter PVC joints, featuring an inlet diameter of 50 mm and an outlet diameter of 40 mm, with short connections between joints employing plexiglass tubes. The formula is as follows:
P1 and P2 denote gas pressures upstream and downstream of the valve, A1 and A2 denote cross-sectional areas upstream and downstream of the valve, v represents gas flow velocity, and ρ represents air density, adopted as 1.185 kg/m3 at the ambient temperature of 298 K.
The conversion calculation formula between mass flow rate and velocity flow rate is as follows:
In Equation (3), mm represents the mass flow rate, represents the density of the gas, A represents the cross-sectional area of the inlet, V represents the velocity of the airflow, and t1 and t2 represent the time span from t1 to t2.
The ignition process of a micro-combustion chamber involves multi-stage thermodynamic regulation and a synergistic mechanism of gas-liquid two-phase flow. Liquid fuels, which cannot be ignited directly under conventional conditions, necessitate a progressive ignition strategy induced by propane premixed combustion.
Initially, a high-frequency ignition device was activated to preheat the Combustion Chamber and establish the initial thermodynamic boundary conditions. Once the Gas Outlet temperature reaches the predetermined operational threshold of 150–200 °C, the auxiliary gas valve is opened to inject the propane-air premixed gas mixture. Simultaneously, the computer control system coordinates with the Air Intake Flow Control Device to precisely regulate the airflow through each inlet to the theoretical air demand corresponding to the stoichiometric ratio. After successfully establishing a stable propane combustion field, the high-frequency ignition device was deactivated. When the Gas Outlet temperature reaches the critical threshold of T2 = 500 °C, the fuel supply system is initiated, and the Fuel Flow Control Device is synchronously activated to enable the gradual introduction of liquid fuel. As the combustion field temperature increases to T3 = 700 °C, the auxiliary gas supply system is shut off. At this stage, the dynamic optimization of the multi-channel air distribution parameters of the Air Intake Flow Control Device is implemented, establishing an active control mechanism based on combustion oscillation feedback. This ensures that the Combustion Chamber maintains a stable lean blowout limit under low equivalence ratio conditions. This ignition strategy achieves a smooth transition of combustion modes through a staged temperature-trigger mechanism, ultimately forming a swirl-stabilized combustion flow field structure [
16]. After ignition, the flame combustion state is observed through the observation window of the combustion chamber. The flame in the combustion chamber observation window is allowed to burn stably, as shown in
Figure 3e.
Based on the actual operating conditions of the combustion chamber, the experiment controls the mass flow rates of air and fuel at each intake port by adjusting the valve opening. Closed-loop control is used with the idle condition where the combustion chamber can form stable combustion as the basis, recording intake air mass flow rate, fuel mass flow rate, and combustion chamber outlet temperature. The experimental data are presented in
Table 3.
Combustion efficiency is a core indicator for measuring the efficiency of converting fuel chemical energy into thermal energy. The fuel used in the combustion test is aviation kerosene. Since its composition is not a single compound but a mixture of multiple hydrocarbons, its composition affects the combustion calorific value. Typically, the lower heating value of aviation kerosene is between 42.8 and 43.5 MJ/kg [
17,
18]. In the calculation process of this paper, LHV = 43 MJ/kg is taken as the calculation reference, and the thermal enthalpy method is used to calculate the outlet combustion efficiency. The formula is:
In Formula (3), represents air mass flow rate, signifies fuel mass flow rate, denotes total temperature before the combustion chamber, indicates total temperature at combustion chamber outlet, and LHV denotes fuel lower heating value. Here, the adopted ambient temperature is 298 K, and = 1100 kJ/(kg·K).
3. Combustion Characteristic Result
The fuel undergoes primary mixing with the quantitatively compressed air introduced via Inlet 5 at the end of the Inlet 5 intake duct and the front end of the evaporation tube. Subsequently, atomization and phase change processes occur in the evaporation chamber and evaporation tube. The fully vaporized premixed gas flows through the evaporation tube outlet section and enters the combustion chamber ignition zone with a specific turbulence intensity. Under high-temperature recirculation heat transfer excitation, quantitative air simultaneously enters through Inlet 1 and Inlet 2. Through the gas distribution chamber, multiple equal-pressure air streams are injected into the combustion chamber via jet holes, triggering a chain oxidation reaction. The high-speed shear flow field dissipates the kinetic energy of the fuel plume, refining the Sauter mean diameter of the droplets to below 20 μm, significantly enhancing the evaporation rate and equivalence ratio uniformity. Concurrently, a portion of the secondary air forms a continuous gas film cooling barrier along the wall, achieving temperature gradient control of the combustion chamber inner wall by reducing the heat conduction flux, thus preventing material creep failure due to local overheating [
11]. For the evaporation tube outlet plane, the study focuses on igniting the gas and achieving stable combustion to reach the combustion chamber idle state.
The temperature distribution cloud map of the A-A cross-section was obtained using a numerical simulation method, as shown in
Figure 4.
From Experiment 1 to Experiment 12, the observations reveal that the high-temperature combustion zone resides at a radius of 4 mm from the evaporation tube. In Experiments 1, 6, and 8, effective cooling occurs at the upper and lower walls of the combustion chamber near the ignition zone entrance. This positions the high-temperature region in the middle of the combustion chamber, enabling efficient cooling of the chamber walls. The temperature in the ignition zone varies with the fuel flow rate.
Table 3 indicates that under identical fuel flow conditions, Experiments 1, 6, 8, and Experiment 12—exhibiting relatively high AFR in the evaporation tube—demonstrate a lower temperature gradient at the flame tube wall, providing thermal insulation to the upper and lower combustion chamber walls.
After passing through the ignition zone, the gas mixture integrates high-temperature combustion products with cold air entering via Inlet 3 and Inlet 4. This reduces the combustion chamber outlet temperature while enhancing the combustion efficiency. In the ignition zone, the fuel and air blend and ignite, producing high-temperature and high-pressure gas. Subsequently, this gas proceeds to the dilution zone, where it mixes with a specific proportion of cold air. At this stage, the dilution zone displays a gradual blending of high-temperature combustion products and cold air, resulting in a decreased and more uniform gas temperature, thereby preventing localized overheating.
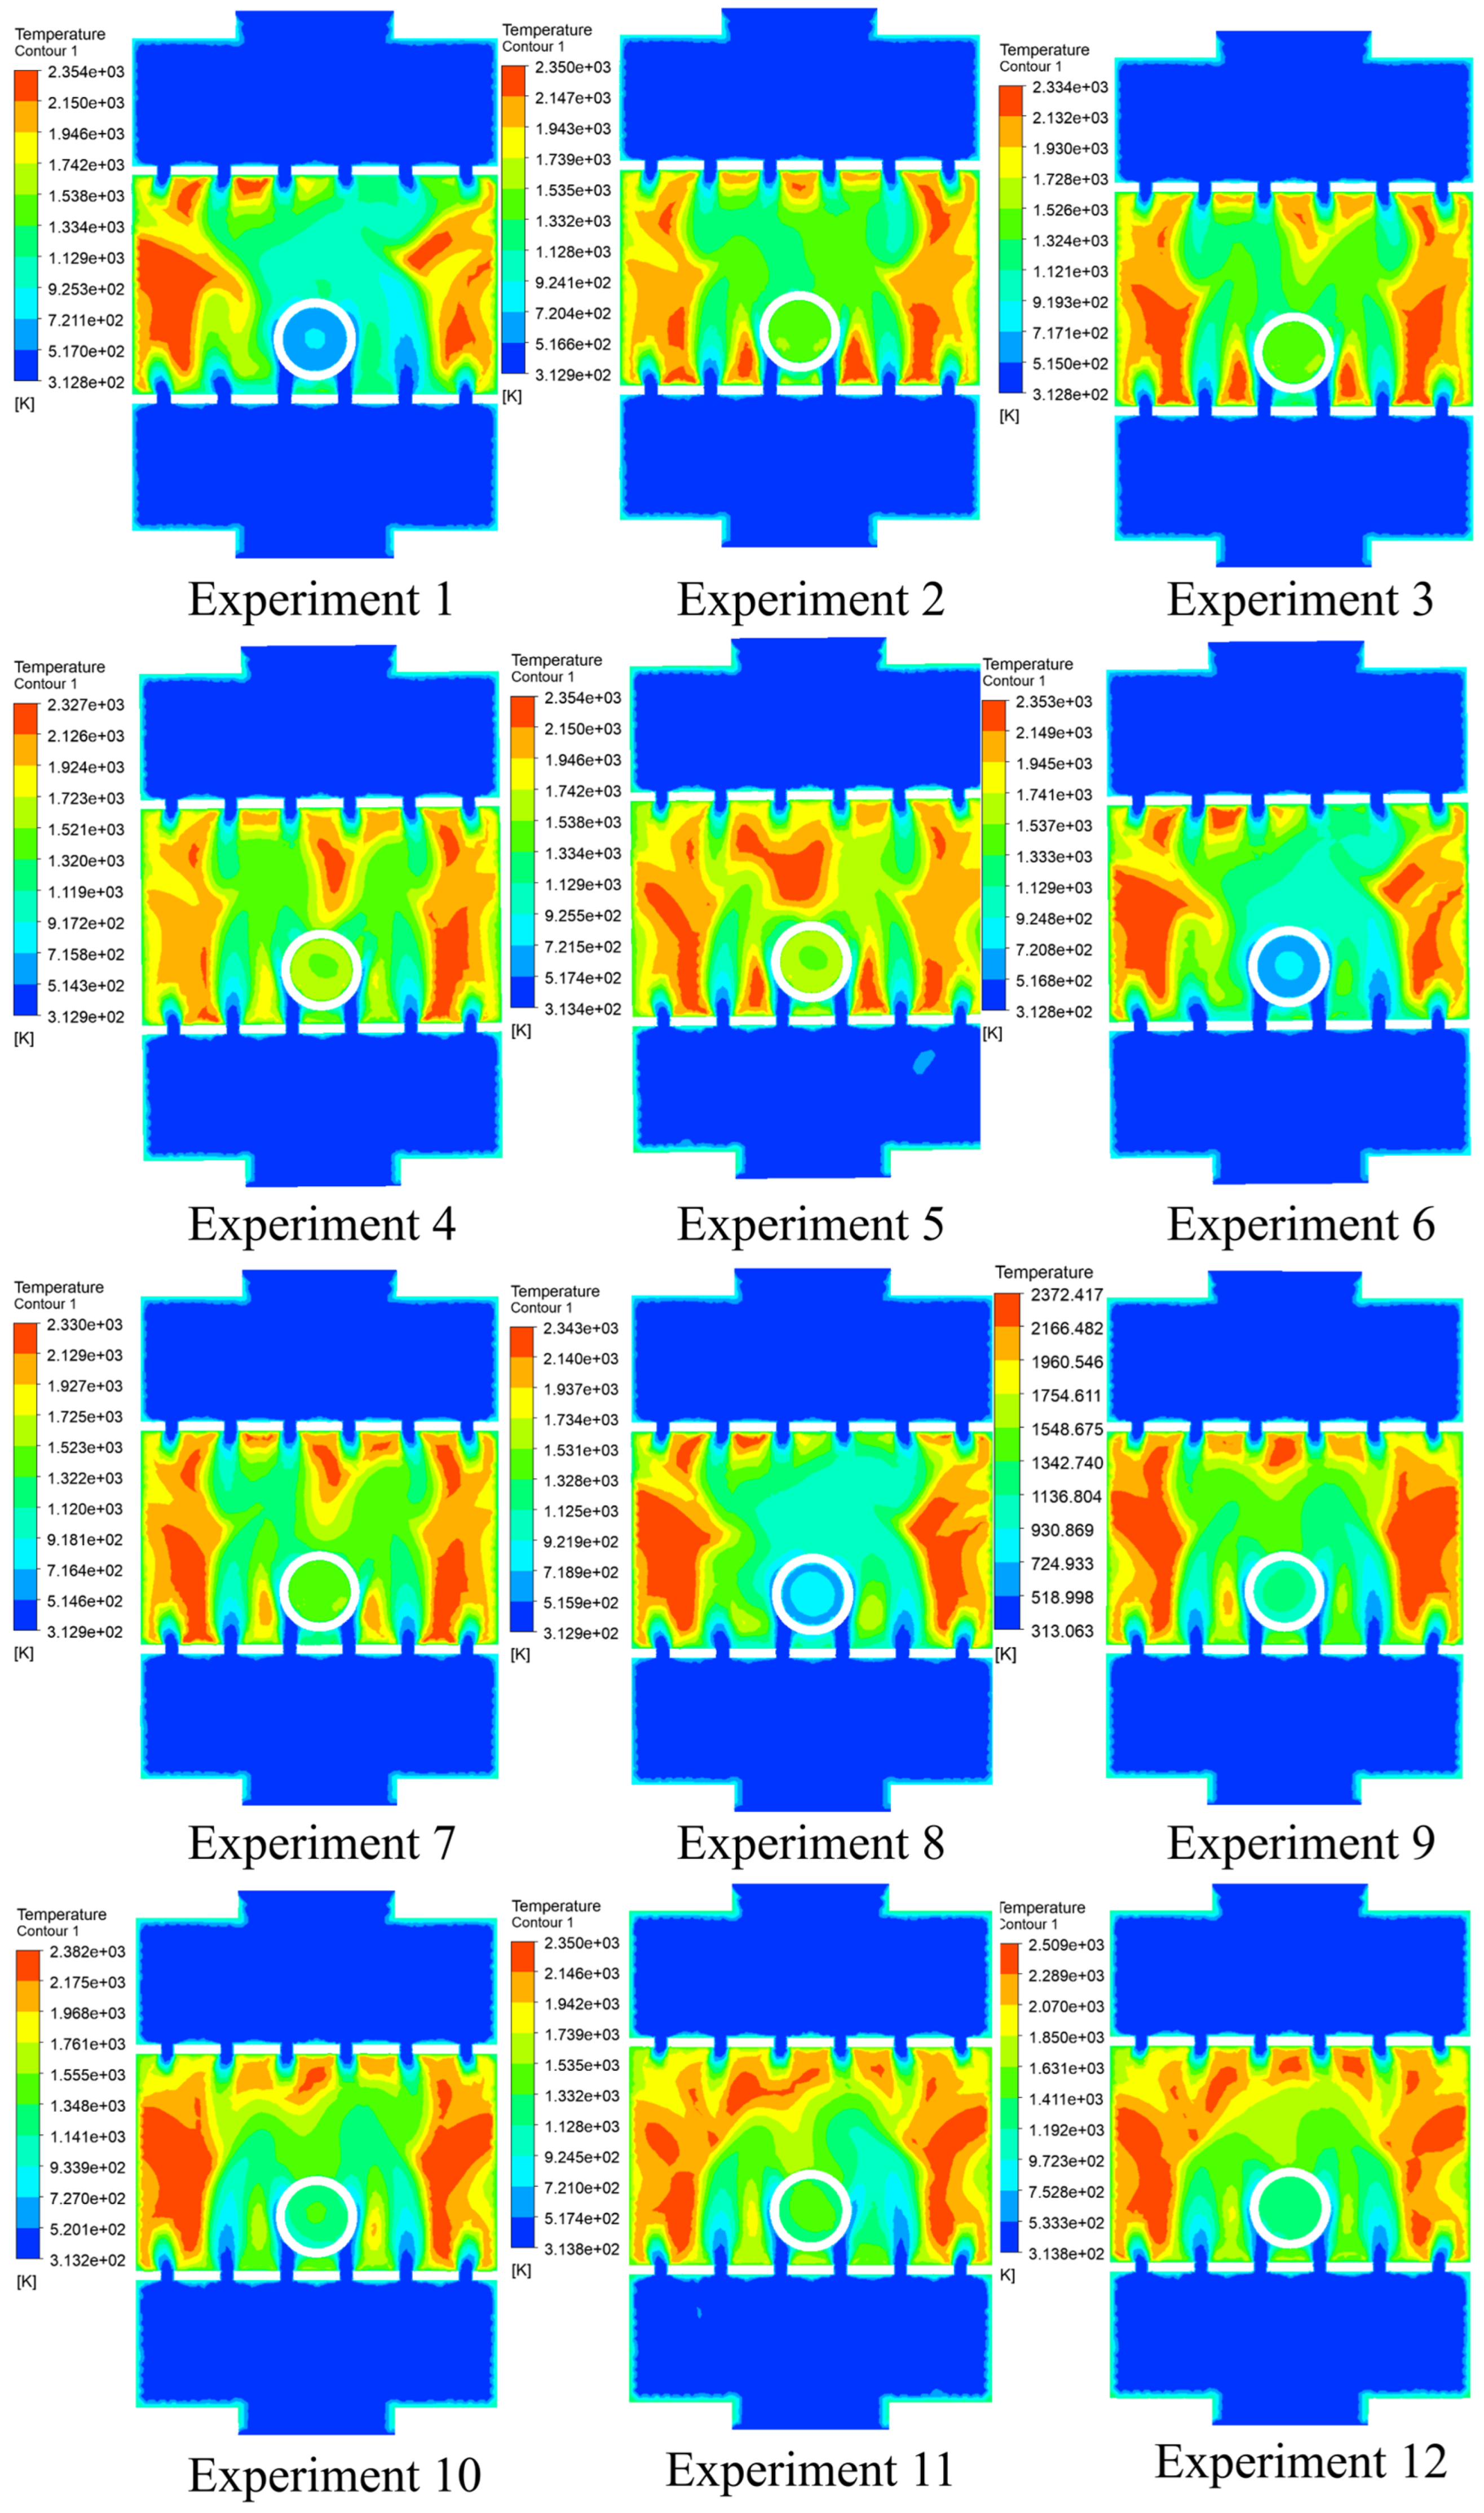
The temperature distribution contour maps of the B-B section from the 12 experiments are presented in
Figure 5.
Upon entering the Dilution Zone, the high-temperature, high-pressure combustion gases show a significant reduction in the extent of the dense high-temperature region. The temperature gradient maps indicate a substantial decrease in the proportional area of the high-temperature zone. In Experiment 1 through Experiment 10, elongated high-temperature regions form on both sides of the evaporation holes, creating concentrated high-temperature zones that cause localized overheating. This incomplete combustion leads to energy loss. However, this characteristic diminishes in Experiment 10, where the high-temperature regions transition into dotted patterns, and the remaining areas exhibit a more uniform green gradient temperature distribution, indicative of improved mixing performance [
19]. In the temperature contour maps of Experiment 11 and Experiment 12, a distinct temperature distribution pattern emerges. The high-temperature zones are exclusively dotted, with a larger area of sub-high-temperature regions, indicating a more stable combustion process and higher combustion efficiency [
20,
21].
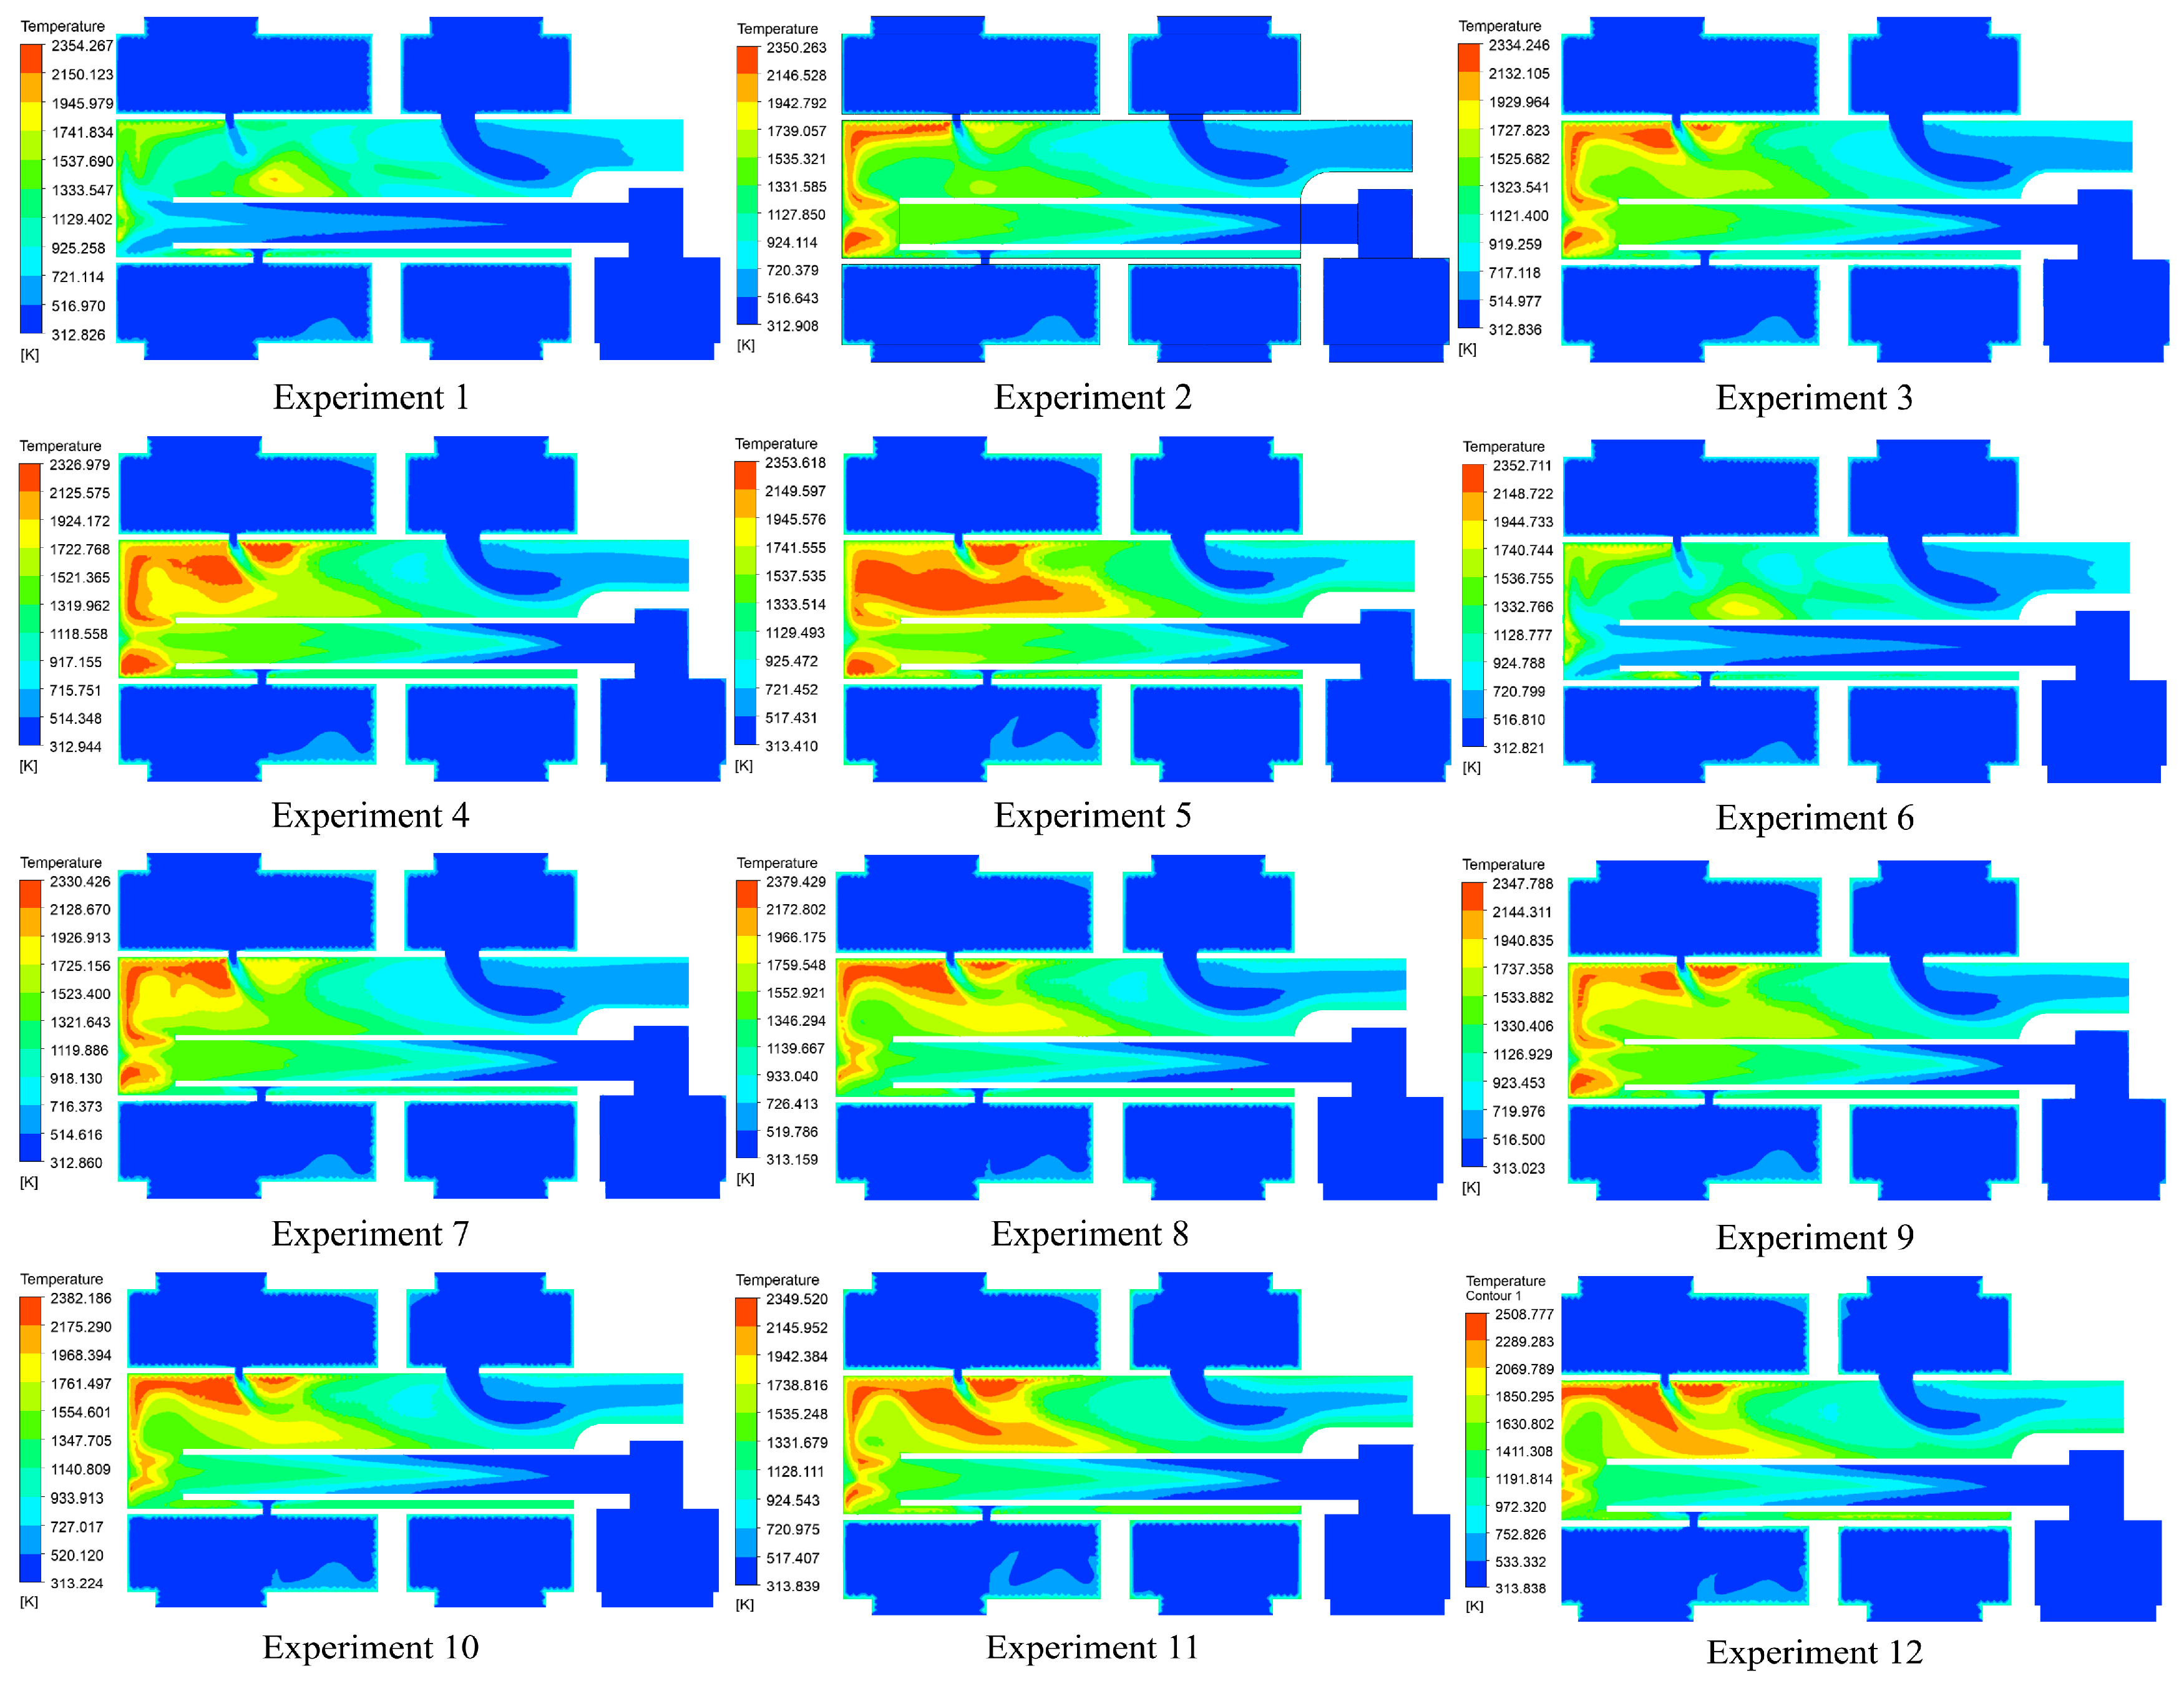
By integrating the temperature contour maps of the C-C Section, the longitudinal temperature variations of the airflow within the Combustion Chamber during the flow process can be better understood. A temperature contour map of the C-C Section is presented in
Figure 6.
The temperature gradient in the C-C section at the junction between the ignition zone and dilution zone reveals low-temperature cavity regions, indicating incomplete combustion in the gas region. When the AFR in the evaporation tube was excessively high, as in Experiment 1 and 6, the temperature contour maps display multiple low-temperature cavities, impeding flame propagation and reducing combustion efficiency. Conversely, when the AFR is too low, as in Experiment 5, the ignition zone exhibits a large high-temperature region, with slow evaporation and combustion of fuel droplets, increasing the risk of rich flameout and lowering the efficiency. Experiments 11 and 12 show significantly higher peak temperatures in the ignition zone and dilution zone than those in the control group, with a smoother temperature gradient. Combined with the temperature field distribution maps of the A-A and B-B sections, these experiments demonstrate a more uniform temperature gradient, markedly enhancing the fuel-air mixing efficiency and reaction rate, thus improving the combustion completeness.
The state after the fuel enters the evaporation tube enables direct observation of combustion by the C-C section. As the combustion process stabilizes in the combustion chamber, the high-temperature region gradually extends into the evaporation tube, accelerating the fuel evaporation rate. The partial gaseous fuel mixes with the fifth-path air, triggering combustion and producing a conical temperature distribution inside the evaporation tube. In experiments with a relatively low AFR, a large secondary high-temperature region forms outside the evaporation tube, with the most pronounced conical temperature gradient inside. As the AFR in the evaporation tube increases, the high-temperature region outside the evaporation tube at the C-C section diminishes, and the conical temperature gradient inside becomes flatter.
The gas Outlet of the micro-combustion chamber converts the heat energy released during combustion into the kinetic and pressure energy of the working medium, providing a stable gas source for turbine operation or propulsion. The converging duct at the outlet regulates the velocity distribution through its geometric design, minimizing flow separation and total pressure losses to ensure efficient turbine performance [
22]. Furthermore, to prevent excessive thermal stress on the turbine blades and suppress the emission of exhaust pollutants, the converging outlet of the Combustion Chamber must adjust the temperature field of the exhaust gases to ensure uniformity. The temperature contour map at the outlet of the micro-combustion chamber is shown in
Figure 7.
The combustion gases at the Gas Outlet of Combustion Chamber are influenced not only by the oil-gas mixture within the Evaporation Tube but also by the mixing effects of air in the ignition and Dilution Zone. Consequently, focusing solely on the fuel-air mixture ratio within the Evaporation Tube provides an incomplete assessment [
23]. Through the analysis of data from 12 experiments, the mass flow ratio of all air entering the Combustion Chamber to the fuel was determined, as presented in
Table 4.
Combining the AFR data from
Table 4, excessively high AFR, as observed in Experiments 1, 2, 3, 6, 7, and 8, leads to extensive low-temperature regions. This is likely due to excessive airflow within the evaporation tubes, where the resultant impact force mixes with the air input in the ignition and mixing zones, causing local combustion or insufficient mixing. Consequently, the release of chemical energy remains incomplete, resulting in significant temperature disparities. Conversely, when the AFR drops too low, such as in Experiment 5 with an AFR of 43.54, reduced airflow generates concentrated, small high-temperature regions at the combustor exit. This suggests inadequate fuel cooling during mixing, and elevated exit temperatures may induce local overheating of the turbine blades, accelerating aging or deformation, thereby reducing the equipment’s lifespan. As AFR increases progressively, local high-temperature areas in the temperature contours diminish. Beyond a certain threshold, a low-temperature region forms at the combustor exit center, expanding with an increasing Fuel-Air Ratio, eventually yielding multiple low-temperature zones. In micro turbojet engine operation, controlling the combustor exit temperature and regional temperature differences can enhance the turbine lifespan to some extent. The numerical simulation results indicate favorable exit gas conditions when the AFR ranges between 43.54 and 56.79.
To quantify the numerical simulation results, the Function Calculator computes the temperature and velocity at the Gas Outlet, yielding average temperature and velocity values for the Outlet Section, as presented in
Table 5.
The experiments, conducted at a constant ambient temperature of 298 K, measure the outlet temperature at the combustion chamber exit using three parallel temperature sensors. The combustion conditions are controlled via fuel and airflow control system. In the steady-state combustion, temperature readings are recorded every 5 s, averaging ten measurements. The results, calculated using the temperature rise method, are presented in
Table 6.
The average Total Temperature calculated from the numerical simulation results in
Table 5 is compared with the Outlet Total Temperature measured during the Combustion Chamber experiments in
Table 6. The resulting data analysis is presented in
Figure 8a.
While maintaining a constant ratio of airflow between the ignition and the Dilution Zone relative to the total airflow, the AFR within the Evaporation Tube is varied. Using the combustion efficiency as a reference standard, a B-spline fit is applied to the scattered data points, yielding the relationship depicted in
Figure 8b.
The combustion exit velocity in micro-annular combustion chambers is a crucial metric for assessing combustion performance and governing the hot gas flow velocity into the turbine. Correlating the average velocity data from
Table 5 with the mass fuel flow rate data from
Table 3 enables an in-depth assessment of the fuel input’s effect on the combustion exit velocity. The mass fuel flow rate denotes the fuel supply rate per unit time, which is directly linked to the energy release during combustion. Second-order polynomial regression was applied to the scatter data, generating
Figure 8c to illustrate their correlation.
Figure 8a compares the numerical simulation with the experimental data, yielding a Pearson correlation coefficient of 0.991, with |r| > 0.5, indicating a strong correlation between the two datasets [
24]. This demonstrates that the numerical simulation results can characterize the temperature variations within the combustion chamber. Analysis of the temperature contour maps across various cross-sections suggests that an appropriate air-fuel ratio (AFR) promotes uniform fuel distribution and combustion within the combustion chamber. A uniform temperature gradient within the chamber represents a phenomenon linked to high combustion efficiency. The combustion efficiency exhibits a marked increase followed by a gradual decline, peaking when the AFR ranges from 4.20 to 4.96.
Since the experiments utilized a simplified combustor model that differed from actual annular combustors, the flow distribution ratios between the ignition and mixing zones, as well as the derived optimal AFR, were established based on this simplified model, thereby exhibiting certain limitations.
Figure 8b shows the relationship between the combustion efficiency and AFR. When the AFR ranges between 3.991 and 4.201, the combustion efficiency exhibits a marked increase followed by a gradual decline, peaking when the AFR ranges from 4.20 to 4.96.
In
Figure 8c, the coefficient of determination R
2 for the second-order polynomial fitting curve reaches 0.9947, indicating that the model accounts for 99.47% of the experimental data, thereby confirming the statistical significance of the goodness of fit. This allows the inference that, during stable combustion in a micro-annular combustion chamber under idle conditions, the average velocity at the exit correlates positively and significantly with the fuel mass flow rate.
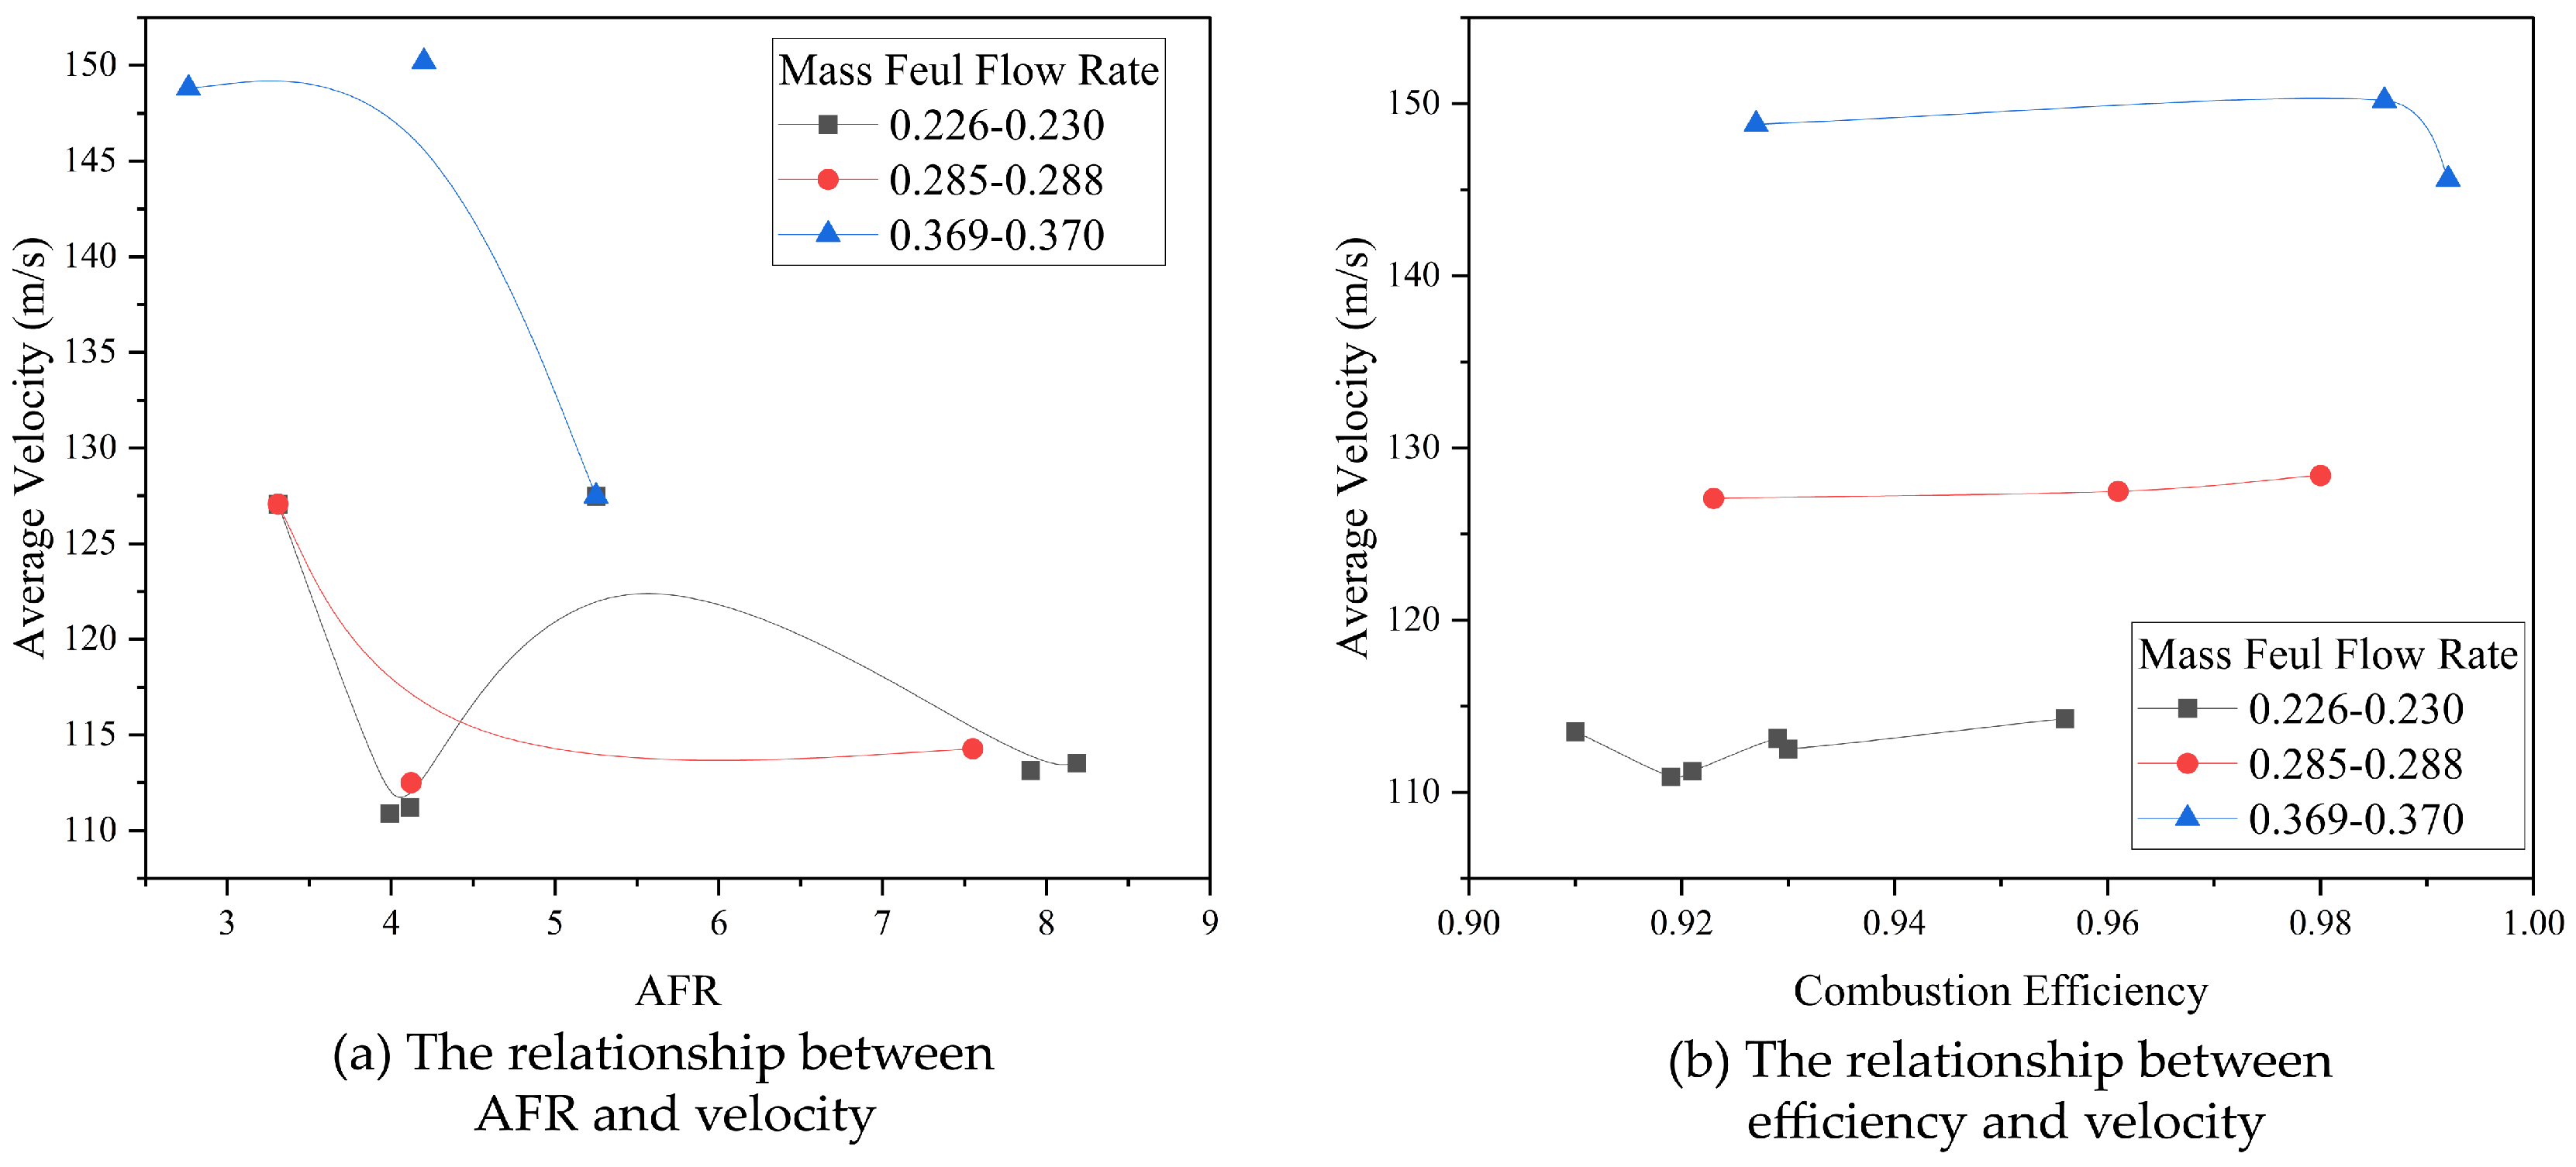
Further analysis involves constructing a relationship diagram between the AFR from
Table 5 and the average velocity from
Table 5 to examine their interplay. Given that average exit velocity lacks experimental validation, only simulation results are evaluated, as depicted in
Figure 9a. Since AFR within the evaporation tube influences combustion efficiency, a relationship diagram between average velocity and combustion efficiency is established to verify the connection between AFR and the combustion chamber’s exit velocity, as shown in
Figure 9b.
To mitigate interference from the fuel mass flow rate,
Figure 9 shows the grouped simulation results with similar fuel flow rates, distinguished by different colors.
In
Figure 9a, the B-spline fitting of the three data groups reveals distinct distribution patterns for varying AFRs. The scatter plot in
Figure 9b further demonstrates that the combustion efficiency exerts no influence on the combustion chamber’s average exit velocity, leading to the conclusion that the AFR within the evaporation tube bears no relation to the combustion chamber’s average exit velocity.


