Article

Multiphysics Coupling Effects on Slope Deformation in Jiangte Xikeng Lithium Deposit Open-Pit Mining

1
Institute of Mine Safety Technology, China Academy of Safety Science and Technology, Beijing 100012, China
2
Cathay Safety Technology Co., Ltd., Beijing 100012, China
3
Zhaoqing Runxin New Materials Co., Ltd., Zhaoqing 526000, China
4
State Key Laboratory of Nuclear Resources and Environment, East China University of Technology, Nanchang 330013, China
*
Author to whom correspondence should be addressed.
Processes 2025, 13(6), 1686; https://doi.org/10.3390/pr13061686
Submission received: 5 March 2025 / Revised: 20 May 2025 / Accepted: 26 May 2025 / Published: 27 May 2025
(This article belongs to the Topic Green Mining, 2nd Volume)

Abstract

Geotechnical slope failures—often precursors to catastrophic landslides and collapses—pose significant risks to mining operations and regional socioeconomic stability. Focusing on the Jiangte Xikeng lithium open-pit mine, this study integrates field reconnaissance, laboratory testing, and multi-physics numerical modeling to elucidate the mechanisms governing slope stability. Geological surveys and core analyses reveal a predominantly granite lithostratigraphy, bisected by two principal fault systems: the NE-striking F01 and the NNE-oriented F02. Advanced three-dimensional finite element simulations—accounting for gravitational loading, hydrogeological processes, dynamic blasting stresses, and extreme rainfall events—demonstrate that strain localizes at slope crests, with maximum displacements reaching 195.7 mm under blasting conditions. They indicate that differentiated slope angles of 42° for intact granite versus 27° for fractured zones are required for optimal stability, and that the integration of fault-controlled instability criteria, a coupled hydro-mechanical-blasting interaction model, and zonal design protocols for heterogeneous rock masses provides both operational guidelines for hazard mitigation and theoretical insights into excavation-induced slope deformations in complex metallogenic environments.

1. Introduction

In sectors such as construction, transportation, railways, mining, water conservancy, and power generation, slope engineering is ubiquitous—and nowhere more so than in large hydropower projects, where the deformation of complex, steep slopes poses a growing geotechnical challenge [1,2,3,4,5]. If overlooked during design or construction, slope failures can delay progress, inflate costs, compromise quality, and—most critically—endanger lives and property [6,7,8,9,10]. These risks place stringent demands on both construction methods and stability analysis standards, making slope stability a cornerstone of geotechnical, geological and disaster mitigation engineering [11,12,13,14,15]. As global infrastructure expands, projects increasingly involve high slopes, deep excavations, and intricate geology, all of which heighten the potential for landslides and collapses, especially in regions like Southwest China—where active tectonics and heavy rainfall frequently trigger failures that threaten roads, dams, and communities. A comprehensive examination of slope stability analysis and its practical applications is, therefore, vital to improving early-warning systems and refining mitigation strategies [16,17,18]. Although China’s systematic research in this field began later, recent advances in numerical simulation and computer technology have propelled it from early qualitative assessments to today’s sophisticated quantitative methods. Meanwhile, international scholarship—pioneering slope stability studies since the early 20th century—continues to enrich theory and practice with ever more refined geomechanical models and computational techniques.
Research methods for slope stability analysis fall into two main categories: qualitative and quantitative approaches [19,20,21,22]. Qualitative methods—such as engineering geological analogy and stereographic projection—evaluate stability by examining geological conditions, rock mass structures, and historical failures; although widely used in early practice, they rely on subjective judgment and cannot precisely quantify safety factors [23,24,25]. Quantitative methods include limit equilibrium techniques (e.g., Bishop and Janbu), which assume a predefined slip surface and are best suited to homogeneous slopes [26,27,28,29,30], and numerical simulations using finite element (FEM) and discrete element (DEM) models to capture complex stress fields and deformations [31,32,33]. Recently, the strength reduction method (SRM) has gained popularity in FEM software (e.g., ANSYS 2025 R1, FLAC 3D 7.0) by reducing rock and soil strength parameters until failure, thereby enhancing accuracy [34]. Lu Ning et al. introduced the local factor of safety (LFS) field method to compute safety factors at every point under rainfall infiltration, avoiding the need to predefine slip surfaces and proving effective for shallow landslide assessment [35]. Wang Xutao et al. compared various techniques on the same slope and found LFS results aligned with field surveys and traditional rigid body limit equilibrium, highlighting its ability to delineate evolving instability zones for remediation planning [36]. Yulong Zhu et al. further coupled surface and subsurface flow models with LFS—using the shallow water equation, Richards’ equation, and Green–Ampt infiltration—to underscore LFS’s advantages under rainfall and show that unsaturated soil slope failures are typically shallow and parallel to the surface [37]. To simplify the analysis, many studies adopt the infinite slope model for plane strain conditions, as demonstrated by Ma Shiguo’s work on infinite slopes with impermeable layers using the Mohr–Coulomb theory [38] and Li Mengzi’s investigation of tensile strength effects under steady seepage [39]. With increasing engineering complexity, uncertainty methods—such as Monte Carlo simulation, fuzzy mathematics, and the double-strength reduction approach, which also reduces permeability—have emerged to account for parameter variability and provide probabilistic, risk-informed insights into groundwater impacts on slope stability [40,41].
Domestic researchers have developed a range of slope stability calculation techniques tailored to various geological settings, with the limit equilibrium, finite element, and discrete element methods seeing widespread application. More recently, machine-learning-based prediction models have emerged as a research frontier: for example, Zhang et al. [42] trained on an extensive database of slope case studies to forecast stability states with high accuracy. Internationally, classical approaches such as the Swedish, Bishop, and Janbu methods remain foundational, while numerical simulation techniques have gained prominence [43,44,45]. Notably, Griffiths and Lane’s finite element-based analysis accommodates complex geology and nonlinear material behavior, further advancing the field’s capability to model real-world slope conditions. Domestic researchers have advanced slope monitoring technology by developing a range of sophisticated systems. Optical fiber sensing networks now track slope deformation and stress in real time, supplying vital data for stability assessment. For example, Zhang et al. [46] implemented long-term optical fiber monitoring on a highway slope and successfully issued early warnings of instability. Zhang et al. [47,48] evaluated prestressed anchors through field trials and numerical simulations, showing substantial improvements in slope stability. Abroad, GPS-based monitoring platforms similarly enable continuous measurement of slope movement, as demonstrated by Mikkelsen [33], who used GPS sensors to observe a mine slope over time and provided timely alerts of potential failure. In the realm of slope reinforcement, domestic scholars have championed effective techniques such as prestressed anchors, anti-slide piles, and soil nail walls, all of which are now commonplace in stabilization projects [49]. Internationally, geosynthetic solutions—including geogrids, geotextiles, and geomembranes—are widely employed, with Jones and Clarke [34] demonstrating via field tests and simulations that geogrids can markedly enhance slope performance. Regarding the infiltration characteristics under rainfall, Fu Jianxin et al. [50] established a two-dimensional rainfall infiltration model for unsaturated soil slopes based on Darcy’s law and the conservation of mass. Through numerical solutions, they found that the initial water content of the soil significantly affects the rate of increase in volumetric water content in the near-surface soil of the slope, while its impact on deeper soil layers is relatively minor. Das et al. [51], based on unsaturated soil mechanics and accounting for the elastoplastic deformation of the soil, developed a coupled fluid–solid model for slopes under rainfall conditions and discovered that using rheological coupling deformation can effectively predict the timing of slope failure, the failure region, and the deformation mode. Regarding the factors influencing slope stability, Wang Jiangping et al. [52] utilized unsaturated soil theory and GeoStudio 2024.2.1 to study the effects of matric suction, rainfall intensity, and slope angle on slope stability. They found that rainfall intensity significantly impacts slope stability only when the saturated hydraulic conductivity is relatively high. Gu Yuming et al. [53], based on saturated–unsaturated theory, a rainfall infiltration model, and the Slope/W platform in Geo-studio, investigated the rainwater infiltration patterns under different directional hydraulic conductivities and analyzed the effects of anisotropic hydraulic conductivity, soil cohesion, and internal friction angle on slope stability.
Due to the heterogeneity of rock and soil properties, the complexity of geological conditions, mechanical interaction mechanisms, as well as the uncertainty of these influencing factors, the deformation and instability mechanisms of open-pit mine slopes are extremely complex [54,55,56]. At present, the rock mass in mine slope areas has not been fully exposed, and the geological conditions of the slopes remain highly uncertain. To ensure the safety of slopes in future open-pit mining, research on safety measures for high and steep slopes is of significant guiding importance. In this study, we first obtain information on geological structures and the properties of rock and soil layers through field geological surveys and laboratory core analyses. Detailed descriptions of the geological structural features are provided, including the lithology of the strata, the orientations and development degrees of structural surfaces, and joint parameters. Next, based on on-site engineering geological investigations, engineering exploration results, and laboratory physical–mechanical test outcomes, reasonable mechanical parameters for the slope rock and soil mass are determined. A quality evaluation of the mine rock mass is then performed, with reduced parameters obtained to provide fundamental data support for subsequent stability analysis. Finally, based on the finite element method, simulation experiments are conducted on slope stress and deformation, failure characteristics, and rainfall infiltration patterns to reveal the slope instability mechanisms. Through qualitative slope stability analysis and parameter optimization, slope stability is ensured, and safety hazards are eliminated.

2. Engineering Geological Features

2.1. Engineering Geological Conditions of the Mine Area

The Xikeng Lithium Mine is located in Tong’an Township, Yifeng County, Jiangxi Province, as shown in Figure 1. The mine area features a low-mountain, hilly landscape rising from +326 m to +661.6 m, with higher terrain in the north and a central plateau flanked by lower eastern and western margins. Deeply dissected valleys promote efficient surface runoff, while ridges predominantly trend northwest–southeast and north–south, with slopes ranging between 10° and 35°. In places where the bedrock is highly weathering-resistant, small, steep scarps have formed. The lowest erosion base level throughout the area is +326 m.
Within the mine area, the stratigraphy is uncomplicated, comprising only Quaternary artificial fill and residual slope deposits. The artificial fill (Qml) occurs sporadically on gentler slopes and in valleys. It is yellowish-brown, relatively compact, and consists primarily of strongly weathered granite fragments, gravelly materials, and minor sandy granite, all resulting from human accumulation, with thicknesses ranging from 0.35 to 30.10 m. The residual slope deposits (Qel + dl) likewise appear on gentler slopes and in valleys. These materials exhibit terra rossa, brown-yellow, and light-gray hues and are composed chiefly of sandy clay with rock debris, locally interbedded with gravelly or coarse sandy clay or spheroidal weathering nodules. Their thickness generally ranges from 0 to 0.5 m.

2.2. Geological Structures of the Mine Area

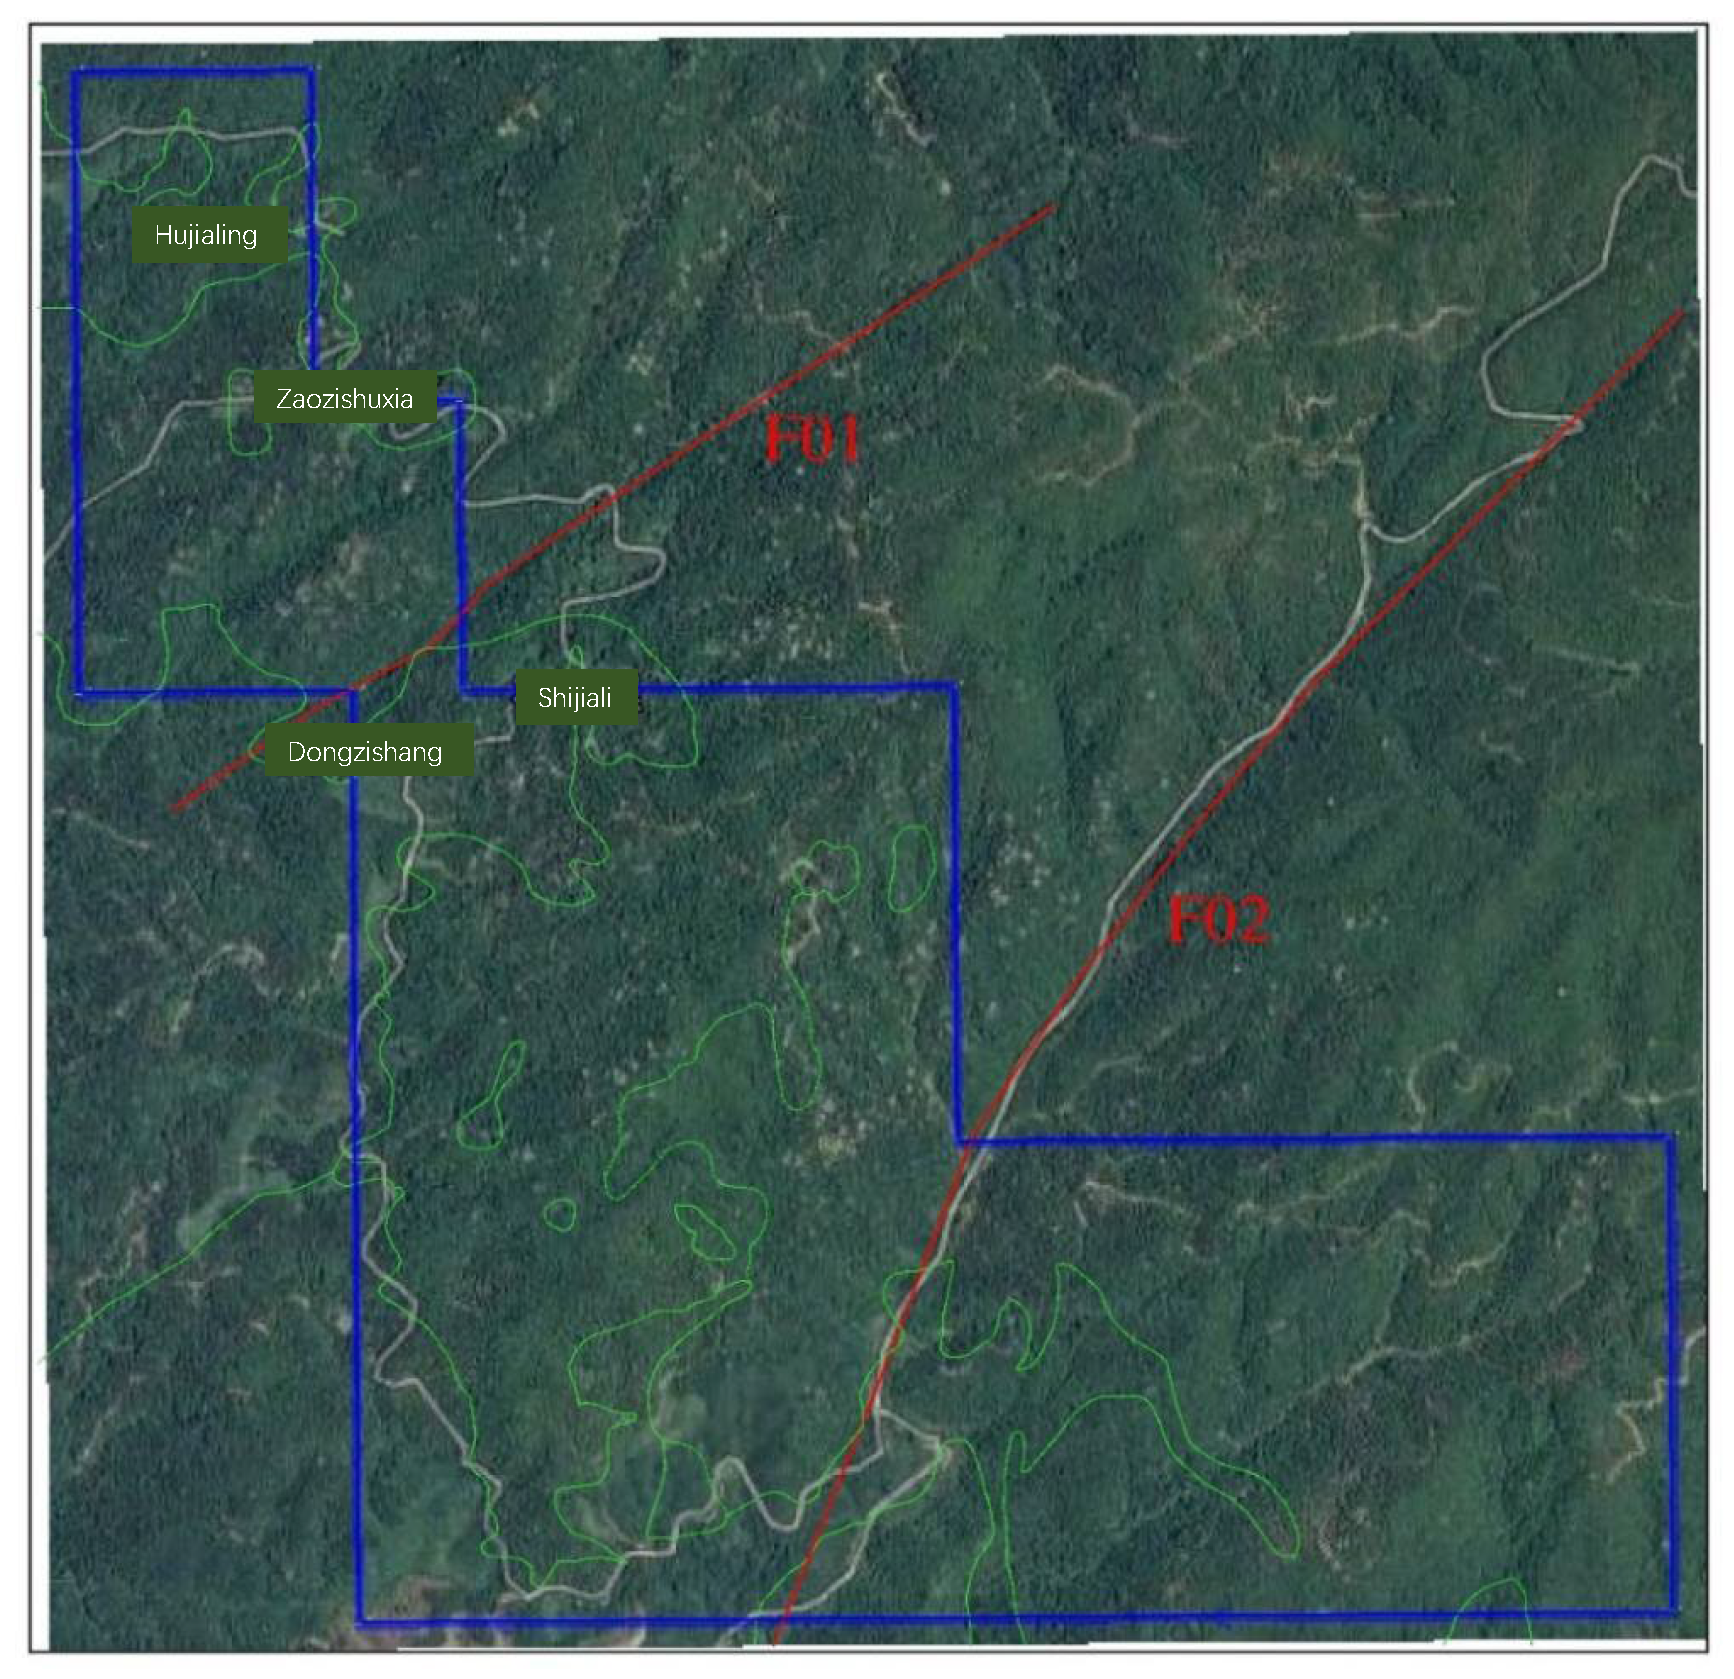
The Xikeng Lithium Mine area exhibits undeveloped tectonic structures, with two primary sets of faults: one trending northeast (F01 fault) and the other trending north–northeast (F02 fault). These faults are distributed along the north and south sides of the main open-pit mining area, and their tectonic activity has not caused any damage or impact on the ore body (see Figure 2).
F01 Fault is located in the northwestern part of the mine area, extending generally in a northeast direction. The F01 fault extends discontinuously for about 1.2 km—roughly 200 m of which lie within the mine—and measures 1 to 10 m in width. Striking 137° and dipping 75°, it is dominated by silicified fractures, forming a narrow, highly variable zone with abundant infill, minimal aperture, poor permeability, and low water-bearing capacity. The F02 fault, in the southeastern sector, trends NNE at 113°/60°, stretches over 3 km (with some 770 m inside the mine), and varies from 1 to 25 m wide. It is composed of a series of densely arranged, parallel thrust–torsion fractures, exhibiting good permeability but low water-bearing capacity. Since this fault is located at a considerable distance from the future open-pit mining area, its impact on future ore body extraction is minimal.
The F01 fault is located in the western part of the mine area, extending obliquely across the area from Nanxi Dongzi in the southwest toward the northeast via Shijiari. Overall, it trends northeast, with discontinuous extensions totaling approximately 1.2 km, of which about 200 m are within the mine area. The fault has a width ranging from 1 to 10 m, a strike of approximately 137°, and a dip of around 75° (see Figure 3). The fault cuts through the Early Cretaceous Guyangzhai rock mass and is predominantly characterized by silicified fracturing, with the fault zone being narrow and exhibiting significant variations in width.
The F02 fault extends in the southeastern part of the mine area, trending north–northeast with an approximate dip direction of 113° and a dip angle of about 60°, as shown in Figure 4. This fault intermittently stretches over 3 km, with about 770 m within the surveyed area, and varies in width from 1 to 25 m. It consists of a series of densely distributed, parallel compressive–torsional fractures. Its main geological features include geomorphologically appearing as a linear river cutting through ridges. Along the fault, localized intense silicified breccia zones are formed, with widths up to 8 m, where rocks predominantly form breccias. The breccias are mostly sub-angular, with a few being rounded, and clast sizes range from 3 to 7 mm. The footwall of the fault often features steep cliff terrains (fault scarps), while the hanging wall exhibits clear slickensides and striations.

3. Three-Dimensional Slope Stability Analysis

3.1. Slope Zoning

The slope is zoned based on the principle of consistency in key factors such as lithology, structure, engineering geological conditions, and hydrogeological conditions. According to geological survey results, the Xikeng mining area primarily exposes Early Cretaceous granite intrusions of different phases. These rock bodies, though varied in morphology, share distinct intrusive contacts, systematic structural variations, and similar mineralogical and chemical compositions, all pointing to a common evolutionary origin. Because engineering geological conditions differ across the pit, slope design parameters and deformation behaviors likewise vary. To capture these nuances, the pit is first divided into zones based on lithology, structural features, and hydrogeological conditions, then further subdivided according to slope geometry and orientation. Each resulting zone is assigned a representative geological and slope structure model, which serves as the foundation for stability calculations. The zoning principle ensures that sections with similar characteristics are grouped together, and each zone is represented using the same computational parameters.
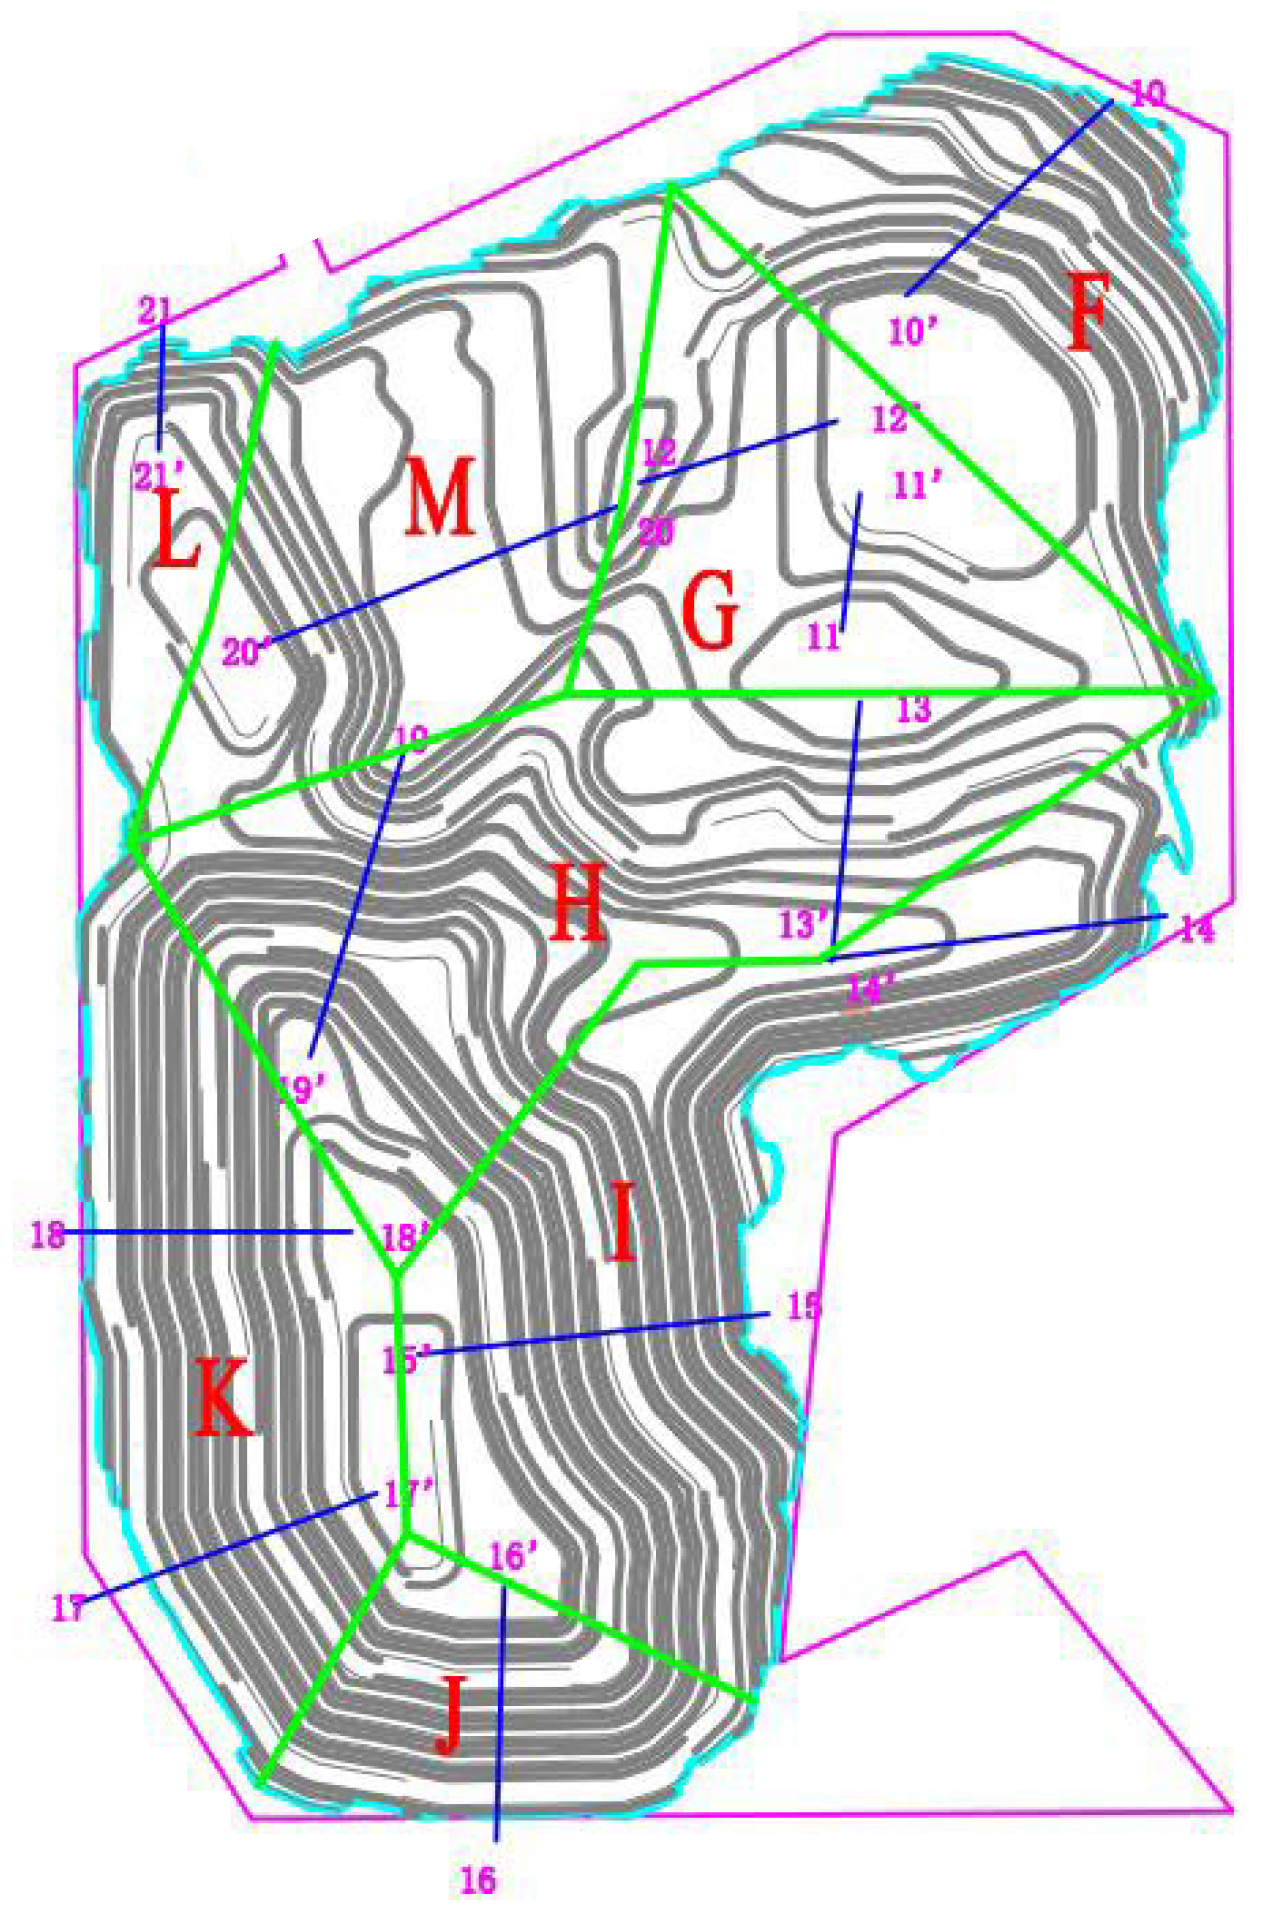
Based on the current mining conditions and the results of on-site engineering geological surveys, the main lithology constituting the mine slopes is granite. After considering factors such as slope parameters, rock mass conditions, geological profiles, and joint fissure investigations, the mine was divided into eight slope engineering geological zones: F, G, I, H, J, K, L, and M. The specific divisions, survey results, and failure mode statistics are shown in Figure 5.

3.2. Determination of Physical and Mechanical Parameters

Through field geological surveys and laboratory core analyses, the engineering properties of the rocks in the mining area were studied. The rocks were divided into four weathering grades—slightly, moderately, highly, and fully weathered—and subjected to a comprehensive experimental program. We performed 72 uniaxial compression tests (18 specimens per grade, arranged in six groups of three) and 78 triaxial compression tests (21 slightly weathered, 21 moderately weathered, and 18 each of the highly and fully weathered grades). To characterize physical properties, 70 samples of each grade were tested for water content, water absorption, saturated absorption, natural density, saturated density, dry density, and porosity. From these core-drilling experiments, we extracted the rock mechanical parameters and—after excluding outliers—derived the mean, maximum, and minimum values for use in our analyses. After reducing the rock mass mechanical parameters, data were selected between the average, maximum, and minimum values. The final values for the geotechnical mechanical calculation parameters are shown in Table 1 and Table 2.

3.3. Calculation Model and Boundary Conditions

In order to scientifically and reasonably assess the stability of the open-pit mine, the three-dimensional numerical model established must restore the geological prototype as accurately as possible. However, due to the complexity of the material structure in the mining area and the limitations of the surveying work, some idealized treatments of the slope conditions must be made during the modeling process. By extracting and analyzing data from the surface of the mining area, drilling information, and the final boundary of the open-pit mining design, the model was created using Rhino 8.18. Operations such as surface creation, curtain setting, and copying were applied to establish the entities, and the Griddle plugin was used for grid division. Ultimately, a true three-dimensional numerical calculation model of the current open-pit mining boundary was established.
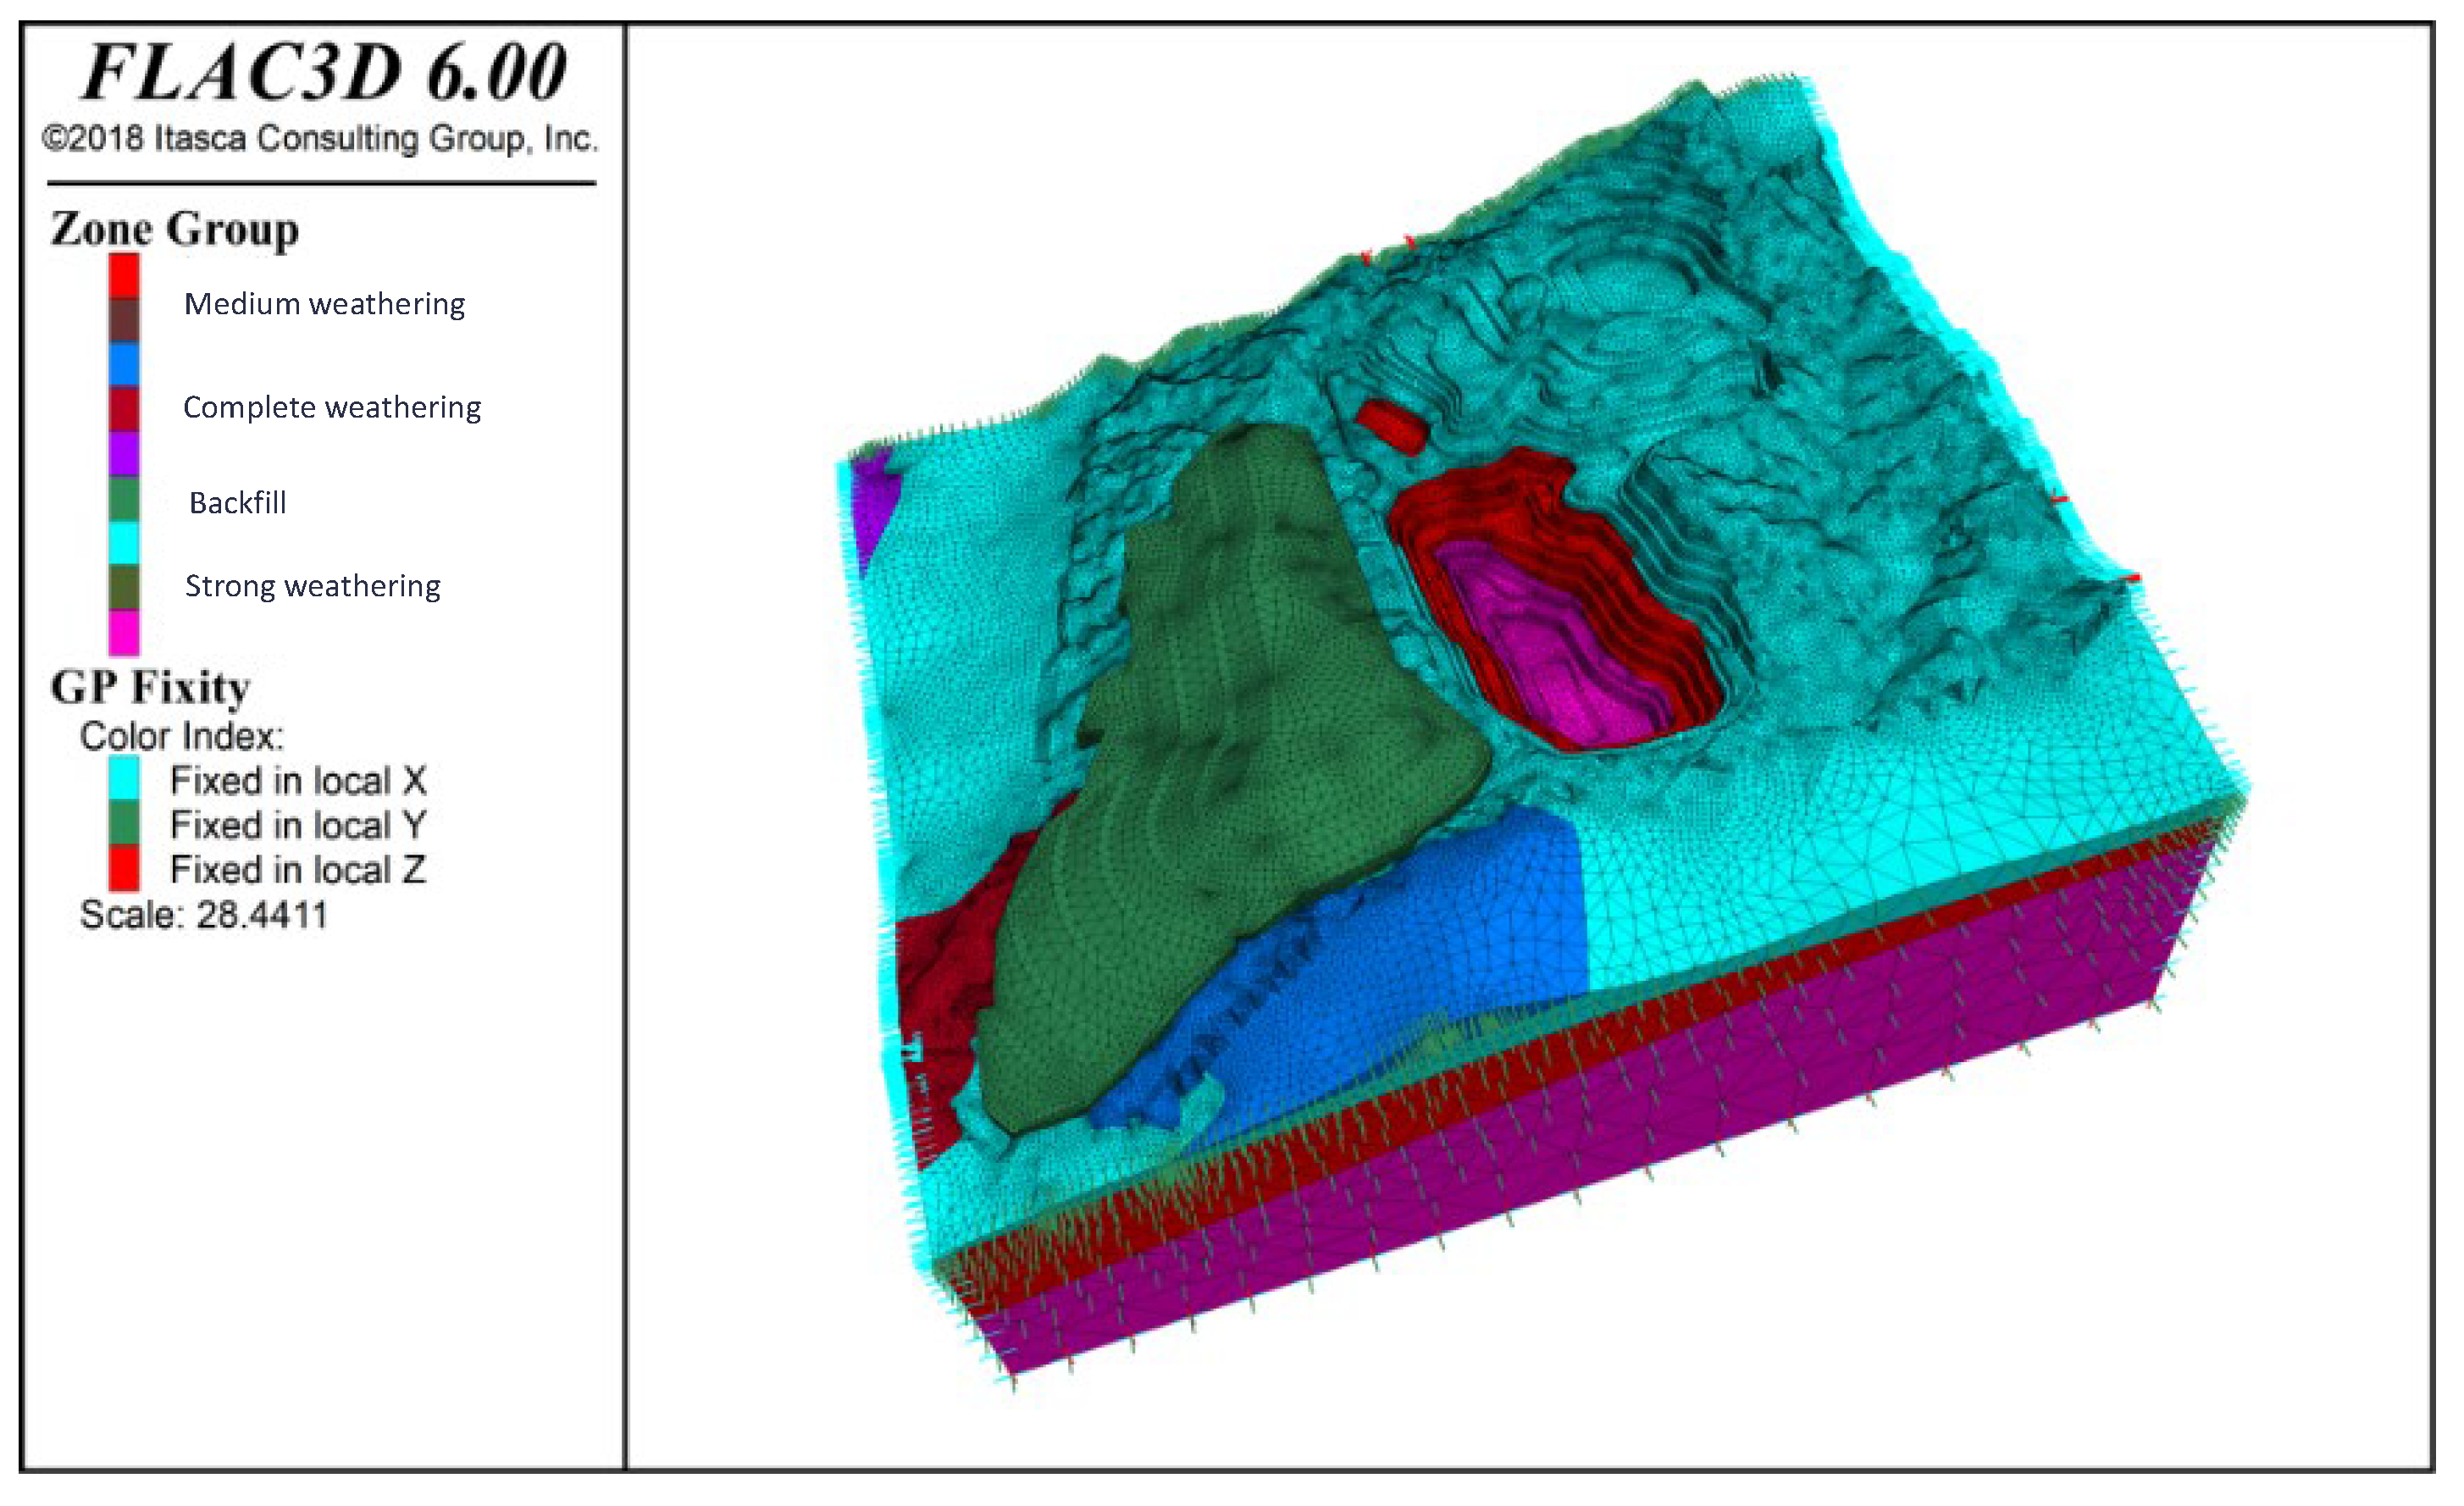
Local mesh refinement was employed to reduce cell count and boost computational efficiency without sacrificing accuracy. This produced denser tetrahedral elements around the pit interior and at stratigraphic interfaces, with coarser elements in the outer rock mass. The final mesh comprises 218,087 nodes and 630,359 elements (see Figure 6 for mesh layout and boundary conditions). Normal displacement constraints were applied: x-direction fixed on the lateral faces, y-direction fixed on the front and rear faces, and z-direction fixed only at the model base.

3.4. Results and Analysis

This study first analyzed the seepage stress field, as well as the stress field and stability of the pit slope under self-weight conditions after mining. Next, since the Qian mining area primarily exposes granite bodies from different periods of the Early Cretaceous with relatively high rock hardness and is mined using blasting techniques, the study considered the effects of blasting vibration. The final slope stress–strain field and stability after mining seepage were examined. Lastly, due to the abundant rainfall in the mining area, the geothermal conditions, the high precipitation, and the influence of rainfall on the slope stability were also studied. The results of these studies are presented below.

3.4.1. Analysis of Slope Deformation and Failure Characteristics

Hydrogeological surveys indicate that the hydrogeological conditions in this mining area are simple. Therefore, this study first set the underground groundwater level based on the engineering survey results. After that, the final slope surface formed after mining was set to a zero head condition. This allowed for the determination of the three-dimensional pore water pressure distribution characteristics of the slope after mining to its final state. Based on this, the stress field distribution characteristics of the designed slope were then calculated.
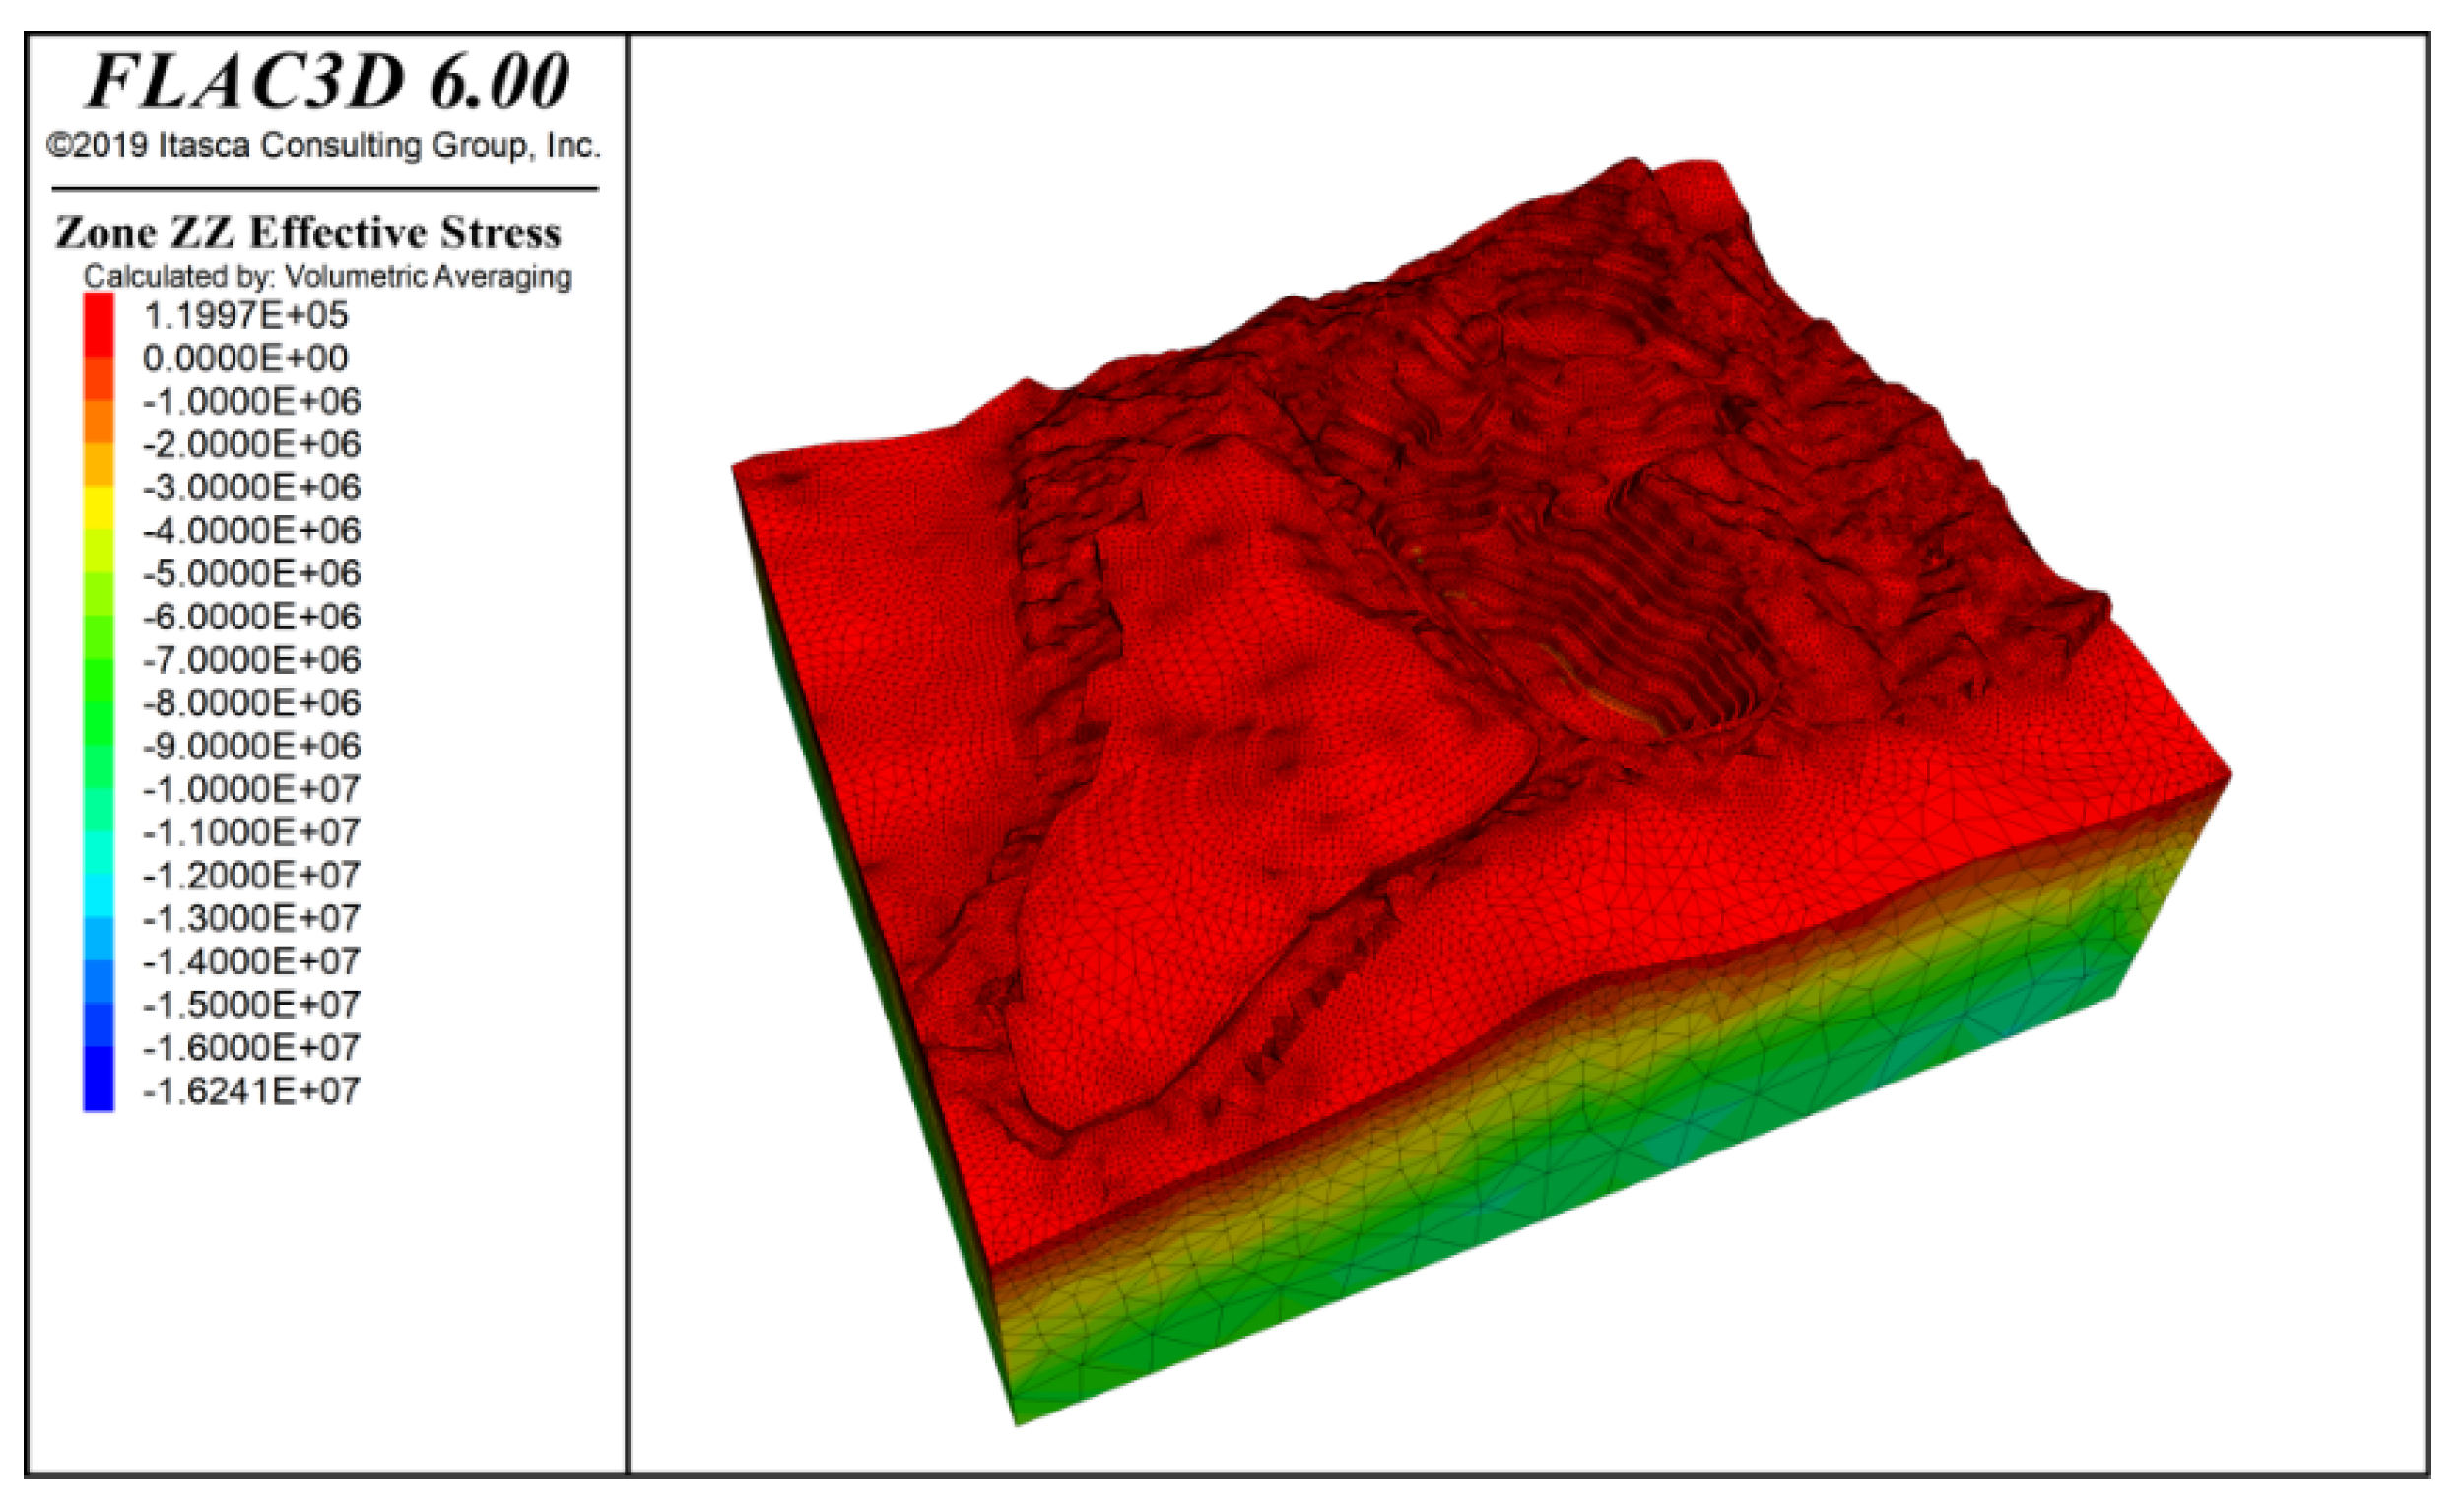
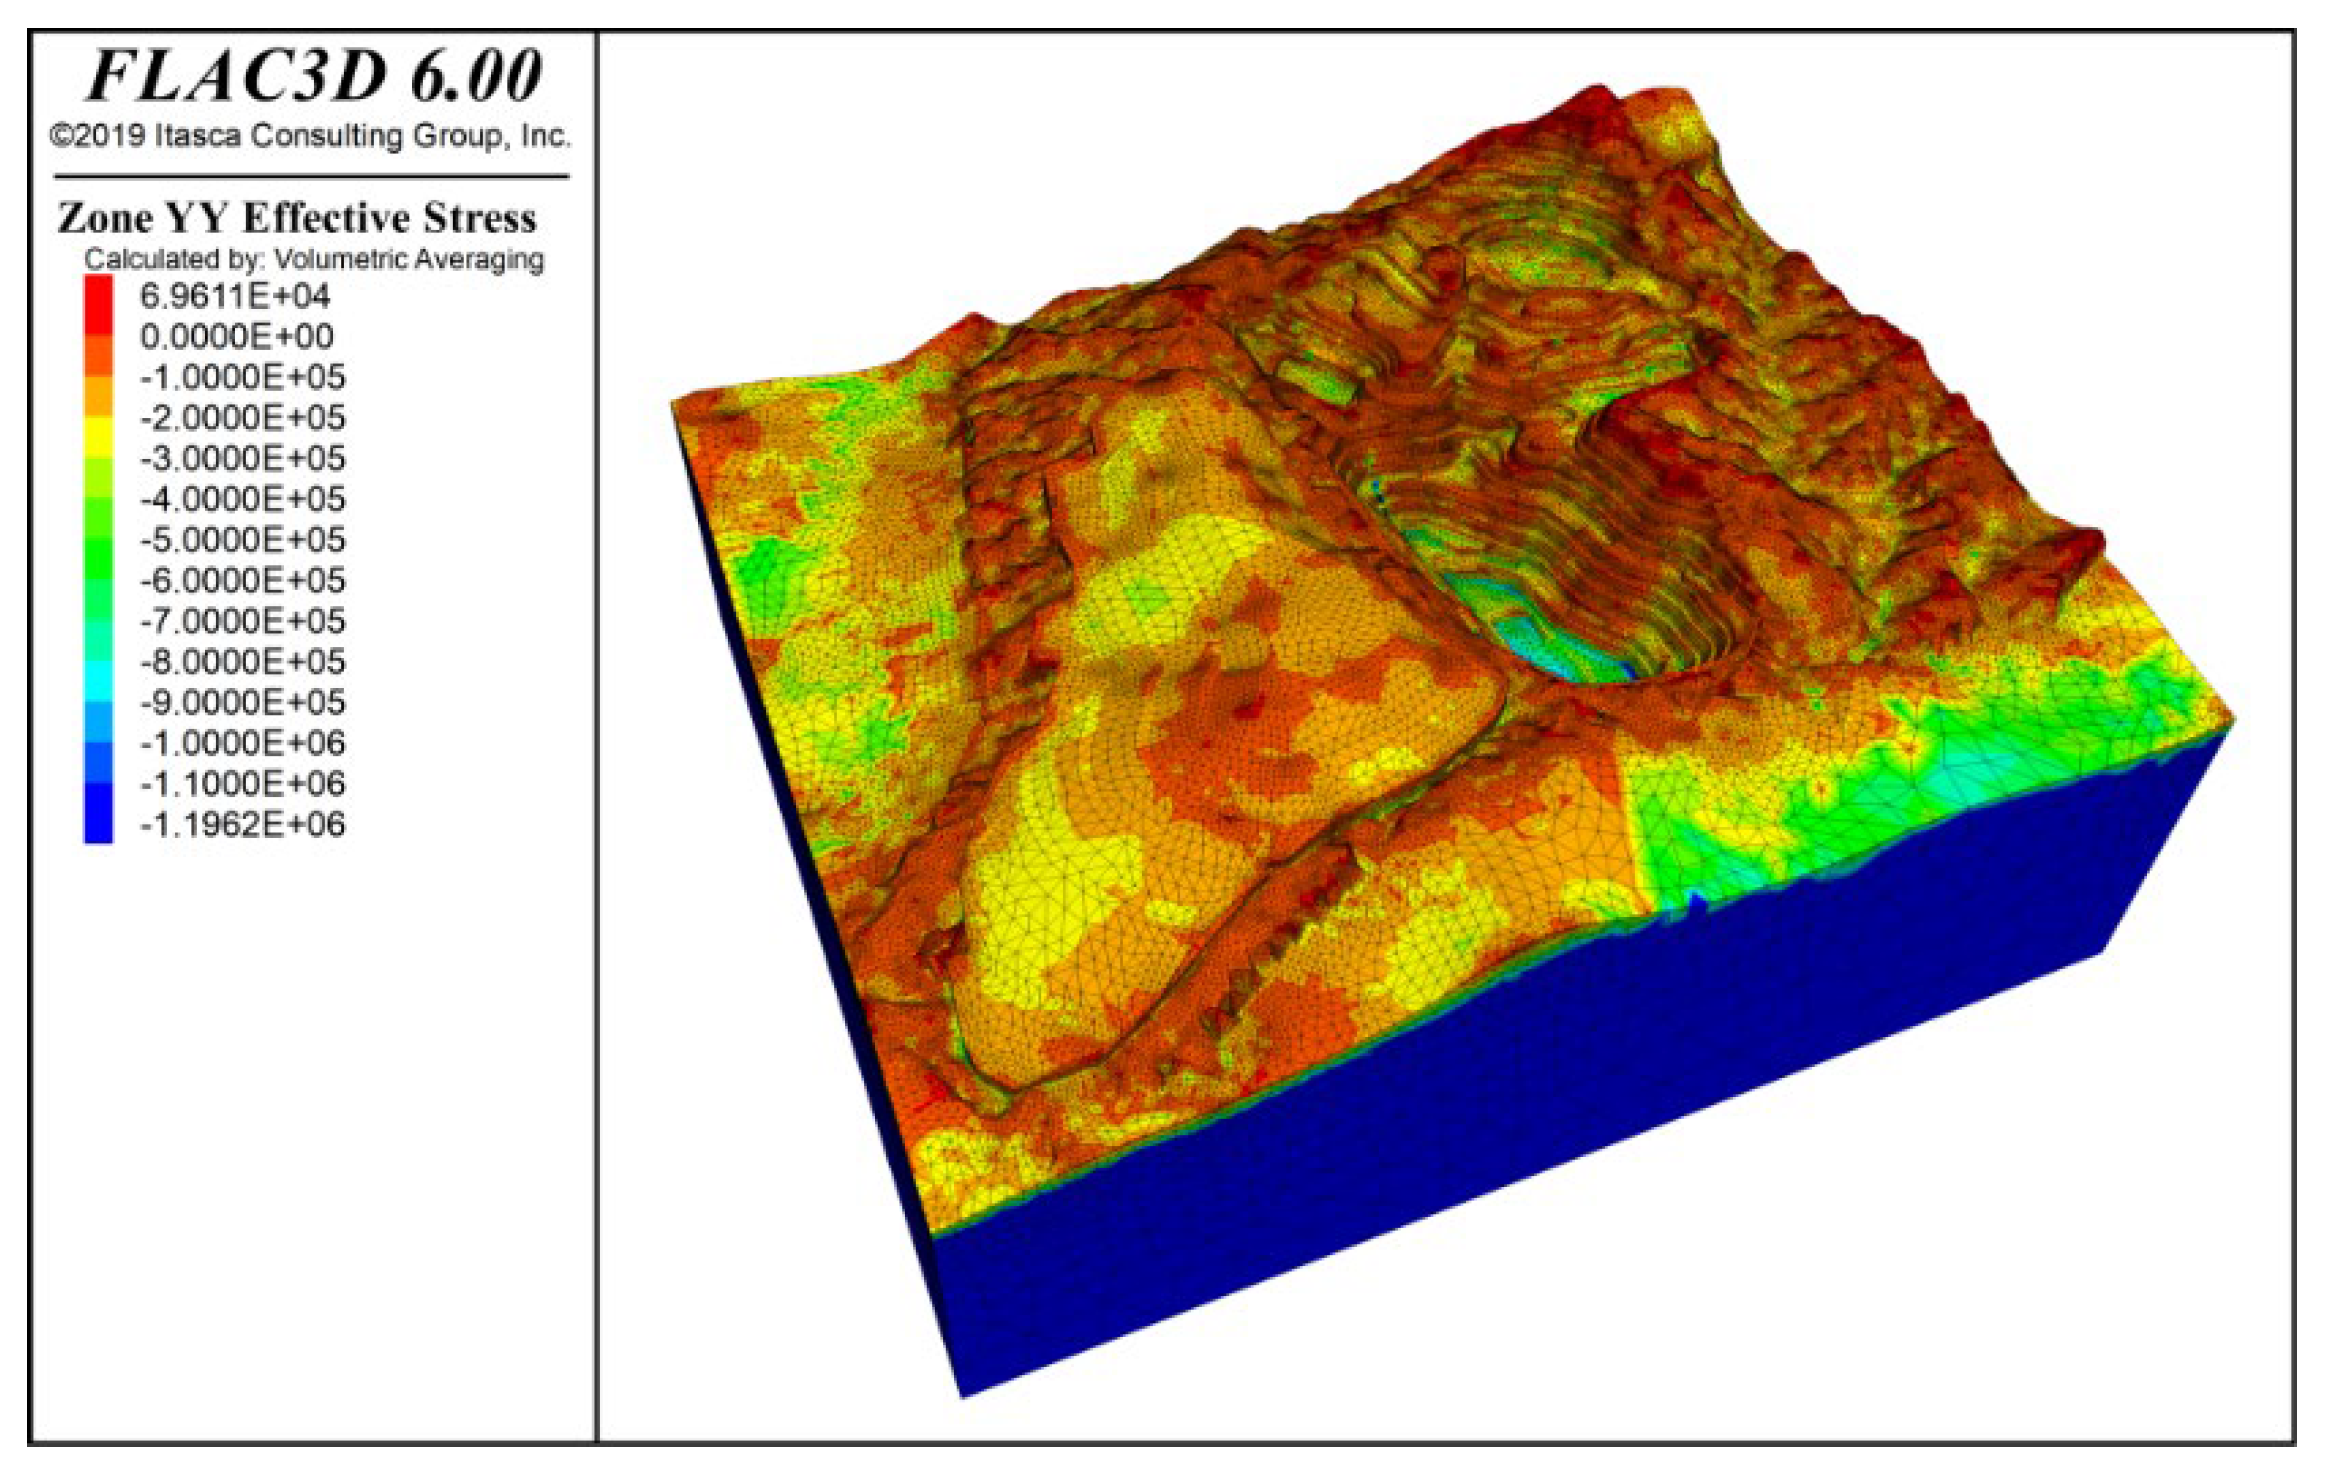
By inputting the parameters from Table 1 and Table 2, the model computed the stress distribution following groundwater seepage equilibrium and characterized the slope’s deformation and failure patterns. Figure 7 and Figure 8 present contours of vertical stress and maximum effective stress, respectively, under combined self-weight and groundwater loading. Note that in FLAC3D, principal stresses are ranked by numerical magnitude, so the label “Minimum Principal Stress” corresponds to the highest compressive stress in the model. The results show that self-weight loading generates a vertically dominated stress field with a clear stratified distribution, while the maximum effective stress—peaking at −16.64 MPa—occurs at the slope’s deepest point.
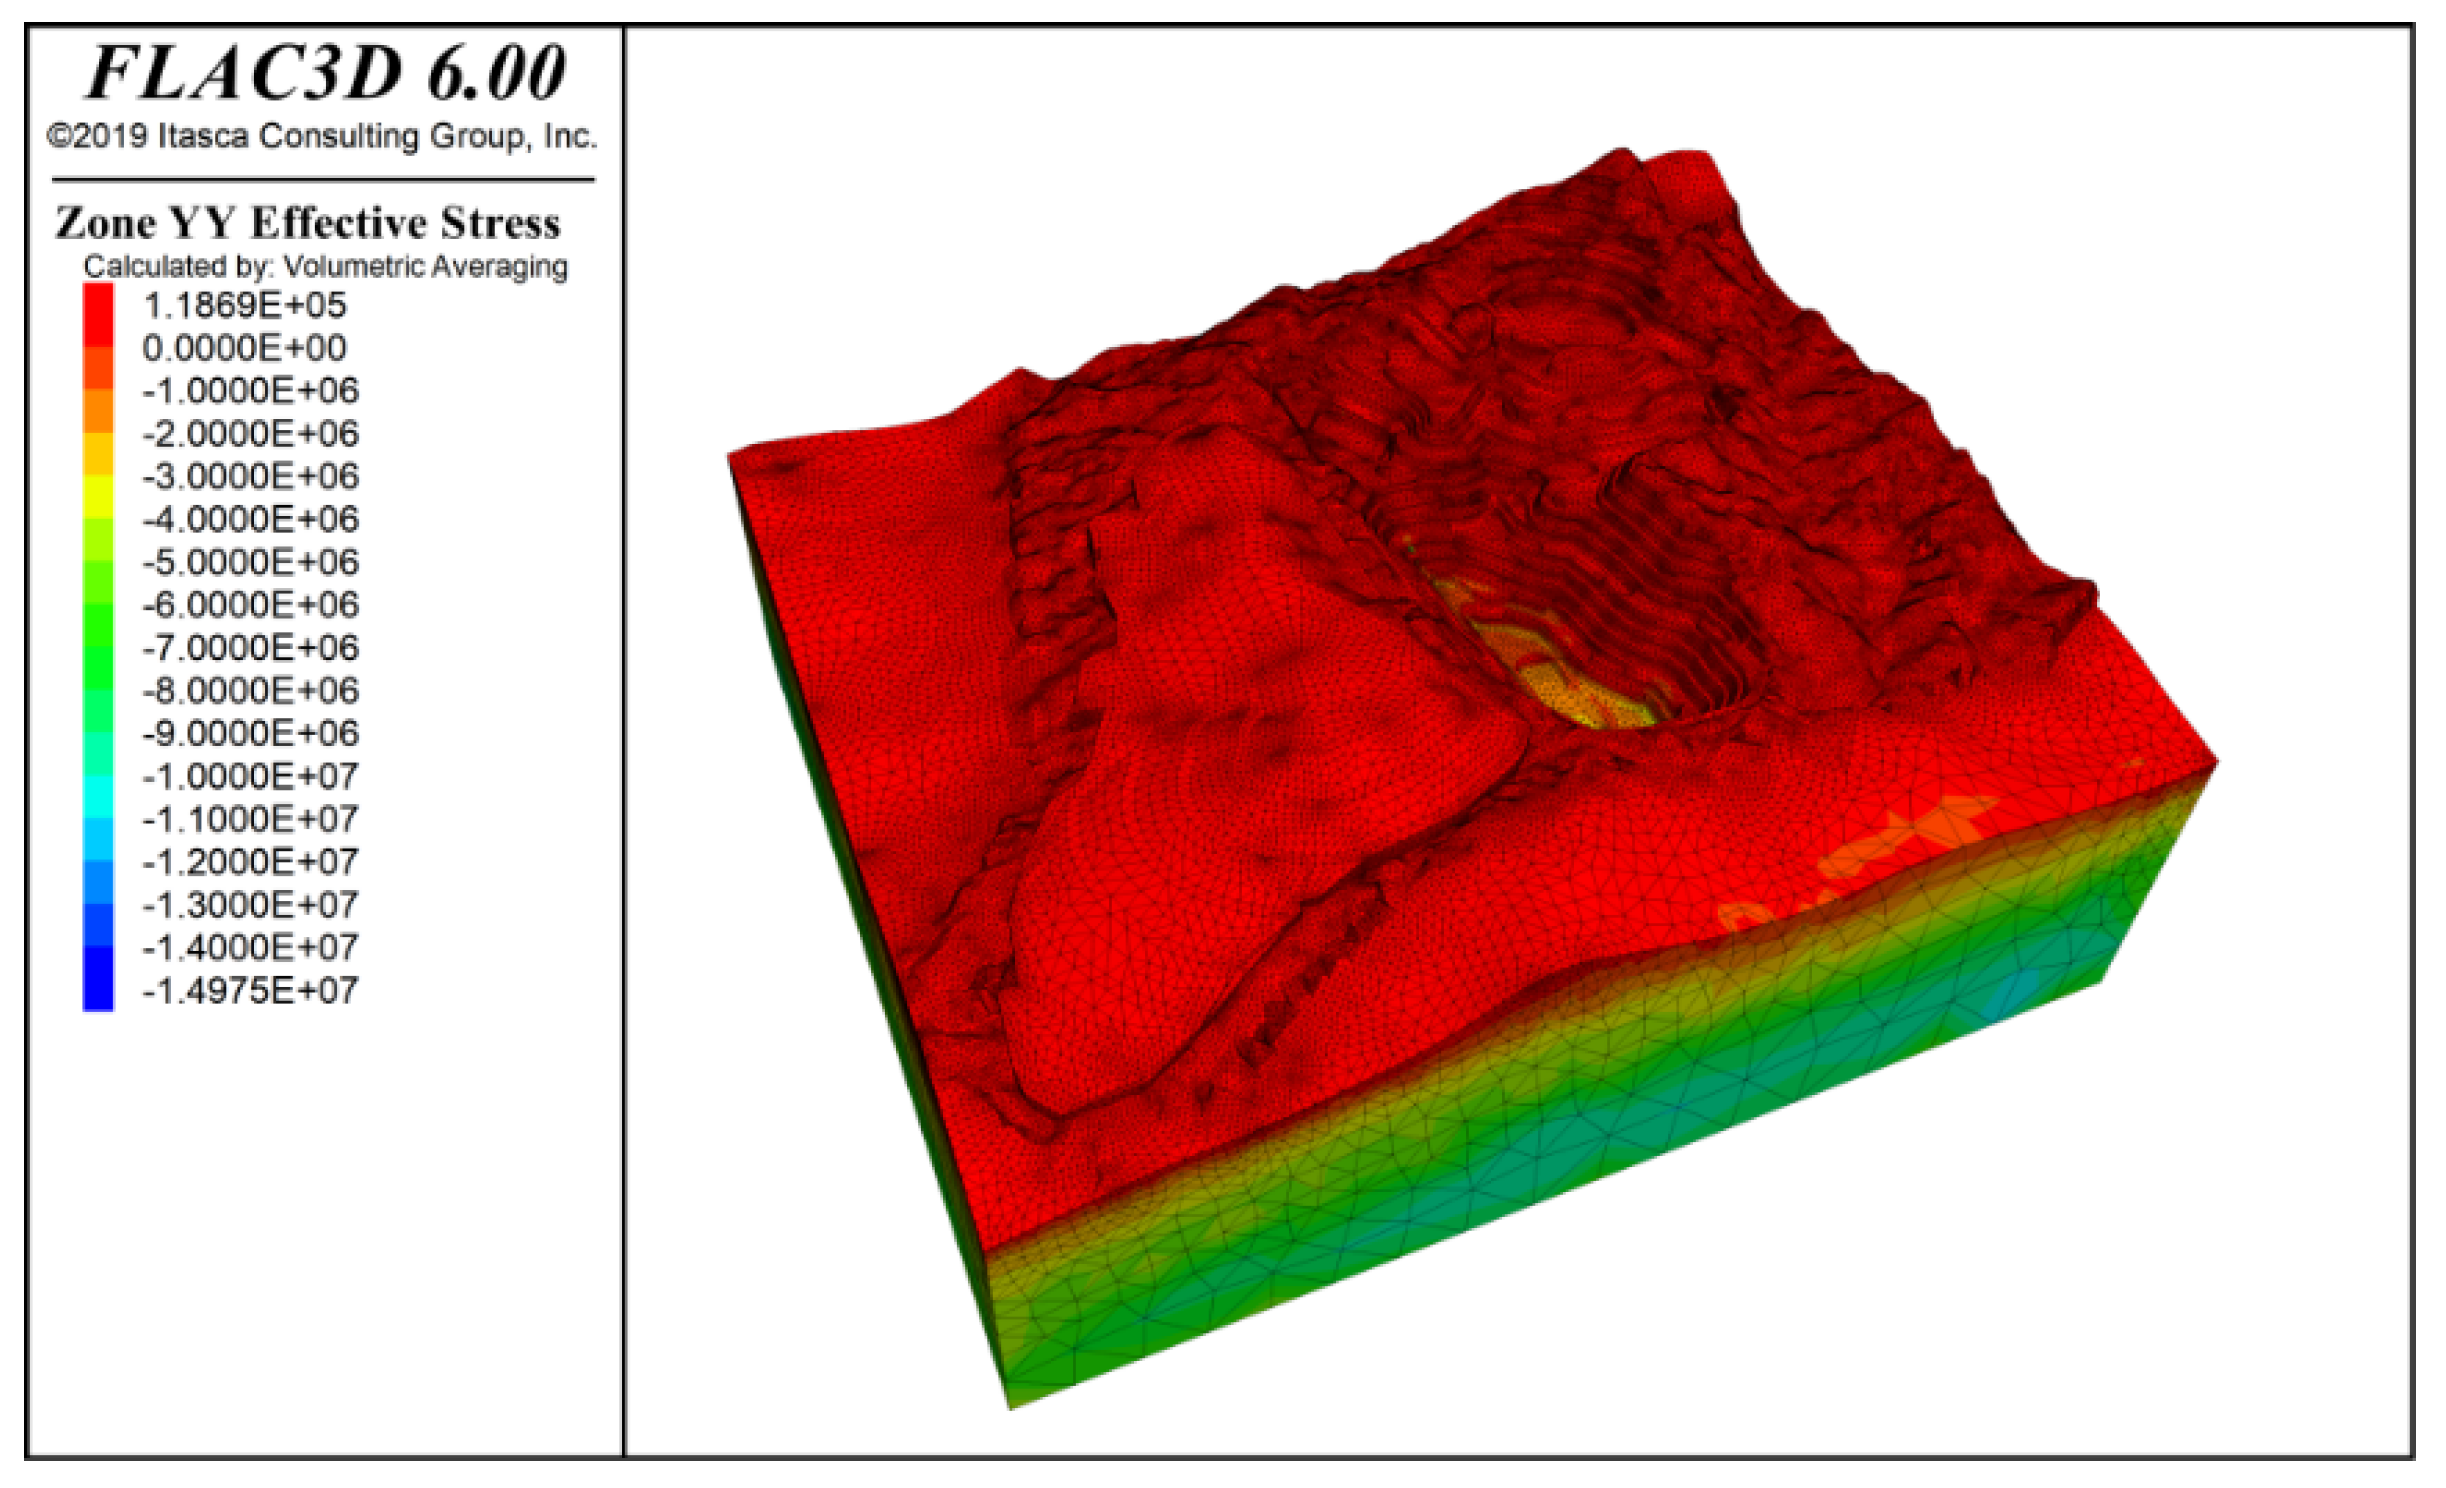
Figure 9 and Figure 10 show the stress contours in the x-direction and y-direction of the slope under the influence of self-weight + groundwater action. The results indicate that both tensile and compressive stresses are distributed in the x and y directions, but compressive stress is dominant. The maximum compressive stress is approximately −14.97 MPa, located at the deepest part of the slope.
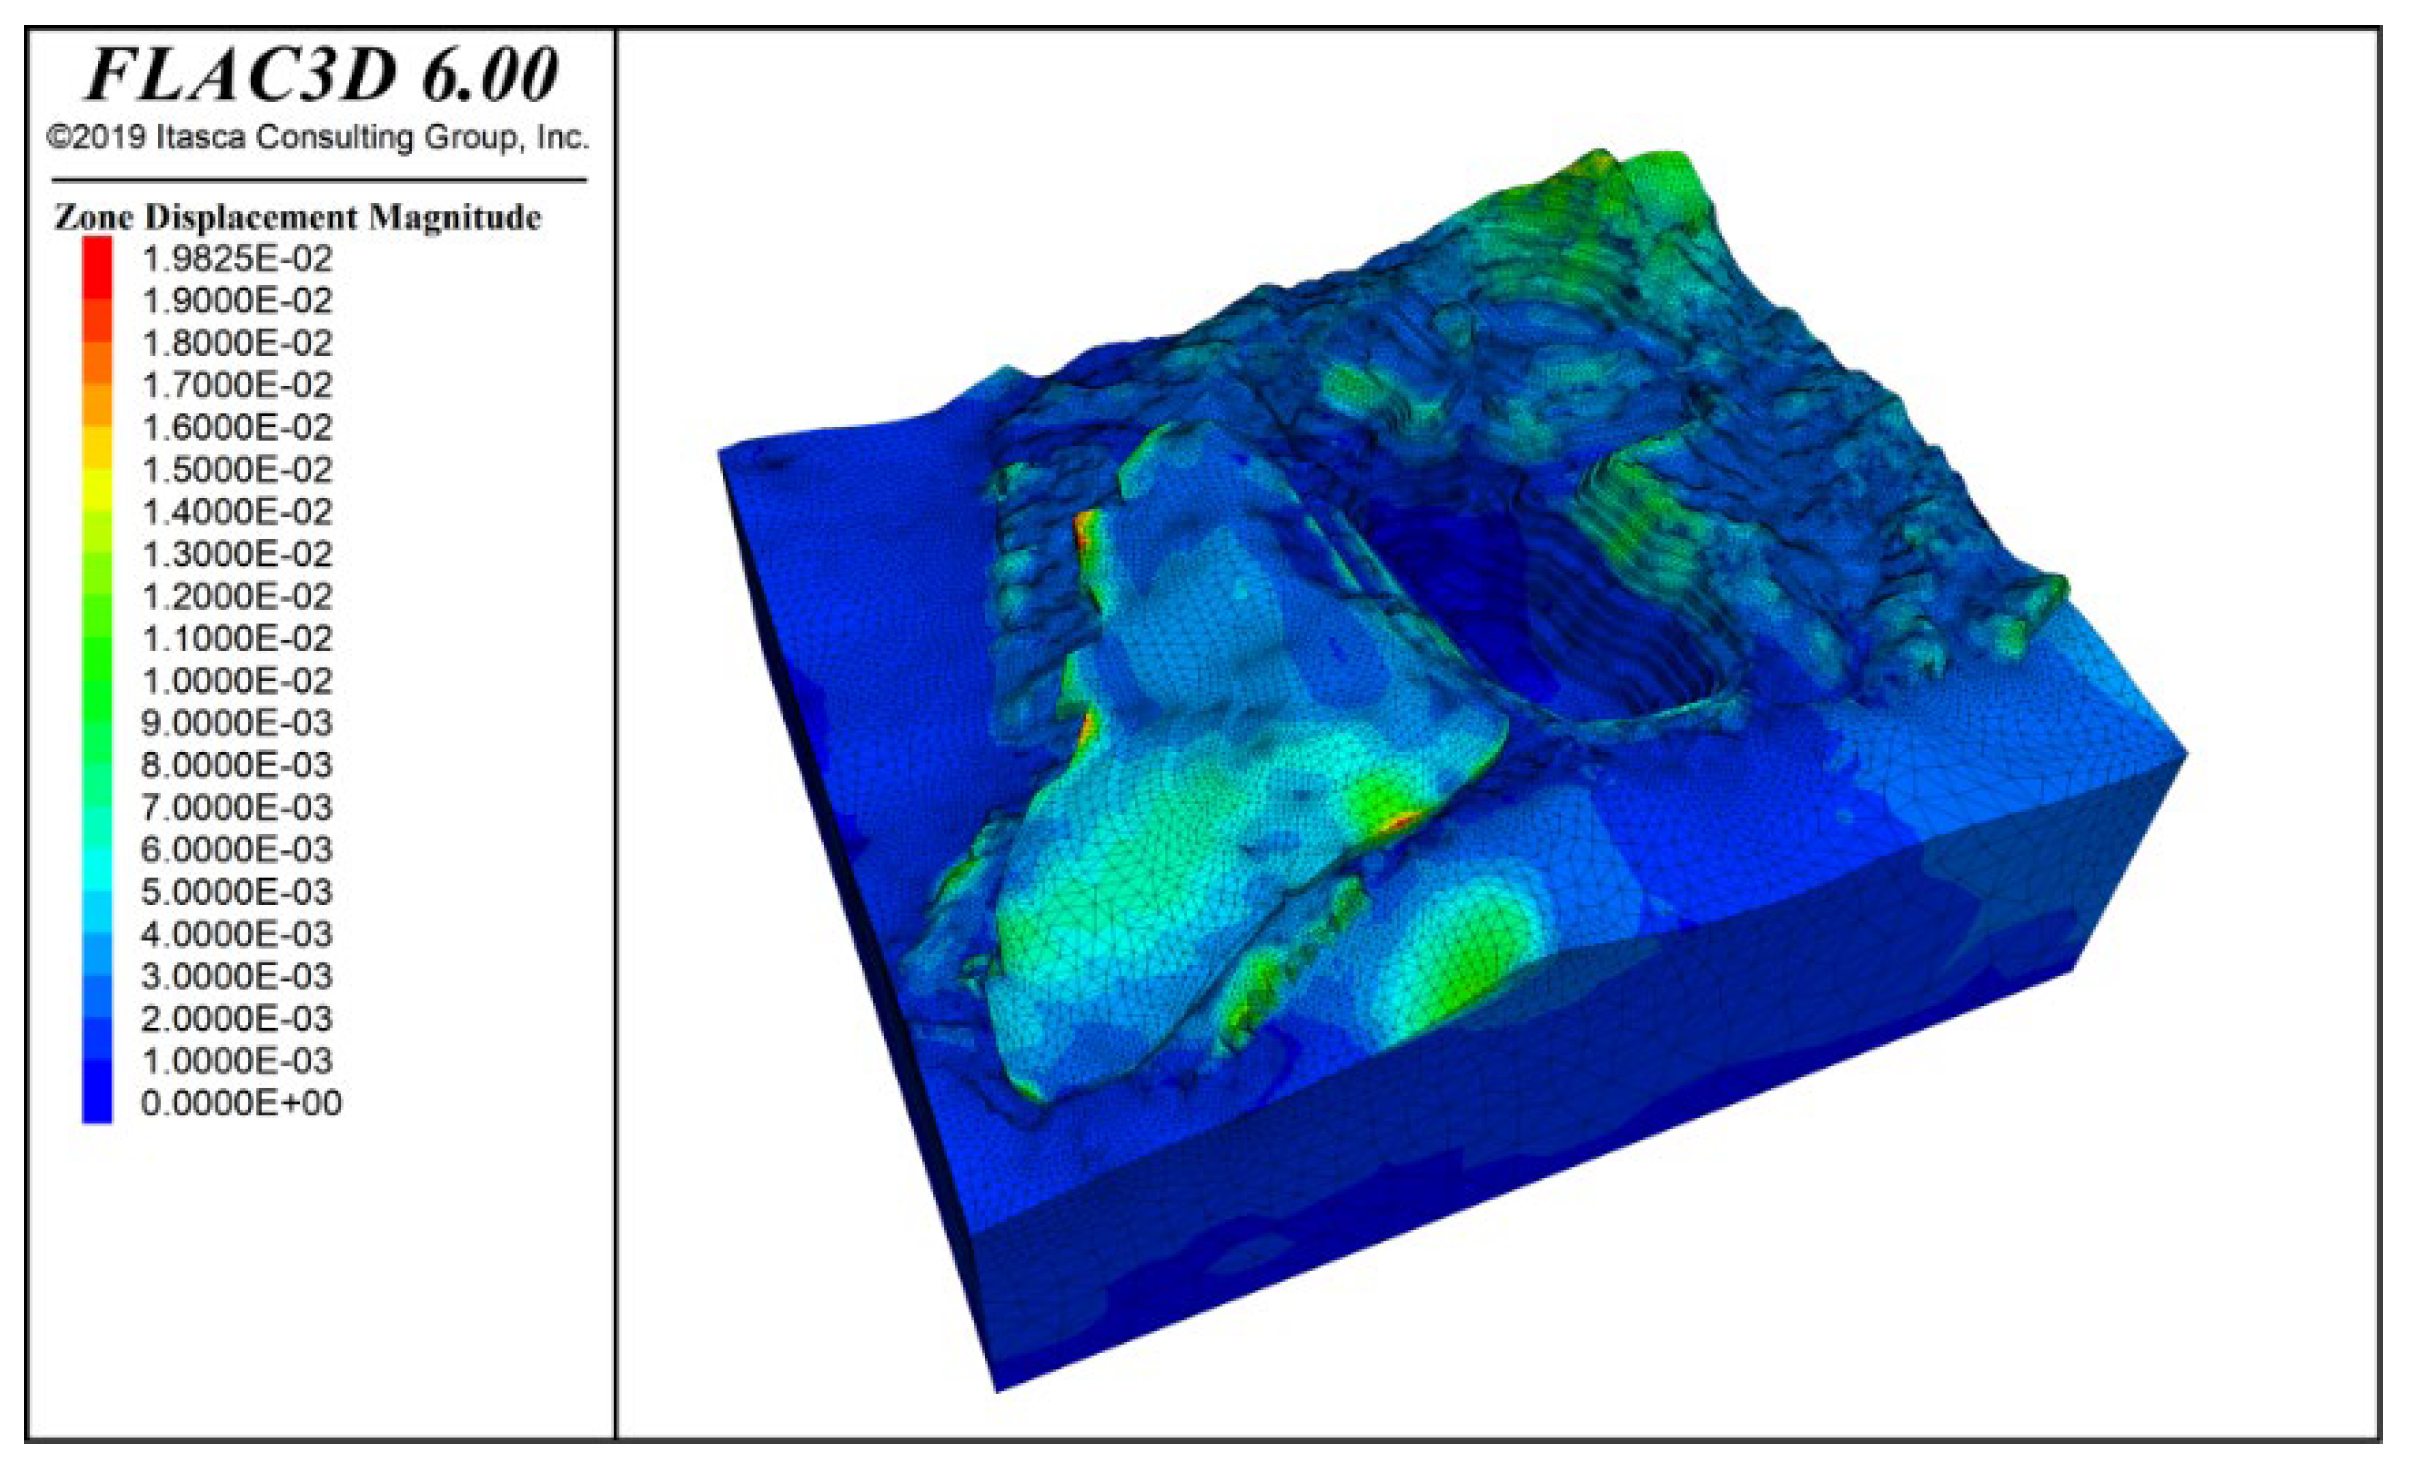
Figure 11 shows the deformation contour of the slope under the combined effect of rock mass self-weight and groundwater. From the figure, it can be observed that the potential sliding areas mainly occur at the slope crest, with a concentration in Zone F, as well as the slope crests in Zones K and I, and the waste dump area. Under the influence of self-weight, the maximum vertical displacement of the slope reaches 19.83 mm, with most of the areas within the mining slope boundary experiencing displacements of less than 2 mm.
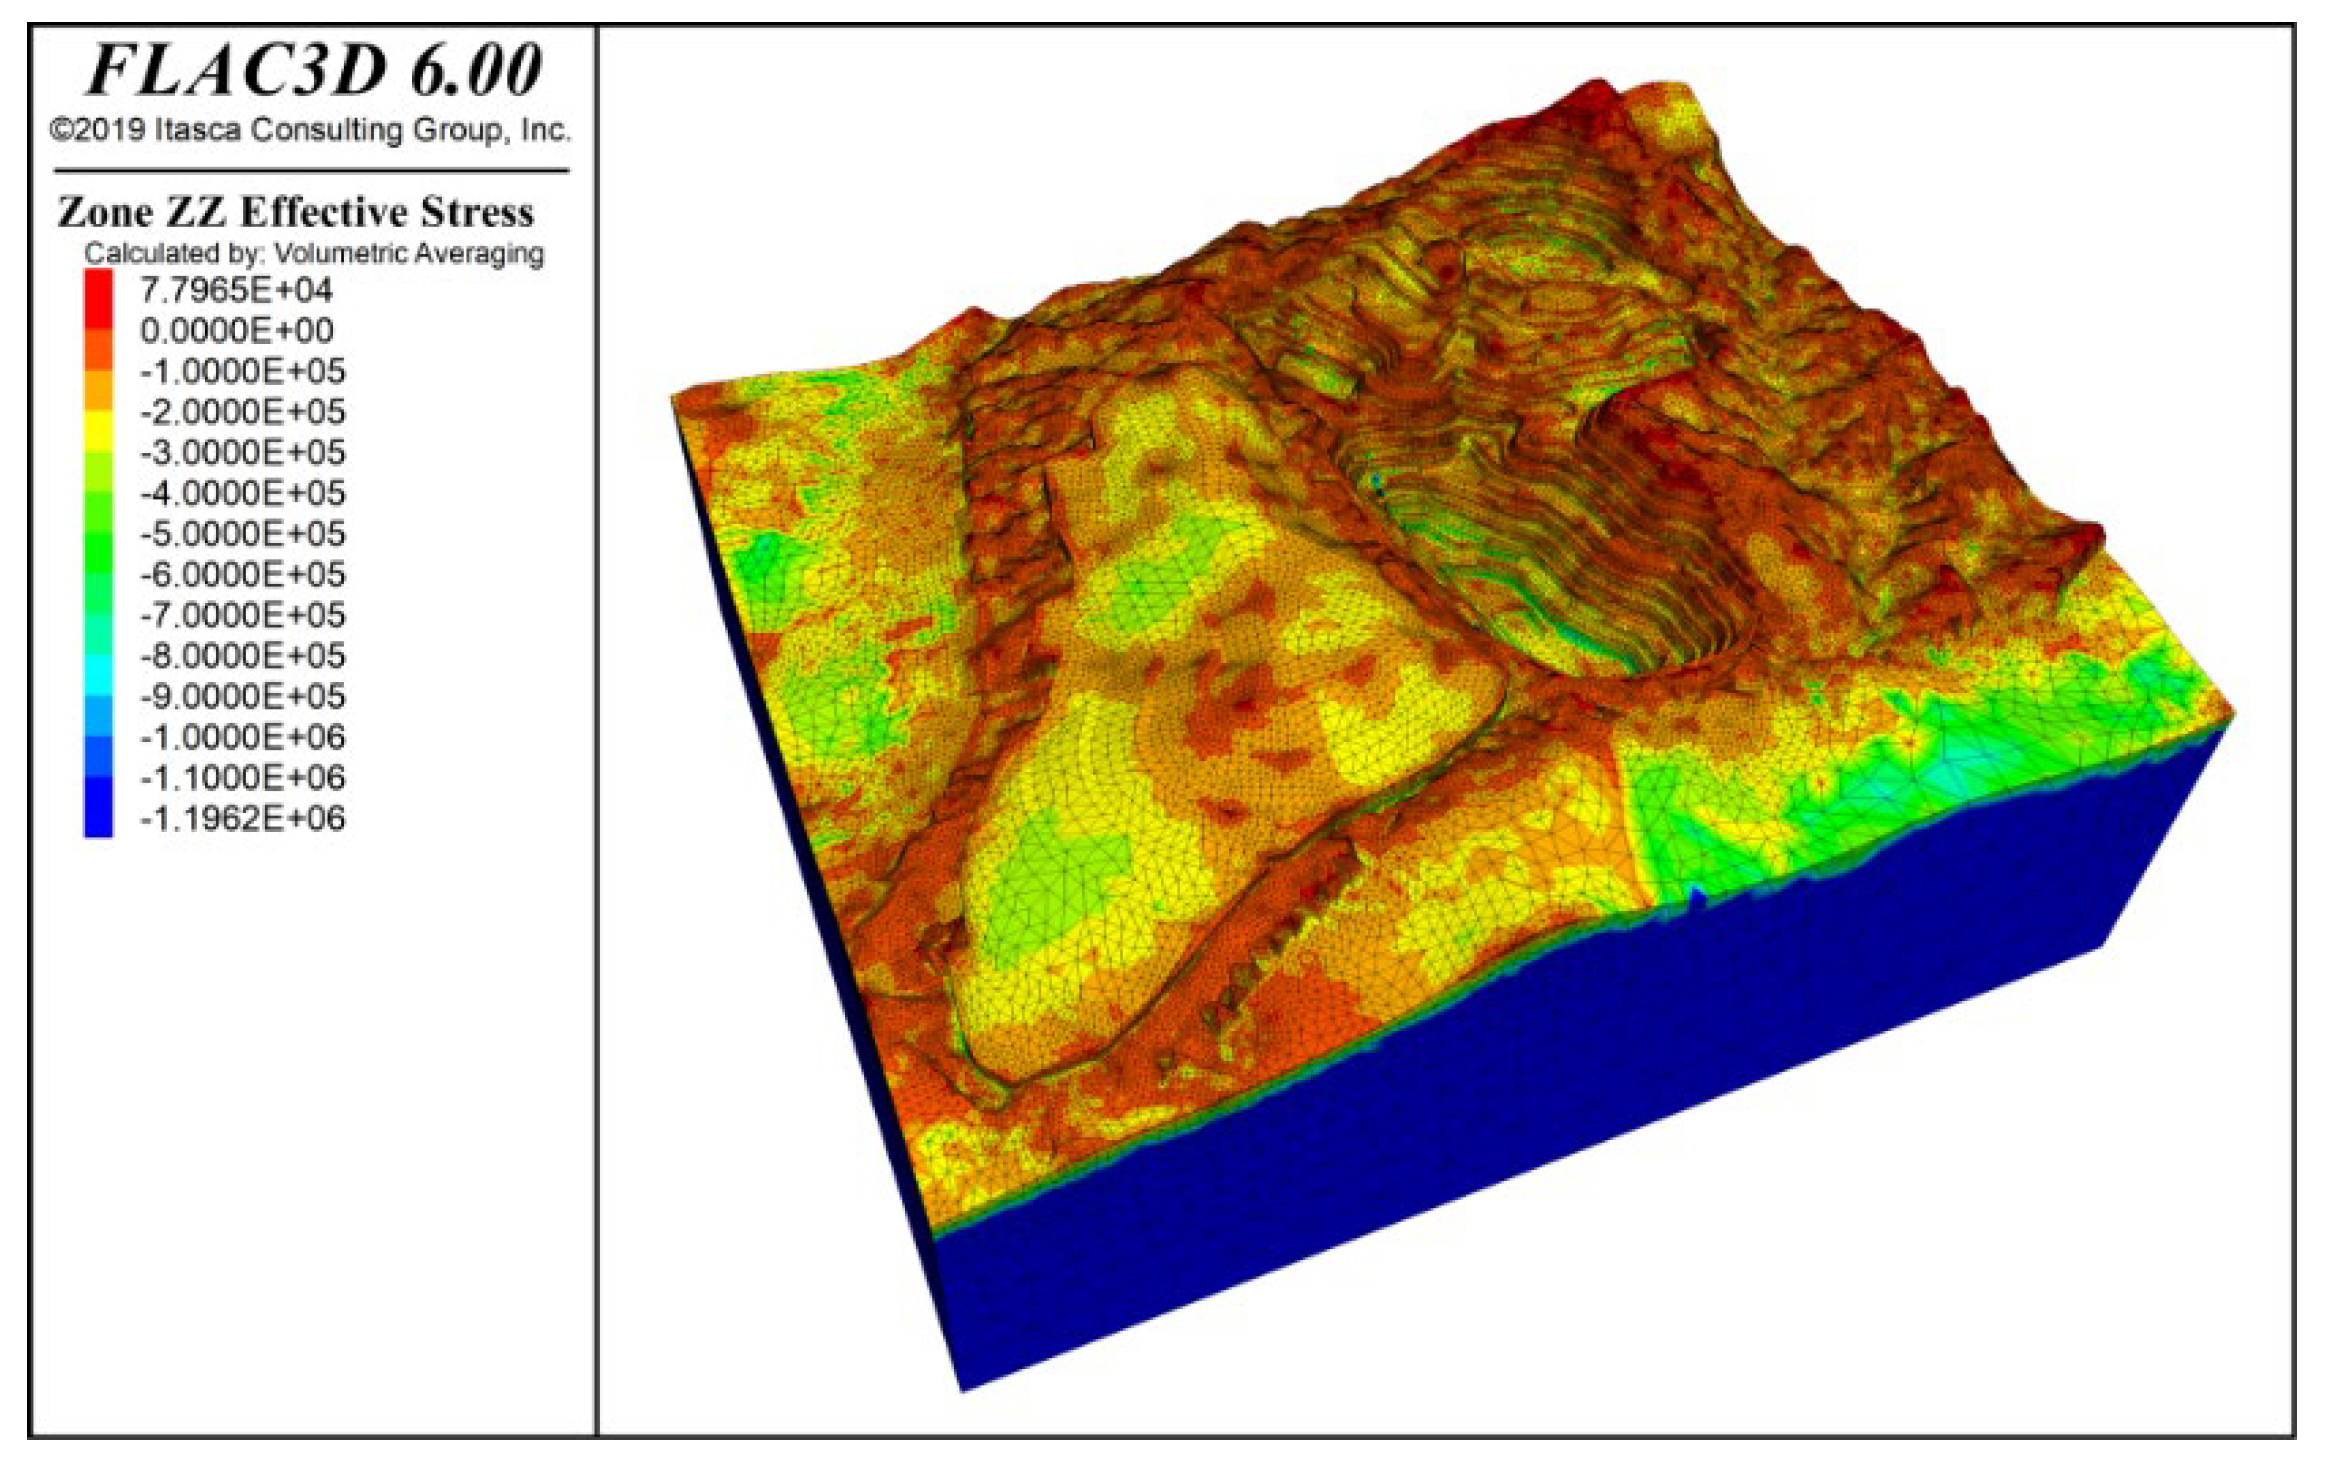
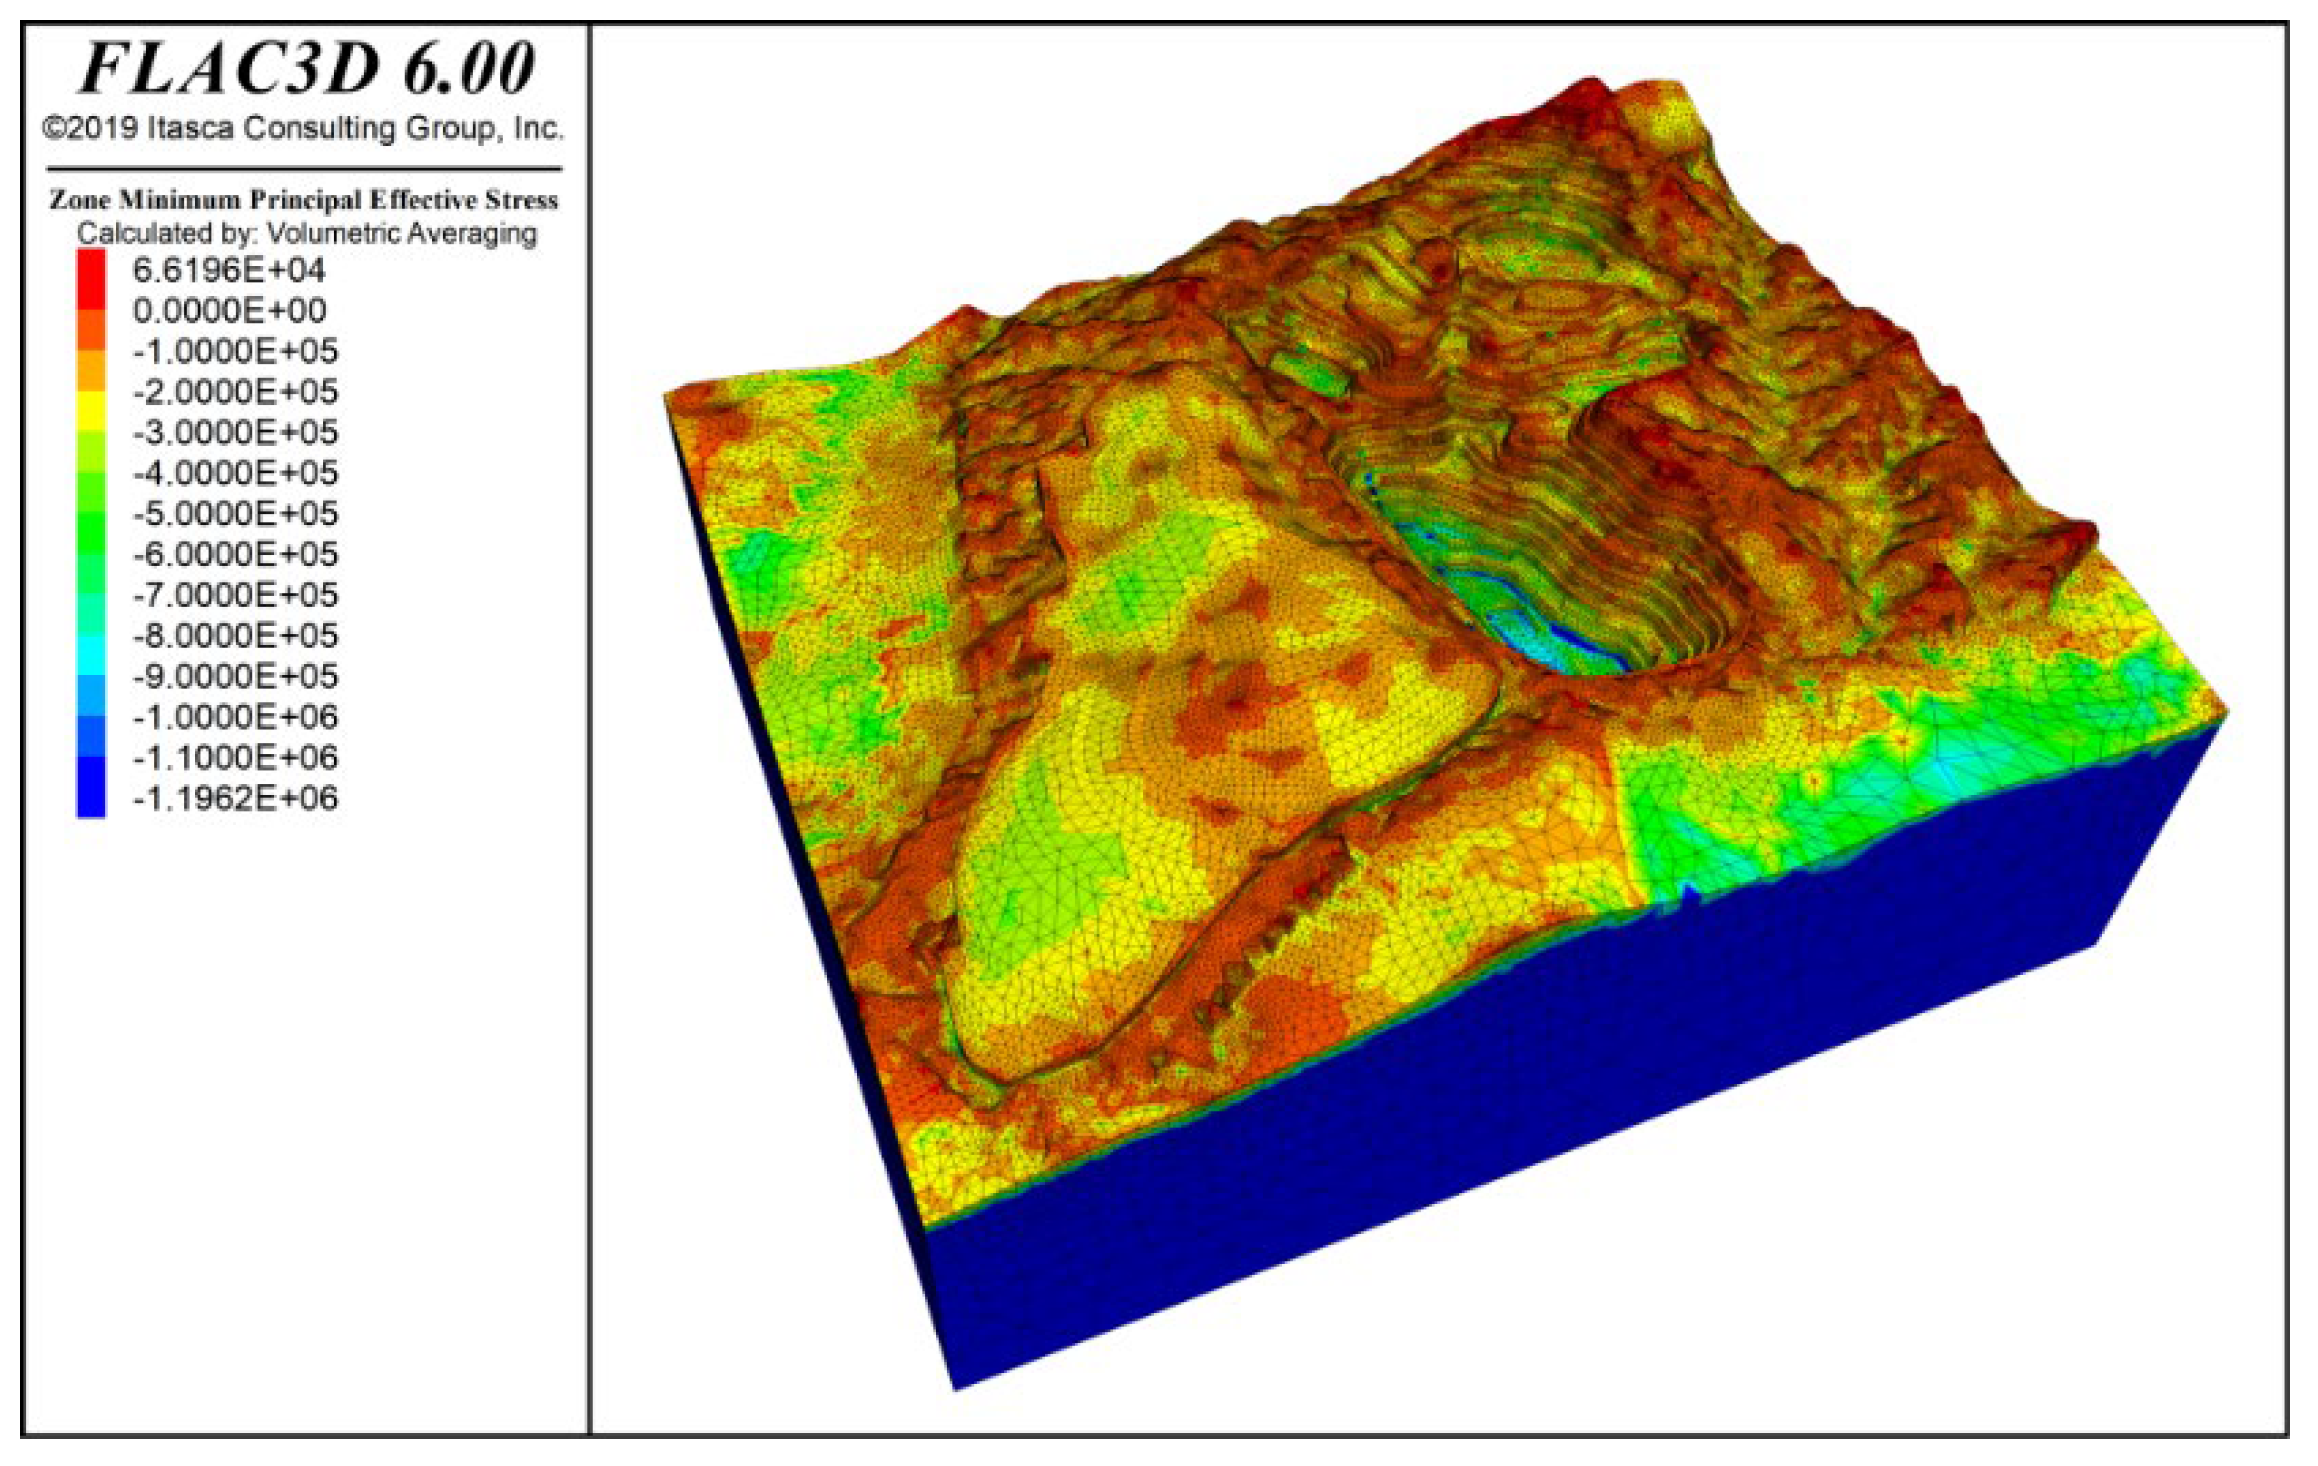
To assess the effects of blasting vibration on slope behavior, we simulated the stress and strain under combined self-weight, groundwater, and blasting loads and compared them to the baseline case without blasting. Figure 12 and Figure 13 present the vertical stress and maximum effective stress contours under these conditions. (In FLAC3D, principal stresses are ranked by absolute magnitude, so the label “Minimum Principal Stress” denotes the greatest compressive stress.) The overall stress field remains vertically dominated with a clear stratified pattern, and the peak effective stress (−1.196 MPa) still occurs at the deepest part of the slope. Notably, blasting produces tensile stresses concentrated at both the slope crest and the waste dump crest, indicating these areas are especially susceptible to deformation from horizontal vibration.
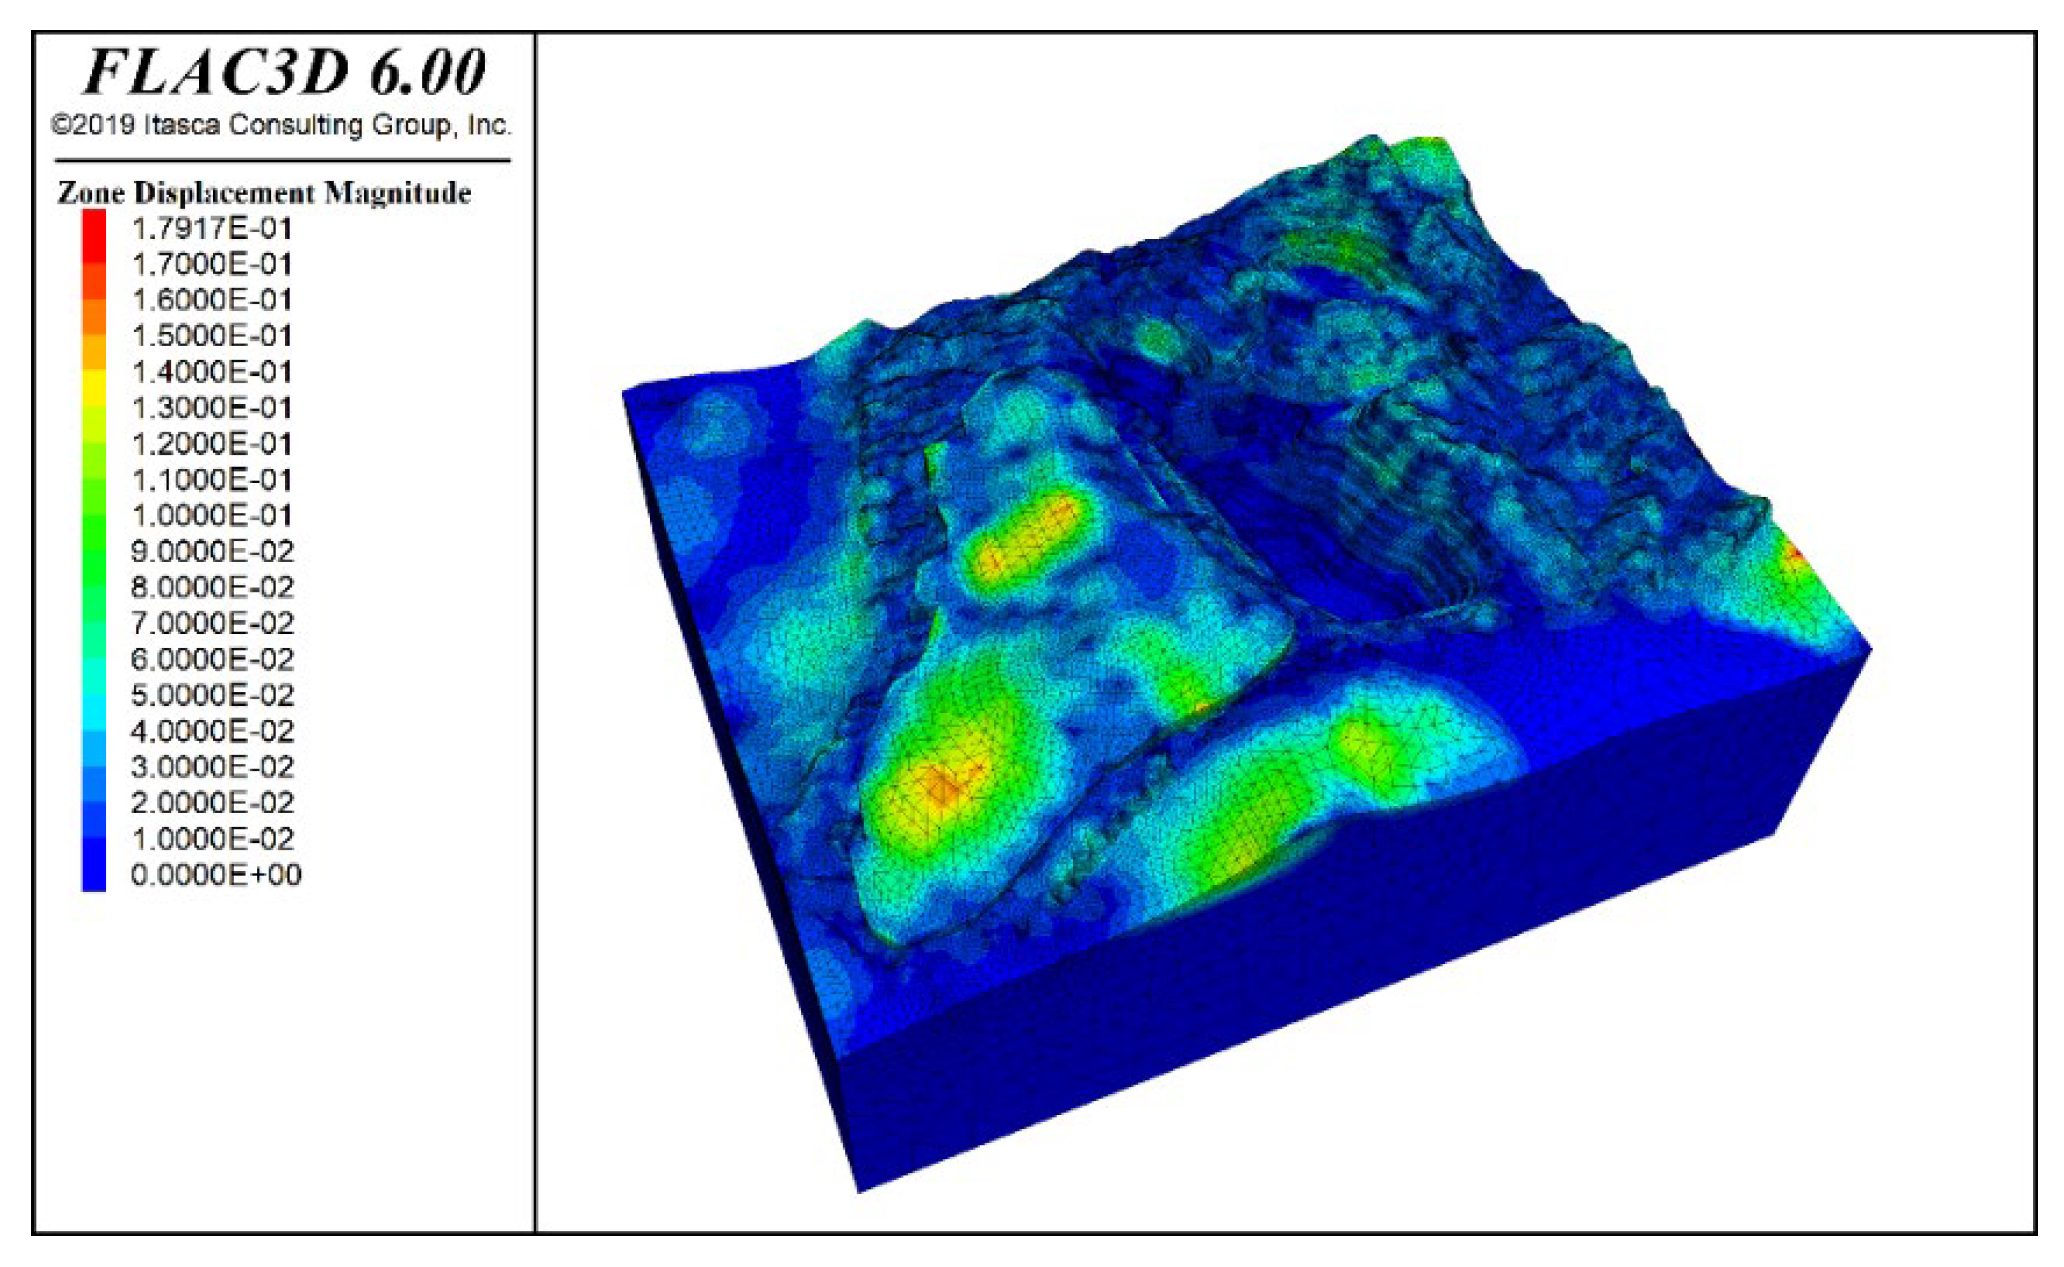
Figure 14 and Figure 15 show the stress contours in the x-direction and y-direction of the slope under the combined effect of self-weight + groundwater + blasting vibration. The results indicate that both tensile and compressive stresses are distributed in the x and y directions, with compressive stress being dominant. The maximum tensile stress is approximately 0.66 MPa, distributed at the slope crest and mid-slope positions.
Under the combined effect of rock mass self-weight, groundwater, and blasting vibration, the deformation contour results of the slope are shown in Figure 16. From the figure, it can be observed that the potential sliding areas mainly occur at the slope crest, with a concentration in Zone F and the slope crest in Zone I. Under the self-weight influence, the maximum displacement of the slope reaches 195.7 mm, with the maximum deformation occurring at the bottom and upper parts of the waste dump and in the F zone of the mining area slope divisions. After the addition of the waste dump, the displacement of the F zone slope significantly increased, concentrated in the lower half of the waste dump and the northern section near the mining area. The deformation increased from 2.38 mm to 195.69 mm. However, the deformation range in other areas of the mining area did not exceed 10 mm.

3.4.2. Slope Rainfall Seepage Simulation

Based on the hydrogeological survey of the mining area, the groundwater recharge conditions are poor, with the maximum daily rainfall reaching 298.1 mm. Therefore, this study uses 300 mm/d as the simulated daily rainfall.
The vertical stress contour of the mining area, 24 h after rainfall, is shown in Figure 17. Overall, the stress still exhibits a layered distribution, with the maximum value occurring at the bottom, but local variations are observed due to the rainfall. The observed changes in vertical stress largely stem from variations in rock mass effective stress following rainfall infiltration and are therefore not discussed further here. Figure 18 illustrates the model’s vertical displacement 24 h after rainfall, revealing that the waste dump area experiences the greatest impact. Compared to pre-waste dump conditions, vertical displacement there has increased by 30 mm and is more localized. Deformation has also intensified at the slope–K-zone interface. Elsewhere, the slope settles to varying degrees—most prominently at the crest—and progressively less toward the base. This is due to the better permeability of the slope’s upper strata. The maximum vertical displacement occurs at the mid-slope and crest positions on the northern side of the F zone slope.

3.4.3. Slope Structure Parameter Optimization

The rationality of open-pit slope design parameters directly affects both the operational safety and economic performance of the mining enterprise. Increasing the slope angle can substantially reduce overburden removal, lower mining costs, and enhance extraction efficiency. However, steeper slopes typically result in reduced stability, posing greater safety hazards and operational risks. Therefore, when defining slope boundaries, it is crucial to strike a balance between optimizing the slope angle to minimize stripping and ensuring sufficient stability to maintain safety and comply with regulatory standards.
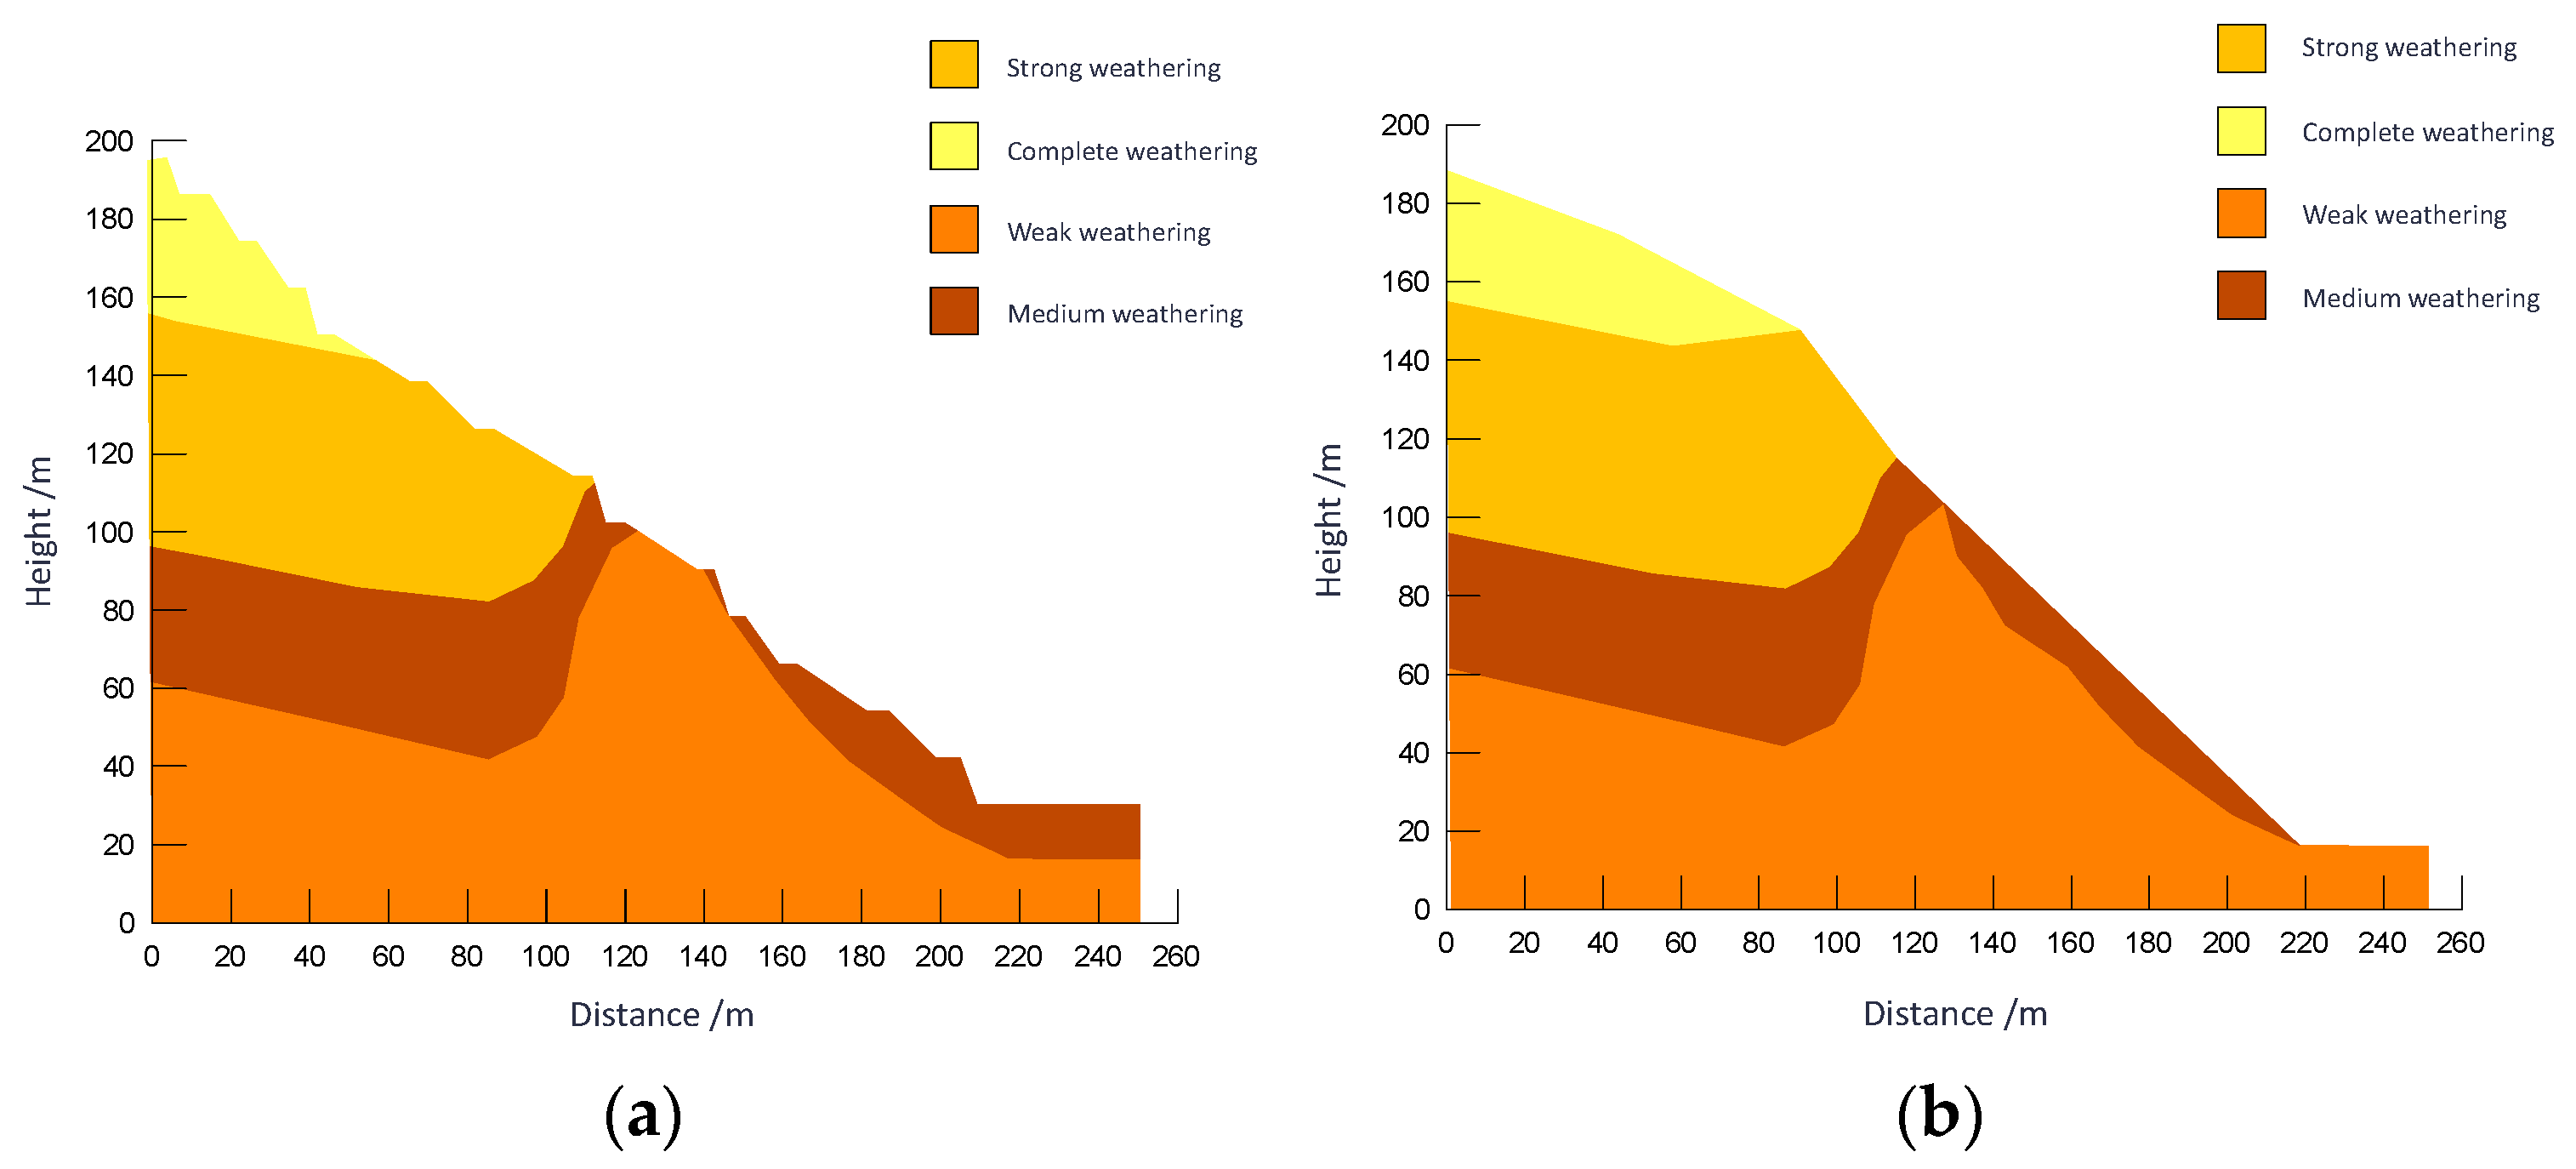
The study takes a slope profile from Zone F as an example for the local slope angle optimization research. The profile under investigation features a relatively thick weathered layer. Following overburden removal during mining, this weathered layer becomes exposed, resulting in an increase in the overall slope angle. Consequently, the local stability at the slope crest falls short of regulatory requirements. To address this, the mining boundary in areas with thick weathered layers and slope orientations aligned with the mining direction was adjusted inward. The optimization was performed in accordance with the safety factor requirements for two load combinations, as specified in the *Technical Code for Non-Coal Open-Pit Slope Engineering* (GB 51016-2014) [57]. The process followed a hierarchical approach—first ensuring overall slope stability, then addressing local stability concerns. The maximum allowable angle was adopted as the recommended slope parameter. Post-optimization local stability results are shown in Figure 19, and the revised profile layout is illustrated in Figure 20. The calculation results of local stability for profiles are summarized in Table 3. Based on the optimization of overall slope angles for rock strata and local slope angles for soil layers, the recommended slope design parameters are: 42° for rock mass and 27° for soil layers.

4. Conclusions

Slope instability can result in substantial economic losses, serious injuries, fatalities, and environmental degradation. As a critical concern in geotechnical engineering, it directly affects both the safety and economic feasibility of engineering projects. To ensure safe mine operations while maximizing economic returns, this study takes a comprehensive approach by evaluating both local and overall slope stability factors in conjunction with key parameters such as slope height and angle. The research focuses on assessing the stability of the designed slopes at the Jiangte Xikeng Lithium Mine open-pit site, with the objective of determining the optimal slope angle that guarantees stability and mitigates potential safety risks. The study begins with an investigation of the engineering geological conditions and structural characteristics of the Xikeng Lithium Mine area, offering a detailed account of lithology, structural plane orientations, and degrees of structural development. Mechanical parameters of rock masses with varying degrees of weathering were obtained through laboratory testing. Subsequently, a finite element model of the open-pit slope was developed to simulate slope deformation and failure mechanisms under different working conditions. The primary focus of the analysis is the stability of the open-pit slopes and the selection of the optimal slope angle. The main findings of the study are summarized as follows:
(1)
The stratigraphic distribution in the Xikeng Lithium Mine area is relatively simple. The artificial fill primarily consists of strongly weathered granite fragments, gravelly and sandy granite, with minor amounts of sandy soil-like granite. The colluvium is mainly composed of sandy clay with rock debris, occasionally containing gravel, coarse sandy clay, or interbedded spheroidal weathered bodies. Structural development in the area is not significant, with two principal fault sets that have not caused any notable damage to the ore body. The F01 fault has a strike of 137° and a dip of 75° and is mainly characterized by silicification and fragmentation. The fault zone is narrow with significant variability; it contains abundant fracture fillings, exhibits small openings, and has poor permeability and water-bearing capacity. The F02 fault, with a strike of 113° and a dip of 60°, comprises a series of parallel and densely spaced compressive shear fractures. This fault zone displays relatively good permeability but similarly poor water-bearing capacity.
(2)
The open-pit slope is divided into eight zones, with the predominant failure modes being circular and compound failures. Based on the degree of weathering, the rocks are classified into four types: slightly weathered, moderately weathered, heavily weathered, and fully weathered. With increasing weathering, parameters such as rock density and strength gradually decline.
(3)
Slope stability analyses were performed under the combined effects of self-weight, seismic forces, and rainfall. The results indicate that under all load scenarios, the most critical zones for slope stability are near the slope crests in Zones F and I. These areas require local optimization or the addition of structural support. Following the accumulation of the No. 1 waste dump on the western side of the site, the displacement in the K zone slope increases significantly, highlighting the need for enhanced safety monitoring in this area.
(4)
Under a daily rainfall of 300 mm, the mechanical response analysis after 24 h of rainfall shows that infiltration has a limited impact on the open-pit slopes under heavy rain conditions. For a specific profile in Zone F, the overall slope angle of rock layers and the local slope angle of soil layers were optimized. The recommended slope angles are 42° for rock masses and 27° for soil layers. Other profiles may be optimized based on site-specific conditions during the mining process.
Although substantial progress has been made in slope stability research both domestically and internationally, several challenges remain. These include improving the accuracy and applicability of slope stability analysis methods, enhancing the real-time performance and reliability of slope monitoring technologies, and optimizing the economic feasibility and environmental sustainability of slope reinforcement strategies. Looking ahead, with the ongoing advancement of technologies such as artificial intelligence, big data, and the Internet of Things, slope stability research will encounter new opportunities and challenges.

Author Contributions

Conceptualization, Y.Y.; Methodology, Y.Y.; Software, Y.Y.; Validation, Z.Y.; Formal analysis, Z.Y.; Investigation, Z.Y. and J.W.; Resources, J.W.; Data curation, J.W. and F.G.; Writing—original draft, F.G.; Writing—review and editing, F.G.; Supervision, C.S.; Project administration, C.S.; Funding acquisition, C.S. All authors have read and agreed to the published version of the manuscript.

Funding

The research is supported by the Key Science and Technology Program of the Ministry of Emergency Management of the People’s Republic of China (2024EMST141405).

Institutional Review Board Statement

All research activities were conducted in accordance with the ethical guidelines and principles outlined by the Committee on Publication Ethics.

Informed Consent Statement

All individuals involved in this study have provided their consent for the publication of the study findings. Any personal or identifying information that could potentially compromise privacy has been carefully removed or anonymized.

Data Availability Statement

The data and materials used in this study are available upon request. Please contact Jinglin Wen (wenjl@chinasafety.ac.cn) to inquire about the availability of data and materials, including any restrictions that may apply due to privacy or confidentiality concerns.

Conflicts of Interest

Authors Yongming Yin, Zhengxing Yu and Jinglin Wen were employed by Cathay Safety Technology Co., Ltd. Author Fangzhi Gan was employed by Zhaoqing Runxin New Materials Co., Ltd. The remaining author declares that the research was conducted in the absence of any commercial or financial relationships that could be construed as a potential conflict of interest.

References

  1. Salunkhe, D.P.; Bartakke, R.N.; Chvan, G.; Kothavale, P.R.; Digvijay, P. An overview on methods for slope stability analysis. Int. J. Eng. Res. Technol. 2017, 6, 528–535. [Google Scholar]
  2. Christian, J.T.; Ladd, C.C.; Baecher, G.B. Reliability applied to slope stability analysis. J. Geotech. Eng. 1994, 120, 2180–2207. [Google Scholar] [CrossRef]
  3. Azarafza, M.; Akgün, H.; Ghazifard, A.; Asghari-Kaljahi, E.; Rahnamarad, J.; Derakhshani, R. Discontinuous rock slope stability analysis by limit equilibrium approaches—A review. Int. J. Digit. Earth 2021, 14, 1918–1941. [Google Scholar] [CrossRef]
  4. Kardani, N.; Zhou, A.; Nazem, M.; Shen, S.L. Improved prediction of slope stability using a hybrid stacking ensemble method based on finite element analysis and field data. J. Rock Mech. Geotech. Eng. 2021, 13, 188–201. [Google Scholar] [CrossRef]
  5. Shiau, J.; Keawsawasvong, S. Multivariate adaptive regression splines analysis for 3D slope stability in anisotropic and heterogenous clay. J. Rock Mech. Geotech. Eng. 2023, 15, 1052–1064. [Google Scholar] [CrossRef]
  6. Meng, J.; Mattsson, H.; Laue, J. Three-dimensional slope stability predictions using artificial neural networks. Int. J. Numer. Anal. Methods Geomech. 2021, 45, 1988–2000. [Google Scholar] [CrossRef]
  7. Jiang, S.H.; Zhu, G.Y.; Wang, Z.Z.; Huang, Z.T.; Huang, J. Data augmentation for CNN-based probabilistic slope stability analysis in spatially variable soils. Comput. Geotech. 2023, 160, 105501. [Google Scholar] [CrossRef]
  8. Zhang, W.G.; Meng, F.S.; Chen, F.Y.; Liu, H.L. Effects of spatial variability of weak layer and seismic randomness on rock slope stability and reliability analysis. Soil Dyn. Earthq. Eng. 2021, 146, 106735. [Google Scholar] [CrossRef]
  9. Yang, Y.; Xia, Y.; Zheng, H.; Liu, Z. Investigation of rock slope stability using a 3D nonlinear strength-reduction numerical manifold method. Eng. Geol. 2021, 292, 106285. [Google Scholar] [CrossRef]
  10. Azarafza, M.; Hajialilue Bonab, M.; Derakhshani, R. A novel empirical classification method for weak rock slope stability analysis. Sci. Rep. 2022, 12, 14744. [Google Scholar] [CrossRef]
  11. Spiekermann, R.I.; McColl, S.; Fuller, I.; Dymond, J.; Burkitt, L.; Smith, H.G. Quantifying the influence of individual trees on slope stability at landscape scale. J. Environ. Manag. 2021, 286, 112194. [Google Scholar] [CrossRef] [PubMed]
  12. Ramhmachhuani, R.; Mozumder, R.A. Impact of building topologies on hill slope stability in Aizawl city. Results Eng. 2024, 23, 102744. [Google Scholar]
  13. Liu, L.L.; Wang, Y. Quantification of stratigraphic boundary uncertainty from limited boreholes and its effect on slope stability analysis. Eng. Geol. 2022, 306, 106770. [Google Scholar] [CrossRef]
  14. Unigwe, C.O.; Igwe, O.; Onwuka, O.S.; Egbueri, J.C.; Omeka, M.E. Roles of hydro-geotechnical and slope stability characteristics in the erosion of Ajali and Nanka geologic formations in southeastern Nigeria. Arabian J. Geosci. 2022, 15, 1492. [Google Scholar] [CrossRef]
  15. Demir, S.; Sahin, E.K. Application of state-of-the-art machine learning algorithms for slope stability prediction by handling outliers of the dataset. Earth Sci. Inform. 2023, 16, 2497–2509. [Google Scholar] [CrossRef]
  16. Huang, R.Q.; Zhang, Z.Y.; Wang, S.T. Study on the current status and development prospects of high slope stability. Adv. Earth Sci. 1991, 6, 12–20. [Google Scholar]
  17. Shi, B.T.; Zhang, Y.; Zhang, W. Strength reduction method for slope stability analysis. J. Geotech. Eng. 2016, 38, 1678–1684. [Google Scholar]
  18. Wang, Y.; Li, Z.Y.; Shi, H.P.; Wang, P.Q. Progress in slope stability analysis methods. Sichuan Cement 2021, 43, 89–94. [Google Scholar]
  19. Qi, X.J.; Gao, X.X.; Ji, C.; Yu, J. Discussion on slope stability and landslide treatment in geological hazard projects. Value Eng. 2024, 43, 61–63. [Google Scholar]
  20. Wang, W. A brief discussion on the research progress of loess slope stability and prevention technology. Sci. Tech. Inf. Dev. Econ. 2009, 19, 102–105. [Google Scholar]
  21. Wang, L. BIM 3D Geological Modeling Technology in Slope Stability Analysis. Bachelor’s Dissertation, Chang’an University, Xi’An, China, 2020. [Google Scholar]
  22. Xia, Y.Y. Research status and prospects of slope stability analysis methods. Rock Soil Mech. 2007, 28, 621–628. [Google Scholar]
  23. Ji, J.; Wang, C.W.; Cui, H.Z.; Li, X.Y.; Song, J.; Gao, Y. A simplified nonlinear coupled Newmark displacement model with degrading yield acceleration for seismic slope stability analysis. Int. J. Numer. Anal. Methods Geomech. 2021, 45, 1303–1322. [Google Scholar] [CrossRef]
  24. Rusydy, I.; Fathani, T.F.; Al-Huda, N.; Sugiarto; Iqbal, K.; Jamaluddin, K.; Meilianda, E. Integrated approach in studying rock and soil slope stability in a tropical and active tectonic country. Environ. Earth Sci. 2021, 80, 58. [Google Scholar] [CrossRef]
  25. Wang, W.; Wang, P.; Zhang, Z. Study on gravel soil strength degradation and its influence on slope stability in reservoir bank fluctuating zone. Eng. Fail. Anal. 2022, 134, 105980. [Google Scholar] [CrossRef]
  26. Mafi, R.; Javankhoshdel, S.; Cami, B.; Jamshidi Chenari, R.; Gandomi, A.H. Surface altering optimisation in slope stability analysis with non-circular failure for random limit equilibrium method. Georisk 2021, 15, 260–286. [Google Scholar] [CrossRef]
  27. Thomas, J.; Gupta, M.; Srivastava, P.K.; Petropoulos, G.P. Assessment of a dynamic physically based slope stability model to evaluate timing and distribution of rainfall-induced shallow landslides. ISPRS Int. J. Geo-Inf. 2023, 12, 105. [Google Scholar] [CrossRef]
  28. Chen, M.L.; Zhou, J.W.; Yang, X.G. A novel approach for slope stability evaluation considering landslide dynamics and its application to reservoir landslide. Nat. Hazards 2024, 120, 3589–3621. [Google Scholar] [CrossRef]
  29. Xiong, Z.T. Optimization study of slope stability prediction model based on machine learning. Kunming Univ. Sci. Technol. 2023, 9, 93. [Google Scholar] [CrossRef]
  30. Shi, Y.X.; Zhang, Q.; Meng, X.W. Application of distributed optical fiber sensing technology in landslide monitoring. J. Jilin Univ. 2008, 38, 820–824. [Google Scholar] [CrossRef]
  31. Yan, H.Q.; Song, C.J.; Zhou, Y.F. Application of prestressed anchor cable technology in slope reinforcement. Highway 2003, 8 (Suppl. S1), 46–50. [Google Scholar]
  32. Griffiths, D.V.; Lane, P.A. Slope stability analysis by finite elements. Geotechnique 1999, 49, 387–403. [Google Scholar] [CrossRef]
  33. Mikkelsen, P.E. Advances in inclinometer data analysis. In Proceedings of the 6th International Symposium on Field Measurements in Geomechanics, Oslo, Norway, 23–26 September 2003; pp. 555–567. [Google Scholar]
  34. Jones, C.J.F.P.; Clarke, D. The stabilization of slopes using soil nailing. Geotech. Eng. 2007, 160, 167–177. [Google Scholar]
  35. Lu, N.; Şener-Kaya, B.; Wayllace, A.; Godt, J.W. Analysis of rainfall-induced slope instability using a field of local factor of safety. Water Resour. Res. 2012, 48, 9524. [Google Scholar] [CrossRef]
  36. Wang, X.; Wang, K.; Hu, K. Analysis of Slope Stability Induced by Changes in Water Content Using Local Stability Field Coefficient Method. Water Resour. Hydropower Eng. 2016, 47, 110–113+121. [Google Scholar]
  37. Zhu, Y.; Ishikawa, T.; Subramanian, S.S.; Luo, B. Simultaneous Analysis of Slope Instabilities on a Small Catchment-Scale Using Coupled Surface and Subsurface Flows. Eng. Geol. 2020, 275, 105750. [Google Scholar] [CrossRef]
  38. Ma, S. Study on the Stability of Infinite Slopes Under Heavy Rainfall Using the Green-Ampt Infiltration Model. Master’s Thesis, Zhejiang University, Hangzhou, China, 2014. [Google Scholar]
  39. Li, M.; Cai, G.; Li, H.; Yang, B.; Zhao, C. Stability Analysis of Unsaturated Soil Infinite Slopes Considering Tensile Strength and Shear Failure. J. Geotech. Eng. 2020, 42, 705–713. [Google Scholar]
  40. Michalowski, R.L. Failure Potential of Infinite Slopes in Soils with Tensile Strength Cutoff. Can. Geotech. J. 2017, 55, 477–485. [Google Scholar] [CrossRef]
  41. Ma, C.; Liu, Z. Horizontal Displacement and Stability Analysis of Infinite Slopes under Rainfall Infiltration. Rock Soil Mech. 2007, 28 (Suppl. S1), 563–568. [Google Scholar]
  42. Zhang, M.M.; Liang, L.X.; Liu, X.J. Analysis of the Influence of Different Rock Shear Failure Criteria on Wellbore Collapse Pressure. Chin. J. Rock Mech. Eng. 2017, 36 (Suppl. S1), 3485–3491. [Google Scholar]
  43. Zhang, M.; Fan, X.; Zhang, Q.; Yang, B.; Zhao, P.; Yao, B.; He, L. Influence of Multi-Planes of Weakness on Unstable Zones Near Wellbore Wall in a Fractured Formation. J. Nat. Gas Sci. Eng. 2021, 93, 104026. [Google Scholar] [CrossRef]
  44. Zhang, M.; Fan, X.; Zhang, Q.; Yang, B.; Zhao, P.; Yao, B.; Ran, J. Parametric Sensitivity Study of Wellbore Stability in Transversely Isotropic Medium Based on Poly-Axial Strength Criteria. J. Pet. Sci. Eng. 2021, 197, 108078. [Google Scholar] [CrossRef]
  45. Zhang, M.; Li, D.; Liu, J.; Zhang, D.; Zhang, Y.; Cui, K. Modification of the Mohr-Coulomb Criterion Based on Shape Function and Determination of Undetermined Parameters. Mech. Mater. 2023, 185, 104772. [Google Scholar] [CrossRef]
  46. Zhang, J.; Lin, C.; Tang, H.; Wen, T.; Tannant, D.D.; Zhang, B. Input-Parameter Optimization Using an SVR-Based Ensemble Model to Predict Landslide Displacements in a Reservoir Area: A Comparative Study. Appl. Soft Comput. 2024, 150, 111107. [Google Scholar] [CrossRef]
  47. Zhang, J.; Tang, H.; Tan, Q.; Mao, M.; Zhou, B.; Zhang, Y. A Generalized Early Warning Criterion for Landslide Risk Assessment: Deformation Probability Index (DPI). Acta Geotech. 2024, 19, 2607–2627. [Google Scholar] [CrossRef]
  48. Dong, Z.; Tian, S.; Xue, H.; Lu, S.; Liu, B.; Erastova, V.; Chen, G.; Zhang, Y. A novel method for automatic quantification of different pore types in shale based on SEM-EDS calibration. Mar. Pet. Geol. 2025, 173, 107278. [Google Scholar] [CrossRef]
  49. Wu, W.; Wang, T.; Bai, J.; Liu, J.; Wang, X.; Xu, H.; Feng, G. Failure Characteristics and Cooperative Control Strategies for Gob-Side Entry Driving Near an Advancing Working Face: A Case Study. Processes 2024, 12, 1398. [Google Scholar] [CrossRef]
  50. Fu, J.; Song, W.; Du, J. Transient Volume Water Content Analysis of Unsaturated Soil Slopes Under Two-Dimensional Rainfall Infiltration. J. Eng. Sci. 2015, 37, 407–413. [Google Scholar]
  51. Das, T.; Rao, V.D.; Choudhury, D. Numerical Investigation of the Stability of Landslide-Affected Slopes in Kerala, India, under Extreme Rainfall Event. Nat. Hazards 2022, 114, 751–785. [Google Scholar] [CrossRef]
  52. Wang, J.; Xi, H.; Li, B.; Yang, X. Study and Analysis of Factors Affecting Slope Stability under Rainfall Infiltration Field Distribution. J. Lanzhou Univ. Technol. 2022, 48, 142–147. [Google Scholar]
  53. Gu, Y.; Yuan, Y.; Li, X. The Influence of Soil Anisotropic Permeability on Slope Stability under Rainfall Conditions. Chin. Saf. Sci. Technol. 2023, 19 (Suppl. S1), 43–49. [Google Scholar]
  54. Fan, Z.; Song, X.; Wang, D.; Ayasrah, M.; Li, S. Poroelastic Solutions of a Semi-Permeable Borehole Under Non-Hydrostatic in Situ Stresses Within Transversely Isotropic Media. Int. J. Geomech. 2025, 25, 04024342. [Google Scholar] [CrossRef]
  55. Gao, R.; Kuang, T.; Meng, X.; Huo, B. Effects of ground fracturing with horizontal fracture plane on rock breakage characteristics and mine pressure control. Rock Mech. Rock Eng. 2021, 54, 3229–3243. [Google Scholar] [CrossRef]
  56. Gao, R.; Dou, B.; Bin, Y.; Yang, T.; Meng, X.; Zhang, W. Ground fracturing of multi-strata for strong ground pressure control in extra-thick coal seams with hard roofs: Numerical simulation and case study. Eng. Fract. Mech. 2024, 303, 110129. [Google Scholar] [CrossRef]
  57. GB 51016-2014; Technical Code for Non-Coal Open-Pit Mine Slope Engineering. Standards Press of China (SPC): Beijing, China, 2014.
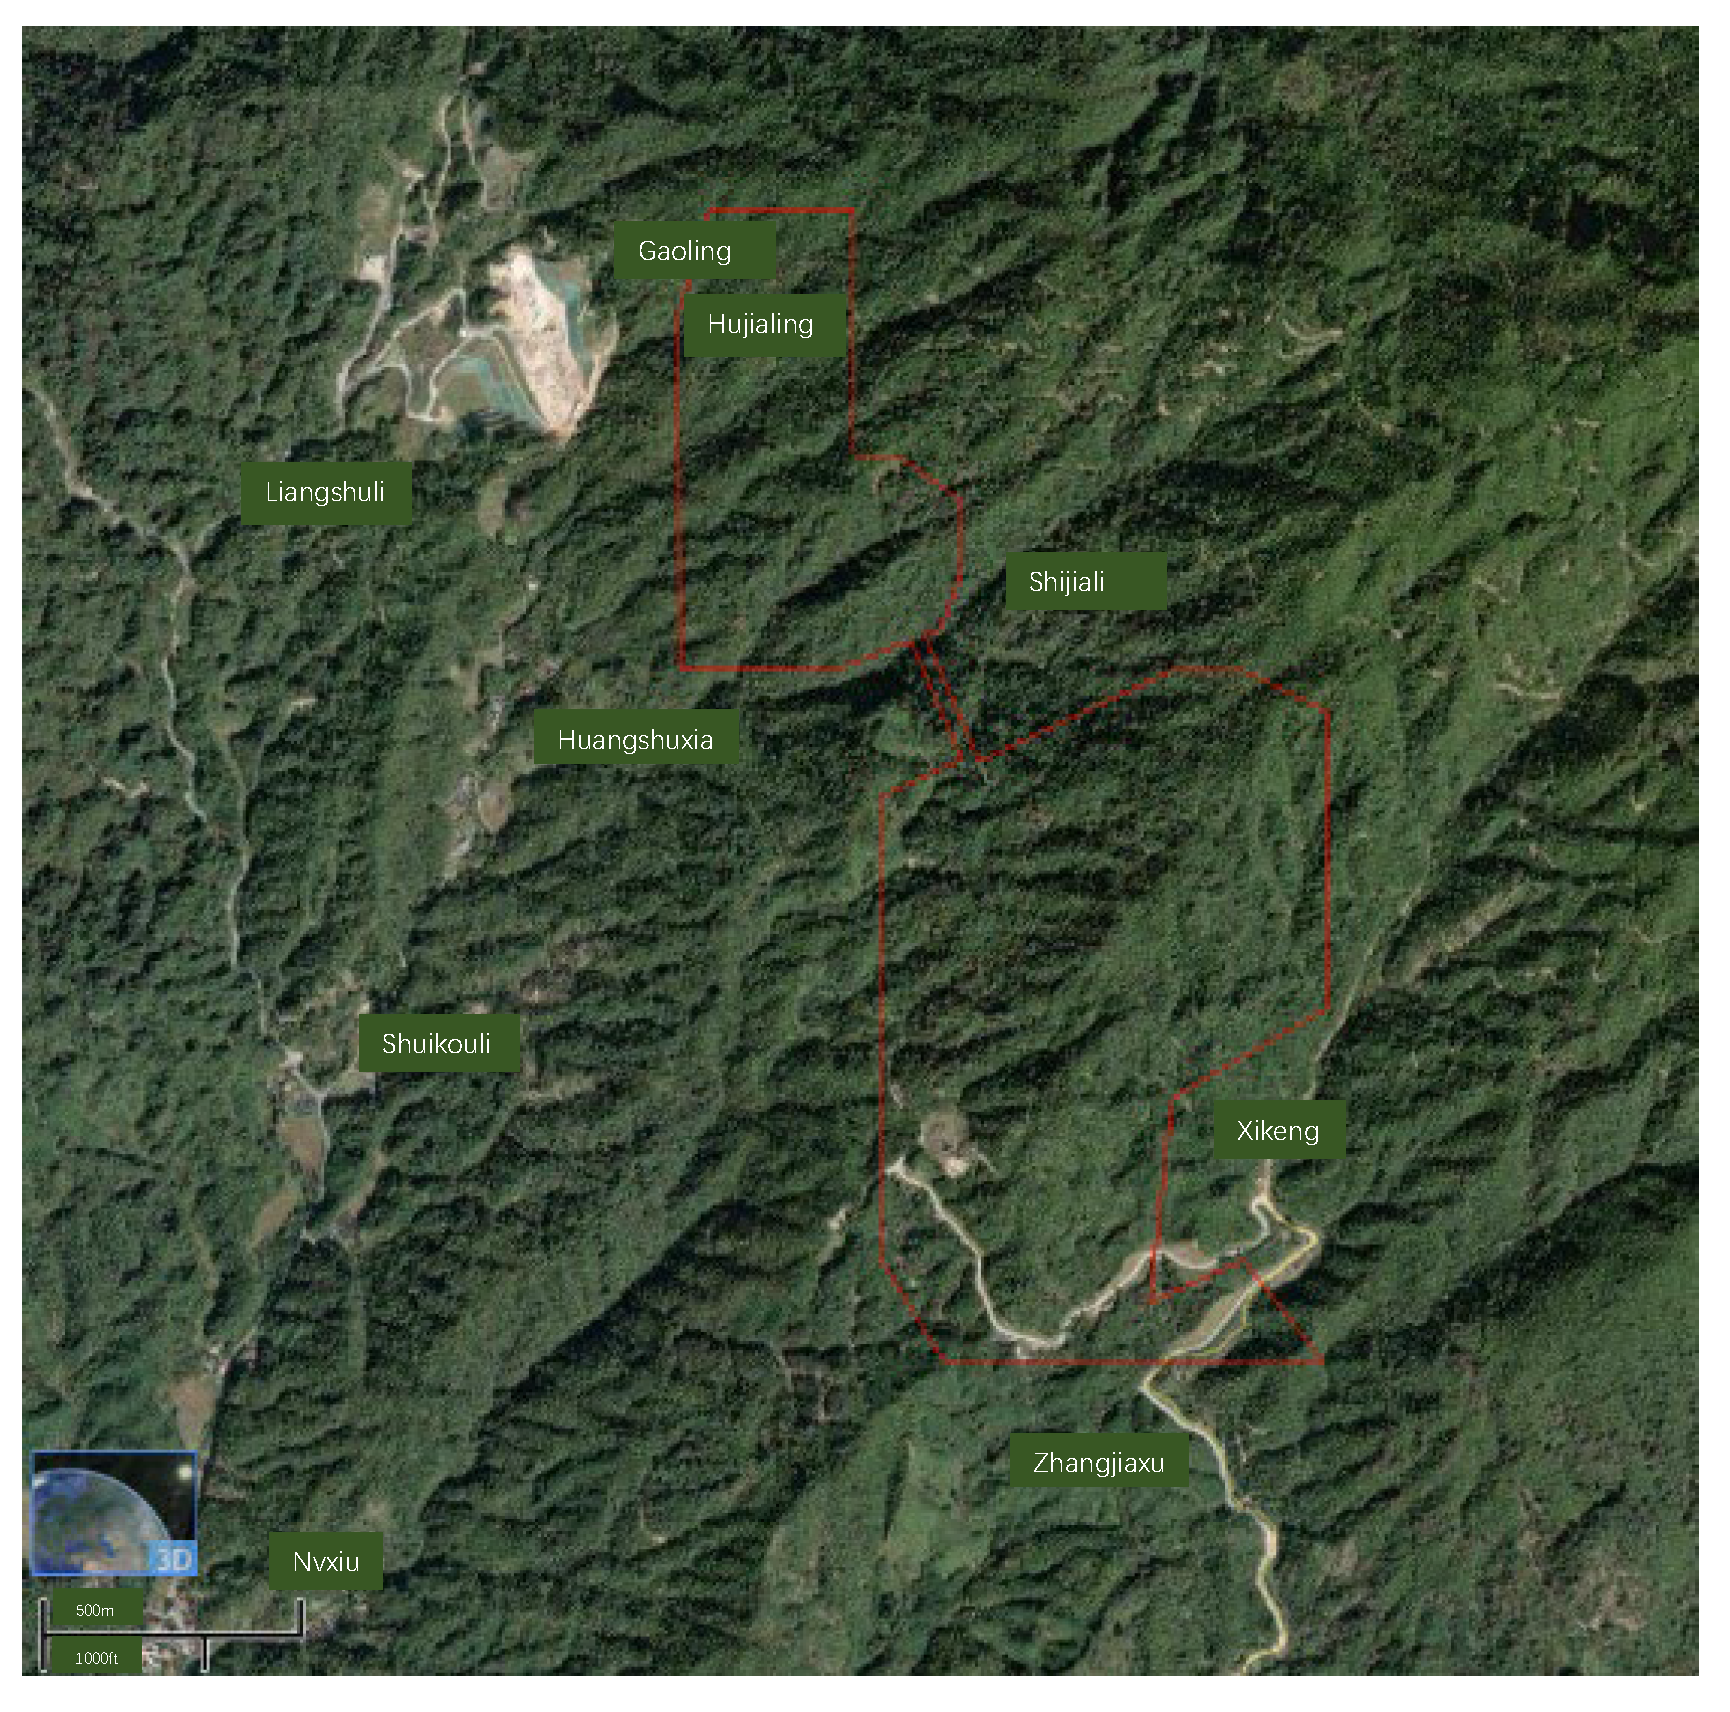
Figure 1. Image of the Mine Area’s Topography and Landforms (Source: Bigemap Imagery, http://www.bigemap.com/, 6 March 2024).
Processes 13 01686 g001
Figure 2. Xikeng Mine Area Image—Fault Distribution Overlay Map.
Processes 13 01686 g002
Figure 3. Rose Diagram of F01 Fault Joint Orientations and Equal-Density Plot of Dip Angles.
Processes 13 01686 g003
Figure 4. Rose Diagram of F02 Fault Joint Orientations and Equal-Density Plot of Dip Angles.
Processes 13 01686 g004
Figure 5. Slope zoning diagram.
Processes 13 01686 g005
Figure 6. Boundary conditions of the open-pit numerical model.
Processes 13 01686 g006
Figure 7. Vertical stress contour under self-weight + groundwater action.
Processes 13 01686 g007
Figure 8. Maximum effective stress contour under self-weight + groundwater action.
Processes 13 01686 g008
Figure 9. X-direction stress contour under self-weight + groundwater action.
Processes 13 01686 g009
Figure 10. Y-direction stress contour under self-weight + groundwater action.
Processes 13 01686 g010
Figure 11. Deformation contour under self-weight + groundwater action.
Processes 13 01686 g011
Figure 12. Vertical stress contour under self-weight + groundwater + blasting vibration action.
Processes 13 01686 g012
Figure 13. Maximum effective stress contour under self-weight + groundwater + blasting vibration action.
Processes 13 01686 g013
Figure 14. X-direction stress contour under self-weight + groundwater + blasting action.
Processes 13 01686 g014
Figure 15. Y-direction stress contour under self-weight + groundwater + blasting action.
Processes 13 01686 g015
Figure 16. Deformation contour under self-weight + groundwater + blasting vibration action.
Processes 13 01686 g016
Figure 17. Vertical stress contour after 24 h of rainfall.
Processes 13 01686 g017
Figure 18. Deformation contour after 24 h of rainfall.
Processes 13 01686 g018
Figure 19. Comparison before and after optimization of a profile in Zone F. (a) Before optimization of a profile in Zone F; (b) After optimization of a profile in Zone F.
Processes 13 01686 g019
Figure 20. Local stability analysis and calculation results after optimization of a profile in Zone F. (a) Safety factor of bishop method 1.373; (b) Safety factor of M-P method 1.376; (c) Safety factor of bishop method 1.306; (d) Safety factor of M-P method 1.308.
Processes 13 01686 g020
Table 1. Recommended Values of Soil Physical and Mechanical Parameters.
Geotechnical LayerDry Density ρd/(g/cm3)Wet Density ρ/(g/cm3)Cohesion c/kPaFriction Angle φ/°
Completely Weathered Granite1.511.75143.0024.00
Table 2. Recommended Values of Rock Physical and Mechanical Parameters.
Rock ClassificationWater
Absorption ω/%
Wet
Density frk/g/cm3
Natural
Compressive Strength frk/MPa
Elastic Modulus Eav/GPaCohesion c/MPaFriction Angle φ/°Poisson’s Ratio μ
Highly Weathered Granite2.062.5023.327.548.3347.580.28
Moderately Weathered Granite0.442.5674.4913.6219.7849.720.34
Slightly Weathered Granite0.292.59106.1215.5121.6051.600.32
Table 3. Calculation results of local stability for profiles.
ProfileLoading CombinationSafety FactorSpecification Value
Bishop MethodM-P MethodOptional Value
Profile X in Zone FI1.3731.3761.373Loading combination I: 1.25;
Loading combination II: 1.23
II1.3061.3081.306
Disclaimer/Publisher’s Note: The statements, opinions and data contained in all publications are solely those of the individual author(s) and contributor(s) and not of MDPI and/or the editor(s). MDPI and/or the editor(s) disclaim responsibility for any injury to people or property resulting from any ideas, methods, instructions or products referred to in the content.