Article

Integrated Modeling of Time-Varying Permeability and Non-Darcy Flow in Heavy Oil Reservoirs: Numerical Simulator Development and Case Study

1
State Key Laboratory of Offshore Oil and Gas Exploitation, Beijing 102299, China
2
CNOOC Research Institute Co., Ltd., Beijing 102299, China
*
Author to whom correspondence should be addressed.
Processes 2025, 13(6), 1683; https://doi.org/10.3390/pr13061683
Submission received: 29 April 2025 / Revised: 21 May 2025 / Accepted: 23 May 2025 / Published: 27 May 2025
(This article belongs to the Special Issue Advanced Strategies in Enhanced Oil Recovery: Theory and Technology)

Abstract

:
Studies have demonstrated that heavy oil flow exhibits threshold pressure gradient (TPG) which is closely related to the permeability and viscosity of the crude oil. Also, long-term water flooding continuously alters unconsolidated sandstone reservoir permeability through water flushing. These combined effects significantly influence water flooding performance. Therefore, in this paper, a comprehensive oil–water two phase mathematical model is developed for waterflooded heavy oil unconsolidated sandstone reservoirs based on the traditional black oil model, incorporating both time-varying permeability and threshold pressure gradient. The water-flooding-dependent threshold pressure gradient is firstly proposed, accounting for time-varying permeability. Subsequently, a simulator is developed with finite volume and Newton iteration method. Good agreement is obtained with the commercial simulator based on traditional black oil model. Afterward, the influence of permeability time variation and threshold pressure gradient is analyzed in detail. Results demonstrate that the threshold pressure gradient and time-varying permeability both decrease the oil recovery. The threshold pressure gradient (TPG) reduces the oil flow region and displacement efficiency since production. The increases in permeability after long term water flooding exacerbate reservoir heterogeneity and reduce sweep efficiency. The lowest oil recovery is observed when non-Darcy flow and permeability time variation are considered simultaneously. Furthermore, the time-varying threshold pressure gradient is observed with permeability time variation. Finally, a field data history matching was successfully performed, demonstrating the practical applicability of the proposed model. This new model better aligns with reservoir development characteristics. It can provide a theoretical guide for the development of heavy oil reservoirs.

1. Introduction

China’s offshore oilfields contain abundant heavy oil resources in unconsolidated sandstone reservoirs; most of them have entered the ultra-high water cut stage with long term water flooding [1,2,3]. After prolonged water flooding development, the remaining oil distribution becomes highly dispersed [4,5,6]. Moreover, complex flow mechanisms of heavy oil reservoir are observed with high oil viscosity and long term water flooding, which would substantially affect the simulation accuracy. Consequently, the accurate description of the remaining oil becomes an important and challenging task [7]. Therefore, it is necessary to establish a specialized heavy oil numerical simulation technology for the accurate description of the remaining oil during high-water-cut stage.
Extensive experimental studies found that heavy oils exhibit Bingham fluid behavior and need to overcome a yield stress before flow [8,9,10]. The threshold pressure gradient (TPG) concept has been introduced to quantify this yield stress effect, where oil flow only occurs in regions where the pressure gradient exceeds the TPG [11,12,13]. Notably, TPG demonstrates an inverse relationship with oil mobility. Higher permeability results in lower threshold pressure gradient. This phenomenon makes oil flow particularly challenging in low-permeability zones which would exacerbate water channeling in reservoirs. Furthermore, studies have demonstrated that long-term water injection alters reservoir permeability characteristics [14,15]. The properties of high-permeability reservoirs continue to improve after long-term water processes [16,17,18]. The increases in permeability exacerbate heterogeneity and reduce sweep efficiency [19,20]. Additionally, the permeability variation leads to changes in the water-flooding-dependent threshold pressure gradient during production. With long term water flooding, a progressive reduction in threshold pressure gradient would be observed with sustained permeability enhancement. The cumulative effects of these factors significantly influence the overall production performance of the oil field. Neglecting these effects makes accurate water cut history matching particularly challenging during high-water-cut stages. A rigorous incorporation of non-Darcy flow dynamics and time-varying permeability variations is critical for achieving reliable numerical simulation results.
As the key research issues, scholars have conducted numerical simulation studies of the time-varying effect and the threshold pressure gradient separately. Ju et al. [21] proposed using water cut to characterize time dependent variations of reservoir parameters and developed a numerical simulation method. Its applicability becomes limited during high-water-cut stages where water cut variations remain minimal compared to significant physical parameter changes. Then, Cui and Xu et al. [22,23] introduced a unit–volume water injection-based time-varying simulation methodology. However, this proposed parameter shows strong grid-size dependency, which causes instability in the simulation. To address this issue, Jiang et al. [24,25] proposed surface flux which is less dependent on the grid size for the parameter’s time variation. After that, the influence of porosity is further considered based on the surface flux [26,27,28]. Additionally, numerous studies have been conducted about the non-Darcy flow behavior of heavy oil. Xin et al. [29,30,31] developed a numerical simulator based on experiment results of Bohai oil field and systematically analyzed non-Darcy flow effects. Jiang et al. advanced the methodology by integrating stress-sensitive permeability with non-Darcy flow dynamics [32]. As documented in literature, the numerical simulation of reservoir time-varying and non-Darcy flow have been developed alone. However, there is no reservoir numerical simulation that comprehensively considers both non-Darcy flow and permeability time variation in heavy oil reservoirs.
In this study, a novel numerical simulation approach that simultaneously accounts for reservoir permeability time variation and threshold pressure gradient is proposed. The threshold pressure gradient is first formulated as a function of water flux, better capturing its variation throughout the simulation process. First, the oil–water two phase mathematical model is established. Subsequently, a new numerical simulator is conducted and validated. In addition, the influence of key factors on production performance is analyzed in detail combined with the new simulator. Finally, accurate history matching is achieved with this new simulator.

2. Flow Mechanism Characterization

2.1. Time-Varying Mechanism

2.1.1. Characterization Method

Numerous methods have been proposed to quantitatively characterize time-varying phenomena such as water cut and surface flux. In this study, we employ the displacement flux concept to model permeability variation [26,27]. The displacement flux (Ft) is defined as the ratio of cumulative water flux flow through a unit pore cross-sectional area. This approach offers two key advantages: (1) a smaller influence of the grid size effects, and (2) explicit consideration of porosity influence [27,28].
F t = F d , F d = Q d A ϕ
where Fd is the displacement flux in the x, y and z directions, m; Fd is the total displacement flux, m; A is the cross-sectional area, m2; Qd is the flow through the cross-section, m3; and ϕ is porosity, dimensionless.

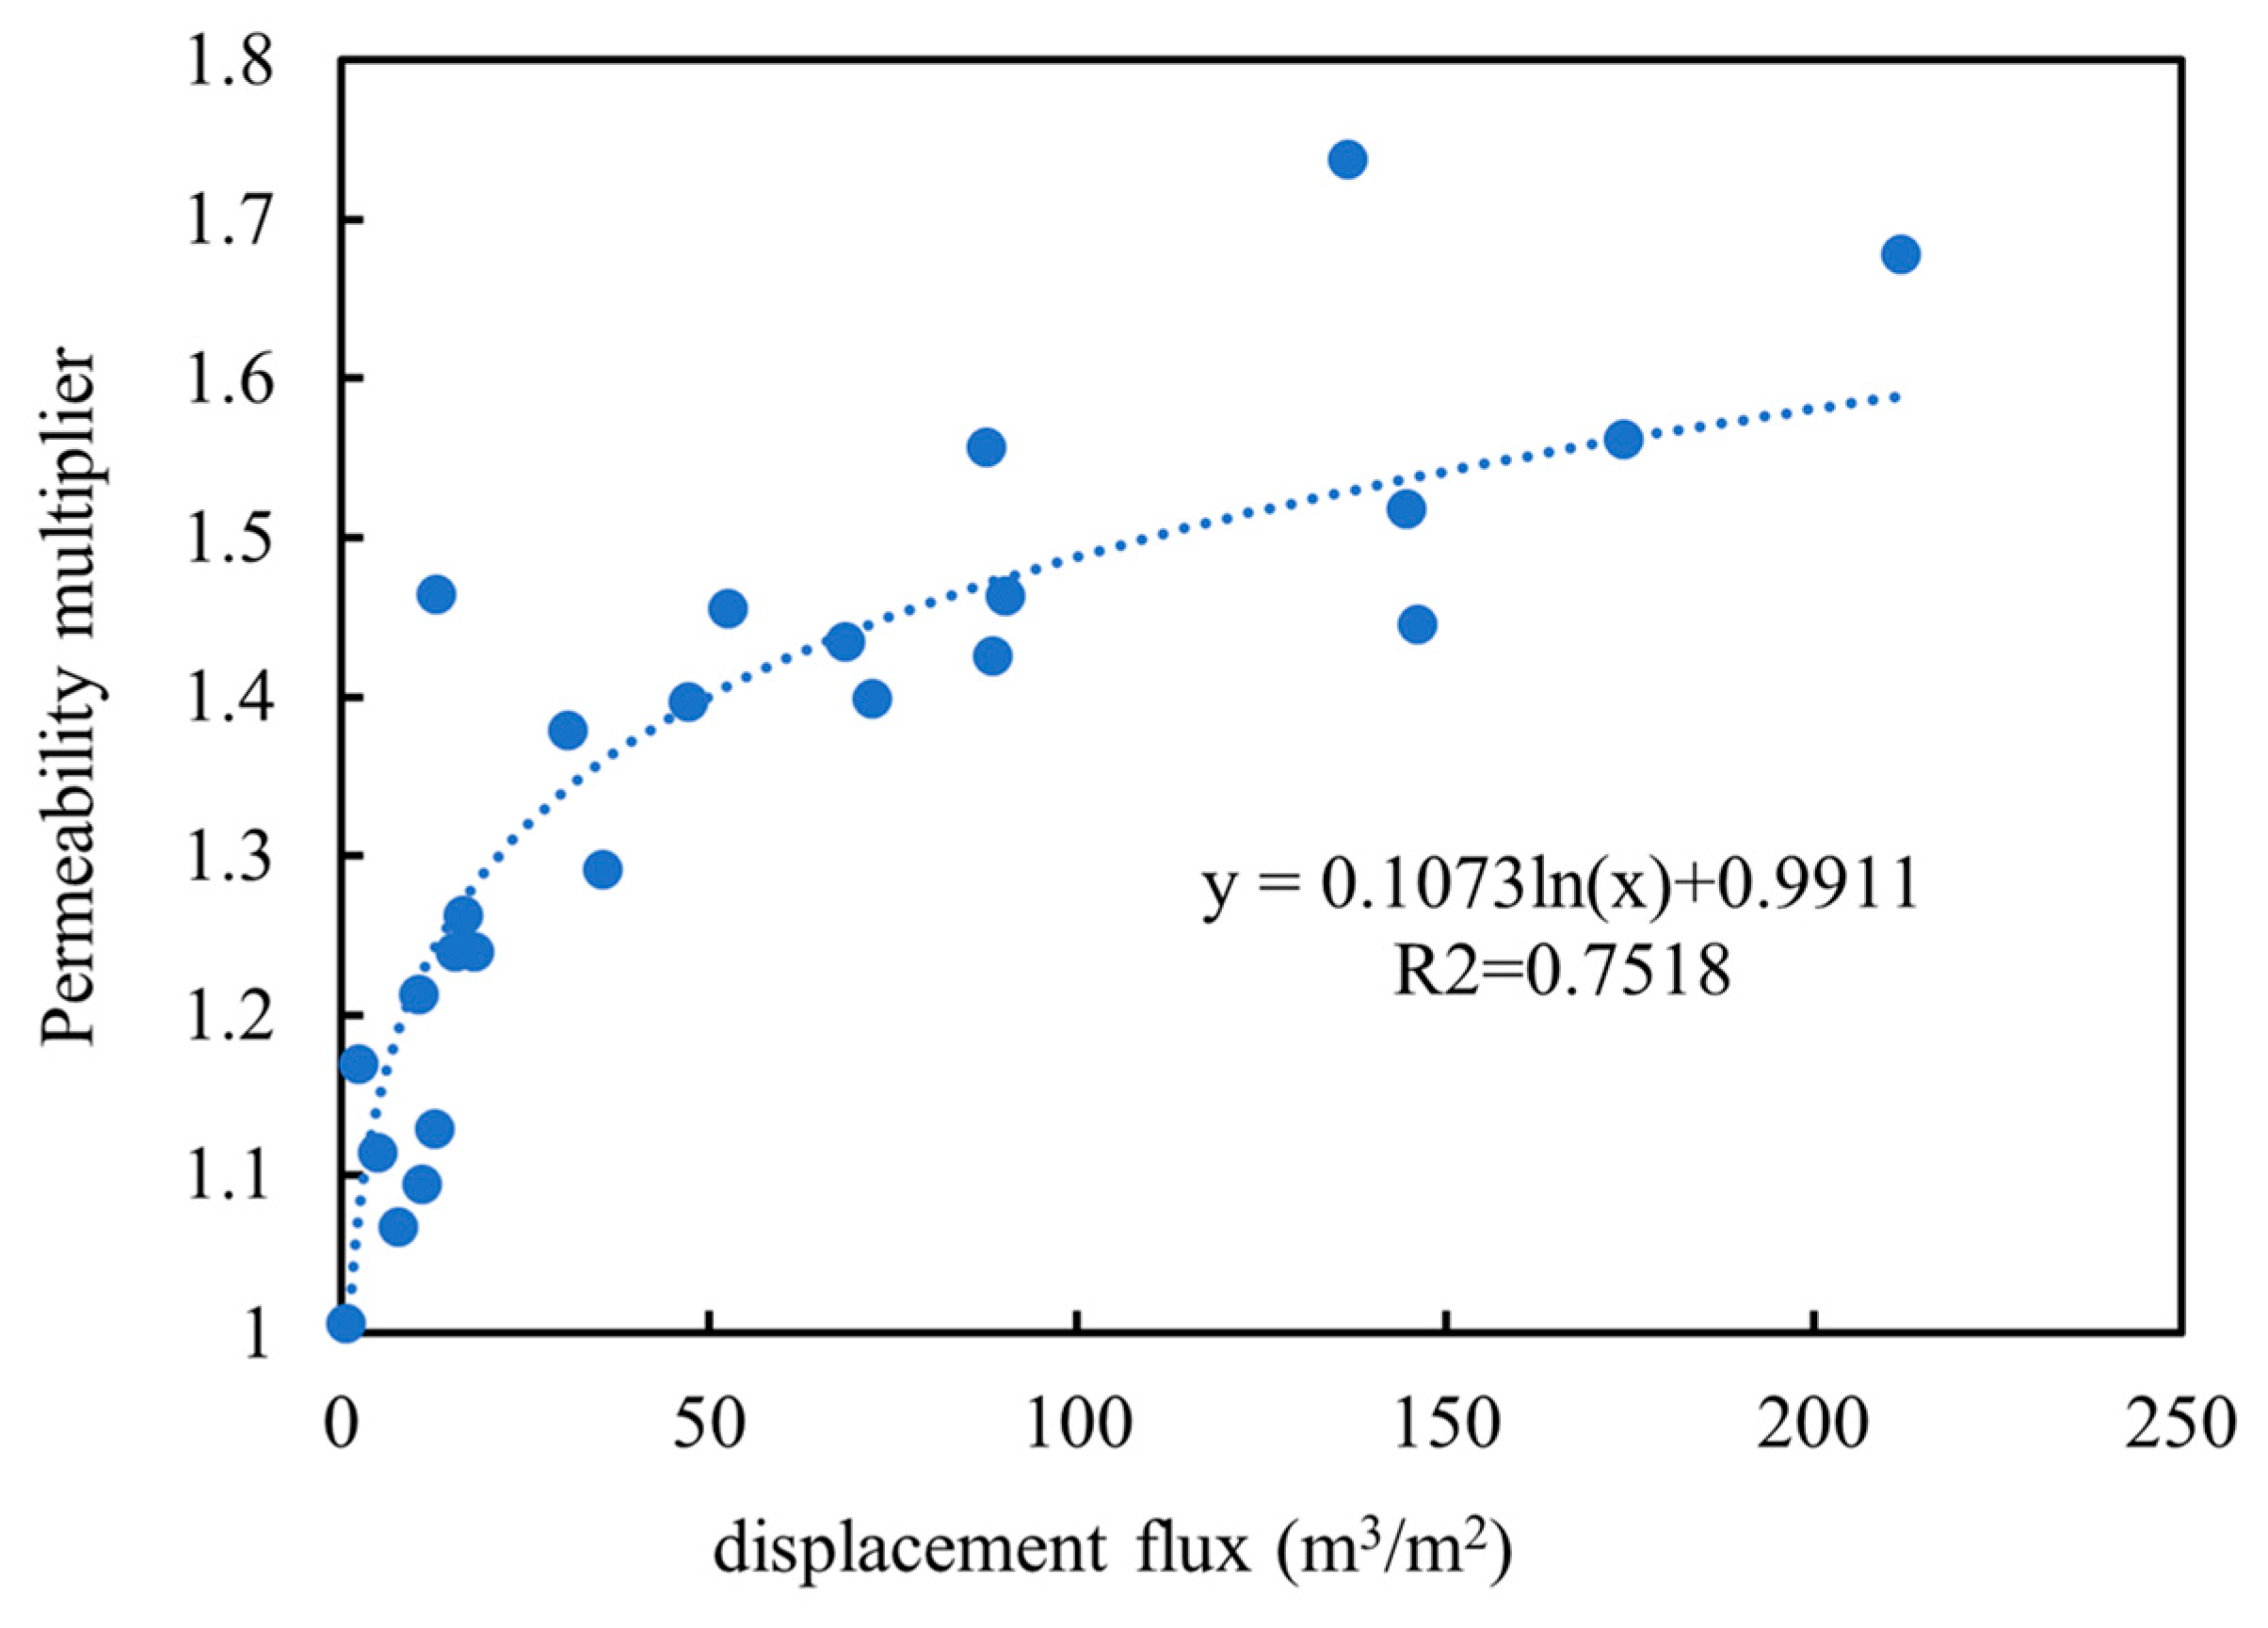
2.1.2. Time-Varying Permeability

For high permeability unconsolidated reservoir, the reservoir permeability demonstrates a progressive enhancement under continuous water displacement. Permeability evolution transitions from rapid enhancement at low displacement fluxes to gradual improvement under elevated flux conditions. As shown in Figure 1, the relationship between reservoir permeability and displacement flux is obtained with the studies of Zhao et al. [25].
k ( F d ) k i = 0.1073 ln F d + 0.9911
where k is the absolute permeability of the reservoir, m2; and ki is the initial permeability of the reservoir, m2.

2.2. Water-Flooding-Dependent Threshold Pressure Gradient

The core displacement experiment is carried out for the heavy oil in offshore reservoirs. Experimental investigations (Figure 2) reveal a strong inverse correlation between threshold pressure gradient (TPG) and oil mobility, with TPG decreasing exponentially as mobility ratio increases. More importantly, the permeability time variations during water flooding create a dynamic coupling effect where TPG becomes flux-dependent. The permeability enhancement caused by water flushing leads to a decay in crude oil TPG. Then the water-flooding-dependent threshold pressure gradient is quantitatively described by
G = 0.0004 ( k ( F d ) μ o ) 0.218
where G is the threshold pressure gradient, MPa/m; and μo represents the oil viscosity, Pa·s.

3. Mathematical Modeling and Numerical Simulator Development

The new numerical model for heavy oil reservoirs is derived from the traditional black oil model. By incorporating the displacement flux as a key parameter, the model accounts for time-dependent permeability variations. Additionally, a water-flooding-dependent threshold pressure gradient is introduced to modify Darcy’s Law for non-Darcy oil flow.

3.1. Model Assumptions

(1)
Flow is under isothermal reservoir conditions;
(2)
Flow is oil-water two phases;
(3)
Nonlinear seepage is considered solely in the oil phase;
(4)
Time-varying permeability and water-flooding-dependent threshold pressure gradient are incorporated.

3.2. Mathematical Model

Under the aforementioned assumptions, taking into account the threshold pressure gradient and the time-varying permeability effects, and the oil phase flow velocity is derived as
v o = 0 Φ o < G k ( F d ) k ro μ o M o Φ o Φ o > G
where G = 0.0004 ( k ( F d ) μ o ) 0.218   M o = ( 1 G Φ o )   Φ = P ρ g D .
Here, kro is the relative permeability of oil phase, dimensionless; Mo is the nonlinear correction coefficient of heavy oil, dimensionless, Φ is the potential, Pa; D is the depth from the reference surface (m); ρ the densities of the fluid, kg/m3; and g represents the gravitational acceleration (m/s2).
Considering the reservoir permeability time variation phenomenon, the water-phase flow velocity is derived as follows
v w = k ( F d ) k rw μ w Φ w
where krw is the relative permeability of the water phase and μw represents water viscosity, Pa·s.
The comprehensive model for heavy oil reservoirs, incorporating both time-varying permeability and a water-flooding-dependent threshold pressure gradient, is established as follows:
· v o + Q o = t ϕ S o B o · v w + Q w = t ϕ S w B w
Auxiliary equation
S o + S w = 1 P cow = P o P w
where Qo and Qw are the volume of oil and water produced or injected per unit time per unit volume, respectively, m3/s; Po, Pw are the pressure of oil and water phases, respectively, Pa; So, Sw are the saturation of oil and water phases, respectively, dimensionless; and Bo, Bw are the volume coefficients of oil and water phases, respectively, dimensionless.
After the mathematical model is obtained, numerical discretization and linearization are made. The governing equations are discretized using the finite volume method, with a fully implicit scheme employed for linearization [33,34]. The discrete equations are expressed as follows
Δ T o l M o l Δ Φ o l + Δ [ M o l ( T o P o ) l δ P o + M o l ( T o S w ) l δ S w ] Δ Φ o l + Δ T o l ( M o P o ) l δ P o + Δ T o l M o l Δ Φ o l P o δ P o + Q o l + Q o l P o δ P o + Q o l S w δ S w = V b Δ t [ ( ϕ S o B o ) l + ( ϕ S o B o ) P l δ P o + ( ϕ S o B o ) S w l δ S w ( ϕ S o B o ) n ]
Δ T w l Δ Φ w l + Δ [ ( T w P o ) l δ P o + ( T w S w ) l δ S w ] Δ Φ w l + Δ T w l Δ Φ w l P o δ P o + Q w l + Q w l P o δ P o + Q w l S w δ S w = V b Δ t [ ( ϕ S w B w ) l + ( ϕ S w B w ) l P o δ P o + ( ϕ S w B w ) l S w δ S w ( ϕ S w B w ) n ]
where T o = T λ o , λ o = k ro μ o B o , T w = T λ w , λ w = k rw μ w B w .
Here, T is the inter-grid transmissibility, m2·m; λo and λw are the mobility of oil and water phases, and δPw and δSo are the solution variables.

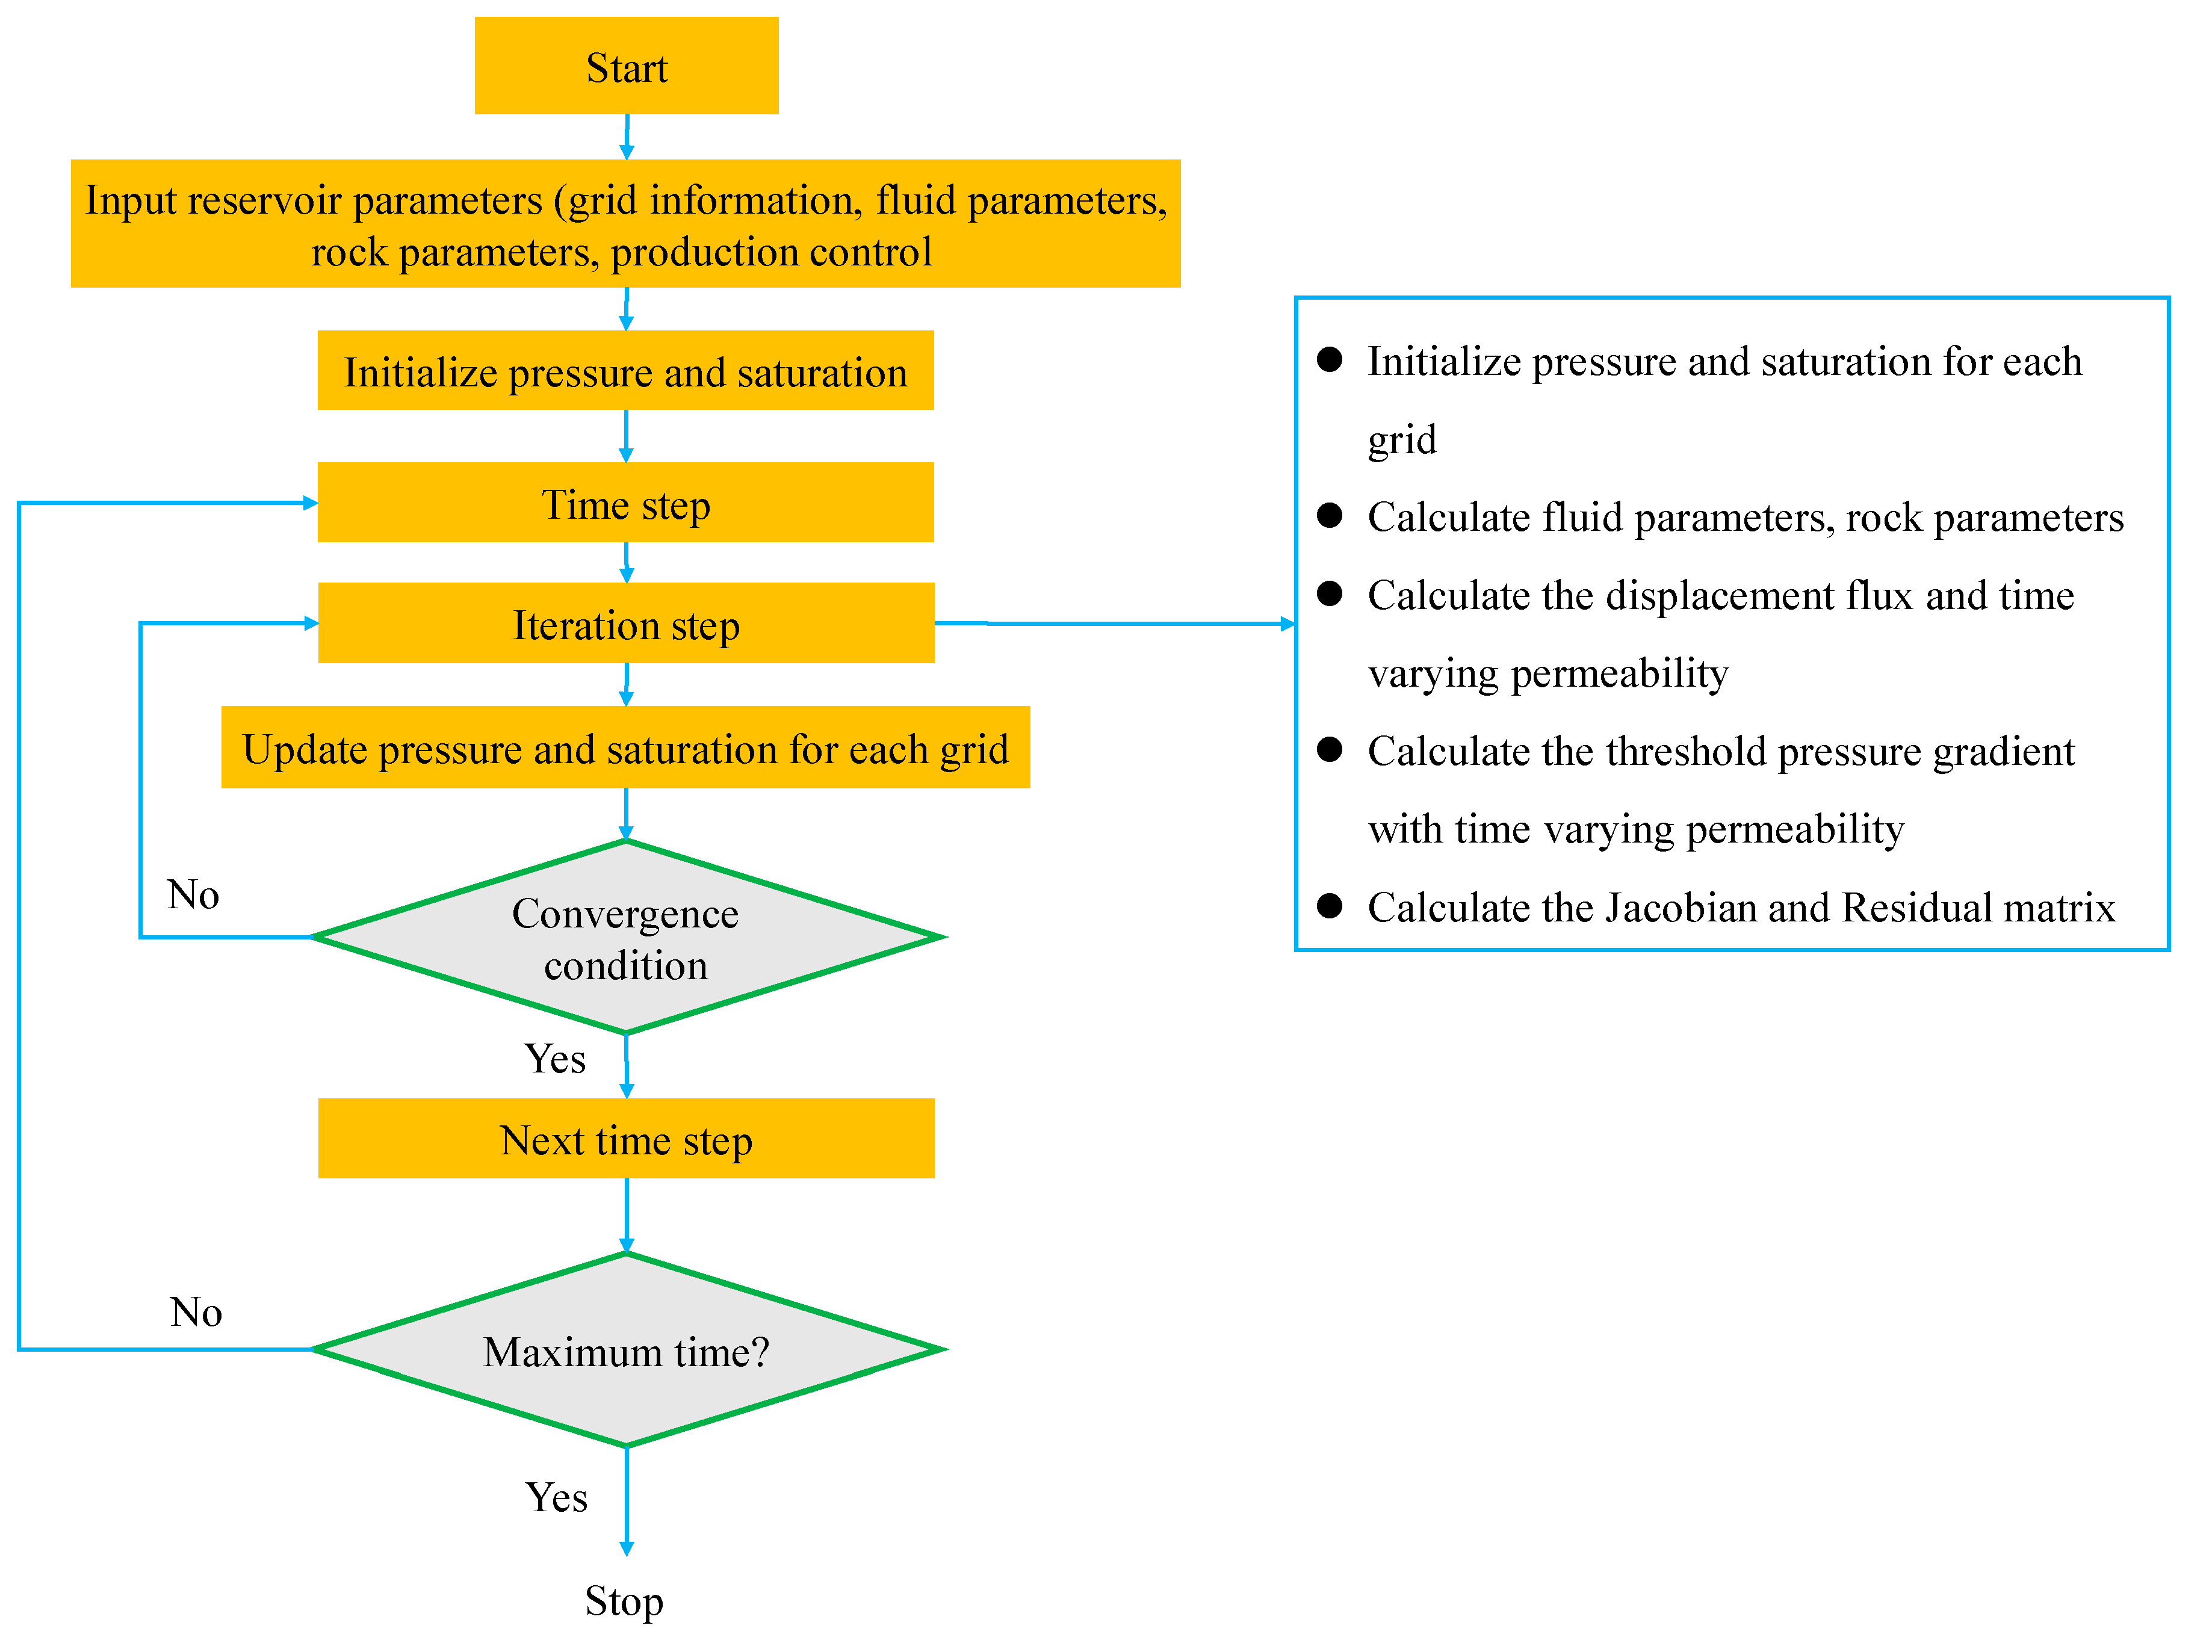
3.3. Simulator Development
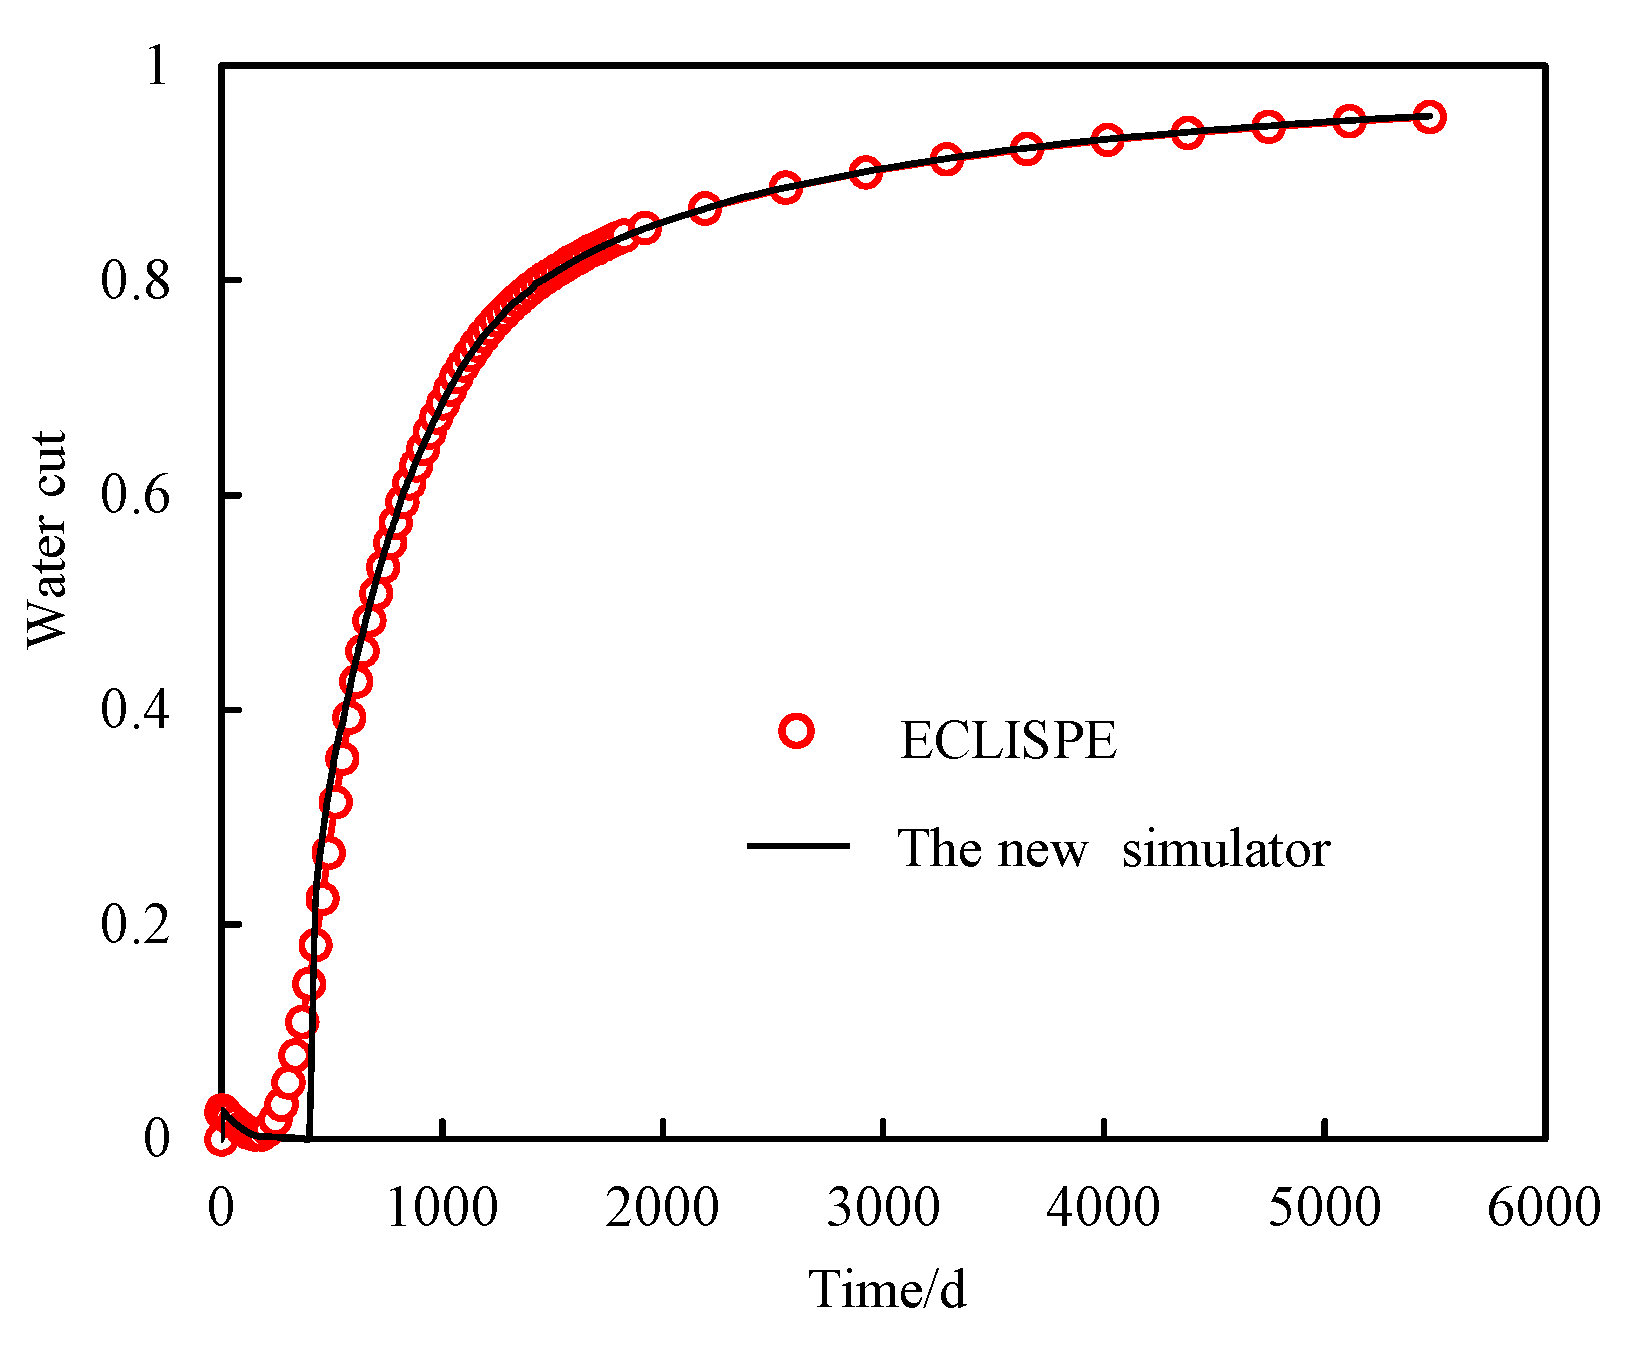
The solution procedure of the proposed model is similar to that of the traditional black oil model [35]. The full calculation process is shown in Figure 3, and the numerical simulator is compiled by using Fortran language. Compared to traditional black oil model, some improvement is made in the program considering the permeability time variation and non-Darcy flow effect. During each iteration, the displacement flux is computed for every grid, followed by recalculation of the time-varying permeability and grid transmissibility to accurately capture permeability evolution dynamics. Moreover, the water-flooding-dependent threshold pressure gradient is dynamically calculated based on the time-varying permeability to more accurately capture the non-Darcy flow characteristics. Through this integrated computational approach, an advanced simulator that effectively captures the coupled physics of time-dependent permeability variations and non-Darcy flow behavior is successfully developed, thereby providing a robust tool for heavy oil reservoir performance prediction.

3.4. Validation

As is well recognized, conventional commercial reservoir simulators typically fail to adequately account for these coupled mechanisms. To validate the accuracy of our newly developed simulator, we conducted comparative simulations against a standard black oil model. The verification employed a classical five-spot well pattern consisting of one central injector and four surrounding producers (see Table 1 for model parameters).
Figure 4 compares the water cut profiles simulated by both our proposed model and the commercial ECLIPSE 2018 simulator. The simulation results demonstrate excellent agreement between both models. It demonstrates the accuracy and reliability of the new proposed numerical simulator.

4. Sensitivity Analysis and Field Application

4.1. Sensitivity Analysis

In this section, the influence of non-Darcy flow and permeability time variation on the production performance and the reservoir fluid dynamics during water flooding development is analyzed in detail based on the Egg model. The Egg model [36] serves as a widely recognized synthetic benchmark, featuring a two-phase (oil–water) system with an oil viscosity of 300 mPa·s. This small-scale model comprises 18,553 effective grids and a total of four production wells and eight injection wells. The distribution of permeability and well locations in the model are shown in Figure 5, with high permeability regions resembling channel-like distributions. The production wells are produced with a constant liquid rate of 159 m3/day, and the injection wells are set at 79.5 m3/d to maintain injection–production balance.
Using the Egg model as a benchmark, four comparative simulation cases are established, as shown in Table 2: (a) traditional black oil case, neglecting both permeability time variation and threshold pressure gradient effects; (b) the incorporation of time-varying permeability only; (c) considering threshold pressure gradient effect only; and (d) fully coupled simulation, integrating both time-varying permeability and threshold pressure gradient mechanisms.
Table 3 presents the final oil recovery for all four simulation cases. The water cut and oil recovery curves are displayed in Figure 6, Figure 7, Figure 8, Figure 9, Figure 10 and Figure 11 demonstrate the dynamic reservoir responses, including distributions of oil saturation, displacement flux, time-varying permeability, and threshold pressure gradient at three characteristic time points of 210, 2310, and 3600 days. With these results, the influence of non-Darcy flow and permeability time variation is systematically analyzed.
(1)
The influence of time-varying permeability
A comparative analysis of cases (a) and (b) reveals that permeability time variation reduces ultimate oil recovery by approximately 11.4% (from 0.35 to 0.31). Figure 6 and Figure 7 demonstrate that this effect becomes particularly pronounced during the late-stage flooding period, characterized by accelerated water cut rise and diminished recovery rates. This behavior stems from permeability enhancement in high-flux regions due to prolonged water flux, which exacerbates reservoir heterogeneity and reduces volumetric sweep efficiency. As evidenced by the saturation and permeability distributions in Figure 8 and Figure 9, the simulated permeability increase in preferential flow paths correlates with more remaining oil in low-flux zones, indicating poorer displacement efficiency.
(2)
The influence of threshold pressure gradient
A comparative analysis of models (a) and (c) reveals that the incorporation of threshold pressure gradient reduces oil recovery from 0.35 to 0.33, while significantly increasing residual oil saturation in low-permeability regions. This phenomenon primarily occurs because oil flow must overcome the threshold pressure gradient, thereby reducing flow capacity over time. Furthermore, a larger threshold pressure gradient is reached in low-permeability zones, exacerbating the flow heterogeneity that significantly decrease sweep efficiency, as clearly demonstrated by the displacement flux distribution patterns in Figure 10. Consequently, this results in decreased oil production rates and accelerated water breakthrough. Notably, the threshold pressure gradient impacts water cut rise at an earlier stage compared to time-varying permeability effects.
(3)
The comprehensive influence of permeability time variation and threshold pressure gradient
Table 3 and Figure 6 demonstrate that the combined effects of permeability time variation and threshold pressure gradient lead to the lowest oil recovery rates and the highest water cut. A comparative analysis of oil saturation and displacement flux distributions across all models reveals that model (d) exhibits the most limited sweep efficiency. The threshold pressure gradient and time-varying permeability jointly impact production performance. When the production begins, the threshold pressure gradient creates additional flow resistance and reduces sweep efficiency. The enhanced water flux intensity in the mainstream region with high permeability is observed. Then, the permeability of the mainstream region would increase markedly with the consideration of permeability time variation. Correspondingly, the threshold pressure gradient in mainstream regions diminishes progressively due to permeability enhancement, as shown in Figure 11. This phenomenon further amplifies flow heterogeneity. Consequently, the coupled effects of threshold pressure gradient and time-varying permeability result in minimal sweep volume and oil recovery.

4.2. Field Application

Oilfield A is a typical offshore heavy oil reservoir, characterized by an average crude oil viscosity of 100 mPa.s and an average permeability of 1000 mD. The block has been under water flooding development for 15 years. History matching was performed using both the industry-standard ECLIPSE simulator and the newly developed simulator. Figure 12 demonstrates that the ECLIPSE-simulated water cut is much lower than the historical data. And the history matching accuracy is greatly improved with comprehensive consideration of the non-Darcy flow and time-varying permeability mechanisms. Based on simulation results from the newly developed simulator, a horizontal well was optimally deployed to enhance recovery in the target zone. Figure 13 presents the daily oil production of the new well, achieving a cumulative production of 4.53 × 10⁴ m3, which further validates the field applicability of our novel simulator for heavy oil reservoir development.

5. Conclusions

The non-Darcy flow behavior and permeability variation occurred in long-term water flooding heavy oil reservoir. In this study, a novel numerical simulation approach that concurrently accounts for permeability time variation and non-Darcy flow effects is developed and validated. The model can be used for history matching and production prediction of water flooding of heavy oil reservoirs, and the following conclusions are drawn:
(1)
The novel oil–water two-phase numerical simulator simultaneously accounts for time-varying permeability and the water-flooding-dependent threshold pressure gradient based on the traditional black oil model. The water-flooding-dependent threshold pressure gradient is first proposed by integrating permeability time variation. The new simulator can achieve a more reasonable and accurate numerical simulation.
(2)
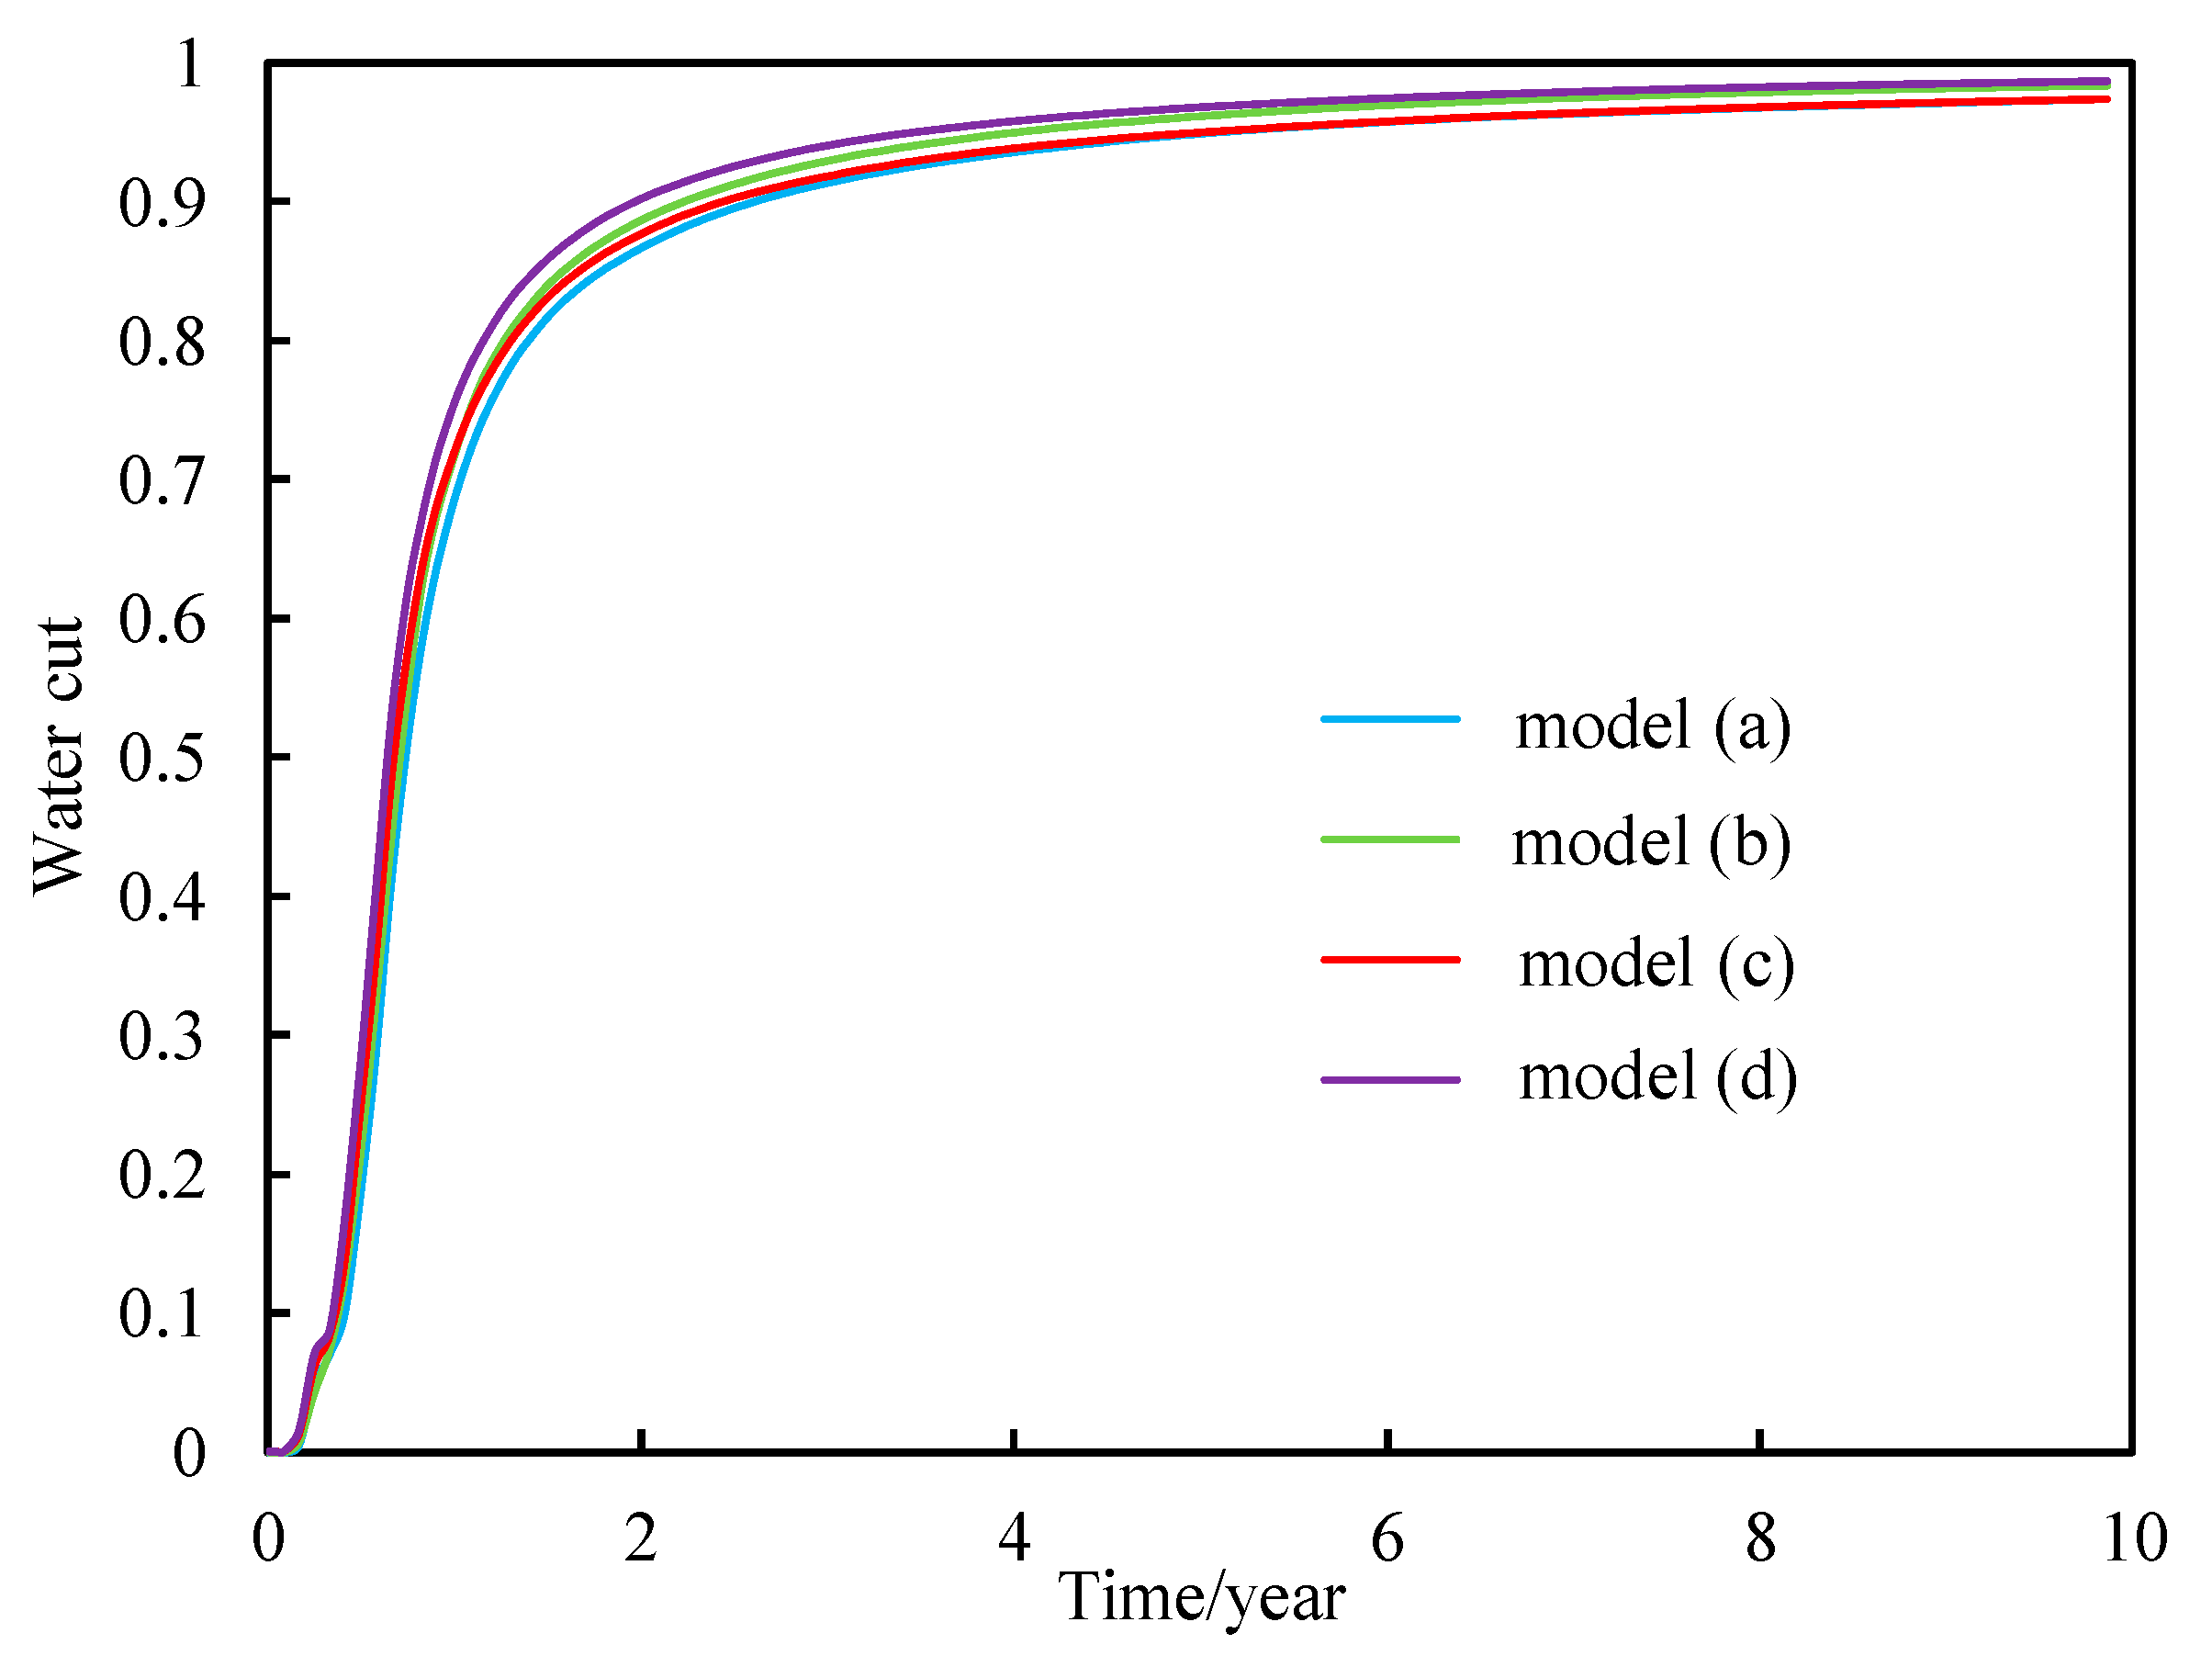
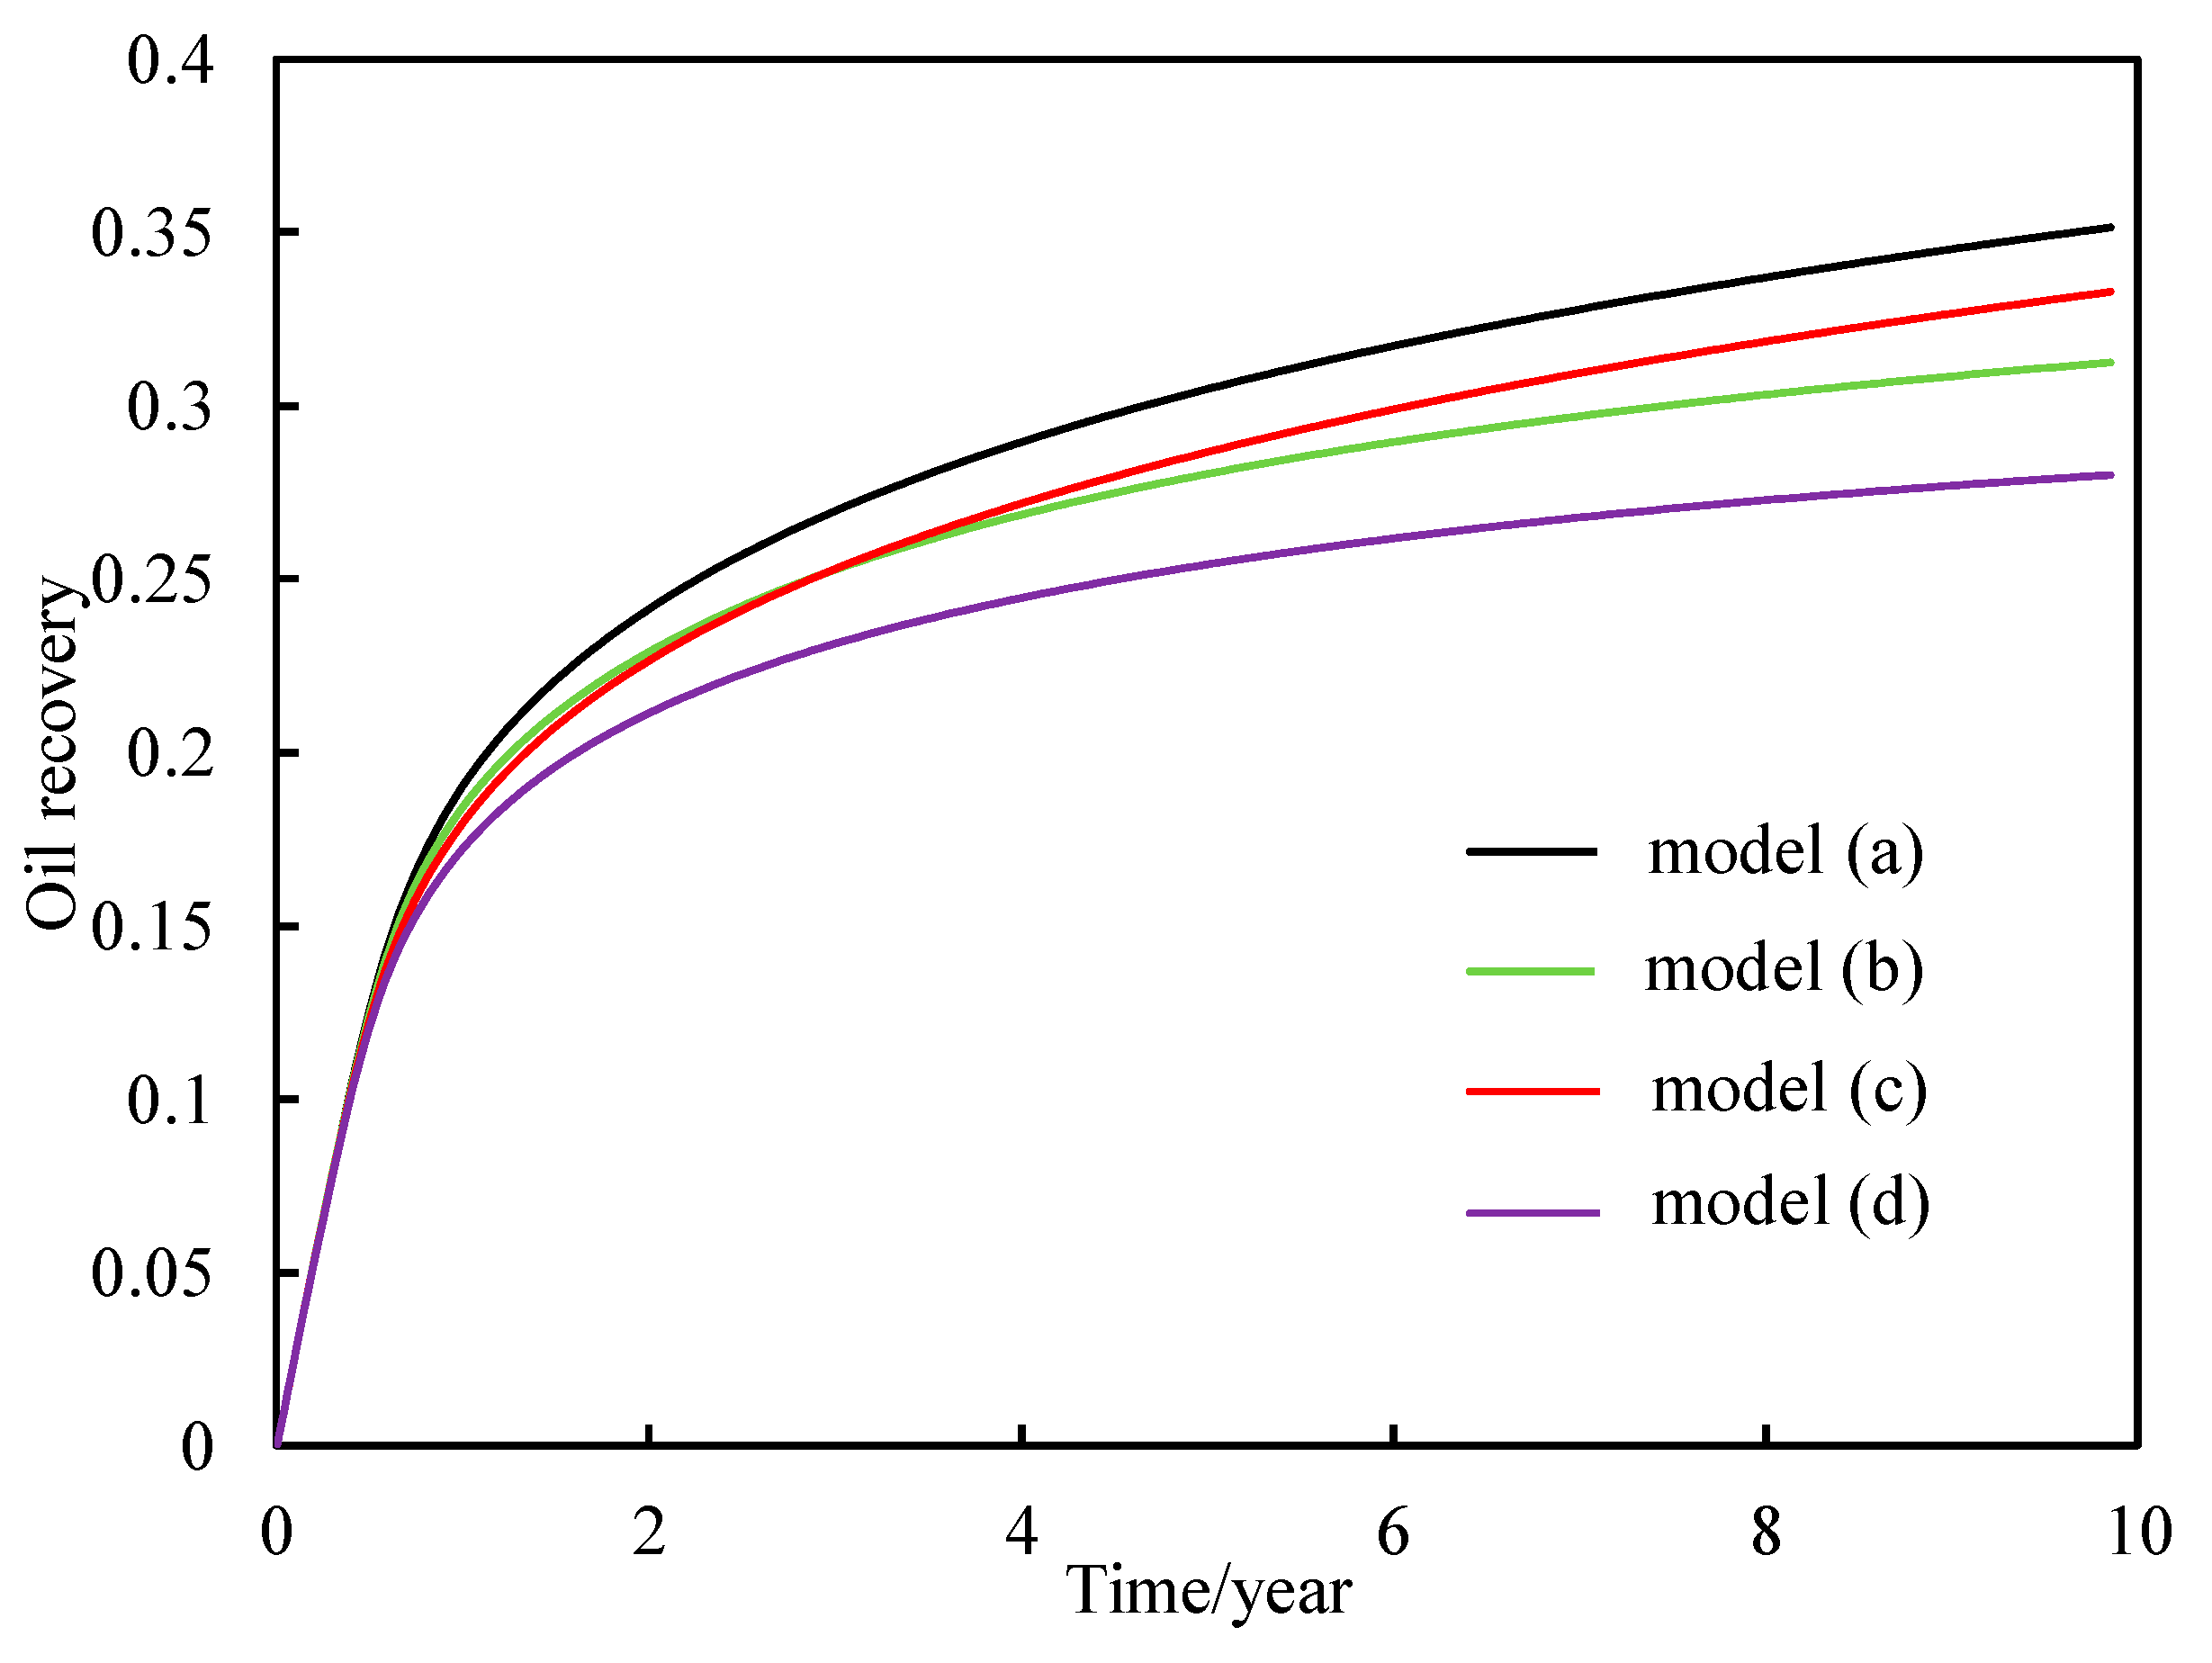
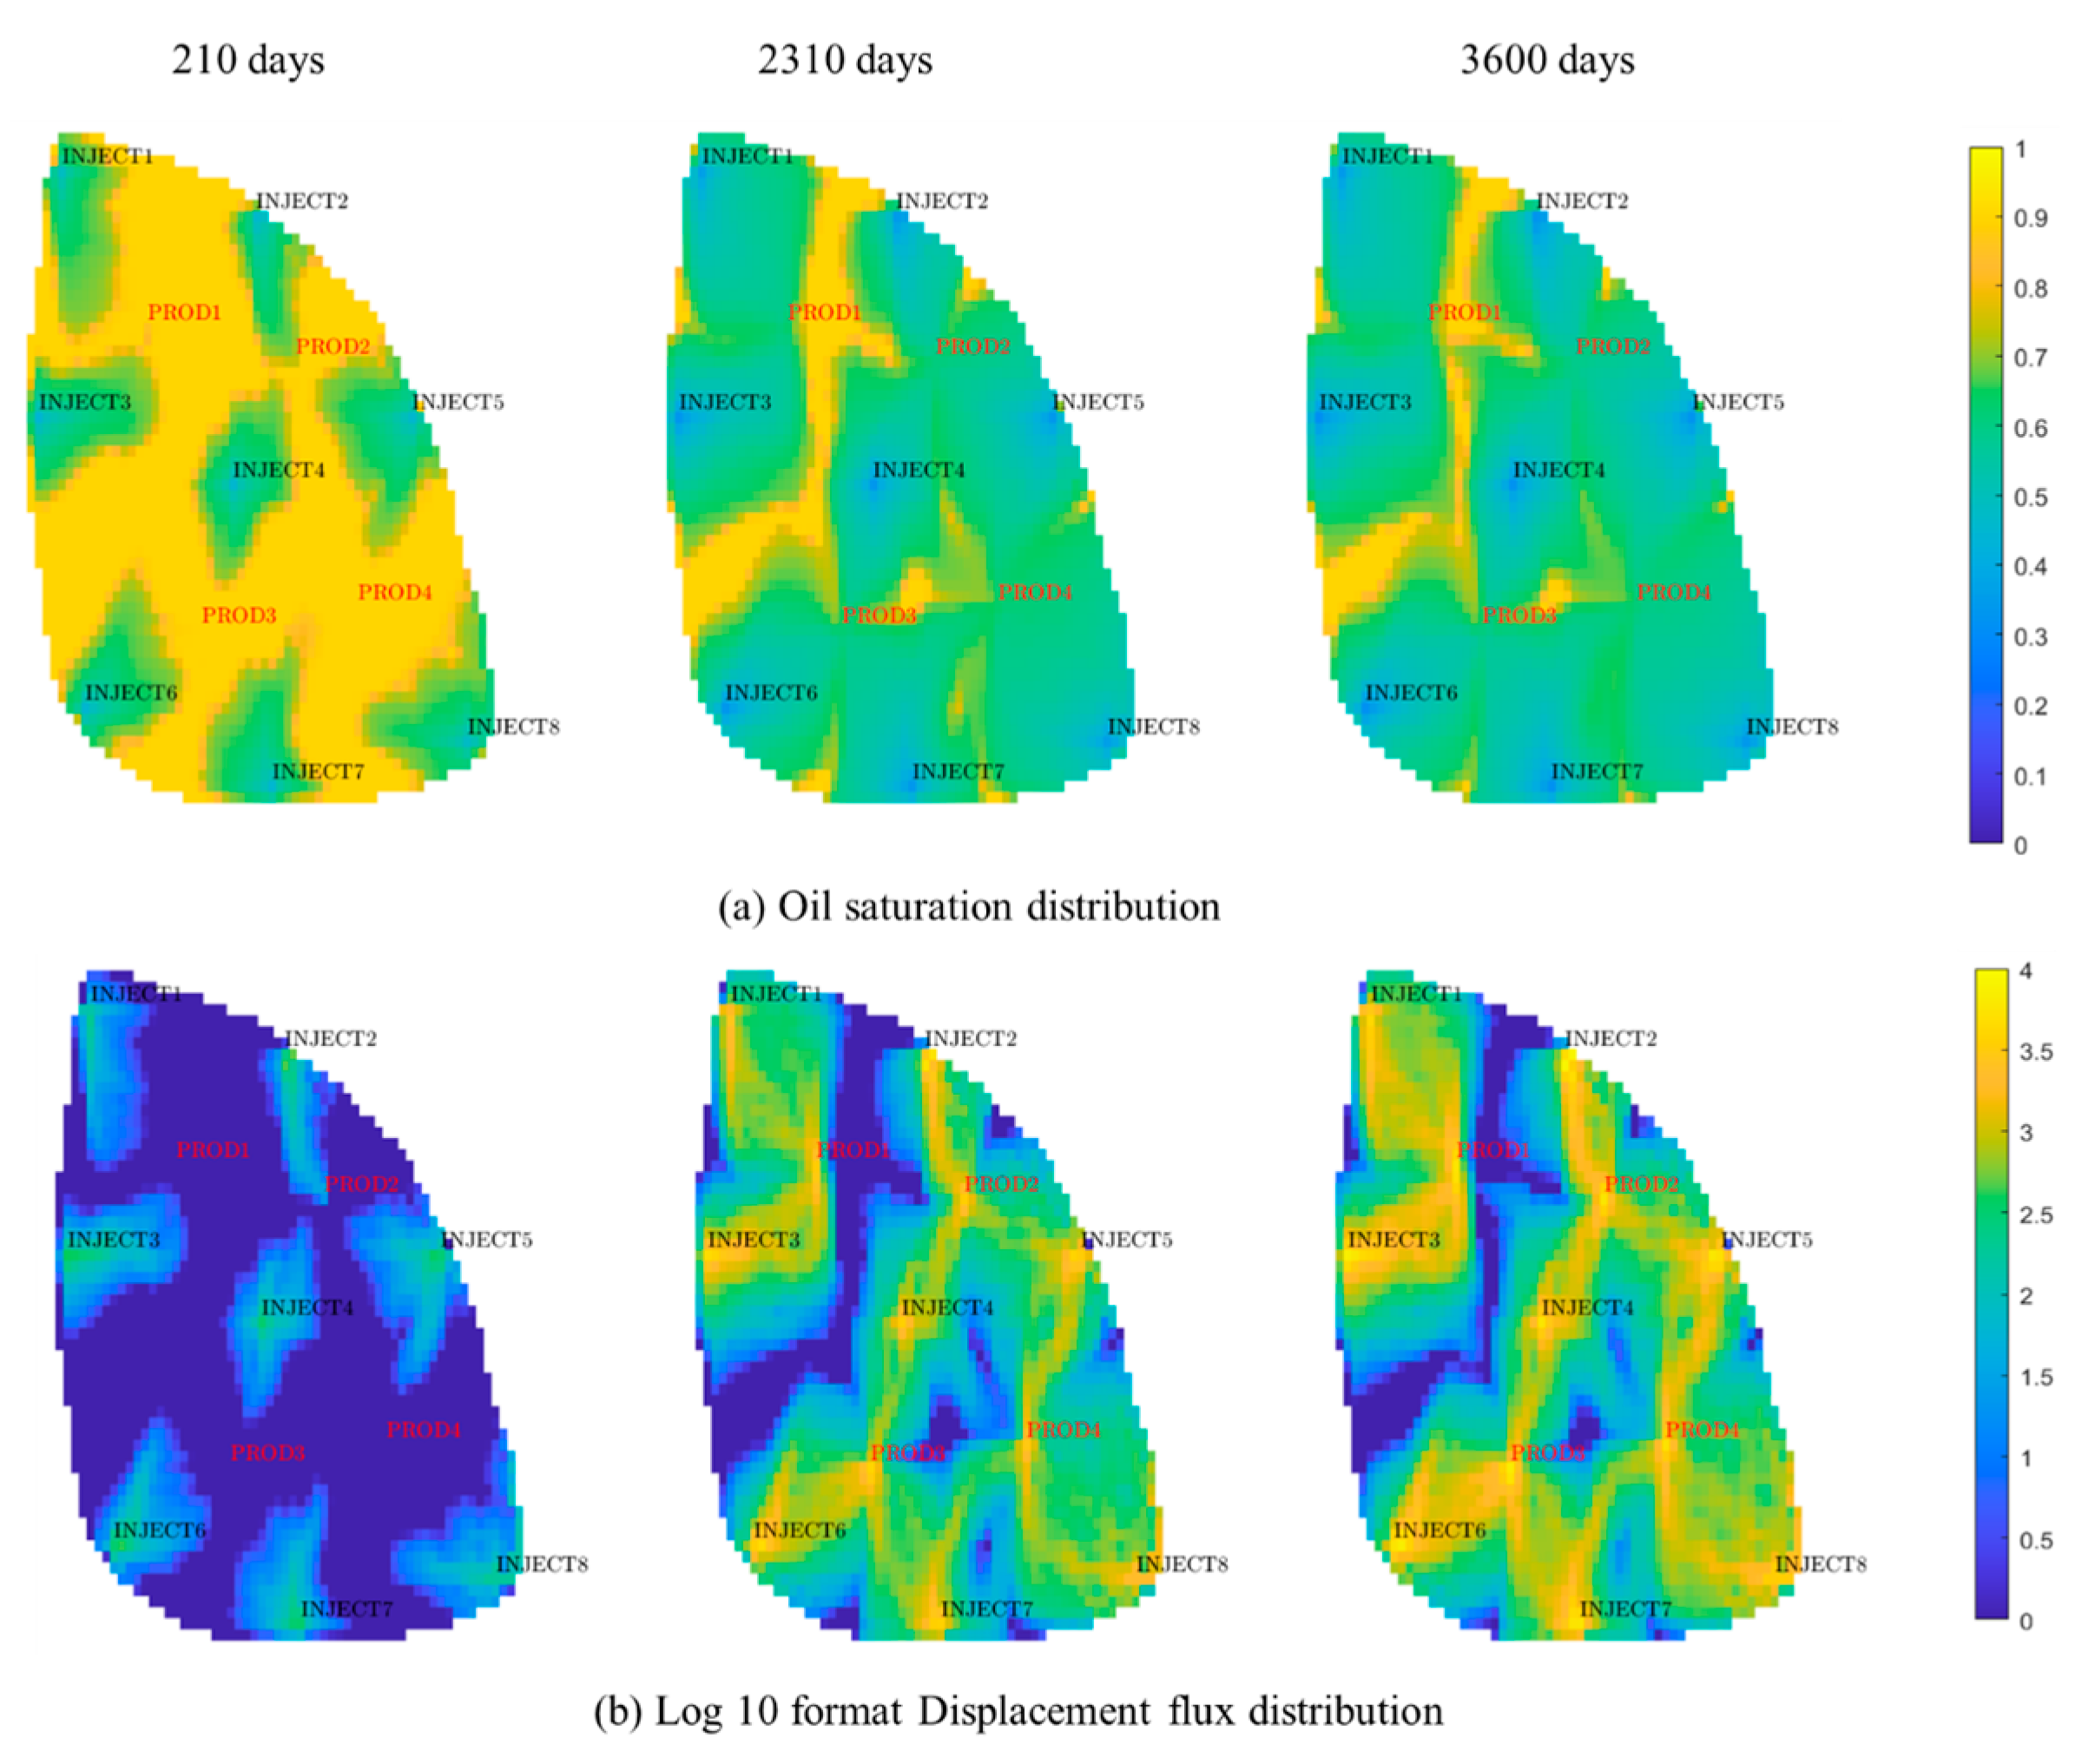
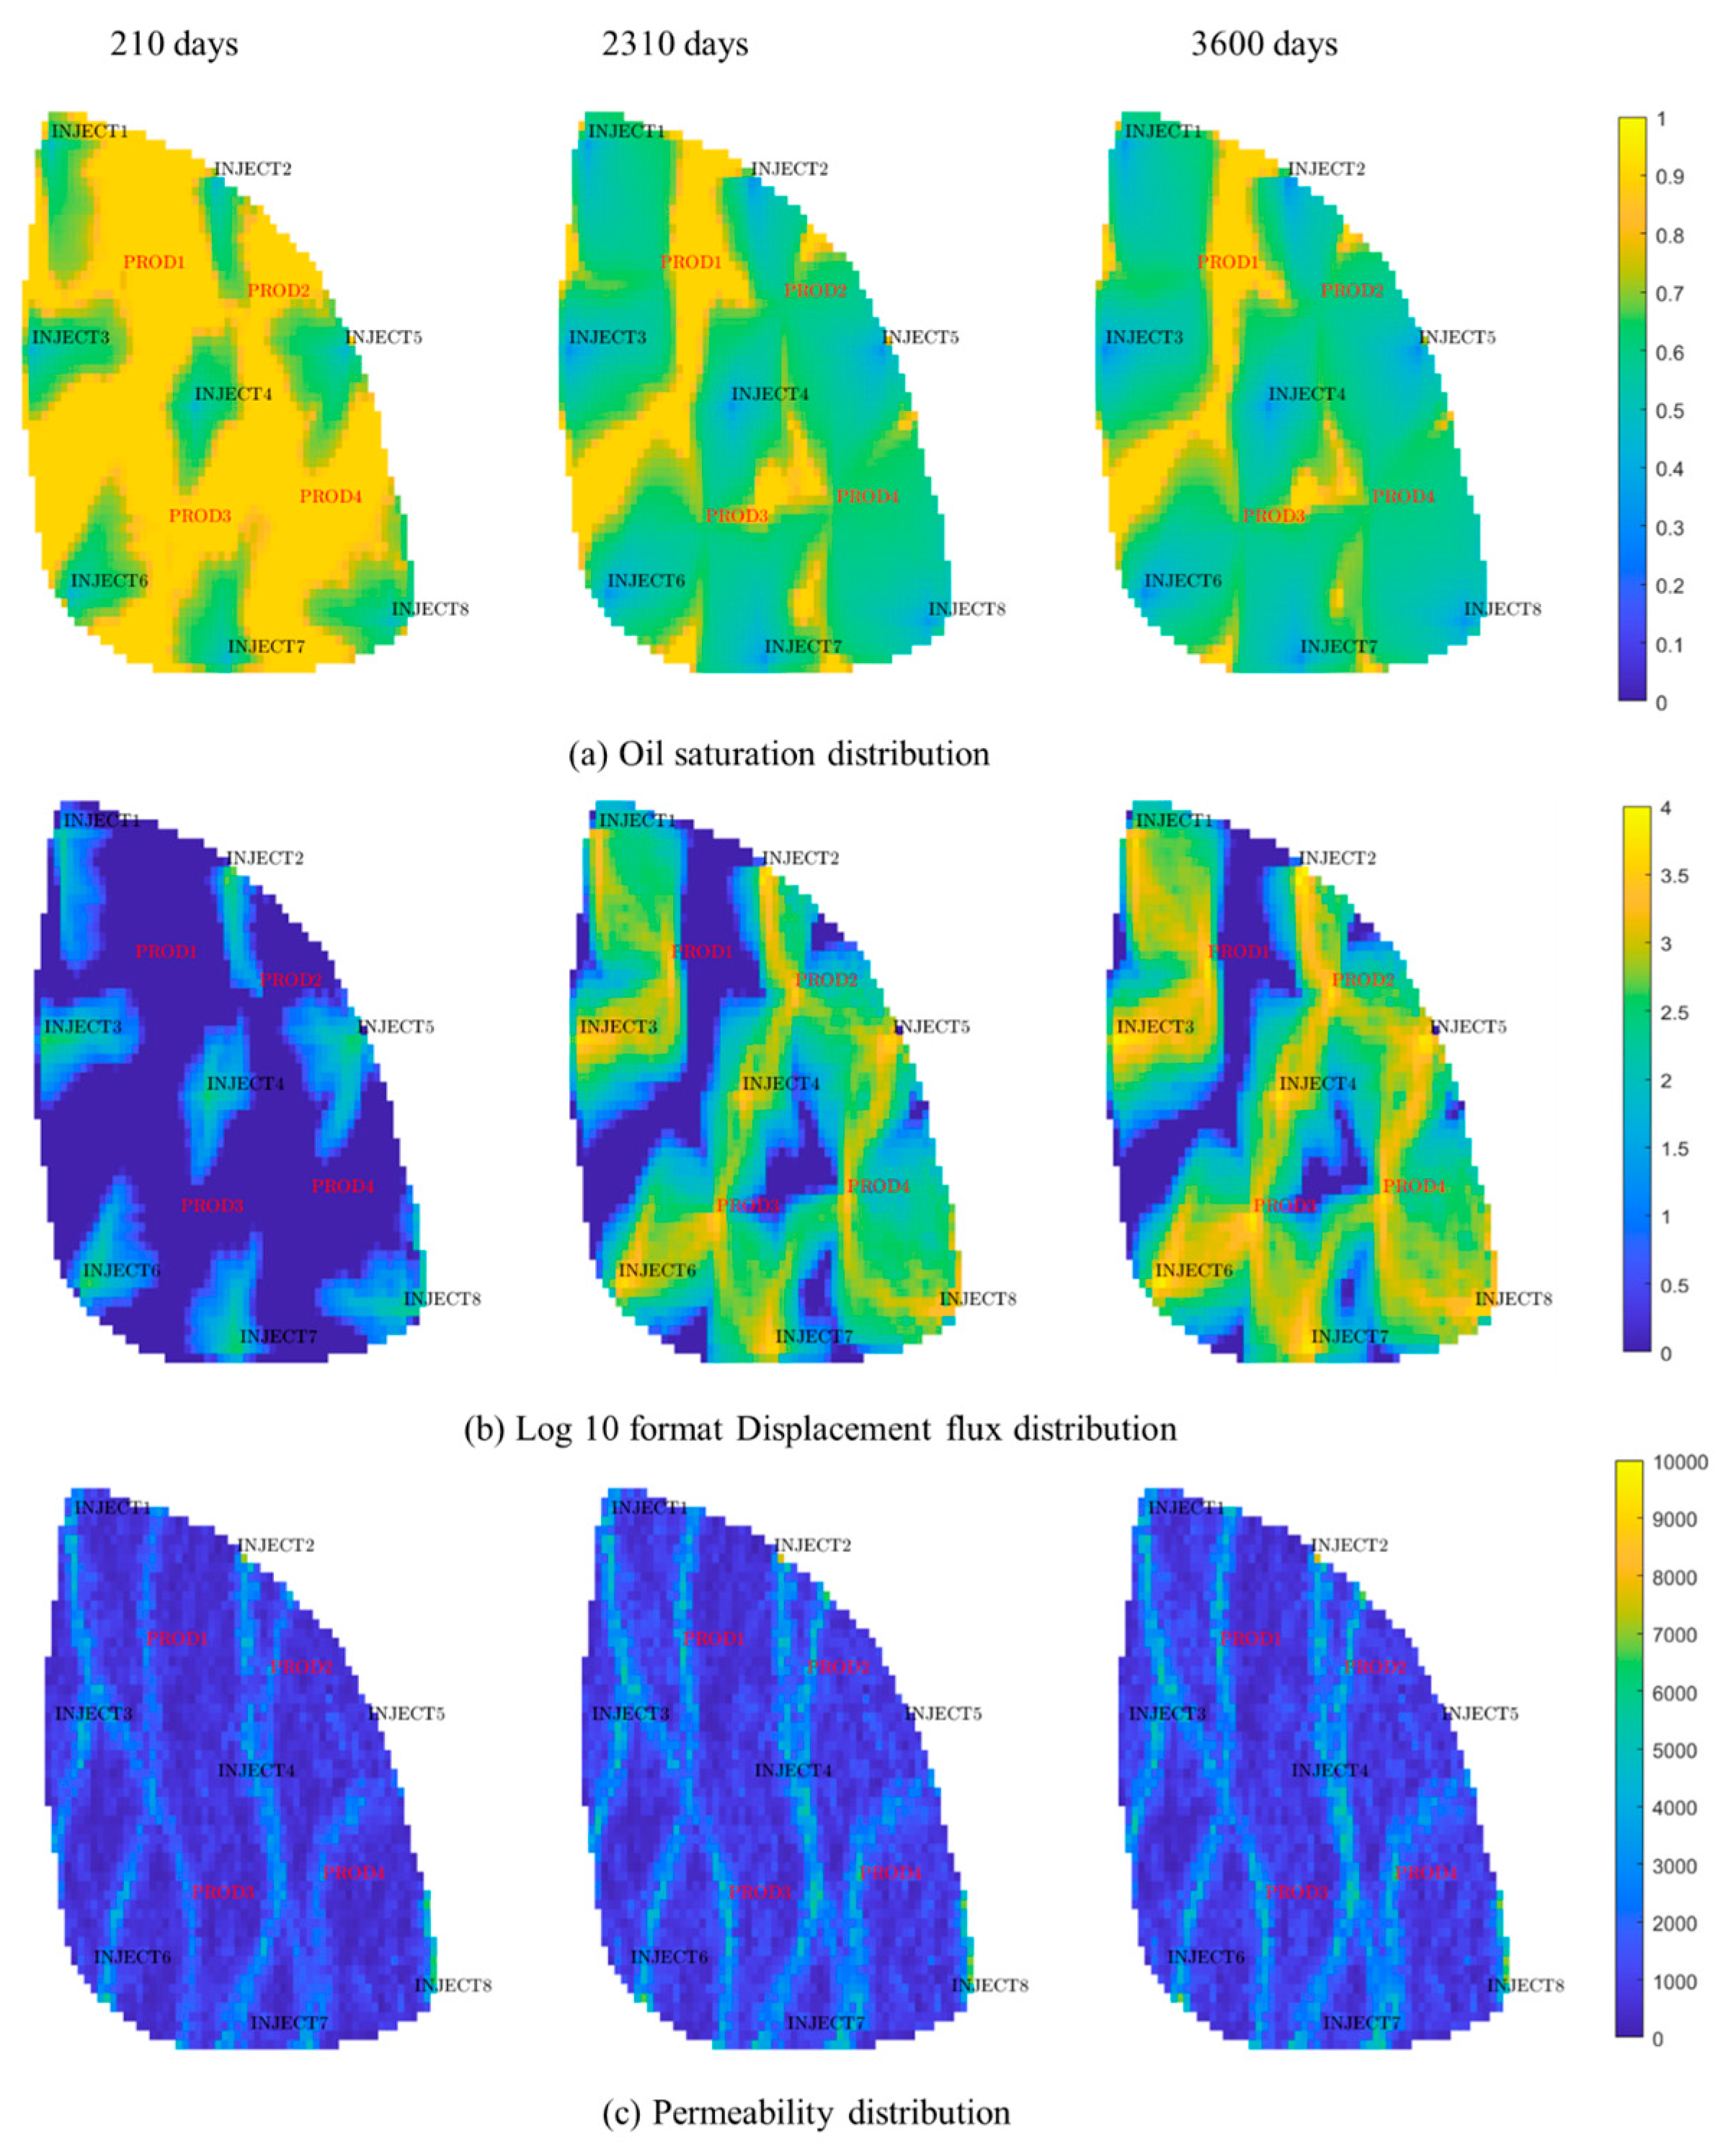
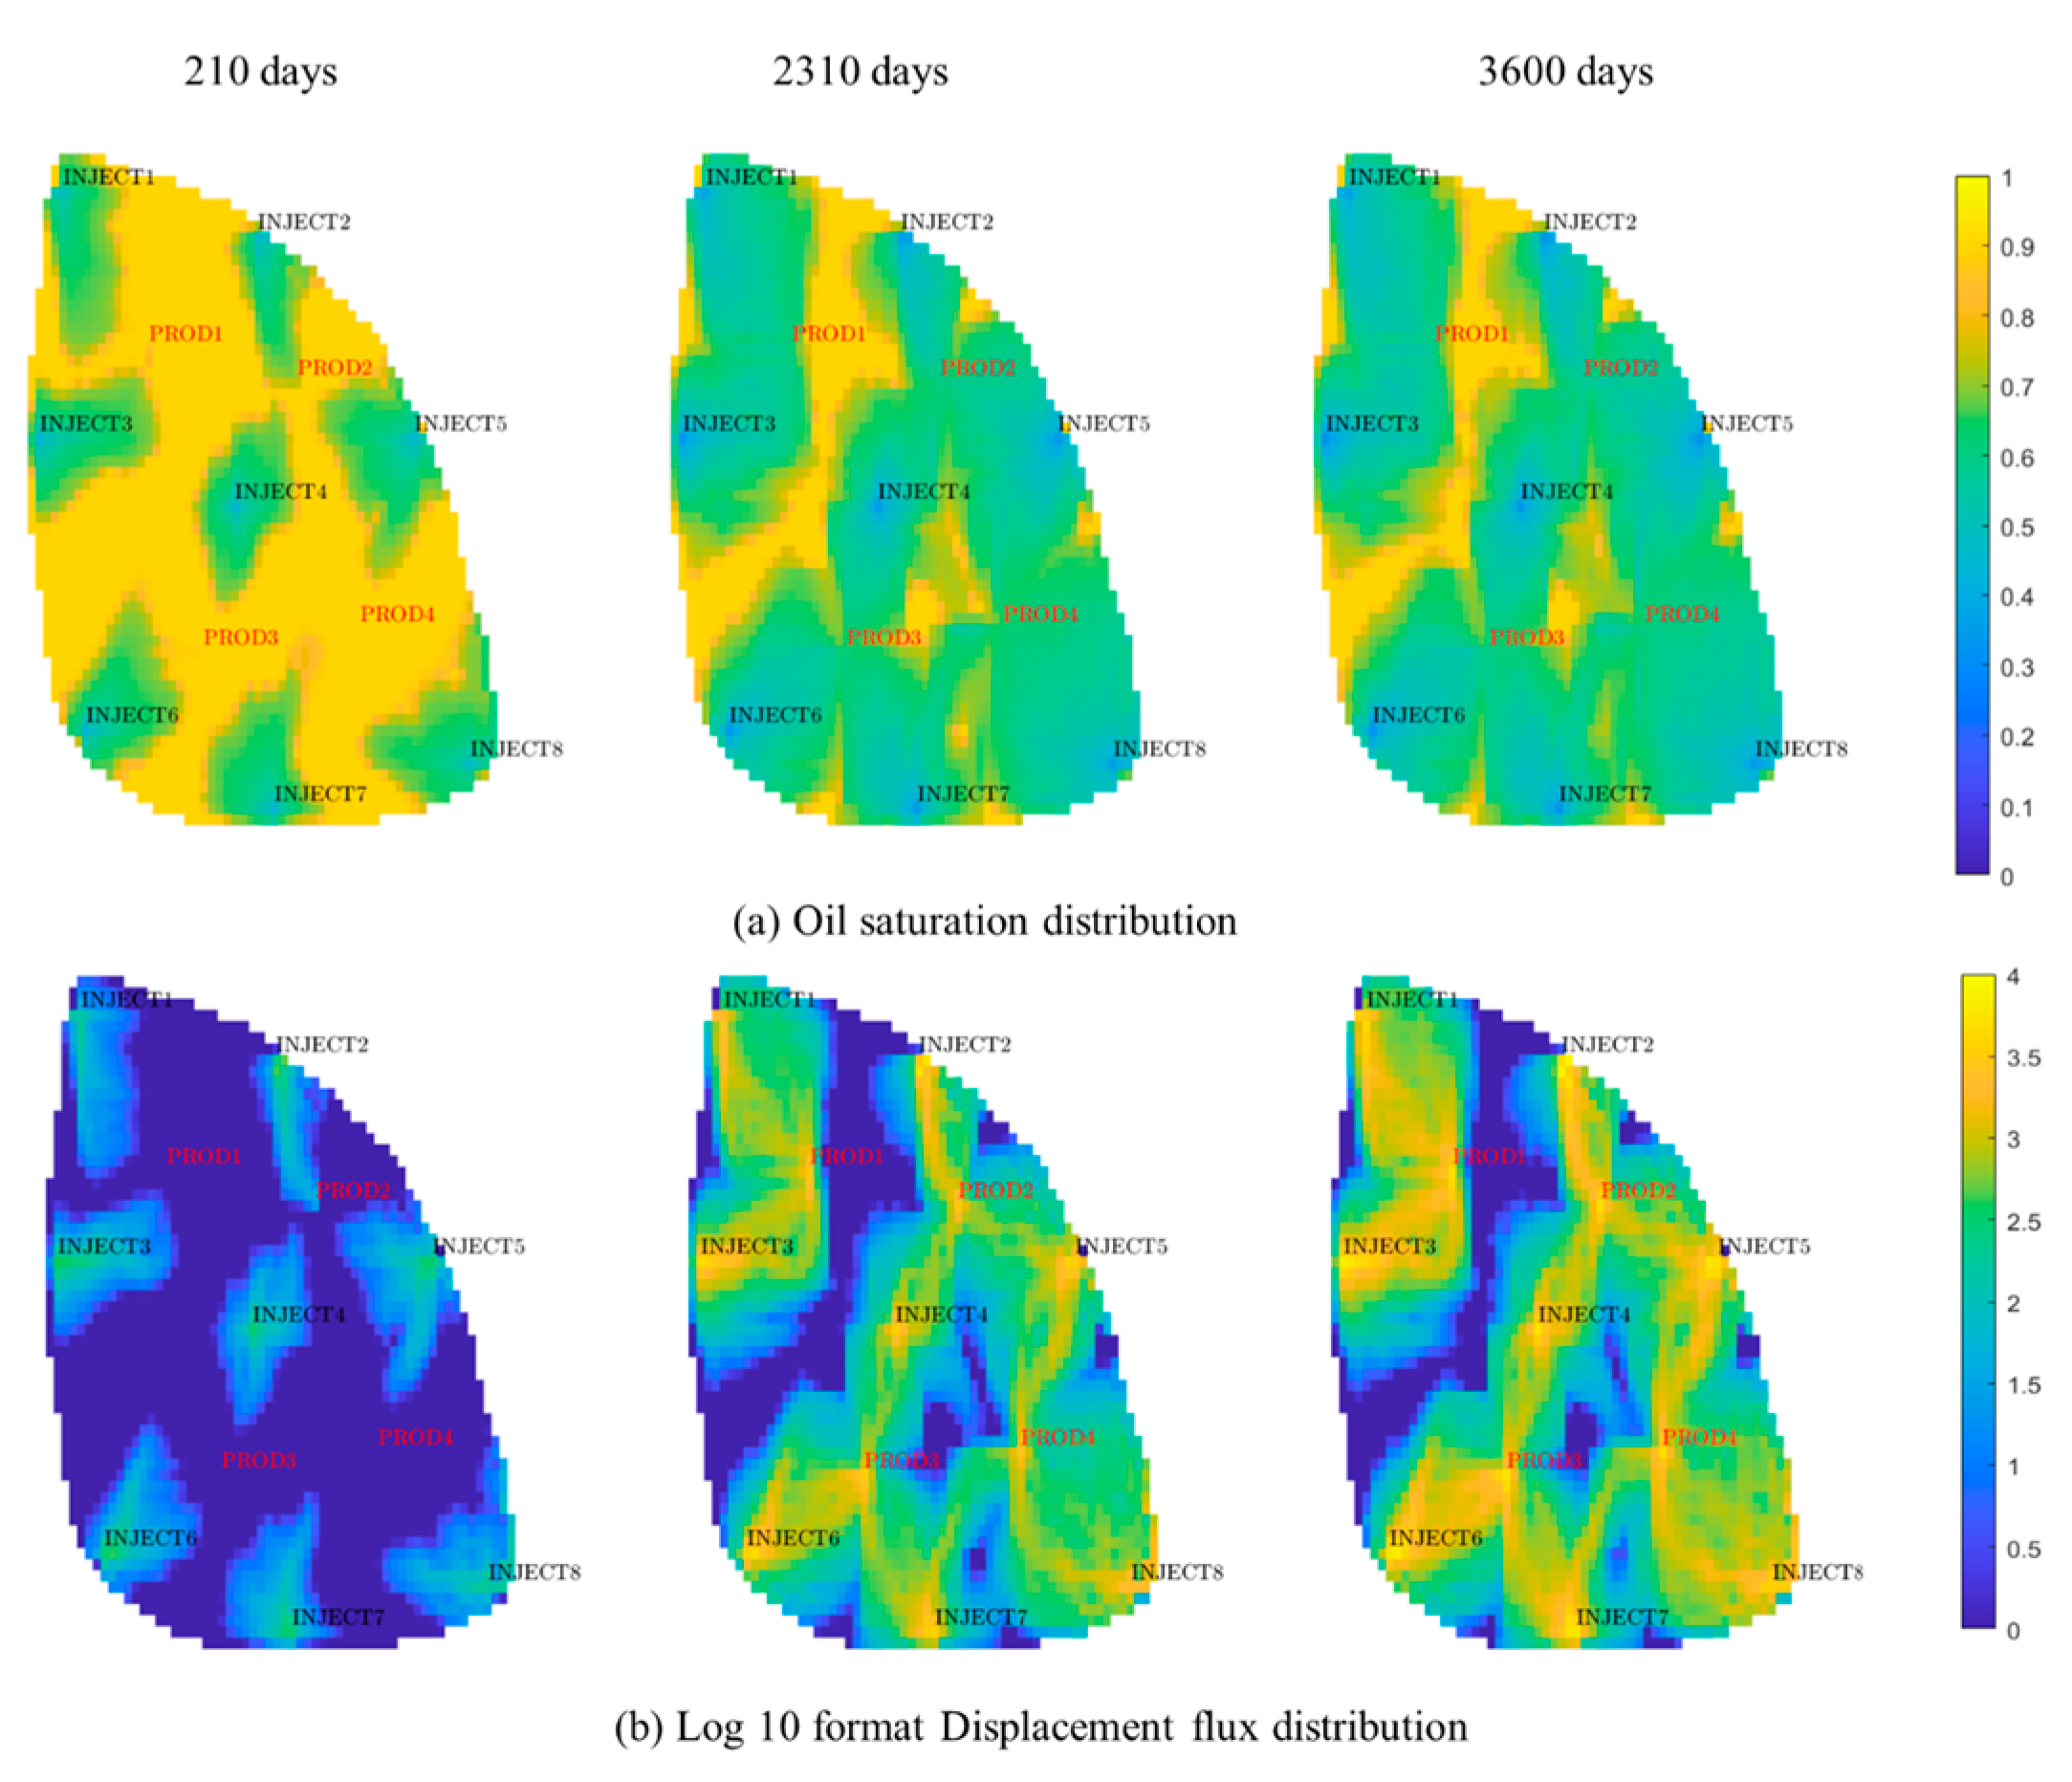
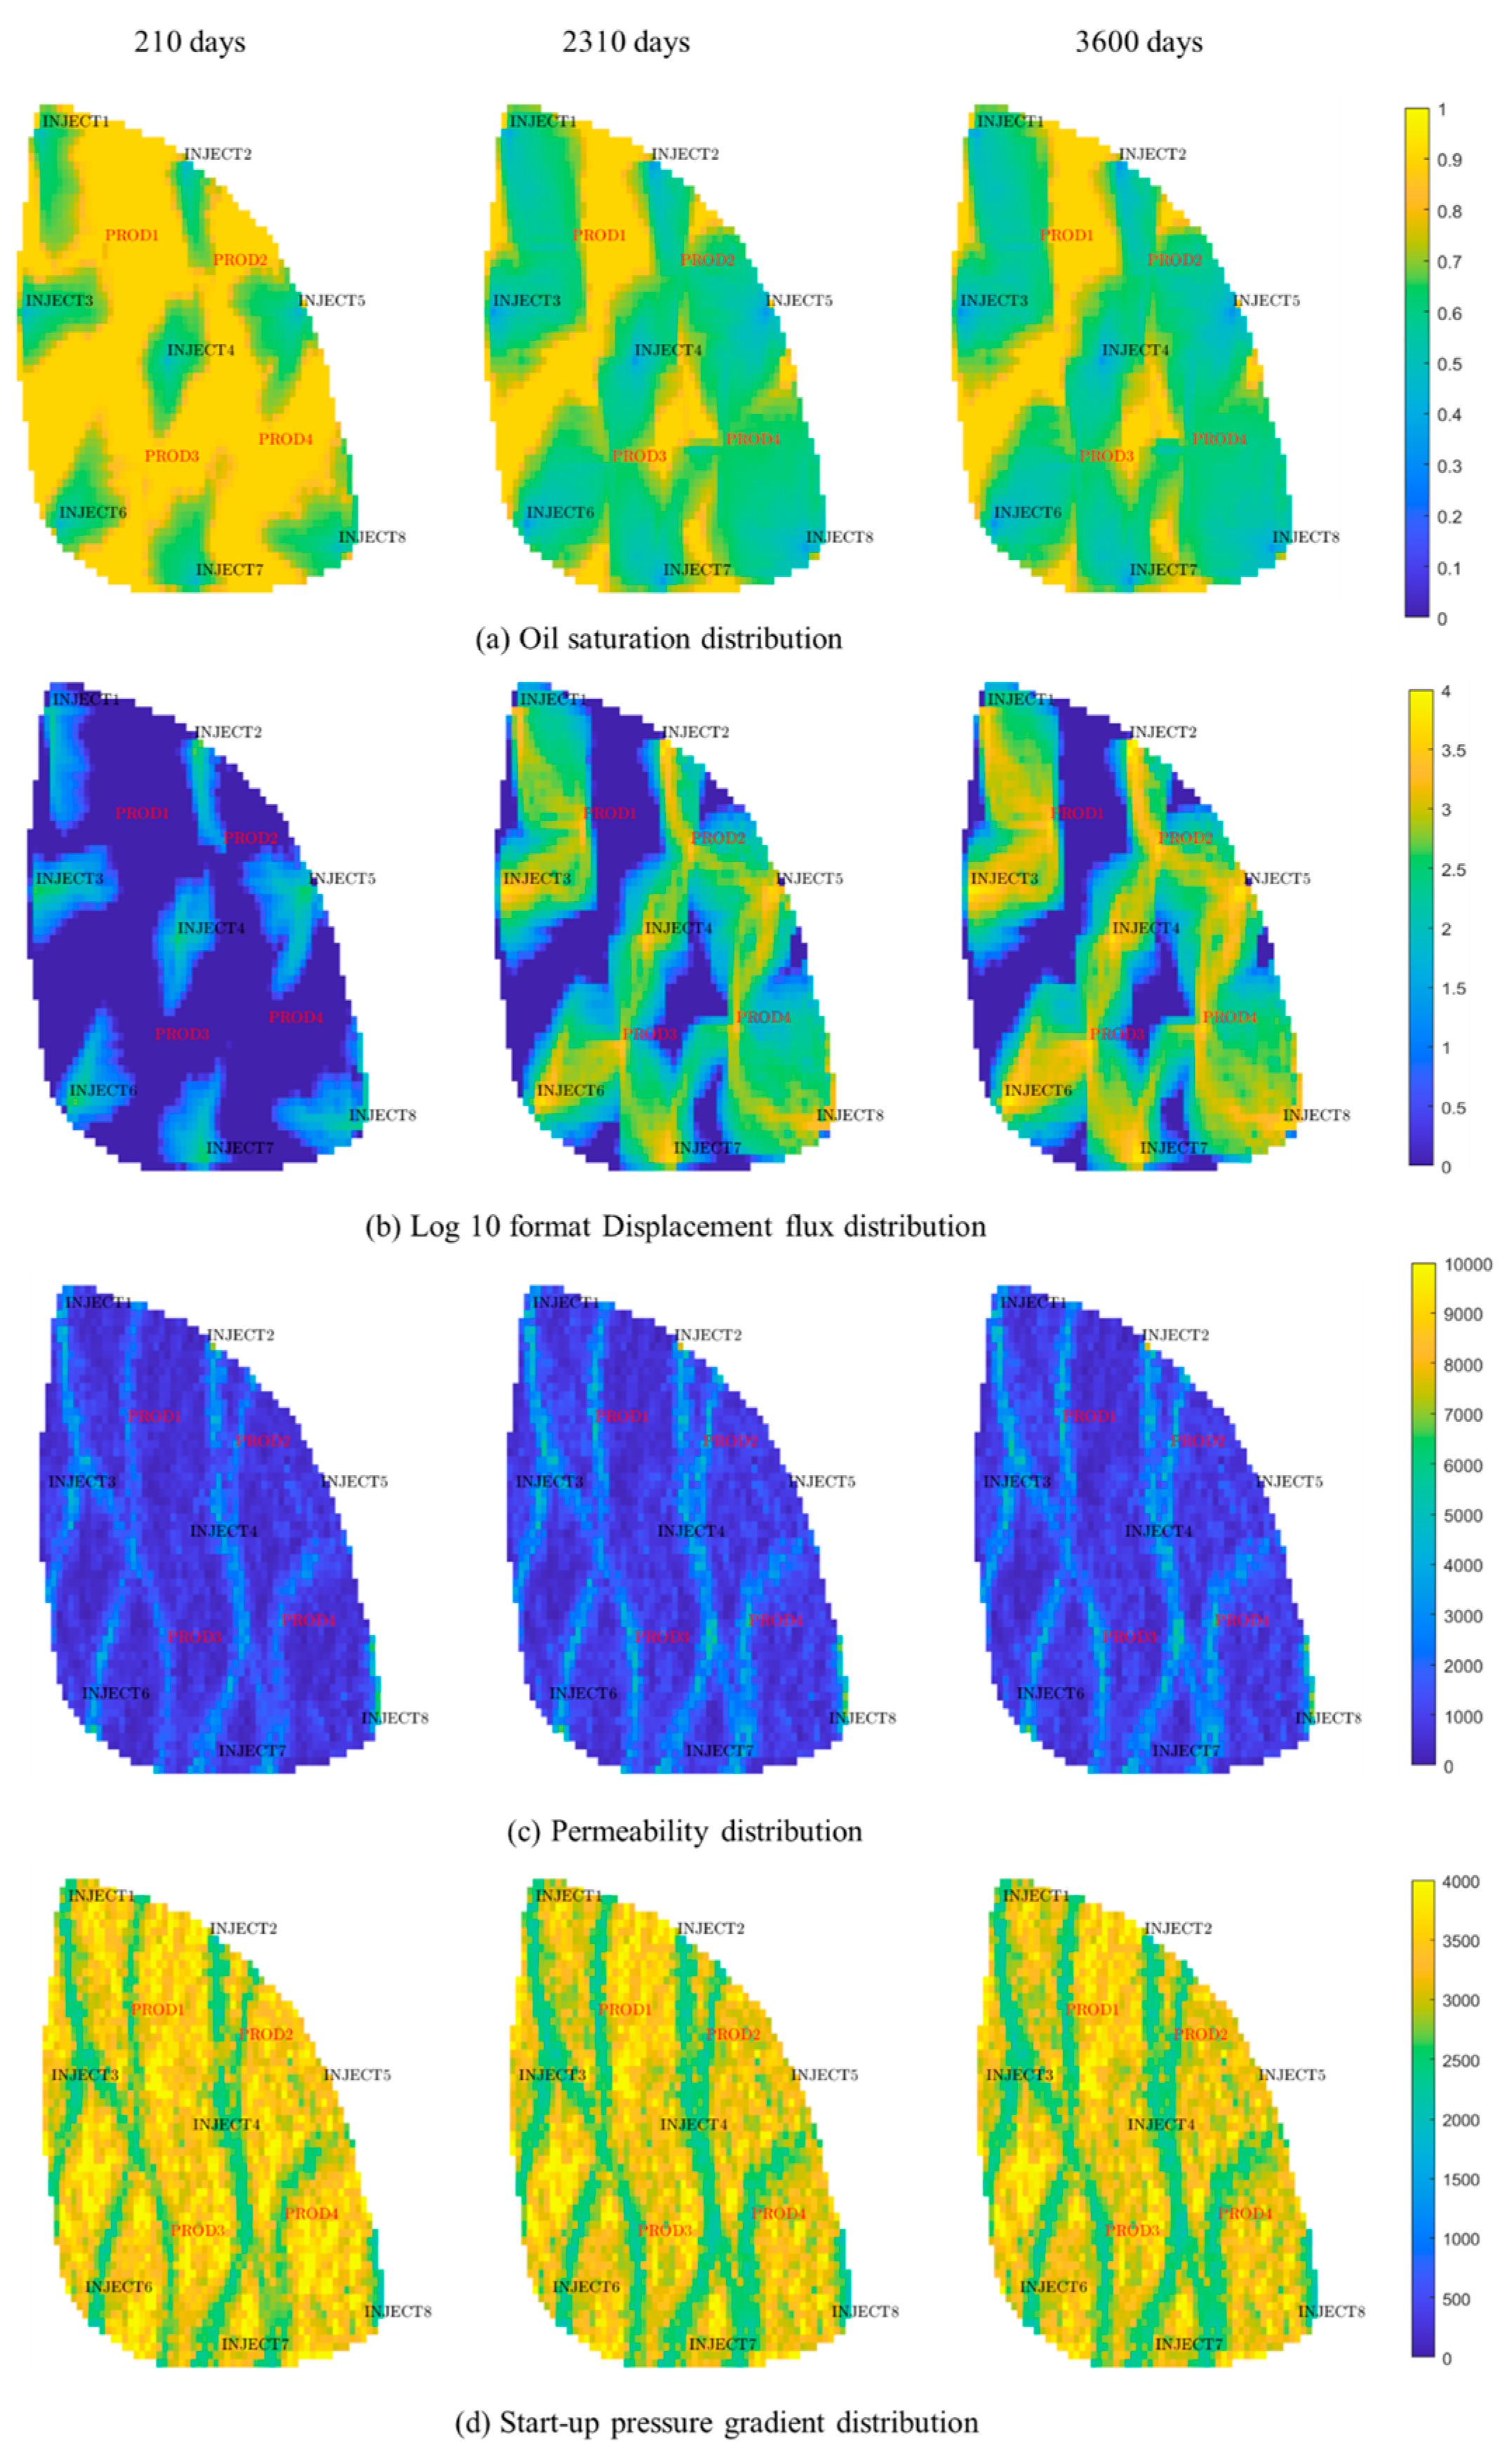
The complex flow mechanisms significantly influence production performance. The synergistic consideration of time-varying permeability and threshold pressure gradient results in the lowest oil recovery. The presence of the threshold pressure gradient imposes additional resistance to oil flow and reduces the sweep region since production. Consequently, the permeability of the mainstream region increases markedly, and the threshold pressure gradient decreases during production with more significant flux. This phenomenon further amplifies flow heterogeneity and reduces oil recovery. Without considering the complex flow mechanisms, the simulation results can lead to large errors.
(3)
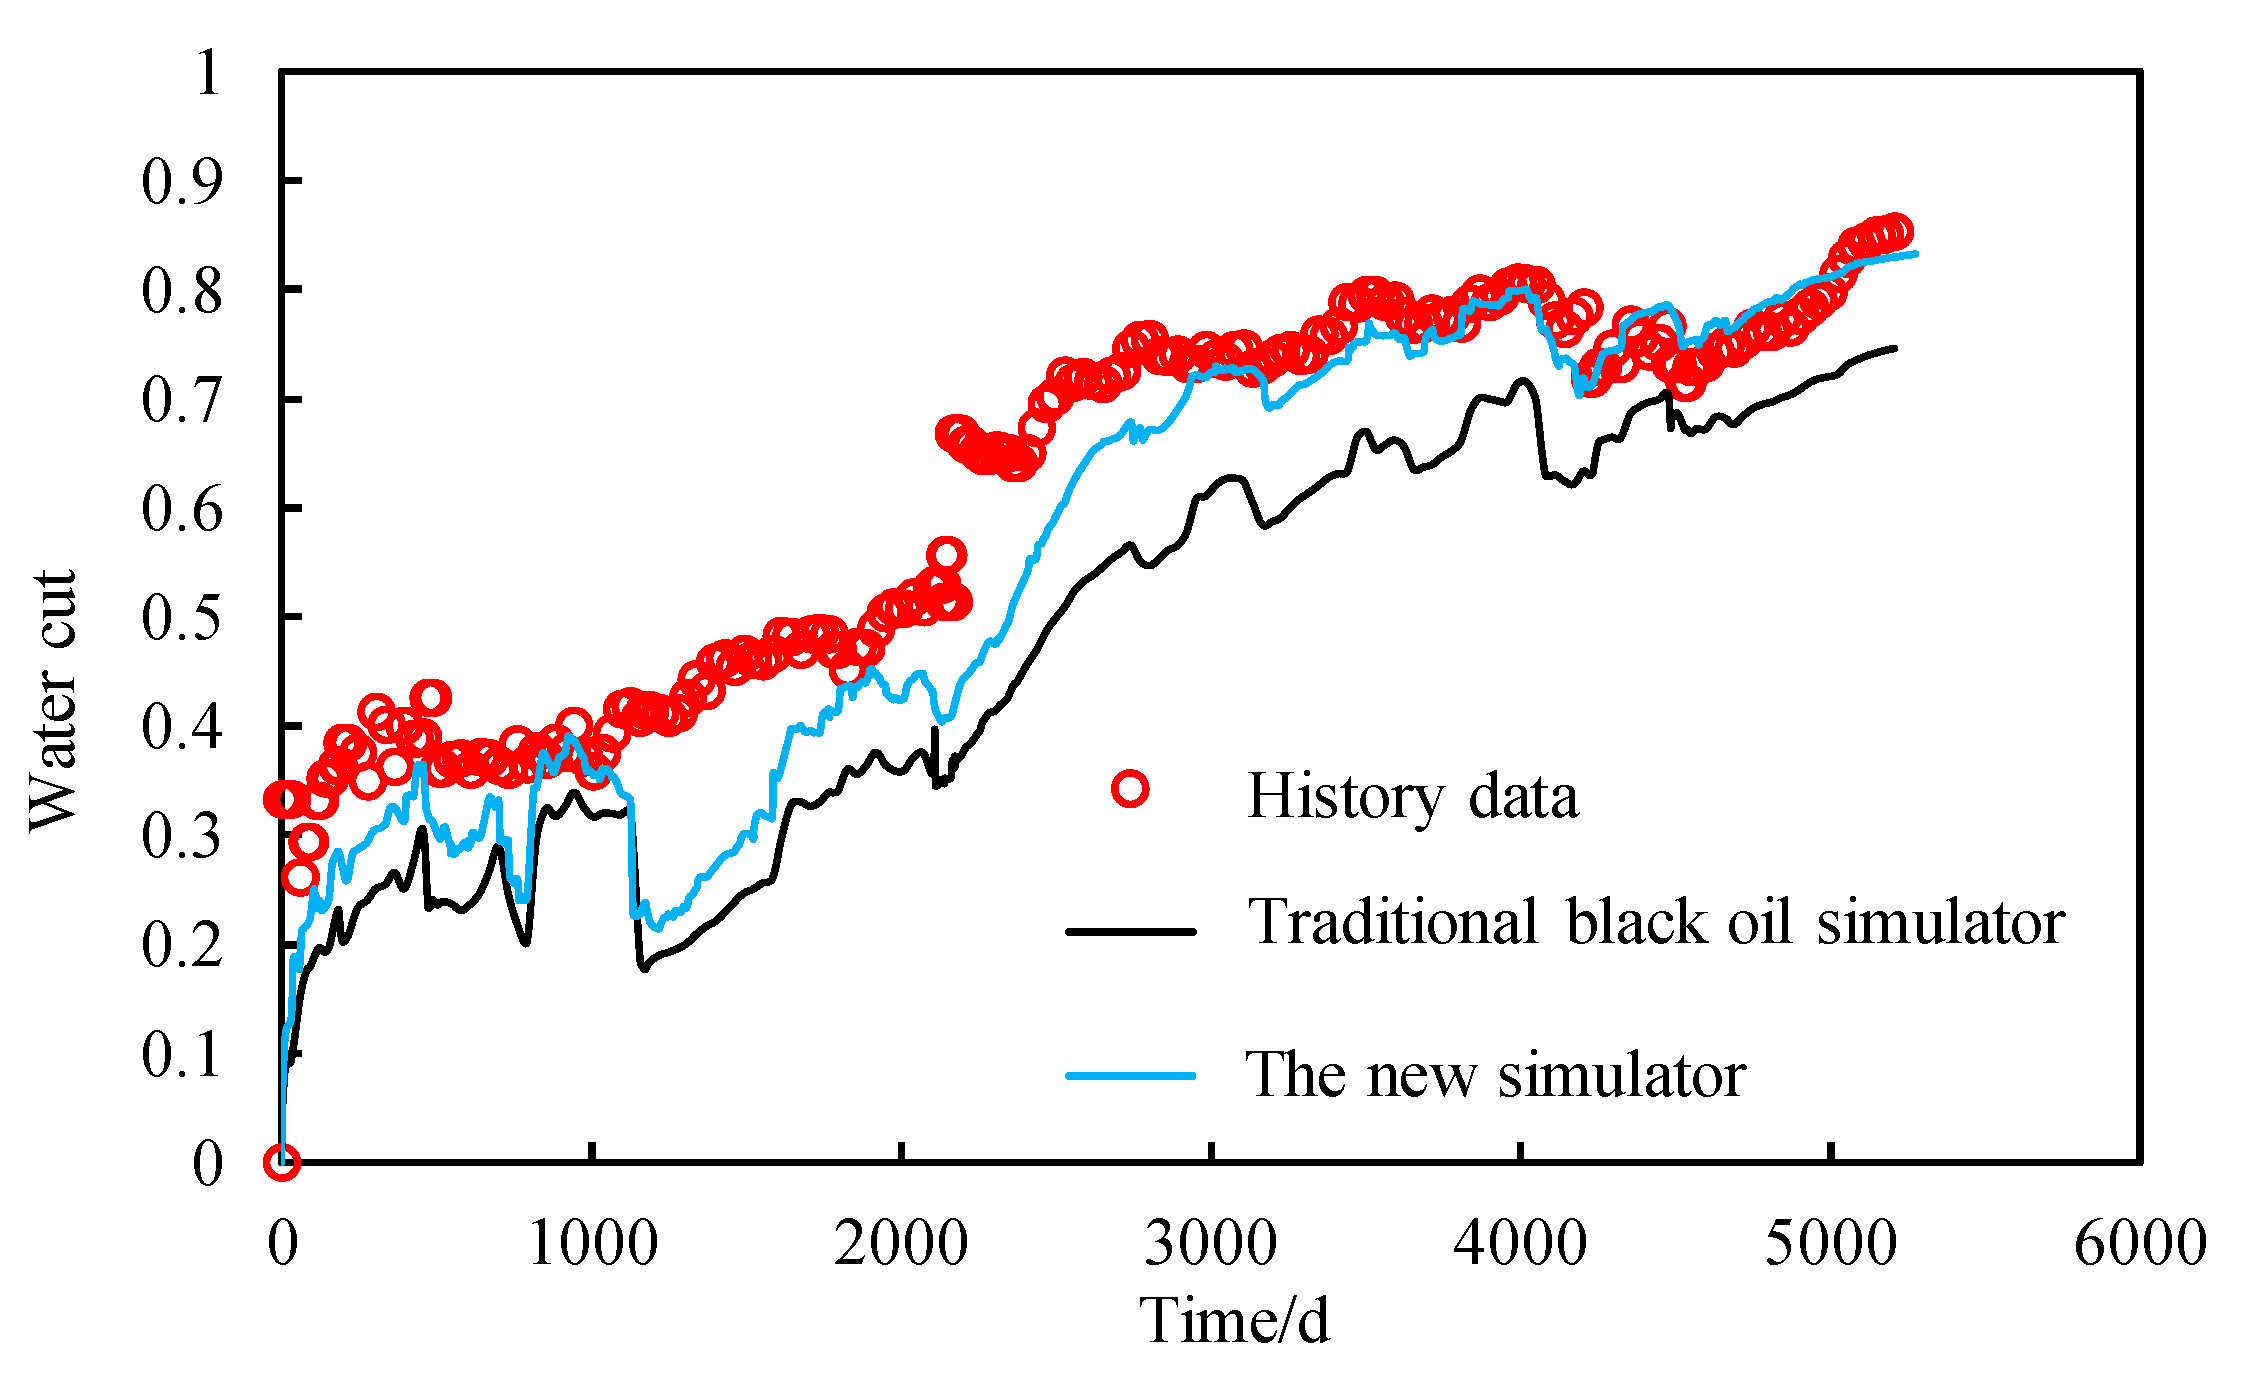
The newly developed simulator can improve the history matching of water flooding in heavy oil reservoirs by comprehensively considering permeability time variation and threshold pressure gradient, thereby enhancing the reliability of production forecasting.

Author Contributions

Writing—original draft, Y.C.; supervision, W.Z.; data curation, C.L. All authors have read and agreed to the published version of the manuscript.

Funding

This research was funded by the National Natural Science Foundation of China (Grant No. U24B6003), and Science and Technology Major Project of CNOOC during the 14th Five-Year Plan (Grant No. KJGG2021-0501, KJGG2021-0506, KJQZ-2024-2101).

Data Availability Statement

Data are contained within the article.

Conflicts of Interest

Author Yongzheng Cui, Wensheng Zhou and Chen Liu were employed by the company CNOOC Research Institute Ltd. The authors declare that the research was conducted in the absence of any commercial or financial relationships that could be construed as a potential conflict of interest.

References

  1. Yin, H.; Yu, J.; Qu, H.; Yin, S. A Novel Approach to Waterflooding Optimization in Irregular Well Patterns Using Streamline Simulation and 3D Visualization. Processes 2025, 13, 1114. [Google Scholar] [CrossRef]
  2. Yang, R. Further study on oil/water relative permeability ratio model and waterflooding performance prediction model for high water cut oilfields sustainable development. J. Pet. Explor. Prod. Technol. 2024, 14, 1297–1309. [Google Scholar] [CrossRef]
  3. Zhong, H.; Shi, B.; Bi, Y.; Cao, X.; Zhang, H.; Yu, C.; Tang, H. Interaction of elasticity and wettability on enhanced oil recovery in viscoelastic polymer flooding: A case study on oil droplet. Geoenergy Sci. Eng. 2025, 250, 213827. [Google Scholar] [CrossRef]
  4. Miao, Y.; Zhao, Q.; Huang, Z.; Zhao, K.; Zhao, H.; Guo, L.; Wang, Y. Core flooding experimental study on enhanced oil recovery of heavy oil reservoirs with high water cut by sub-and supercritical water. Geoenergy Sci. Eng. 2024, 242, 213208. [Google Scholar] [CrossRef]
  5. Khormali, A.; Ahmadi, S. Synergistic Effect Between Oleic Imidazoline and 2-Mercaptobenzimidazole for Increasing the Corrosion Inhibition Performance in Carbon Steel Samples. Iran. J. Chem. Chem. Eng. 2023, 42, 321–336. [Google Scholar]
  6. Song, K.; Wang, D.; Yang, E.; Wu, X.; Dong, C.; Sun, P. A novel method to identify preferential flow paths by considering the time-varying effect of petrophysical parameters in ultra-high water-cut reservoirs. Geoenergy Sci. Eng. 2024, 241, 213172. [Google Scholar] [CrossRef]
  7. Fu, H.; Song, K.; Ma, Z.; Zhao, Y.; Liang, L.; Guo, H. An accurate identification and spatial characterization method for the development degree of preferential flow paths in water-flooded reservoir. Geomech. Geophys. Geo-Energy Geo-Resour. 2024, 10, 141. [Google Scholar] [CrossRef]
  8. Nie, R.S.; Wang, Y.M.; Kang, Y.L.; Jia, Y.L. Modeling the characteristics of Bingham porous-flow mechanics for a horizontal well in a heavy oil reservoir. J. Pet. Sci. Eng. 2018, 171, 71–81. [Google Scholar] [CrossRef]
  9. Balhoff, M.T.; Thompson, K.E. Modeling the steady flow of yield-stress fluids in packed beds. AIChE J. 2004, 50, 3034–3048. [Google Scholar] [CrossRef]
  10. Lowman, J.; Abukhdeir, N.M.; Ioannidis, M.A. Predictive multiphysics model of vapor extraction (VAPEX) for the in-situ recovery of heavy oil and bitumen. Fuel 2025, 381, 133408. [Google Scholar] [CrossRef]
  11. Dong, X.; Liu, H.; Wang, Q.; Pang, Z.; Wang, C. Non-Newtonian flow characterization of heavy crude oil in porous media. J. Pet. Explor. Prod. Technol. 2013, 3, 43–53. [Google Scholar] [CrossRef]
  12. Liu, W.; Zhang, Q.; Dong, Y.; Chen, Z.; Duan, Y.; Sun, H.; Yan, X. Analytical and numerical studies on a moving boundary problem of non-Newtonian Bingham fluid flow in fractal porous media. Phys. Fluids 2022, 34, 023101. [Google Scholar] [CrossRef]
  13. Gao, Y.; Ma, K.; Liu, J.; Ling, D.; Yang, B. Considering Shear Dilution and Threshold Pressure Gradient Heavy Oil Reservoir Nonlinear Numerical Simulation and Residual Oil Characterization. In Proceedings of the International Petroleum Technology Conference, Dhahran, Saudi Arabia, 12–14 February 2024; p. IPTC-23459-EA. [Google Scholar]
  14. Civan, F. Non-isothermal permeability impairment by fines migration and deposition in porous media including dispersive transport. Transp. Porous Med. 2010, 85, 233–258. [Google Scholar] [CrossRef]
  15. Zhu, L.; Du, Q.; Li, Z.J.; Yu, H.; Song, X. Variation of physical characteristics and wettability of the reservoir at high water-cut stage. Pet. Explor. Dev. 2004, 31 (Suppl. S1), 82–84. [Google Scholar]
  16. Hu, J.I.; Zhang, R.; Xianbo, L.U.; Zili, Z.H.; Lu, Y.A. Nuclear magnetic resonance experiments on the time-varying law of oil viscosity and wettability in high-multiple waterflooding sandstone cores. Pet. Explor. Dev. 2024, 51, 394–402. [Google Scholar]
  17. Beckingham, L.E. Evaluation of macroscopic porosity-permeability relationships in heterogeneous mineral dissolution and precipitation scenarios. Water Resour. Res. 2017, 53, 10217–10230. [Google Scholar] [CrossRef]
  18. Kamal, M.M.; Morsy, S.; Suleen, F.; Pan, Y.; Dastan, A.; Stuart, M.R.; Mire, E.; Zakariya, Z. Determination of in-situ reservoir absolute permeability under multiphase-flow conditions using transient well testing. SPE Reserv. Eval. Eng. 2019, 22, 336–350. [Google Scholar] [CrossRef]
  19. Duan, J.; Zhu, L.; Luo, W. Establishment and application of a novel four-dimensional model for simulation of a natural water flooding reservoir—A case study of Nanpu No. 2 structure in the BHW basin. Processes 2023, 11, 189. [Google Scholar] [CrossRef]
  20. Wang, S.C.; Zhang, N.; Tang, Z.H.; Zou, X.F.; Sun, Q.; Liu, W. Time-dependent model for two-phase flow in ultra-high water-cut reservoirs: Time-varying permeability and relative permeability. Pet. Sci. 2024, 21, 2536–2553. [Google Scholar] [CrossRef]
  21. Ju, B.S.; Fan, T.L.; Zhang, J.C.; Wang, X.D. Oil viscosity variation and its effects on production performance in water drive reservoir. Shiyou Kantan Yu Kaifa (Pet. Explor. Dev.) 2006, 33, 99–102. [Google Scholar]
  22. Chuanzhi, C.; Kaikai, L.; Yong, Y.; Yingsong, H.; Qi, C. Identification and quantitative description of large pore path in unconsolidated sandstone reservoir during the ultra-high water-cut stage. J. Pet. Sci. Eng. 2014, 122, 10–17. [Google Scholar] [CrossRef]
  23. Xu, J.; Guo, C.; Jiang, R.; Wei, M. Study on relative permeability characteristics affected by displacement pressure gradient: Experimental study and numerical simulation. Fuel 2016, 163, 314–323. [Google Scholar] [CrossRef]
  24. Jiang, R.; Zhang, W.; Zhao, P.; Jiang, Y.; Cai, M.; Tao, Z.; Zhao, M.; Ni, T.; Xu, J.; Cui, Y.; et al. Characterization of the reservoir property time-variation based on ‘surface flux’and simulator development. Fuel 2018, 234, 924–933. [Google Scholar] [CrossRef]
  25. Zhao, P.; Shen, Z.; Cai, M. Comprehensive time-varying numerical simulation of reservoir physical properties based on effective displacement flux and its application. J. China Univ. Pet. 2022, 46, 89–96. [Google Scholar]
  26. Sun, Z.; Li, Y.; Ma, K.; Xu, J.; Zhang, G.; Jiang, R.; Pan, S. A novel method to characterise time-variation of reservoir properties: Experimental study, simulator development and its application in Bohai Bay oilfield. In Proceedings of the SPE Asia Pacific Oil and Gas Conference and Exhibition, Bali, Indonesia, 29–31 October 2019; p. SPE-196282-MS. [Google Scholar]
  27. Lin, J.; Jiang, R.; Shen, Z.; Wang, Q.; Cui, Y.; Ni, Q.; Zhang, F. Comprehensive characterization investigation of multiple time-varying rock-fluid properties in waterflooding development. J. Energy Resour. Technol. 2022, 144, 073001. [Google Scholar] [CrossRef]
  28. Zhou, Z.; Jia, H.; Zhang, R.; Ding, B.; Geng, X. Three dimensional time-variation simulator for water flooding reservoir based on “effective water flux”. Phys. Fluids 2024, 36, 103101. [Google Scholar] [CrossRef]
  29. Xin, X.; Yu, G.; Chen, Z.; Wu, K.; Dong, X.; Zhu, Z. Effect of non-newtonian flow on polymer flooding in heavy oil reservoirs. Polymers 2018, 10, 1225. [Google Scholar] [CrossRef]
  30. Xin, X.; Liu, S.; Yu, G.; Ma, R.; Xu, P. Quantitative Characterization of Heavy Oil Threshold Pressure Gradient in Porous Media. In Proceedings of the SPE Reservoir Characterisation and Simulation Conference and Exhibition, Abu Dhabi, UAE, 24–26 January 2023; p. D031S017R002. [Google Scholar]
  31. Xin, X.; Li, Y.; Yu, G.; Wang, W.; Zhang, Z.; Zhang, M.; Ke, W.; Kong, D.; Wu, K.; Chen, Z. Non-Newtonian Flow Characteristics of Heavy Oil in the Bohai Bay Oilfield: Experimental and Simulation Studies. Energies 2017, 10, 1698. [Google Scholar] [CrossRef]
  32. Ruizhong, J.; Qingdong, N.; Chunguang, Z.; Fengbo, Z.; Yihua, G.; Jingqi, L. Research on seepage model and numerical simulation of variable starting pressure gradient for heavy oil reservoirs based on pressure sensitive effect. Pet. Geol. Recovery Effic. 2021, 28, 54–62. [Google Scholar]
  33. Jianchun, X.; Baojiang, S.; Bailian, C. A hybrid embedded discrete fracture model for simulating tight porous media with complex fracture systems. J. Pet. Sci. Eng. 2019, 174, 131–143. [Google Scholar]
  34. Liu, X.; Cheng, S.; Cui, Y.; Wang, Y.; Wei, C. A dynamic Pre-Darcy model and its application in the numerical simulation of enhanced geothermal system. Geoenergy Sci. Eng. 2024, 241, 213193. [Google Scholar] [CrossRef]
  35. Chen, Z. Formulations and numerical methods of the black oil model in porous media. SIAM J. Numer. Anal. 2000, 38, 489–514. [Google Scholar] [CrossRef]
  36. Jansen, J.D.; Fonseca, R.M.; Kahrobaei, S.; Siraj, M.M.; Van Essen, G.M.; Van den Hof, P.M. The egg model–a geological ensemble for reservoir simulation. Geosci. Data J. 2014, 1, 192–195. [Google Scholar] [CrossRef]
Figure 1. The relationship between displacement flux and permeability variation [25].
Processes 13 01683 g001
Figure 2. The relationship between threshold pressure gradient and mobility.
Processes 13 01683 g002
Figure 3. Calculation flow chart.
Processes 13 01683 g003
Figure 4. Self-developed software verification.
Processes 13 01683 g004
Figure 5. The permeability distribution of egg model.
Processes 13 01683 g005
Figure 6. Water cut of different models.
Processes 13 01683 g006
Figure 7. Oil recovery of different models.
Processes 13 01683 g007
Figure 8. Oil saturation (a) and displacement flux (b) distribution of model.
Processes 13 01683 g008
Figure 9. Oil saturation (a), displacement flux (b) and permeability (c) distribution of model.
Processes 13 01683 g009
Figure 10. Oil saturation (a) and displacement flux (b) distribution of model.
Processes 13 01683 g010
Figure 11. Oil saturation (a), displacement flux (b), permeability (c), and threshold pressure (d) distribution of model.
Processes 13 01683 g011
Figure 12. Historical fitting data of Oilfield A.
Processes 13 01683 g012
Figure 13. The production performance of the drilled horizontal well.
Processes 13 01683 g013
Table 1. The basic parameters.
ParametersValue
Grid number31 × 31 × 5
Grid number/m5 × 5 × 5
Porosity0.4
Permeability/mD100 × 100 × 6
Initial formation pressure/MPa13.5
Table 2. Model description.
ModelModel Description
(a)Traditional black oil
(b)Incorporation of time-varying permeability only
(c)Considering threshold pressure gradient effect only
(d)Comprehensively considering the threshold pressure gradient and time-varying permeability
Table 3. The recovery of different models.
Model(a)(b)(c)(d)
Oil recovery0.350.310.330.28
Disclaimer/Publisher’s Note: The statements, opinions and data contained in all publications are solely those of the individual author(s) and contributor(s) and not of MDPI and/or the editor(s). MDPI and/or the editor(s) disclaim responsibility for any injury to people or property resulting from any ideas, methods, instructions or products referred to in the content.

