Abstract
With the growing integration of renewable sources on a large scale into modern power systems, the operation of distribution networks faces significant challenges under fluctuating renewable energy outputs. Therefore, achieving multi-objective optimization over multiple time periods, including minimizing energy losses and maximizing renewable energy utilization, has become a pressing issue. This paper proposes a Collaborative Intelligent Optimization Reconfiguration Strategy (CIORS) based on a dual-agent framework to achieve a global collaborative optimization of distribution networks in a multi-time period environment. CIORS addresses goal conflicts in multi-objective optimization by designing a collaborative reward mechanism. The discrete agent and continuous agent are responsible for optimizing the switch states within the distribution grid while coordinating the control of both active and reactive power flows through Soft Open Points (SOPs), respectively. To respond to the dynamic fluctuations of loads and renewable energy outputs, CIORS incorporates a dynamic weighting mechanism into the comprehensive reward function, allowing the flexible adjustment of the priority of each optimization objective. Furthermore, CIORS introduces a prioritized experience replay (PER) mechanism, which improves sample utilization efficiency and accelerates model convergence. Simulation results based on an actual distribution network in a specific area demonstrate that CIORS is effective under high-penetration clean energy scenarios.
1. Introduction
With the global energy structure’s shift towards low-carbon and sustainable pathways [1], the large-scale integration of clean energy significantly elevates the intricacy and dynamism of distribution network operation. The erratic nature of clean energy generation and the variability of load demand render the system in dire need of an optimization approach. This approach should be capable of dynamically adapting to system state changes, all while ensuring operational stability, effectively cutting down energy losses, and prioritizing the consumption of clean energy within complex environments [2,3]. Nevertheless, taking into account elements like switching losses and inrush currents, traditional distribution network reconfiguration techniques struggle to make real-time adjustments [4,5,6]. Moreover, typical tie switches cannot be frequently toggled. Consequently, the quest for dynamic and real-time optimization of distribution networks has emerged as a crucial research topic.
Recently, intelligent control strategies for power systems have garnered increasing attention, especially given the uncertainties brought about by distributed energy resources (DERs). Classical methods grounded in mathematical programming and heuristic search have manifested limitations when it comes to adapting to large-scale and real-time operational modifications [7,8]. Reinforcement learning (RL) has emerged as a promising solution, owing to its ability to make online decisions without relying on explicit system models [9].
The implementation of smart soft switches, namely Soft Open Point (SOP), offers a novel technical avenue for distribution network optimization [10]. SOP can independently manage active and reactive power. By maintaining voltage stability, it boosts the capacity to consume clean energy, thereby opening up possibilities for optimizing distribution networks in a high-penetration clean energy landscape [11,12]. Nevertheless, the deployment cost of SOP is relatively steep, and replacing traditional switches in the short term is challenging. Hence, when formulating the optimization model, it is essential to comprehensively consider the synergistic effect between SOP and traditional switches [13]. In this context, the distribution network reconfiguration issue is reframed as a multi-period, multi-objective mixed-integer nonlinear programming (MINLP) problem. This necessitates coordinated control of the switch states of discrete variables and the power output of SOP’s continuous variables across different time frames, with the aim of enhancing the system’s overall performance [14,15,16].
Recent research efforts have delved into applying reinforcement learning [17,18]. Notably, Deep Q-Network (DQN) and Deep Deterministic Policy Gradient (DDPG) have been introduced to assist with network reconfiguration and voltage regulation [19,20]. Nevertheless, several frameworks rely on a single-agent architecture, which performs satisfactorily in scenarios with restricted objectives or static conditions. When extended to multi-objective and multi-period reconfiguration problems, this approach proves somewhat inadequate [21].
To surmount these limitations, multi-agent reinforcement learning (MARL) architectures have been proposed [22,23,24]. In MARL, each agent is tasked with a subtask, and agents coordinate through reward functions or shared observations. Despite progress, existing MARL methods still encounter bottlenecks in coordinating mixed decision variables (switch states and SOP outputs), reconciling conflicting objectives, and responding to dynamic environmental changes such as renewable energy fluctuations and load variability [25,26,27].
Therefore, there is an evident requirement to devise an intelligent optimization framework that enables modular control over hybrid variables. A dual-agent architecture is particularly well-suited to this problem domain; one agent deals with discrete decision-making, while the other oversees continuous control. This segregation allows for specialization in policy learning while maintaining interaction through joint reward structures [28]. It also enhances training efficiency and outperforms conventional monolithic models in terms of optimization performance.
To this end, this paper puts forward a Collaborative Intelligent Optimization Reconfiguration Strategy (CIORS), a novel framework based on dual-agent deep reinforcement learning. CIORS is custom-designed for the multi-period, multi-objective dynamic reconfiguration of active distribution networks. Its goal is to concurrently minimize energy losses, augment renewable energy absorption, reduce switching frequency, and improve voltage stability in systems characterized by high DER penetration and dynamic loads. The effectiveness of this method has been validated in the actual distribution network of a specific region.
The core innovations of CIORS are as follows:
- (1)
- Dual-Agent Collaborative Architecture: The reconfiguration task is decomposed into two sub-problems—switch status optimization and SOP power output optimization—handled by a discrete and a continuous agent, respectively. This decoupling improves training stability and allows for efficient handling of mixed discrete-continuous action spaces.
- (2)
- Collaborative Reward Mechanism: A cooperative reward function is designed to align both agents toward system-level objectives. It balances minimizing energy loss, maintaining voltage stability, and maximizing renewable utilization by encouraging joint action through shared feedback signals.
- (3)
- Dynamic Weighting Mechanism: A dynamic weighting mechanism is embedded into the composite reward function to adjust priorities based on system states. This allows CIORS to dynamically adapt its focus between short-term and long-term goals in response to variations in load and generation.
- (4)
- Prioritized Experience Replay (PER): To improve sample utilization and convergence speed, PER is adopted in both agents. It prioritizes critical transitions during learning and helps accelerate convergence in complex environments with sparse reward distributions.
2. Dynamic Reconfiguration Optimization Model for Distribution Networks
This chapter proposes a multi-objective dynamic reconfiguration optimization model that incorporates both Smart Open Points (SOPs) and traditional switches [29,30]. This model endeavors to optimize the system’s topological structure and SOP power outputs across multiple time intervals, with the aim of minimizing power losses, maximizing the utilization of renewable energy sources, and decreasing the switching operation frequency. Conventional switches and SOPs are regarded as collaborative control components, allowing for the flexible adjustment of the network’s topology and power distribution under dynamic conditions, thus improving the system’s economic efficiency.
2.1. Model Overview
With the growing integration of clean energy, the operational environment of distribution networks has become more intricate. Traditional optimization techniques are inadequate to fulfill the dynamic, multi-objective, and multi-period optimization needs. To resolve this, a multi-objective optimization model is developed, focusing on minimizing power losses, maximizing clean energy utilization, and reducing the switch operation frequency. Through the joint optimization of switch states (discrete variables) and SOP power outputs (continuous variables), the model enables the flexible reconfiguration of the distribution network’s topology and ensures voltage stability at the buses.
2.2. Objective Function
2.2.1. Minimization of Energy Losses
The goal of minimizing power losses is accomplished by decreasing the cumulative active power losses of the system over a series of time periods, thus improving the cost-effectiveness of distribution system operations. It is formulated as
In the formula, is the total energy loss of the system operation; denotes the entire duration segmented into discrete time intervals throughout the optimization horizon; represents the total count of network buses, and is the active power loss at the bus during the interval .
2.2.2. Maximization of Clean Energy Consumption
Set clean energy consumption targets. By giving priority to distributed renewable sources, including wind turbines and solar PV systems, it indirectly supports carbon emission reduction strategies and reduces reliance on fossil fuels. Define the total amount of clean energy consumption as
In the formula, is the consumption of clean energy; is the set of distributed energy buses; denotes the active power output from distributed generation at the time slot for bus .
2.2.3. Minimize the Number of Switch Operations
In the formula, is the total switching frequency; is the switchgear set; is a binary status (on/off) of the switching device during the time interval .
2.2.4. Voltage Deviation Minimization
In multi-period optimization, suppress voltage fluctuations at each bus
In the formula, is the bus voltage deviation; is a set of buses; represents the voltage magnitude at bus during the interval ; is the reference value of bus voltage.
2.3. Constraint Conditions
2.3.1. Radial Constraint
After reconfiguration, the distribution grid is required to preserve a radial configuration to avoid forming loops and guarantee the reliable functioning of the system. This constraint guarantees the physical feasibility of the system topology.
In the formula, represents the network topology structure adopted during time slot , denotes the collection of network topologies that satisfy the radial constraint, represents the topology set that meets the radial requirement when accessing the SOP. This set contains structures that allow local loops formed by branches with SOP within the power adjustment range.
2.3.2. Bus Voltage Stability Constraint
The bus voltage level across the distribution system needs to fluctuate within a predefined voltage bandwidth to ensure voltage stability.
In the formula, and are the maximum and minimum thresholds for bus voltage levels.
2.3.3. Power Balance Constraint
The sum of active and reactive power injection at every bus needs to satisfy the load flow constraints to maintain the power balance of the system.
- Active power constraint
- Reactive power constraint
In the formula, , correspond to the real and reactive power generated by conventional sources at bus in period ; , represent the output of active and reactive power from the DER at bus in period ; , are the SOP’s active and reactive power injection during time step ; , denote the active and reactive demand drawn by the load at bus in time slot ; , are the voltage magnitudes corresponding to buses and , respectively; indicates the angular separation between bus and bus ; , correspond to the line conductance and susceptance parameters linking bus and bus .
2.3.4. SOP Operation Constraints
To avoid the SOP from operating under overload conditions, its active and reactive power injection limits must be enforced. Assuming that they represent the SOP’s corresponding active and reactive power quantities, respectively.
- 1.
- Constraints on the active power flow of the SOP
- 2.
- Reactive power constraints of SOP
- 3.
- Capacity constraints of SOP
In the formula, , , , are the active power and reactive power of the two converters of the SOP in the time period respectively; , represent their corresponding rated active power capacities, which define the upper operational limits; , , , are the upper and lower limits of the reactive power of the two converters of the SOP, respectively; , are the access capacities of the two converters of the SOP, respectively.
2.3.5. Output Constraints of Distributed Energy
The lower output limit for wind and PV generation is set to zero. The upper bound depends on the time-varying nature of wind and solar irradiance, with both sources running under constant power factor conditions.
In the formula, , corresponds to the lowest and peak active power levels of the distributed generator interfaced at the bus ; , are, respectively, the minimum and maximum reactive power of the distributed power source connected to the bus .
2.3.6. Branch Power Flow Constraints
In the formula, is the current amplitude between branch and at time ; , represent the conductance and susceptance values associated with the line segment connecting bus and ; is the phase angle difference between bus and ; and denote the voltage magnitudes at buses and during time interval ; is the upper limit of current magnitude through the line connecting bus and bus .
2.3.7. Limit the Frequency of Switch Operations Within a Certain Time
The following is how we can articulate this constraint:
In the formula, denotes the cumulative switching actions performed by all switches involved in the reconfiguration process during the optimization horizon.; indicates the binary switching position at time step ; defines the cap on the cumulative switching frequency across the system.
Due to the dynamic fluctuations in load demand and renewable energy generation in distribution networks, this study employs forecasted data to represent future load requirements and distributed energy outputs. Supported by these predictions, the optimization model can proactively respond to changes in load and generation, enabling dynamic adjustments of SOPs and traditional switch states. Moreover, the data-driven deep reinforcement learning approach eliminates the need for precise modeling in uncertain environments, dynamically tuning model parameters using forecast data from typical scenarios to better adapt to stochastic conditions.
3. Collaborative Intelligent Optimization and Reconstruction Strategy (CIORS)
As presented in Figure 1, the Collaborative Intelligent Optimization Reconfiguration Strategy (CIORS) applies a dual-agent reinforcement learning framework to solve the global optimization problem of active distribution networks equipped with Soft Open Points (SOPs) under multi-period and multi-objective constraints. The framework integrates a discrete agent and a continuous agent to collaboratively perform reconfiguration and power control. The discrete agent determines the optimal topology by controlling switch states and ensuring radial structure compliance, aiming to reduce network losses and limit switching frequency. Based on the topology output, the continuous agent adjusts the active and reactive power of SOPs to enhance voltage stability and increase renewable energy absorption. This collaborative mechanism enables CIORS to dynamically adapt to load and generation fluctuations while promoting clean energy utilization and reducing carbon emissions.
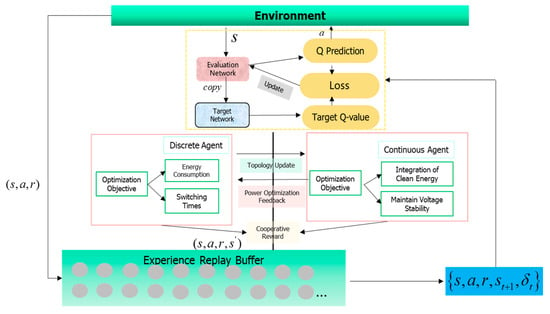
Figure 1.
Training block diagram of collaborative intelligent optimization and reconstruction strategy based on reinforcement learning.
3.1. State Space Design
3.1.1. Discrete Agent
In the formula, denotes the load demand during the time interval ; represents the forecasted generation of renewable DERs at step ; describes the distribution network topology associated with period .
3.1.2. Continuous Agent
In the formula, refers to the voltage magnitude at the bus ; indicates the real power flow across the line segment ; denotes the output power delivered by the SOP unit .
3.2. Action Space Design
3.2.1. Discrete Agent
The action space of a discrete agent is defined as a set of switch operation combinations for controlling the network topology. Each action represents a set of status adjustments of switches, represented mathematically as below
In the formula, is the action set of the discrete agent; denotes the control status of a given switch ; represents the overall count of switching devices within the network.
3.2.2. Continuous Agent
The action space of the continuous agent is the active power output adjustment range of the SOP.
In the formula, is the action set of continuous agent; the active output of SOP ; denotes the reactive power supplied by the SOP ; indicates the total count of SOP devices deployed in the system.
3.3. Immediate Reward Design
The immediate reward function is used to evaluate the effectiveness of actions taken by agents in the current state. Design reward functions for discrete and continuous agents, respectively.
3.3.1. Discrete Agent
The reward design for discrete agent is to minimize system energy loss and switching operation frequency, and is specifically defined as
In the formula, is energy loss reward; is switching operation penalty; is the difference between the current energy loss and the energy loss at the previous moment; is penalty coefficient; is the current number of switching operations; is the immediate reward of the discrete agent.
3.3.2. Continuous Agent
The reward function goal of a continuous agent is to maintain voltage stability and maximize the consumption of clean energy. Specifically defined as
In the formula, is the voltage stability reward; is the reward for clean energy consumption; is the actual voltage; is the target voltage; is clean energy consumption; is the immediate reward of the continuous agent.
3.4. Collaborative Reward Design
To achieve the collaborative optimization effect of dual agents, CIORS introduces a collaborative reward mechanism, subdivides the global goal into sub-goals for each agent, and realizes the coupled optimization of two agents through information sharing. The comprehensive synergy reward consists of the energy loss synergy reward and the clean energy consumption and accommodation collaborative reward.
In the formula, is the total reward of dual agents under multi-objective collaborative optimization; and are the weight coefficient of energy loss collaborative reward and synergy reward; and is total energy loss at current and previous moments, respectively; and is the total amount of clean energy consumption and absorption for the current and previous moments, respectively.
Comprehensive reward function design
3.5. Dynamic Weight Mechanism
In CIORS (Collaborative Intelligent Optimization Reconfiguration Strategy), the dynamic weighting mechanism [31,32] is used to adjust the weights of different optimization objectives in the system in real time, so as to adapt to changes in power grid states and ensure the reasonable allocation of priorities of each optimization objective at different stages. This mechanism is based on the S-shaped (sigmoid) nonlinear function and dynamically adapts to fluctuations in system states by adjusting the weights of key parameters such as load, voltage, and power loss.
In CIORS, dynamic weight adjustment is carried out according to the real-time system state. The weights of immediate rewards and collaborative rewards are dynamically adjusted to adapt to changes in the power grid state and ensure the priority adjustment of each optimization objective at different times.
The calculation of weight values uses a sigmoid nonlinear function
In the formula, is the weight of the immediate reward for discrete agent, which affects the operation selection of the switch; is the weight of the immediate reward for continuous agent, which adjusts the output of SOP; is the weight of the collaborative reward.
3.6. Priority Experience Replay Mechanism (PER-DQN)
In implementing the optimal strategy in a dynamic environment, a large action space will slow down the convergence speed of the algorithm. To improve the learning efficiency of the model in complex distribution networks, this paper introduces the Prioritized Experience Replay (PER) mechanism on the traditional DQN framework [33,34,35]. PER-DQN sorts samples based on Temporal-Difference (TD) errors and assigns sampling priorities to samples according to the magnitude of TD error values. DQN enables the agent to more accurately evaluate the relative value of each action through the introduction of a double valuation structure and an advantage function.
In PER-DQN, the TD error is defined as . Among them, samples with larger TD errors have higher priorities and are sampled with a greater probability during training, increasing the utilization rate of key samples in the training process and avoiding the suboptimal convergence problem that may be caused by random sampling. This mechanism ensures that PER-DQN can more efficiently use important data samples in the experience pool and accelerate the convergence speed of the strategy. The algorithm flow is as follows:
- Action value function update: Based on state value and advantage function , with the following structure
This formulation accounts for action-specific deviations from the average advantage.
- 2.
- TD error calculation
The target value is calculated based on the observed reward and the maximum estimated Q-value for the next state, as per the Bellman optimality principle.
- 3.
- Loss function calculation
The loss function quantifies the squared error between the estimated Q-value and its corresponding target, facilitating efficient gradient-driven learning.
- 4.
- Parameter update
Model parameters are optimized using stochastic gradient descent, weighted by the TD error to emphasize critical experiences in learning.
In the above expressions, , , and represent the Q-network parameters, learning rate, and priority weight coefficient in PER, respectively. This PER-DQN framework increases the sampling efficiency from the replay buffer and expedites the convergence of the control strategy in complex distribution systems.
3.7. Steps of Collaborative Intelligent Optimization and Reconstruction Strategy Algorithm
CIORS is based on the DQN reinforcement learning algorithm, with specific steps including state initialization, alternating decision-making by discrete and continuous agents, collaborative reward calculation, and experience replay. The detailed process is as follows, as shown in Table 1.

Table 1.
Steps of the collaborative intelligent optimization and reconstruction strategy algorithm.
4. Results
To validate the practical optimization capability of the proposed Collaborative Intelligent Optimization Reconfiguration Strategy (CIORS) under multi-period dynamic conditions, case studies are conducted based on a real-world 29-bus distribution system. The system integrates renewable distributed energy sources such as wind and photovoltaic (PV) generation and is equipped with multiple Smart Open Points (SOPs). Typical scenarios involving load forecasts and renewable energy output fluctuations are constructed to evaluate the comprehensive performance of CIORS in terms of system energy loss, voltage fluctuations, and clean energy utilization.
4.1. Calculation Example Parameters
In the algorithm, the number of training episodes is set to 10,000, with a discount factor γ of 0.9. The learning rate is set to 1 × 10⁻⁶, and the initial exploration rate is 0. The experience replay buffer has a capacity of 10,000. A fully connected neural network is employed, with the ReLU function used as the activation function.
Structure diagram of bus distribution system and schematic diagram of SOP layout (The Figure 2 indicates the access positions of photovoltaic (PV) and wind power (WT) and the installation positions of three groups of SOPs, which are located at branches 6–21, 22–26 and 13–27, respectively, and are used to improve the flexibility of network structure and power regulation ability.)
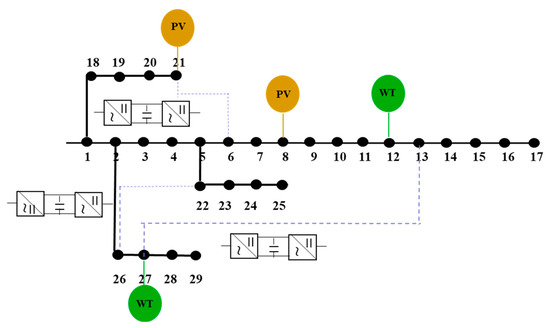
Figure 2.
Structure diagram of power distribution system and schematic diagram of SOP layout.
The simulation is based on a 29-bus distribution system from a specific region, as shown in Figure 2. In this system, photovoltaic (PV) units are connected to buses 8 and 21, with capacities of 480 kW and 350 kW, respectively. Wind power units are connected to buses 12 and 27, with capacities of 300 kW and 450 kW. Both PV and wind generation operate with a constant power factor, set to 0.95.
To enhance power flow regulation and network topology flexibility, three Smart Open Points (SOPs) are installed on branches 6–31, 22–26, and 13–27. Each SOP has a rated capacity of 600 kVA and is positioned near the main distributed energy sources to facilitate the regulation of clean energy power flow and improve network efficiency and security.
The simulation covers a 24-h period with a time resolution of 1 h, encompassing typical operating periods such as morning peak, midday high PV output, and nighttime low load. Inputs for each time period include load curves for each bus as well as predicted PV and wind generation outputs, reflecting the system’s operational characteristics under dynamic multi-period conditions. To control equipment operation frequency and prolong device lifespan, the total number of switching operations for all reconfiguration switches during the entire cycle is limited to 15, with each individual switch operating no more than 3 times.
To evaluate the optimization performance of the CIORS strategy, the following three operational schemes are defined:
Scheme 1 (Baseline): SOPs and topology reconfiguration are not considered. Load demands are met solely by conventional controllable generation.
Scheme 2 (SOP Optimization): SOPs are installed and their power outputs are optimized, while the network topology remains fixed.
Scheme 3 (CIORS Collaborative Optimization): The proposed CIORS strategy is applied to jointly optimize both the network topology and SOP power outputs.
4.2. Network Loss Analysis
Compared with Scheme 1, Scheme 2 introduces Smart Open Point (SOP) devices based on a fixed network topology. By adjusting both active and reactive power, it alleviates local power flow concentration to some extent, resulting in a significant reduction in system energy losses. Furthermore, Scheme 3 adopts a collaborative optimization strategy, utilizing a dual-agent structure to jointly optimize the network topology and SOP output. This enables a coordinated mechanism featuring both reconfigurable topology and adjustable power flow, further enhancing overall system efficiency.
The system loss is calculated by summing the power losses on all feeders, which can be obtained from the power flow calculation results under each configuration. As shown in Table 2, simulation results indicate that Scheme 1 incurs an active power loss of 812.56 kWh over a typical 24-h cycle. With the integration of SOPs, Scheme 2 reduces the loss to 644.12 kWh, achieving a 20.7% reduction. Building on this, Scheme 3 (CIORS) further decreases the loss to 438.75 kWh, representing a total reduction of 45.9% compared to the baseline. This improvement is attributed to the collaborative optimization between network topology and SOP outputs, enabling more efficient energy distribution.
Table 2.
Comparison of network energy losses.
From the perspective of operational constraints, CIORS not only achieves lower losses but also effectively manages switching behavior. During the 24-h horizon, only nine switching actions were performed, and no switch exceeded the preset limit of three operations, complying with equipment lifetime and safety requirements. Moreover, CIORS maintains temporal continuity of topology across adjacent time periods, avoiding redundant reconfiguration that may arise in independently optimized intervals.
In addition to reducing switching frequency, CIORS exhibits better temporal and spatial coordination of switch operations. Most switching actions occur during peak load hours or when renewable generation surges, allowing the network to alleviate branch overloads and improve local voltage support. Unlike DQN-based methods, which may trigger frequent or scattered switching, CIORS ensures all reconfigurations are purposeful and within the allowed operation frequency.
The loss reduction achieved by CIORS is also closely related to its power flow optimization capabilities. Through dynamic topology reconfiguration and coordinated SOP control, power is redistributed over shorter or lower-impedance paths, thereby reducing I2R losses. In terms of voltage performance, CIORS maintains all bus voltages within the standard operating range throughout the scheduling horizon. In contrast, other methods exhibit occasional voltage violations, particularly at buses subject to large DER fluctuations.
4.3. Voltage and Analysis of Renewable Energy Consumption
During extended multi-period operation, significant intermittency in wind and photovoltaic generation, together with frequent load variations, tends to cause deviations in bus voltage levels across the system. In periods characterized by low demand and elevated photovoltaic generation, the likelihood of voltage violations becomes more pronounced. In Scheme 1, without flexible adjustment means, the voltage fluctuation range is large. In some time periods, the bus voltage is close to the upper limit of 1.02 p.u., the minimum voltage is less than 0.97 p.u., and the voltage difference reaches 0.05 p.u. Scheme 2 can provide reactive power compensation to some buses when the load is relatively concentrated or the output is offset by introducing SOP, and the voltage fluctuation is alleviated. In contrast, under the action of the CIORS collaborative optimization strategy, Scheme 3 can dynamically adjust the topology structure and SOP power output according to the time-period load and output, effectively realizing the precise regulation of bus voltage. The system has the smallest voltage fluctuation range, and the voltage distribution is concentrated near 1.00 p.u., showing the best stability performance.
In addition, to verify the capability of each scheme in utilizing renewable energy output, the actual consumption rates of photovoltaic and wind power were calculated, and the results are shown in Table 3. Due to voltage constraints and power flow bottlenecks during peak output periods, Scheme 1 and Scheme 2 are unable to fully accommodate the renewable energy injected into the grid. As a result, their maximum renewable energy utilization rates are relatively low, at only 58.47% and 69.86%, respectively. In contrast, Scheme 3, which adopts the proposed CIORS optimization strategy, dynamically reconstructs the network topology and effectively improves power flow distribution and load matching. This coordination significantly enhances the renewable energy hosting capacity of the system. The renewable energy utilization rates presented in Table 3 are computed by evaluating the actual power injected from PV and wind sources under operational constraints. As shown in the table, Scheme 3 achieves a renewable energy utilization rate of 88.92% at peak output, greatly mitigating the curtailment of wind and solar power and demonstrating the effectiveness of the proposed method in promoting clean energy consumption.
Table 3.
Analysis of Renewable Energy Usage Efficiency Across Various Strategies.
4.4. Comparison of Different Optimization Algorithms
As shown in Figure 3, to verify the solution efficiency and effectiveness of the proposed method, convergence curves of the algorithm training process under identical parameter settings were plotted. During training, the CIORS algorithm demonstrated a faster convergence rate compared to Dueling DQN, owing to the introduction of a prioritized experience replay mechanism, while the convergence performance of the DQN algorithm was relatively inferior. Moreover, the reward function of the proposed method converged to a higher value than that of Dueling DQN, indicating that the resulting optimized strategy is more effective in guiding the distribution network to operate in a safer, more economical, and cleaner manner.
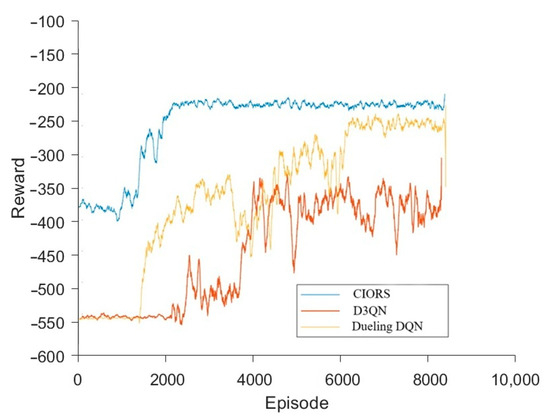
Figure 3.
Algorithm convergence curve comparison.
5. Discussion
This paper proposes a novel reinforcement learning-based reconfiguration strategy, CIORS, which achieves multi-objective scheduling optimization in active distribution networks by coordinating network topology and SOP power regulation over multiple time periods. Simulation outcomes demonstrate that the proposed approach effectively mitigates power losses and stabilizes bus voltage, thereby proving advantageous in scenarios with high clean energy penetration.
5.1. Comparison with Existing Studies
The findings of this paper align with recent trends in intelligent distribution network reconfiguration and introduce several advancements. Studies such as [36,37,38] have shown that integrating SOPs and reinforcement learning improves operational flexibility. However, most existing approaches are limited by static optimization frameworks or single-agent reinforcement learning architectures, which struggle in dynamic environments with multi-objective conflicts [39,40].
Unlike these approaches, CIORS adopts a dual-agent framework with discrete-continuous coordination, allowing for the task-specific optimization of both network topology and SOP power flow control. This separation enables more effective training and coordination in dynamic operational scenarios. Despite these contributions, challenges remain. Current single- or centralized-agent designs may limit adaptability and scalability in large-scale or decentralized systems. Our method addresses part of this, but further work is needed on broader coordination schemes.
5.2. Interpretation of Results and Hypothesis Validation
Simulation results validate the hypothesis that a collaborative, dual-agent reinforcement learning framework enables global optimization in distribution system scheduling. In addition to measurable reductions in energy losses and voltage deviation, the proposed method demonstrates improved convergence behavior and training stability, attributable to the integration of prioritized experience replay (PER).
These outcomes suggest that learning-based approaches can effectively adapt to non-linear interactions between network topology changes and SOP operation. Furthermore, they reinforce the viability of hybrid discrete-continuous policy structures in environments with time-varying conditions.
5.3. Implications and Future Research Directions
This study offers important implications for real-time control of active distribution networks, particularly in systems with increasing renewable penetration and demand-side uncertainty.
However, to further advance this field, we highlight the following directions:
- (1)
- Integration with IoT and sensor technologies.
Future implementations should explore how real-time data acquisition from advanced sensors and IoT devices can enhance state observability and improve the quality of input for reinforcement learning, especially in fast-changing environments.
- (2)
- Scalability with multi-agent systems.
Although CIORS employs a dual-agent structure, extending to multi-agent reinforcement learning (MARL) is a natural evolution. Doing so would enable distributed decision-making but also introduce new challenges in agent coordination, communication overhead, and convergence guarantees.
- (3)
- Uncertainty modeling.
Introducing probabilistic forecasts for load and renewable generation could make the algorithm more robust to volatility and unexpected changes in input data.
- (4)
- Large-scale validation.
Future work should test CIORS on more complex distribution systems with higher bus counts and under various topological disturbances to evaluate its performance.
6. Conclusions
In response to the multi-objective dynamic optimization challenges faced by dynamic distribution networks with Smart Open points (SOPs) under high penetration of clean energy, this paper proposes a Collaborative Intelligent Optimization Reconfiguration Strategy (CIORS) based on a dual-agent architecture. Under the deep reinforcement learning framework, CIORS constructs a hybrid discrete–continuous agent structure to optimize both the distribution network topology and SOP output, thereby enhancing power flow regulation capability, operational flexibility, and clean energy utilization efficiency.
CIORS incorporates a multi-level reward mechanism, which includes immediate reward functions targeting energy loss, voltage fluctuations, clean energy integration, and switching frequency. Additionally, a collaborative reward is introduced to coordinate the optimization objectives between agents, aiming to achieve system-level global performance improvement. To address the dynamic uncertainties in the operating environment, the strategy further integrates a dynamic weighting mechanism and prioritized experience replay, significantly improving both the adaptability and convergence speed of the learning policy.
Author Contributions
Conceptualization, Y.C. and Q.C.; methodology, Y.C.; software, Y.C.; validation, Y.C., R.Z., and Y.Z.; formal analysis, Y.C.; investigation, Y.C.; resources, Y.W. and B.L.; data curation, Y.C.; writing—original draft preparation, Y.C.; writing—reviewing and editing, Q.C.; visualization, Y.C.; supervision, Q.C.; project administration, R.Z. and Q.C.; funding acquisition, Q.C. All authors have read and agreed to the published version of the manuscript.
Funding
This research is funded by the 2024 High-Quality Development Strategy Project of State Grid Jilin Electric Power Co., Ltd., Contract No. SGJLJY00ZLJS2400058.
Data Availability Statement
The original contributions presented in this study are included in the article. Further inquiries can be directed to the corresponding author.
Conflicts of Interest
Authors Yunfei Chu, Yong Wang and Boqiang Li were employed by State Grid Jilin Electric Power Co., Ltd. Author Rui Zhou was employed by State Grid Jilin Electric Power Co., Ltd. The remaining authors declare that this research was conducted in the absence of any commercial or financial relationships that could be construed as a potential conflict of interest. The funder was not involved in our study design, collection, analysis, interpretation of data, writing of this article, or decision to submit it for publication.
References
- Zhang, Z.; Kang, C. Challenges and Prospects of Constructing a New-Type Power System under the Carbon Neutrality Target. Proc. CSEE 2022, 42, 2806–2819. [Google Scholar]
- Wang, J.; Jia, J.; Li, R.; Huang, W. Distribution Network Reconfiguration Based on Improved Genetic Algorithm. Inf. Technol. 2019, 43, 108–112. [Google Scholar]
- Tyagi, A.; Verma, A.; Bijwe, P.R. Reconfiguration for Loadability Limit Enhancement of Distribution Systems. IET Gener. Transm. Distrib. 2018, 12, 88–93. [Google Scholar] [CrossRef]
- Chen, P.; Mao, Y.; Tong, W.; Deng, H.; Chen, Y.; Hu, D. Multi-Objective Optimization Reconfiguration of Distribution Networks Based on a Multi-Objective Particle Swarm Optimization Algorithm. Proc. CSU-EPSA 2016, 28, 68–72. [Google Scholar]
- Wang, R.; Bi, X.; Bu, S. Real-Time Coordination of Dynamic Network Reconfiguration and Volt-VAR Control in Active Distribution Network: A Graph-Aware Deep Reinforcement Learning Approach. IEEE Trans. Smart Grid 2024, 15, 3288–3302. [Google Scholar] [CrossRef]
- Pamshetti, V.B.; Singh, S.; Thakur, A.K.; Babu, T.S.; Patnaik, N.; Krishna, G.H. Cooperative Operational Planning Model for Distributed Energy Resources with Soft Open Point in Active Distribution Network. IEEE Trans. Ind. Appl. 2023, 59, 2140–2151. [Google Scholar] [CrossRef]
- Ma, L.; Wang, L.; Liu, Z. Soft Open Points-Assisted Resilience Enhancement of Power Distribution Networks Against Cyber Risks. IEEE Trans. Power Syst. 2023, 38, 31–41. [Google Scholar] [CrossRef]
- Teng, J.; Liu, H.; Xiao, D. Multi-Time Scale Distribution Network Reconfiguration and Reactive Power Coordinated Optimization Based on Adaptive Graph Attention Network. S. Power Syst. Technol. 2025, 1–13. [Google Scholar]
- Wang, C.; Song, G.; Li, P.; Zhao, J.; Wu, J. A Sequential Optimization Method for Distribution Networks with Tie Switches and Smart Open Points. Proc. CSEE 2016, 36, 2315–2321. [Google Scholar]
- Wang, Z.; Gao, H.; Gao, Y.; Qing, Z.; Hu, M.; Liu, J. Multi-Level Dynamic Reconfiguration Optimization Operation Method for Urban Distribution Networks Based on Deep Reinforcement Learning. Power Syst. Prot. Control 2022, 50, 60–70. [Google Scholar]
- Yin, Z.; Wang, S.; Zhao, Q. Sequential Reconfiguration of Unbalanced Distribution Network with Soft Open Points Based on Deep Reinforcement Learning. J. Mod. Power Syst. Clean Energy 2023, 11, 107–119. [Google Scholar] [CrossRef]
- Wang, W.; Yu, N.; Gao, Y.; Shi, J. Safe Off-Policy Deep Reinforcement Learning Algorithm for Volt-VAR Control in Power Distribution Systems. IEEE Trans. Smart Grid 2020, 11, 3008–3018. [Google Scholar] [CrossRef]
- Wang, S.; Duan, J.; Shi, D.; Xu, C.; Li, H.; Diao, R.; Wang, Z. A Data-Driven Multi-Agent Autonomous Voltage Control Framework Using Deep Reinforcement Learning. IEEE Trans. Power Syst. 2020, 35, 4644–4654. [Google Scholar] [CrossRef]
- Wang, C.; Song, G.; Li, P.; Yu, H.; Zhao, J.; Wu, J. Flexible Interconnection Technology of Smart Distribution Network Based on Smart Open Point and Its Prospect. Autom. Electr. Power Syst. 2016, 40, 168–175. [Google Scholar]
- Li, Y.; Chen, X.; Li, W.; Yu, S.; Xu, S.; Wei, T.; He, Z. Study on Interconnection Structure and Control Technology of Flexible Distribution Network with Parallel SOP and Tie Switch. Proc. CSEE 2022, 42, 4749–4760. [Google Scholar]
- An, J.; Li, Z.; Zhou, Y.; Shi, Y.; Bi, J. Power Grid N-1 Emerging Risk Prevention and Control Strategy Based on Improved Dual-Agent D3QN. Proc. Chin. Soc. Electr. Eng. 2025, 45, 858–869. [Google Scholar]
- Deng, Z.; Zhu, X.; Duan, J.; Liu, S.; Wang, Y. Adaptive Optimal Scheduling of Flexibly Interconnected Distribution Networks Based on Dynamic Weights. Electr. Power Constr. 2025, 1–11. [Google Scholar]
- Dong, L.; Wu, Y.; Zhang, T.; Wang, X.; Hao, Y.; Guo, L. A Bi-Level Optimization Method for Active Distribution Networks with SOP Based on Reinforcement Learning. Autom. Electr. Power Syst. 2023, 47, 59–68. [Google Scholar]
- Zhang, C.; Ji, L.; Yang, S.; Guo, X.; Li, H. Distributed Optimal Consensus Control for Multi-Agent Systems Based on Event-Triggered and Prioritized Experience Replay Strategies. Sci. Chin. Inf. Sci. 2025, 68, 306–321. [Google Scholar] [CrossRef]
- Xiao, W.; Chen, J.; Yu, T.; Pan, Z.; Wu, Y.; Luo, Q. Post-Disaster Power Supply Restoration Decision-Making Method for Distribution Networks Based on Expert Knowledge Embedded Reinforcement Learning. Autom. Electr. Power Syst. 2025, 1–18. [Google Scholar]
- Huang, W. Distribution network reconfiguration for short-term voltage stability enhancement: An efficient deep learning approach. IEEE Trans. Smart Grid 2021, 12, 5385–5395. [Google Scholar] [CrossRef]
- Li, C.; Miao, S.; Sheng, W.; Zhang, D.; Hu, S. Optimization operation strategy of active distribution network considering dynamic network reconfiguration. Trans. Chin. Electr. Soc. 2019, 34, 3909–3919. [Google Scholar]
- Zhao, T.; Chen, B.; Zhao, S.; Wang, J.; Lu, X. A flexible operation of distributed generation in distribution networks with dynamic boundaries. IEEE Trans. Power Syst. 2020, 35, 4127–4130. [Google Scholar] [CrossRef]
- Tapetado, P.; Victoria, M.; Greiner, M.; Usaola, J. Exploring backup requirements to complement wind, solar and hydro generation in a highly renewable Spanish power system. Energy Strategy Rev. 2021, 38, 100729. [Google Scholar] [CrossRef]
- Zhang, T.; Yang, J.; Li, J.; Yang, Z.; Jin, K. Research on local consumption method of distributed photovoltaic generation for benefits of multi parties based on blockchain. Energy Rep. 2021, 7, 185–190. [Google Scholar] [CrossRef]
- Diaaeldin, I.M.; Aleem, S.H.E.A.; El-Rafei, A.; Abdelaziz, A.Y.; Zobaa, A.F. Optimal network reconfiguration in active distribution networks with soft open points and distributed generation. Energies 2019, 12, 4172. [Google Scholar] [CrossRef]
- Khan, M.O.; Wadood, A.; Abid, M.I.; Khurshaid, T.; Rhee, S.B. Minimization of network power losses in the AC-DC hybrid distribution network through network reconfiguration using soft open point. Electronics 2021, 10, 326. [Google Scholar] [CrossRef]
- Jian, J.; Li, P.; Yu, H.; Ji, H.; Ji, J.; Song, G.; Yan, J.; Wu, J.; Wang, C. Multi-stage supply restoration of active distribution networks with SOP integration. Sustain. Energy Grids Netw. 2022, 29, 100562. [Google Scholar] [CrossRef]
- Kumar, M.; Nallagownden, P.; Elamvazuthi, I. Optimal placement and sizing of renewable distributed generations and capacitor banks into radial distribution systems. Energies 2017, 10, 811. [Google Scholar] [CrossRef]
- Ren, C.; Liu, L.; Zhou, J.; Shi, S.; Tian, S.; Fu, Y. Two-stage robust optimization operation for active distribution network based on soft open point. Mod. Electr. Power 2021, 38, 610–619. [Google Scholar]
- Ru, Q.; Mi, X.; Song, Z.; Liu, J.; Lei, X. Hybrid time-scale robust optimization of active distribution networks considering energy storage and intelligent soft open points. Chin. Electr. Power 2022, 55, 129–139. [Google Scholar]
- Oh, S.H.; Yoon, Y.T.; Kim, S.W. Online reconfiguration scheme of self-sufficient distribution network based on a reinforcement learning approach. Appl. Energy 2020, 280, 115958. [Google Scholar] [CrossRef]
- Yan, D.; Peng, G.; Gao, H.; Chen, S.; Zhou, Y. Topology control of distribution networks based on combinatorial optimization with deep reinforcement learning. Power Syst. Technol. 2022, 46, 2547–2554. [Google Scholar]
- Zhou, N.; Mo, F.; Xiao, S.; Gu, F.; Lei, C.; Wang, Q. Coordinated transfer optimization considering topological constraints of multi-voltage distribution networks. Proc. CSEE 2021, 41, 3106–3115. [Google Scholar]
- Sutton, R.S.; Barto, A.G. Reinforcement Learning: An Introduction. IEEE Trans. Neural Netw. 2005, 16, 285–286. [Google Scholar] [CrossRef]
- Mnih, V.; Kavukcuoglu, K.; Silver, D.; Rusu, A.A.; Veness, J.; Bellemare, M.G.; Graves, A.; Riedmiller, M.; Fidjeland, A.K.; Ostrovski, G.; et al. Human-level control through deep reinforcement learning. Nature 2015, 518, 529–533. [Google Scholar] [CrossRef]
- Pamshetti, V.B.; Singh, S.; Thakur, A.K.; Singh, S.P. Multistage coordination volt/VAR control with CVR in active distribution network in presence of inverter-based DG units and soft open points. IEEE Trans. Ind. Appl. 2021, 57, 2035–2047. [Google Scholar] [CrossRef]
- Xiong, Z.; Miao, H.; Zeng, C. Operation optimization of active distribution network based on smart soft open point and energy storage system. Electr. Meas. Instrum. 2020, 57, 33–39. [Google Scholar]
- Zhang, J.; Liu, Q.; Li, Y.; Chen, Y.; Jiang, H. Optimal allocation of distributed generation considering intelligent soft open points. J. Power Supply 2025, 1, 1–12. [Google Scholar]
- Li, C.; Ye, Y.; Chen, L.; Tang, B. Two-stage reactive power optimization of distribution network considering regulation capability of intelligent soft open points and distributed generation. Power Supply 2020, 37, 67–72. [Google Scholar]


Disclaimer/Publisher’s Note: The statements, opinions and data contained in all publications are solely those of the individual author(s) and contributor(s) and not of MDPI and/or the editor(s). MDPI and/or the editor(s) disclaim responsibility for any injury to people or property resulting from any ideas, methods, instructions or products referred to in the content. |
© 2025 by the authors. Licensee MDPI, Basel, Switzerland. This article is an open access article distributed under the terms and conditions of the Creative Commons Attribution (CC BY) license (https://creativecommons.org/licenses/by/4.0/).