Abstract
In the context of electricity and carbon markets, with the in-depth research of virtual power plants and to realize the mutual assistance of electric energy in different regions within the same distribution network, a scheduling strategy of virtual power plant alliance based on dynamic electricity and carbon pricing using the Master–Slave game is proposed. Firstly, an interactive framework of virtual power plant alliance is designed in which the alliance operator formulates the electricity and carbon prices, and each user entity formulates the operation plan according to the prices. Secondly, the information gap decision theory is adopted to handle the uncertainties on the source–load side. Based on the Master–Slave game and source–load interaction, an economic optimal dispatching model for the virtual power plant alliance is established. Finally, the particle swarm optimization algorithm nested with the CPLEX solver is used to solve the model, and the rationality and effectiveness of the proposed strategy are demonstrated through case analysis. The simulation results show that, after considering the electricity energy interaction and dynamic electricity–carbon pricing, the daily operation cost of the virtual power plant alliance was reduced by 47.7%, carbon emissions decreased by 24.6%, and comprehensive benefits increased by 77.2%.
1. Introduction
In the wake of the proposal of the “Carbon Peaking and Carbon Neutrality Goals”, the advancement of renewable energy sources, such as wind and solar power, has emerged as an absolute imperative. However, the large-scale integration of new energy into the power grid is detrimental to the safe and stable operation of the power system. In a distribution network containing a substantial amount of distributed energy resources, a virtual power plant (VPP) [1,2,3] is able to integrate multiple flexible resources such as distributed generators, loads, and energy storage systems and optimize them cooperatively. A VPP can also make efficient use of a variety of energy sources. The information and energy interaction among multiple VPPs to form a virtual power plant alliance (VPPA) is more conducive to the absorption of new energy and the safe and secure operation of the power grid.
In the VPPA, individuals usually belong to different interest entities. In terms of energy and information interaction, researchers mostly use methods such as the Master–Slave game [4], cooperative game [5], and non-cooperative game [6]. In reference [7], Cao, J et al. proposed a two-stage economic scheduling strategy, thereby effectively reducing the difference between peak and trough values of the VPP and improving the economic benefits. In reference [8], considering the benefit distribution among user entities, a hybrid game strategy of multi-prosumers in a VPP based on energy sharing was put forward. In reference [9], Duan Meimei proposed a Master–Slave game strategy of VPP based on time-of-use electricity–carbon coupling pricing on the basis of dynamic electricity and carbon prices. In reference [10], Ma Yue et al. proposed an economic scheduling approach for multi-microgrid systems that relies on the Master–Slave game, realizing the mutual assistance of electric energy among multiple microgrids with different interest entities in the same region. In reference [11], a method for distributing electricity–carbon benefits based on contribution was constructed, and the interests of VPP entities were reasonably distributed. In reference [12], Li Peng et al. proposed an allocation strategy for multi-microgrid energy systems based on the negotiation game considering electric energy interaction, reducing the operation cost and improving system benefits. In reference [13], Zhou Jianhua et al. proposed a low-carbon economy operation scheduling strategy suitable for integrated energy systems, effectively reducing the operation cost and carbon trading cost. In reference [14], an optimization scheduling model of multi-microgrid systems considering electric vehicles coordinated charging and incentive-step carbon trading was constructed, further reducing the operation cost and carbon emissions of multi-microgrid systems. In reference [15], the genetic algorithm was used to solve the operation strategy of the electricity–gas coupled VPP considering carbon trading, verifying the effectiveness in economic and low-carbon operation. In reference [16], a distributed resource collaborative optimization scheduling model of one leader and multiple followers was constructed, reducing the system operation cost. In reference [17], taking the system operator as the leader and the users participating in demand response as the followers, an optimization scheduling method for integrated energy systems of one leader and multiple followers was constructed. In reference [18], taking multiple energy stations as the leaders, a distributed resource operation strategy of multiple leaders and multiple followers was constructed. In references [19,20], a carbon trading mechanism considering carbon capture technology was constructed, effectively reducing the carbon emissions of the VPP. In references [21,22], the carbon trading mechanism was introduced into nuclear power units and user electricity consumption behaviors, respectively, realizing the low-carbon operation of the VPP. In reference [23], an electricity–carbon integrated trading model was established, effectively improving the economic and low-carbon operation of the VPP. In references [24,25], the energy-carbon P2P joint trading mechanisms of park multi-microgrids and building communities were established, respectively, improving economic benefits. The authors of [26] constructed a power system scheduling method considering electric vehicles in the VPP, which effectively reduces the system peak–valley difference. References [27,28,29] established an electricity–carbon coupling trading mechanism for multi-microgrid systems, effectively reducing carbon emissions and enhancing the energy absorption rate. However, most of the above references only considered the impact of electricity price on the energy trading of the VPPA, and few scholars considered the impact of carbon price in the carbon market on the optimal operation of the alliance system.
In conclusion, based on the above research, this paper proposes an optimal scheduling strategy for the VPPA based on the Master–Slave game with dynamic electricity and carbon pricing. The alliance operator, as the upper-level leader, formulates the electricity and carbon prices with the goal of maximizing its own interests. Each VPP user entity, as the lower-level follower, receives the prices transmitted from the upper level and formulates the operation plan of each unit with the goal of minimizing the operation cost. Considering the uncertainties of the new energy output and load side, optimization scheduling is carried out based on the information gap decision theory (IGDT). To obtain the equilibrium solution of the game strategy, this paper uses the particle swarm optimization algorithm nested with the CPLEX solver to solve the problem and verifies the effectiveness of the proposed strategy through a case analysis.
2. Energy Transaction Structure of VPPA
2.1. Operation Structure of VPPA
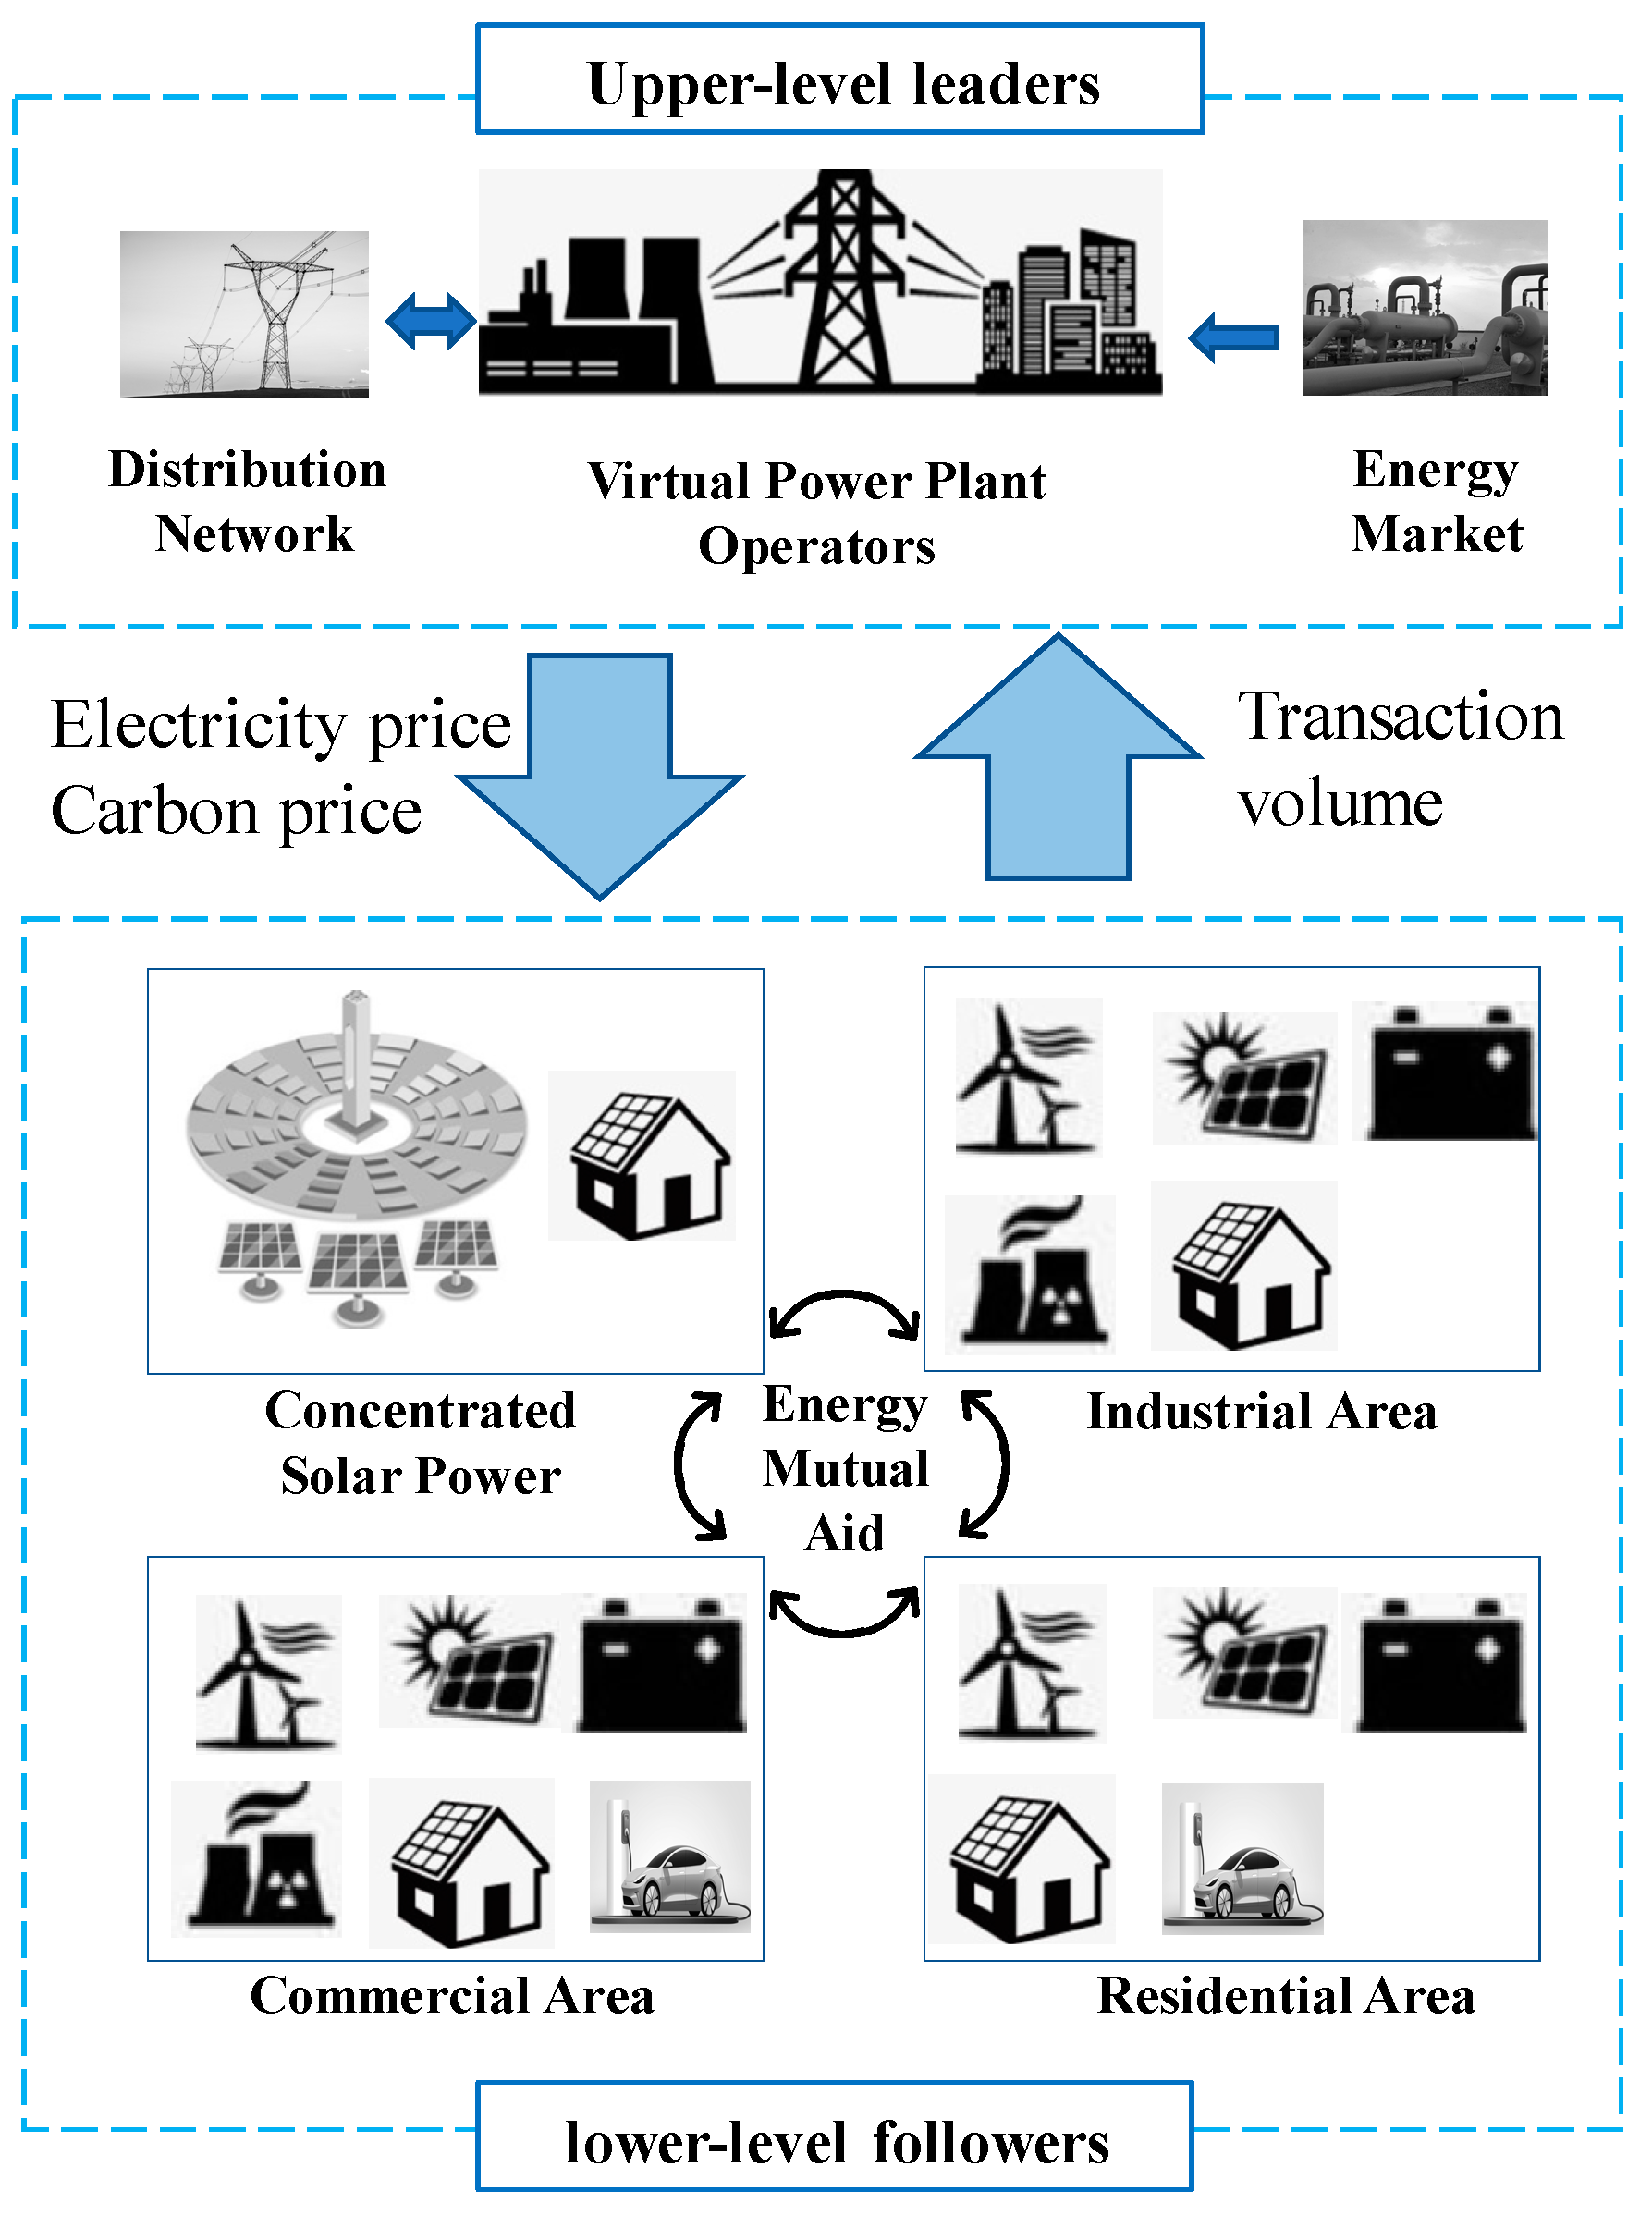
The energy interaction structure diagram of the VPPA is shown in Figure 1, including the distribution network, the VPP alliance operator, and multiple VPP user entities. All entities in the alliance consider both electrical and thermal loads. The alliance can purchase thermal energy and natural gas from the external energy market, and the electrical energy can interact with the distribution network in terms of power. To realize the complementarity of electrical energy in time, space, and region within the alliance, the system is equipped with a concentrated solar power (CSP) station, an industrial area, a commercial area, and a residential area. Among them, the commercial area and the residential area are equipped with Vehicle-to-Grid (V2G) charging stations. The CSP station has high-efficiency and flexible dispatchability and can significantly reduce the carbon emissions within the alliance. Other areas aggregate wind power, photovoltaic power, gas turbines, gas boilers, thermal exchangers, and electrical and thermal energy storage. Due to the randomness of new energy output and the uncertainty of the load side, there will be electricity purchase and sales needs during system operation. By setting reasonable transaction prices, energy transactions among the VPP are encouraged first. When the internal electricity purchase and sales demand are unbalanced, transactions with the distribution network are carried out to meet the supply and demand balance. This structure has a wide coverage, strong scalability, and strong universality.
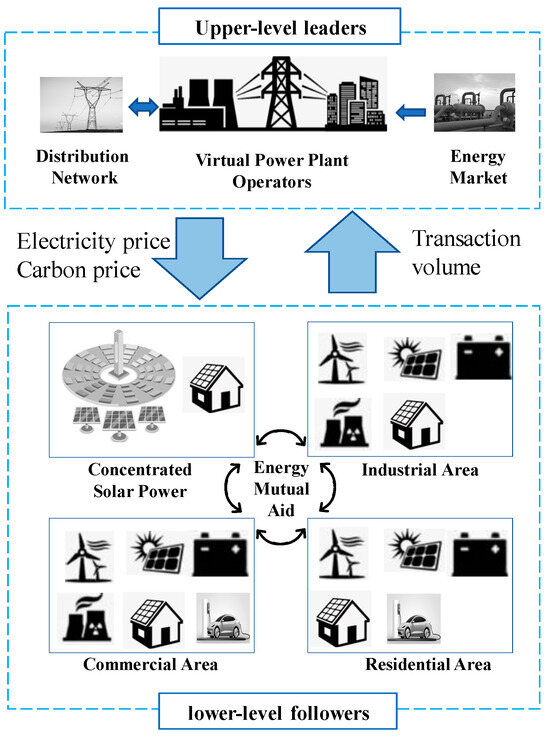
Figure 1.
VPPA energy interaction structure.
2.2. Types of Graphics
2.2.1. Mathematical Model of CSP Station
The CSP station is equipped with a thermal storage tank that achieves the complementarity of energy in time and space and is able to effectively lower the carbon emissions of the VPPA.
In the formula, represents the thermal energy gathered by the solar field collector at time t; represents the photothermal conversion efficiency of the CSP station; represents the effective area of the solar field concentrator; represents the light intensity at time t; represents the electrical energy generated by the CSP station at time t; represents the conversion efficiency of thermal energy to electrical energy of the CSP station; represents the thermal energy consumed by the CSP unit for power generation at time t; and represent the thermal energy consumed by the CSP unit for power generation at time t and t − 1, respectively; represents the self-loss rate of thermal energy of the thermal energy storage system; and represent the thermal energy storage and release efficiencies of the thermal energy storage system, respectively; and and represent the thermal energy storage and release powers of the thermal energy storage system at time, respectively.
2.2.2. The Mathematical Model of the Energy Storage System
The energy storage system stores surplus energy and releases it when there is a shortage, playing a role of “peak shaving and valley filling”.
In the formula, the energy storage system includes electrical energy storage (EES) and thermal energy storage (TES). Take EES as an example: and represent the capacities of the energy storage device in the VPP (the i virtual power plant) at time t and t − 1, respectively; , , and represent the energy loss coefficient and energy charging and discharging efficiencies of the EES in the VPP, respectively; and represent the charging and discharging powers of the EES in the VPP, respectively; and represent the initial and end storage capacities of the energy storage device in the VPP, respectively; and represent the maximum charging and discharging powers of the EES in the VPP, respectively; and represent the minimum and maximum storage capacities of the EES, respectively; and , , and are binary variables, representing the charging, discharging, and stationary states of the EES in VPP at time t, respectively.
2.2.3. Mathematical Model of Electric Vehicle
In the formula, is a 0–1 variable representing the grid-connected and off-grid states of the electric vehicle (EV) at time t; 0 means off-grid, and 1 means grid connected; is the power of the EV at time t; positive power indicates charging, and negative power indicates discharging; is the maximum charging (discharging) power of the EV in time period t; is the battery energy of the EV in time period t; is the total capacity of the EV battery; and are the upper and lower limits of the state of charge of the EV battery, respectively; is the minimum required value of the state of charge of the EV battery when leaving the charging station; is the charging and discharging coefficient of the EV; and is the power when the EV is running.
2.2.4. Mathematical Model of Other Equipment
The mathematical models of the wind turbine (WT), photovoltaic (PV) power, gas turbines (GT), and gas boilers (GB) have been relatively well established and will not be elaborated on here.
3. Master–Slave Game Model
3.1. Interaction Mechanism of Master–Slave Game
This paper proposes an optimal scheduling strategy of the VPPA using the Master–Slave game, with the alliance operator as the leader and VPP user entities as the follower. The alliance operator formulates the electricity and carbon prices according to its own interests, and each VPP user entity accepts the electricity and carbon prices and conducts demand response with the goal of minimizing the operation cost to adjust the operation plan of the units. The alliance operator and VPP user entities form a one-leader–multiple-followers game model.
3.2. Scheduling Model of Alliance Operator
3.2.1. Objective Function
The alliance operator, as the upper-level leader, transmits the formulated electricity and carbon prices to the lower-level entities and obtains benefits through the electricity purchase and sales between the distribution network and VPP. The objective function is established to maximize comprehensive benefits.
In the formula, and represent the electricity purchase and sales amounts of the distribution network to the VPP; positive values represents electricity purchase, while negative values represent electricity sales; and represent the electricity purchase and sales prices of the distribution network to the VPP; represents the carbon emissions of the VPP; represents the carbon price at time t; n = 4; and T = 24.
3.2.2. Power Transmission Constraint
The electricity purchase and sales balance constraint:
In the formula, is the total electrical energy traded by the VPP entity with the distribution network; is the total electrical energy traded after summarizing all the internal electricity purchase and sales amounts of the VPP; and and represent the electricity purchase and sales amounts of the VPP with other VPPs in the alliance, respectively. Positive values represent electricity purchase, and negative values represent electricity sales.
3.3. C. Scheduling Model of VPP User Entity
3.3.1. Objective Function
The VPP user entity, as the lower-level follower, receives the electricity and carbon price information transmitted from the upper level, flexibly adjusts the operation plan of the units inside the VPP, and establishes the objective function to minimize its operating cost.
In the formula, represents the operation and maintenance cost of the VPP; represents the gas purchase cost of the VPP; represents the electricity energy interaction cost within the alliance; represents the environmental cost of the VPP; and represents the compensation cost for users of the VPP participating in the electric and thermal demand response.
- Operation and maintenance cost:
In the formula, , , , , , and represent the operation and maintenance cost coefficients of the WT, PV, CSP, GT, GS, and energy storage devices, respectively; , , , and represent the output powers of the WT, PV, GT, GS, and other equipment, respectively.
- 2.
- Gas purchase cost:
In the formula, is the calorific value of natural gas; is the purchase price per unit of natural gas; is the power generation efficiency of the GT; and is the heating efficiency of the GB.
- 3.
- Electricity energy interaction cost:
In the formula, represents the interaction cost between the VPP and the distribution network; represents the interaction cost between the VPP and other VPPs at time t.
- 4.
- Environmental cost:
In the formula, and represent the emission coefficients of pollutants generated; represents the penalty price; and K includes pollution gases such as COX, SO2, and NOX.
- 5.
- Electric and thermal demand response cost:
In the formula, , , , and represent the compensation unit prices for users participating in the curtailable electric load, transferable electric load, curtailable thermal load, and transferable thermal load, respectively; , , , and represent the curtailable and transferable electric loads and the curtailable and transferable thermal loads, respectively.
3.3.2. Power Transmission Constraint
- Operation and maintenance cost:
In the formula, represents the maximum power transfer of the power tie-line between the distribution network and the VPP; and are 0–1 variables representing the electricity purchase and sales identifiers, respectively; and represents the maximum power transfer of the power interaction tie-line between VPPs.
- 2.
- Energy balance constraint:
In the formula, is the basic electric load, is the basic thermal load, is the thermal release power of the TES, and is the thermal charging power of the TES.
- 3.
- Electric and thermal integrated demand response constraint:
In the formula, and represent the electric and thermal loads of the VPP, respectively; and represent the maximum curtailable electric and thermal loads of the VPP, respectively.
4. VPPA Scheduling Model Based on IGDT
There is uncertainty in the output of new energy sources and load fluctuations. Methods such as stochastic optimization and robust optimization are often used to deal with them. Among them, stochastic optimization establishes the probability distribution of uncertain quantities and transforms the problem into several deterministic scenarios for solution [30]. However, it may lead to a large number of scenarios and low solution efficiency. Robust optimization describes uncertainty in the form of an uncertainty set and takes the worst-case scenario as the optimization object [31]. But it may also cause a large number of scenarios and low solution efficiency. The IGDT is a method suitable for describing uncertainty when the probability distribution is unknown. It can avoid the inefficient solution problems caused by the unknown probability distribution data and a large number of computational scenarios. While ensuring the robustness of the system, it also takes into account the economic efficiency of the system, and its solution results are not overly conservative [32].
According to the different attitudes of decision-makers towards risk expectation goals, the IGDT can be divided into two types, pessimistic and optimistic, corresponding to two scheduling strategies: the opportunity model (OM) and the robustness model (RM). The opportunity model believes that the uncertain parameters tend to develop in a favorable direction and is a risk-seeking scheduling strategy. On the contrary, the robustness model believes that the uncertain parameters tend to have an adverse effect on the preset goals and is a risk-averse scheduling strategy.
4.1. Opportunity Model of VPPA
In this paper, wind power and photovoltaics are selected as the uncertain parameters on the source side, and electric and thermal loads are selected as the uncertain parameters on the load side. Due to the existence of prediction errors, their actual values will fluctuate within a certain range of the predicted values. The fluctuation ranges are as follows.
In the formula, , , , , , and represent the actual values and predicted values of renewable energy output, electric load, and thermal load, respectively; , , and are deviation coefficients, representing the corresponding fluctuation amplitudes, respectively, and their values are related to the size of the prediction error.
The opportunity model pursues the benefits brought by uncertainty as much as possible. The new energy output is higher than the expected value and fluctuates within the range of . The actual load is lower than the predicted load and fluctuates within the ranges of and . The new energy output power can meet most of the loads, the output of conventional units is reduced, the carbon emissions are reduced, the electricity purchase amount of each user entity from the distribution network is reduced, and the system cost is reduced, resulting in an overall increase in profit. The opportunity model is as follows.
In the formula, represents the threshold of opportunity revenue, is the objective function value under the deterministic model, and represents the opportunity cost deviation factor. The larger is, the more optimistic the decision-maker is and the higher the expected profit is.
4.2. Robustness Model of VPPA
The value orientation of the robustness model is exactly opposite to that of the opportunity model. It tries to avoid the risks brought by uncertainty as much as possible. Under the scheduling strategy of this model, the new energy output is lower than the expected value and fluctuates within the range of . The actual load is higher than the expected load and fluctuates within the ranges of and . The new energy output power is reduced, the power deficit is borne by other conventional units, the system carbon emissions are increased, and the electricity purchase amount from the distribution network is also increased, resulting in an increase in system cost and a decrease in overall profit. The robustness model is as follows.
In the formula, represents the robust revenue threshold, and represents the robustness deviation factor. The larger is, the more pessimistic the decision-maker is and the lower the expected profit is.
5. Solution Process
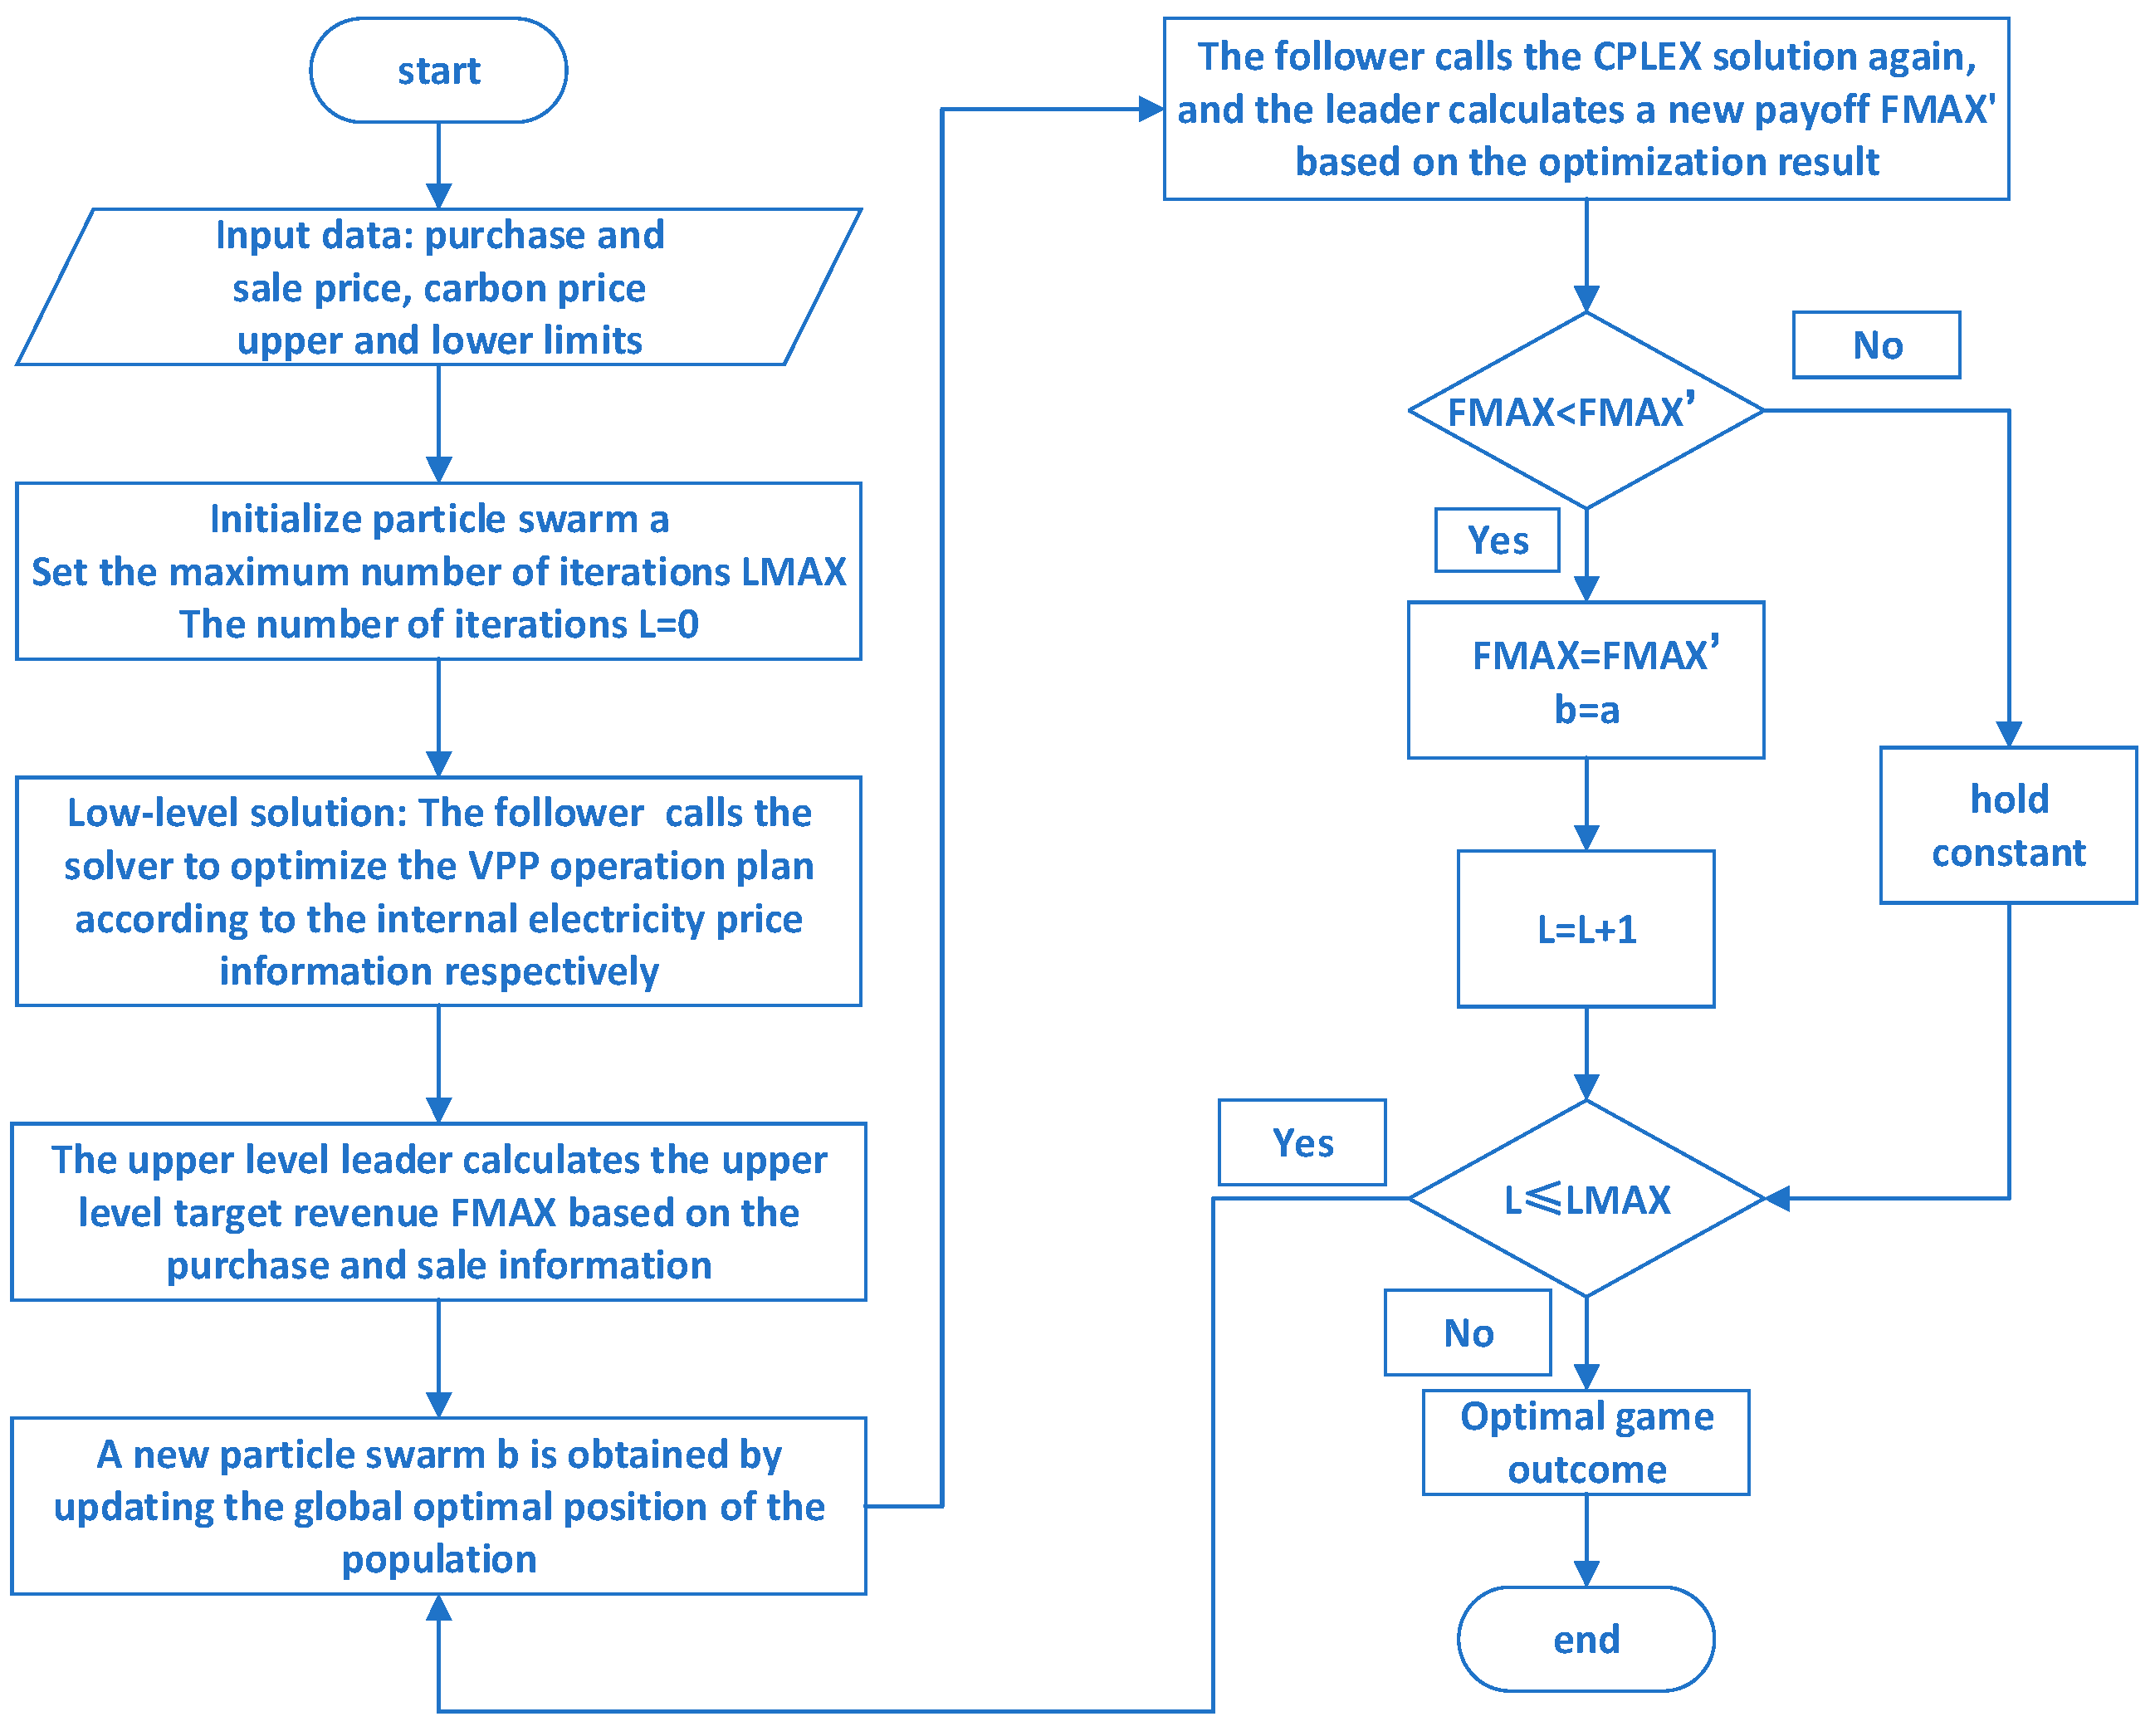
This paper uses the particle swarm optimization algorithm nested with the CPLEX solver to solve the established Master–Slave game model. The specific solution process is shown in Figure 2.
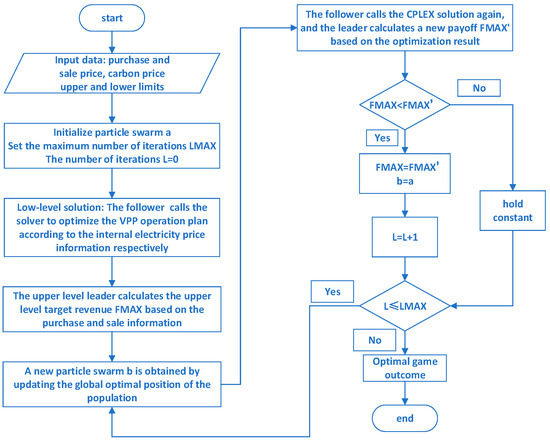
Figure 2.
Master–Slave game solving process.
The process of solving the optimal electricity and carbon prices includes two stages. The upper-level leader formulates prices within the upper and lower limits of electricity and carbon prices and uses the particle swarm optimization algorithm to solve with the goal of maximizing the comprehensive benefits. The lower-level follower formulates the operation plan of each unit with the goal of minimizing the cost according to the prices transmitted from the upper level, uses the CPLEX solver to solve, and then transmits the operation plan to the upper level. The two stages have a sequential order and influence each other, cyclically iterating until the Stackelberg equilibrium is reached.
6. Comparative Analysis of Numerical Examples
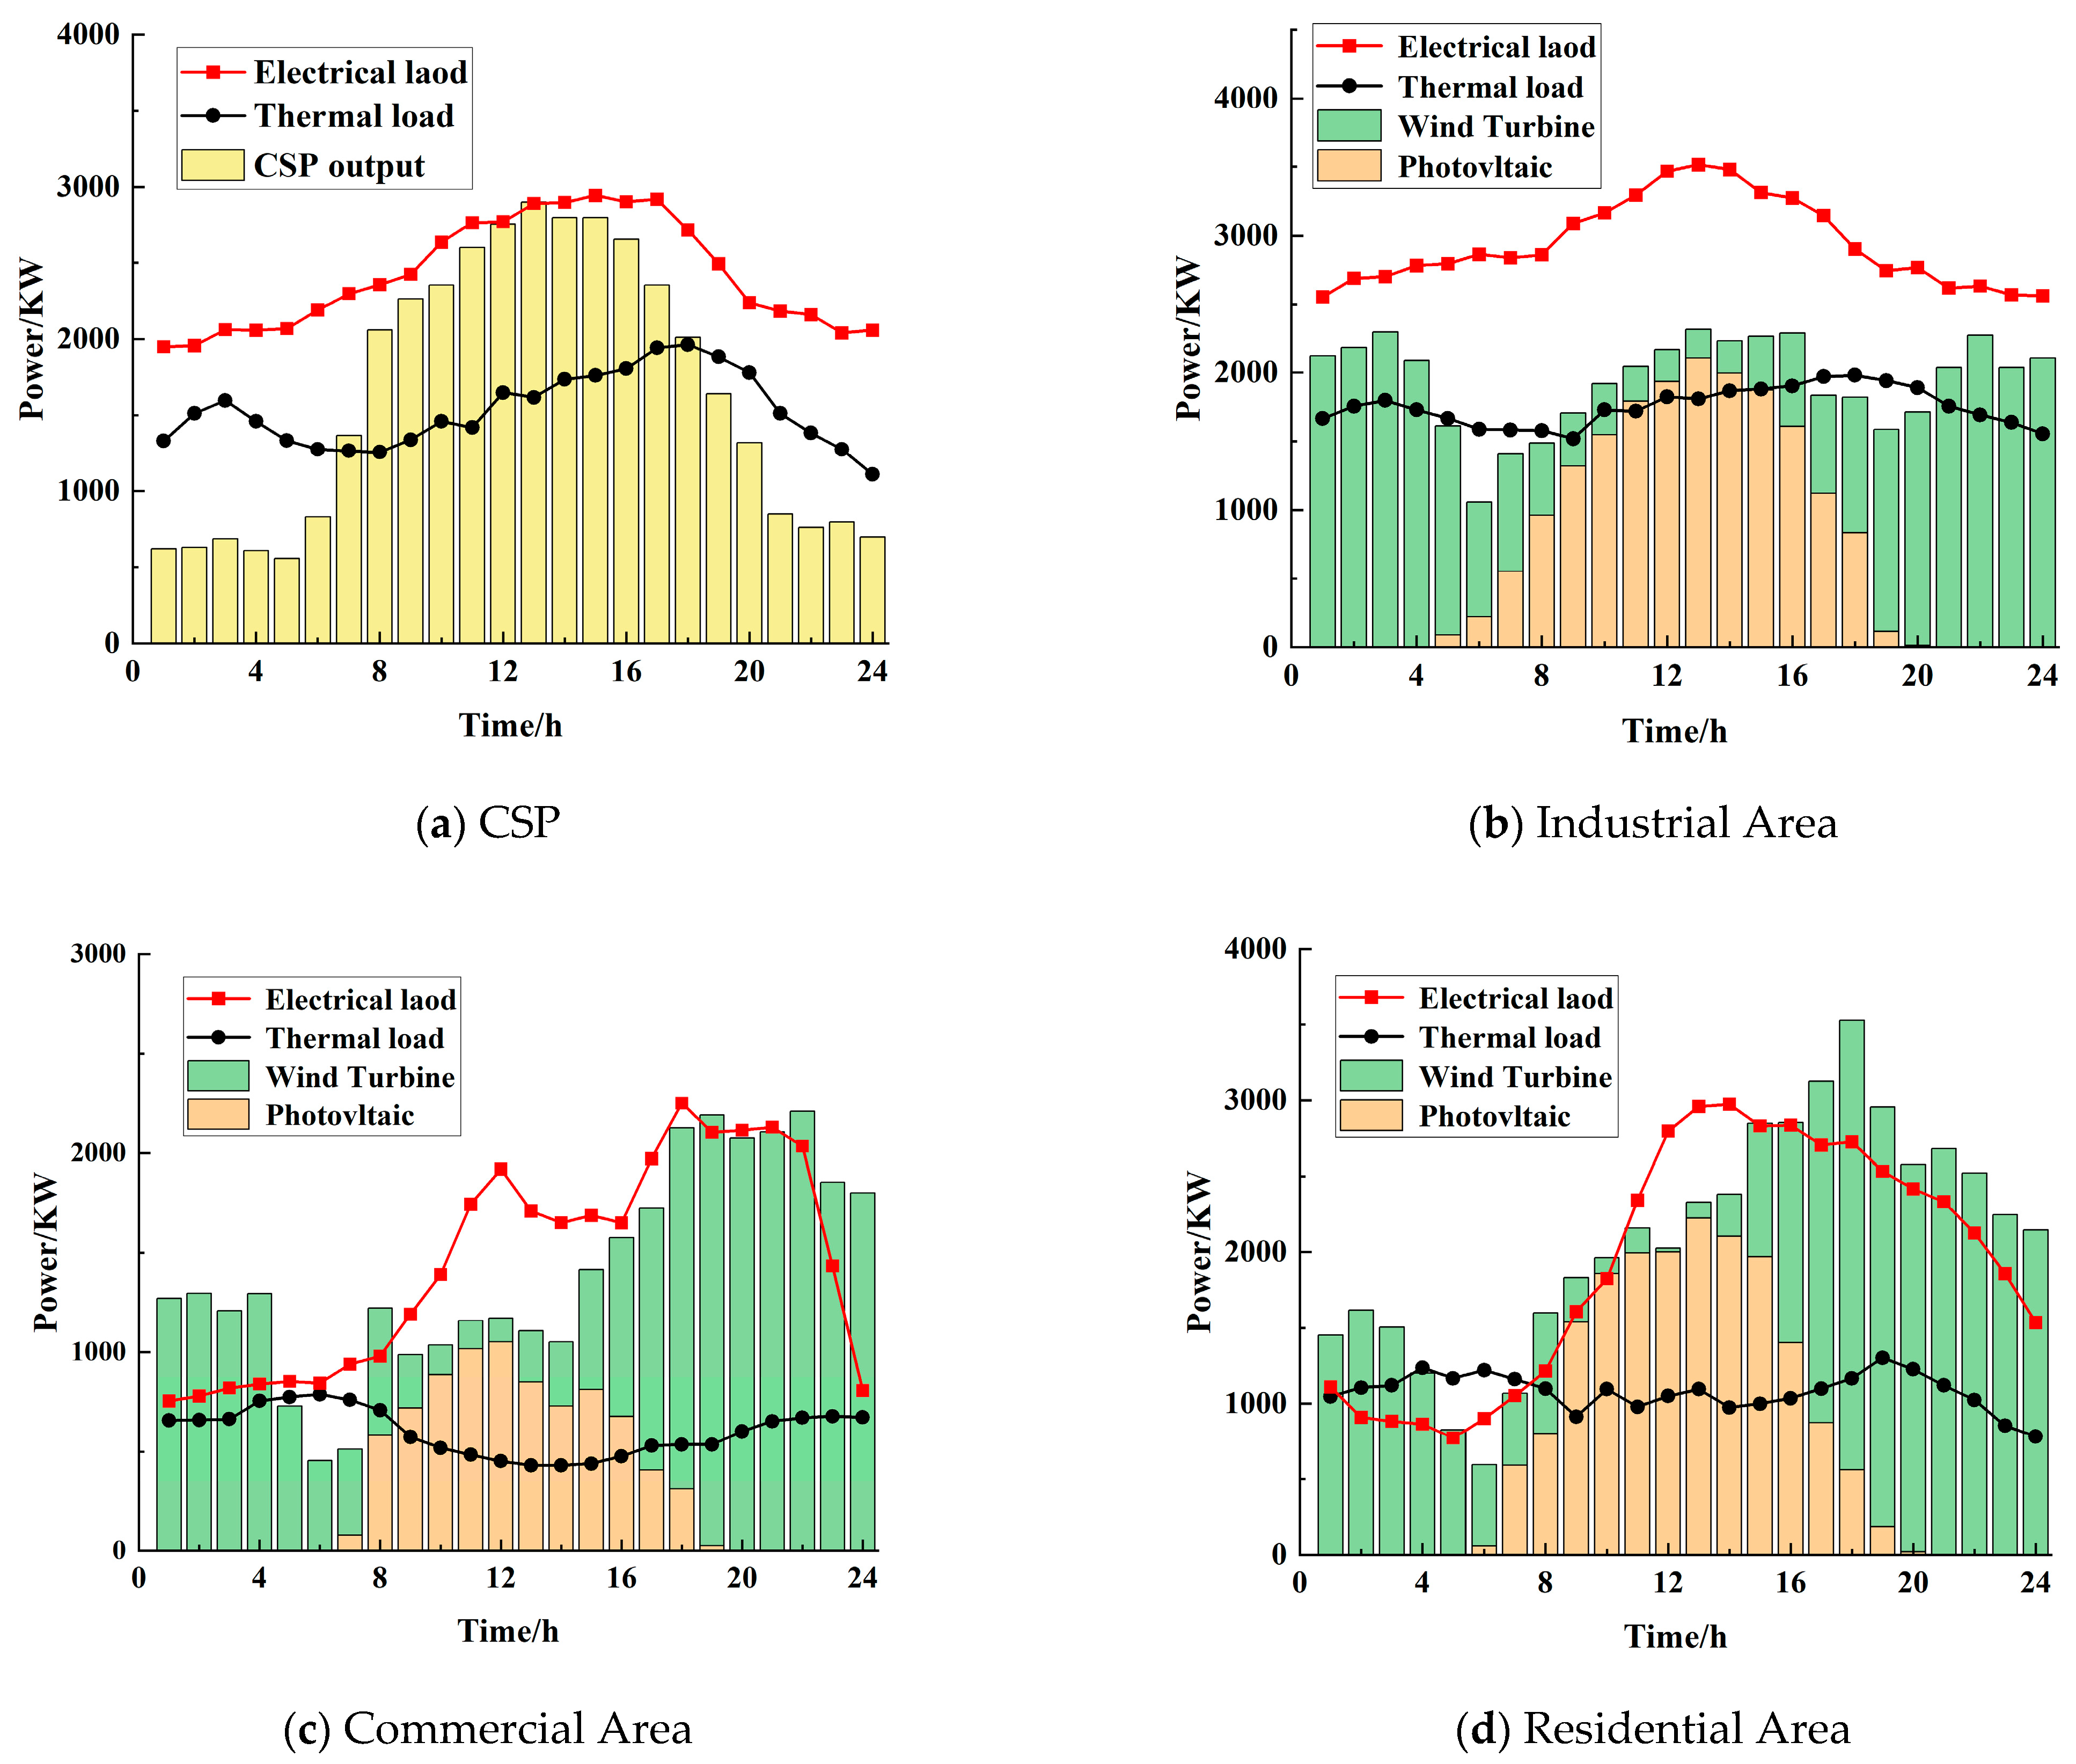
In this chapter, an alliance operator and four VPP user entities are taken as an example to verify the soundness and utility proposed by the VPPA optimization scheduling strategy while considering electricity and carbon prices regarding carbon emissions and economy. The load demands and the predictions of new energy output of each VPP in the VPPA are shown in Appendix A. The parameters of the energy device are presented in Appendix B.
6.1. An Analysis of the Conclusions of the Master–Slave Game
After performing a calculation using the particle swarm optimization algorithm nested with the CPLEX solver, the optimization results tend to converge after 40 iterations. The results of the first 50 iterations are shown in Table 1. As the number of iterations gradually increases, the operation costs and carbon emissions of the VPP gradually decrease, while the interaction amount increases. When the number of iterations reaches 30, the revenue of the alliance operator tends to decrease. This is because as the interaction amount among the VPP continuously increases, the electricity purchase amount from the distribution network decreases, which also reflects the game process.

Table 1.
Iterative process of solving.
6.2. Analysis of Optimization Scheduling Results
The calculated optimal electricity and carbon prices when the Stackelberg equilibrium is reached are shown in Figure 3. During the period from 06:00 to 09:00, there is an overall power shortage in the alliance. A higher electricity purchase price encourages VPP user entities to prioritize electricity interaction and then purchase electricity from the distribution network. During the period from 20:00 to 24:00, the WT is greater than the electricity demand, and electricity needs to be sold to the distribution network. A higher electricity price can enable the alliance operator to obtain greater benefits. During the period from 12:00 to 18:00, the electricity among VPPs is basically self-sufficient. The alliance can purchase electricity at a price lower than the grid’s electricity purchasing price and sell electricity at a price higher than the grid’s electricity selling price, prioritizing promoting the internal resource consumption.
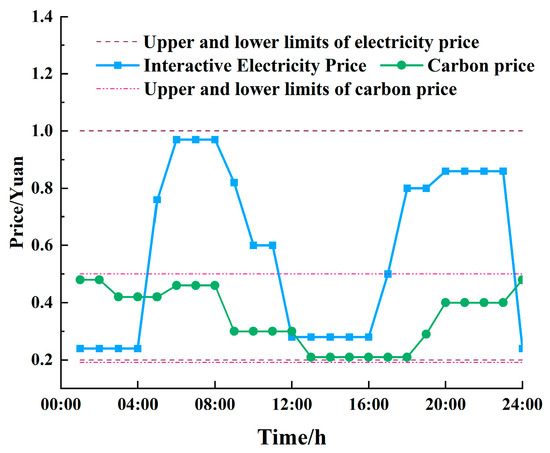
Figure 3.
Optimal dynamic electricity and carbon prices.
A higher carbon price can limit the output of conventional units, such as gas turbines, and encourage the enhancement of new energy electricity interaction among VPP user entities, reducing carbon emissions and playing a role in environmental protection. Taking the period from 05:00 to 08:00 as an example, when the WT and PV are unstable and insufficient to meet the electricity demand, the output of conventional units such as gas turbines is required as a supplement. To reduce its carbon emissions, the alliance operator sets a higher carbon price to encourage each user entity to purchase electricity and thermal energy directly from the energy market. During the period from 13:00 to 18:00, there is a surplus of electricity in the alliance, and a lower carbon price can encourage the alliance to sell electricity outward to obtain benefits.
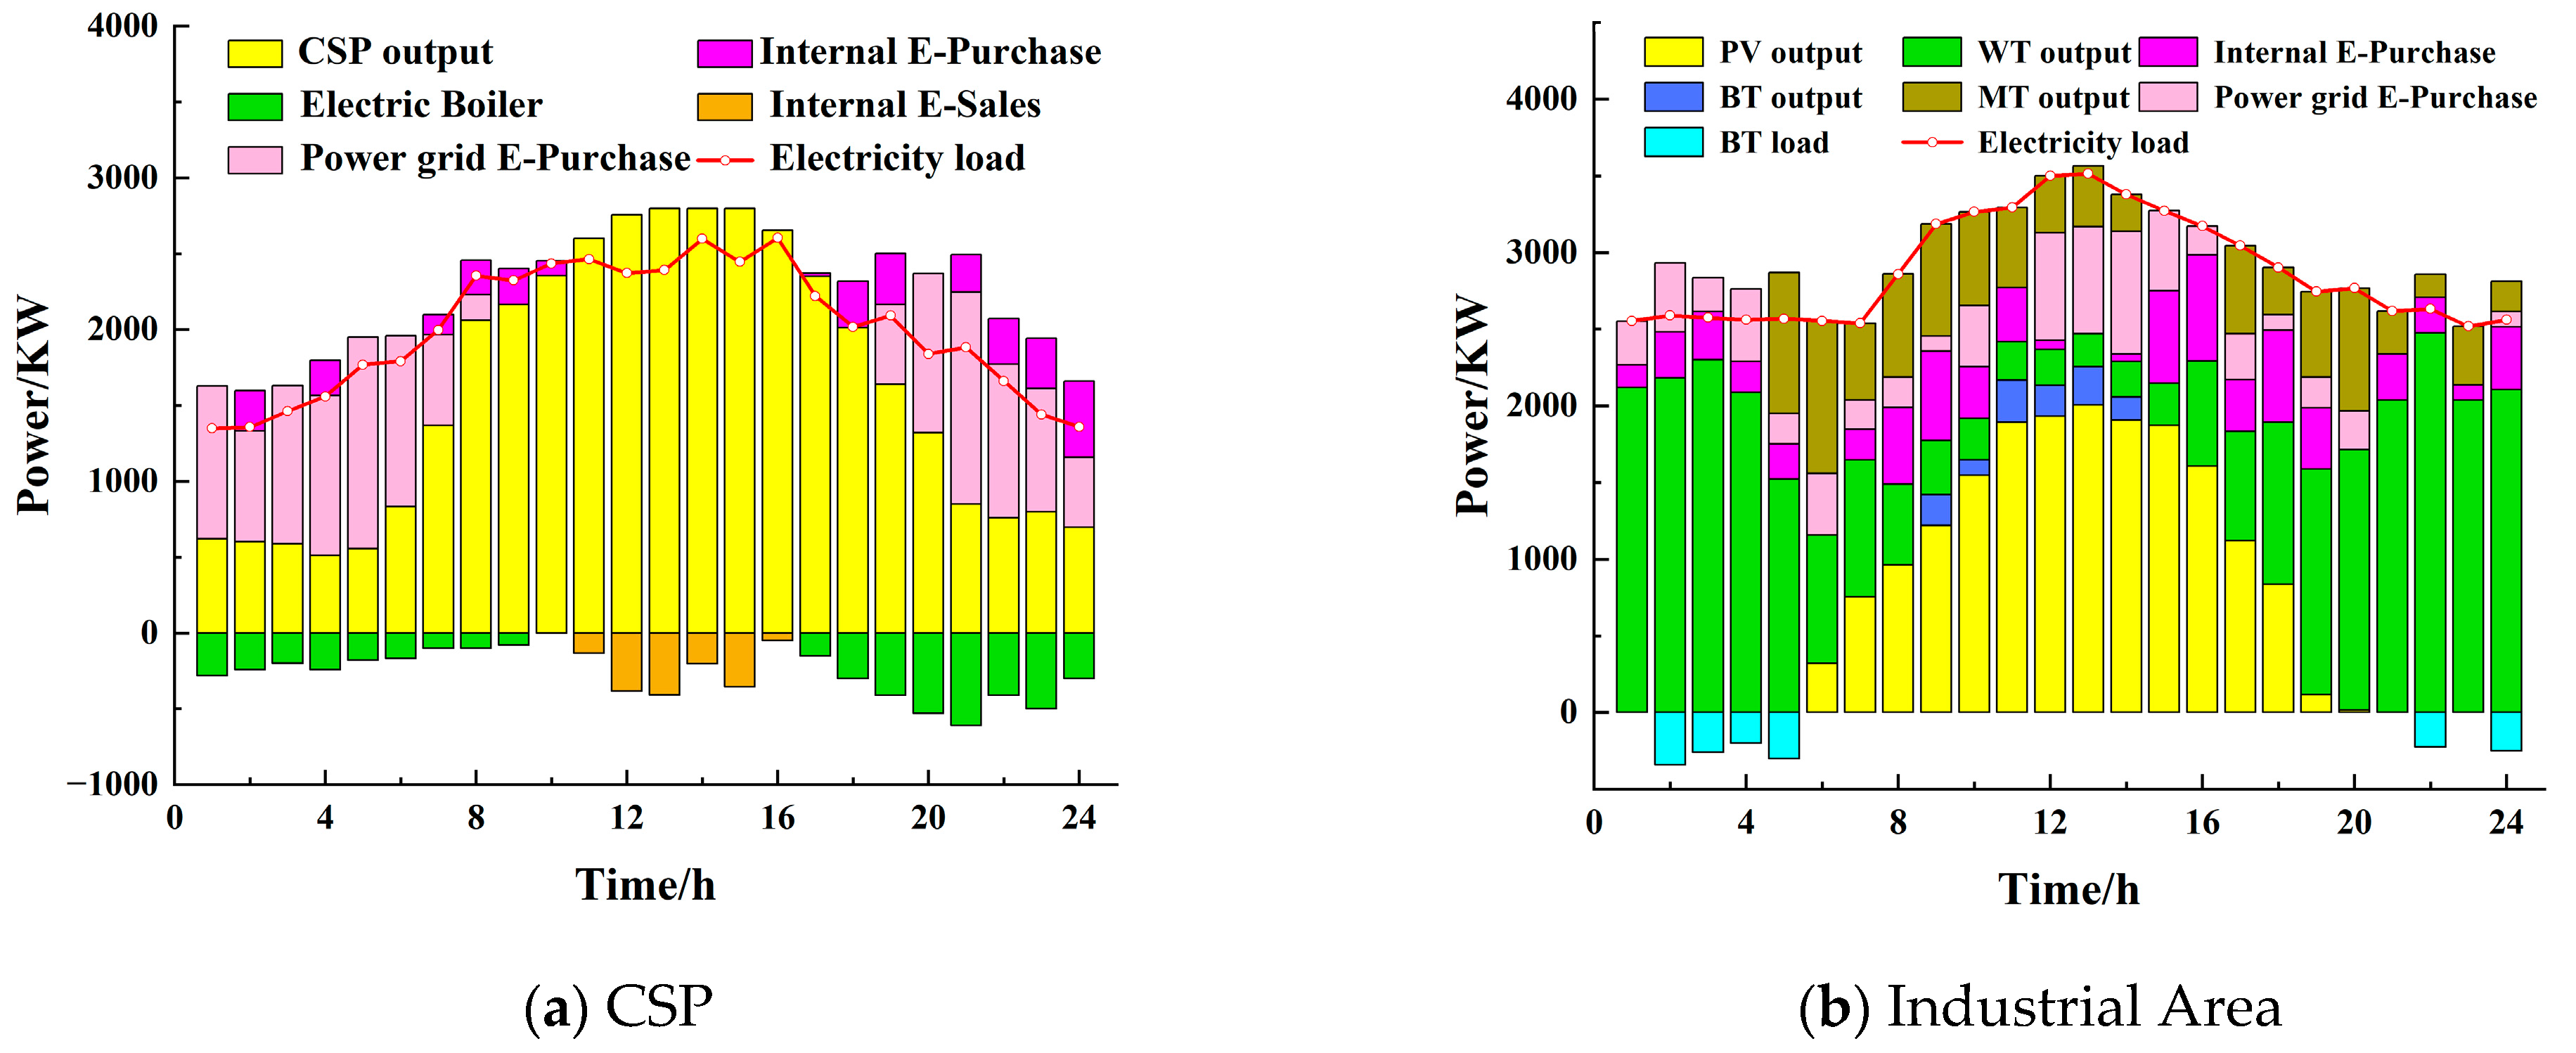
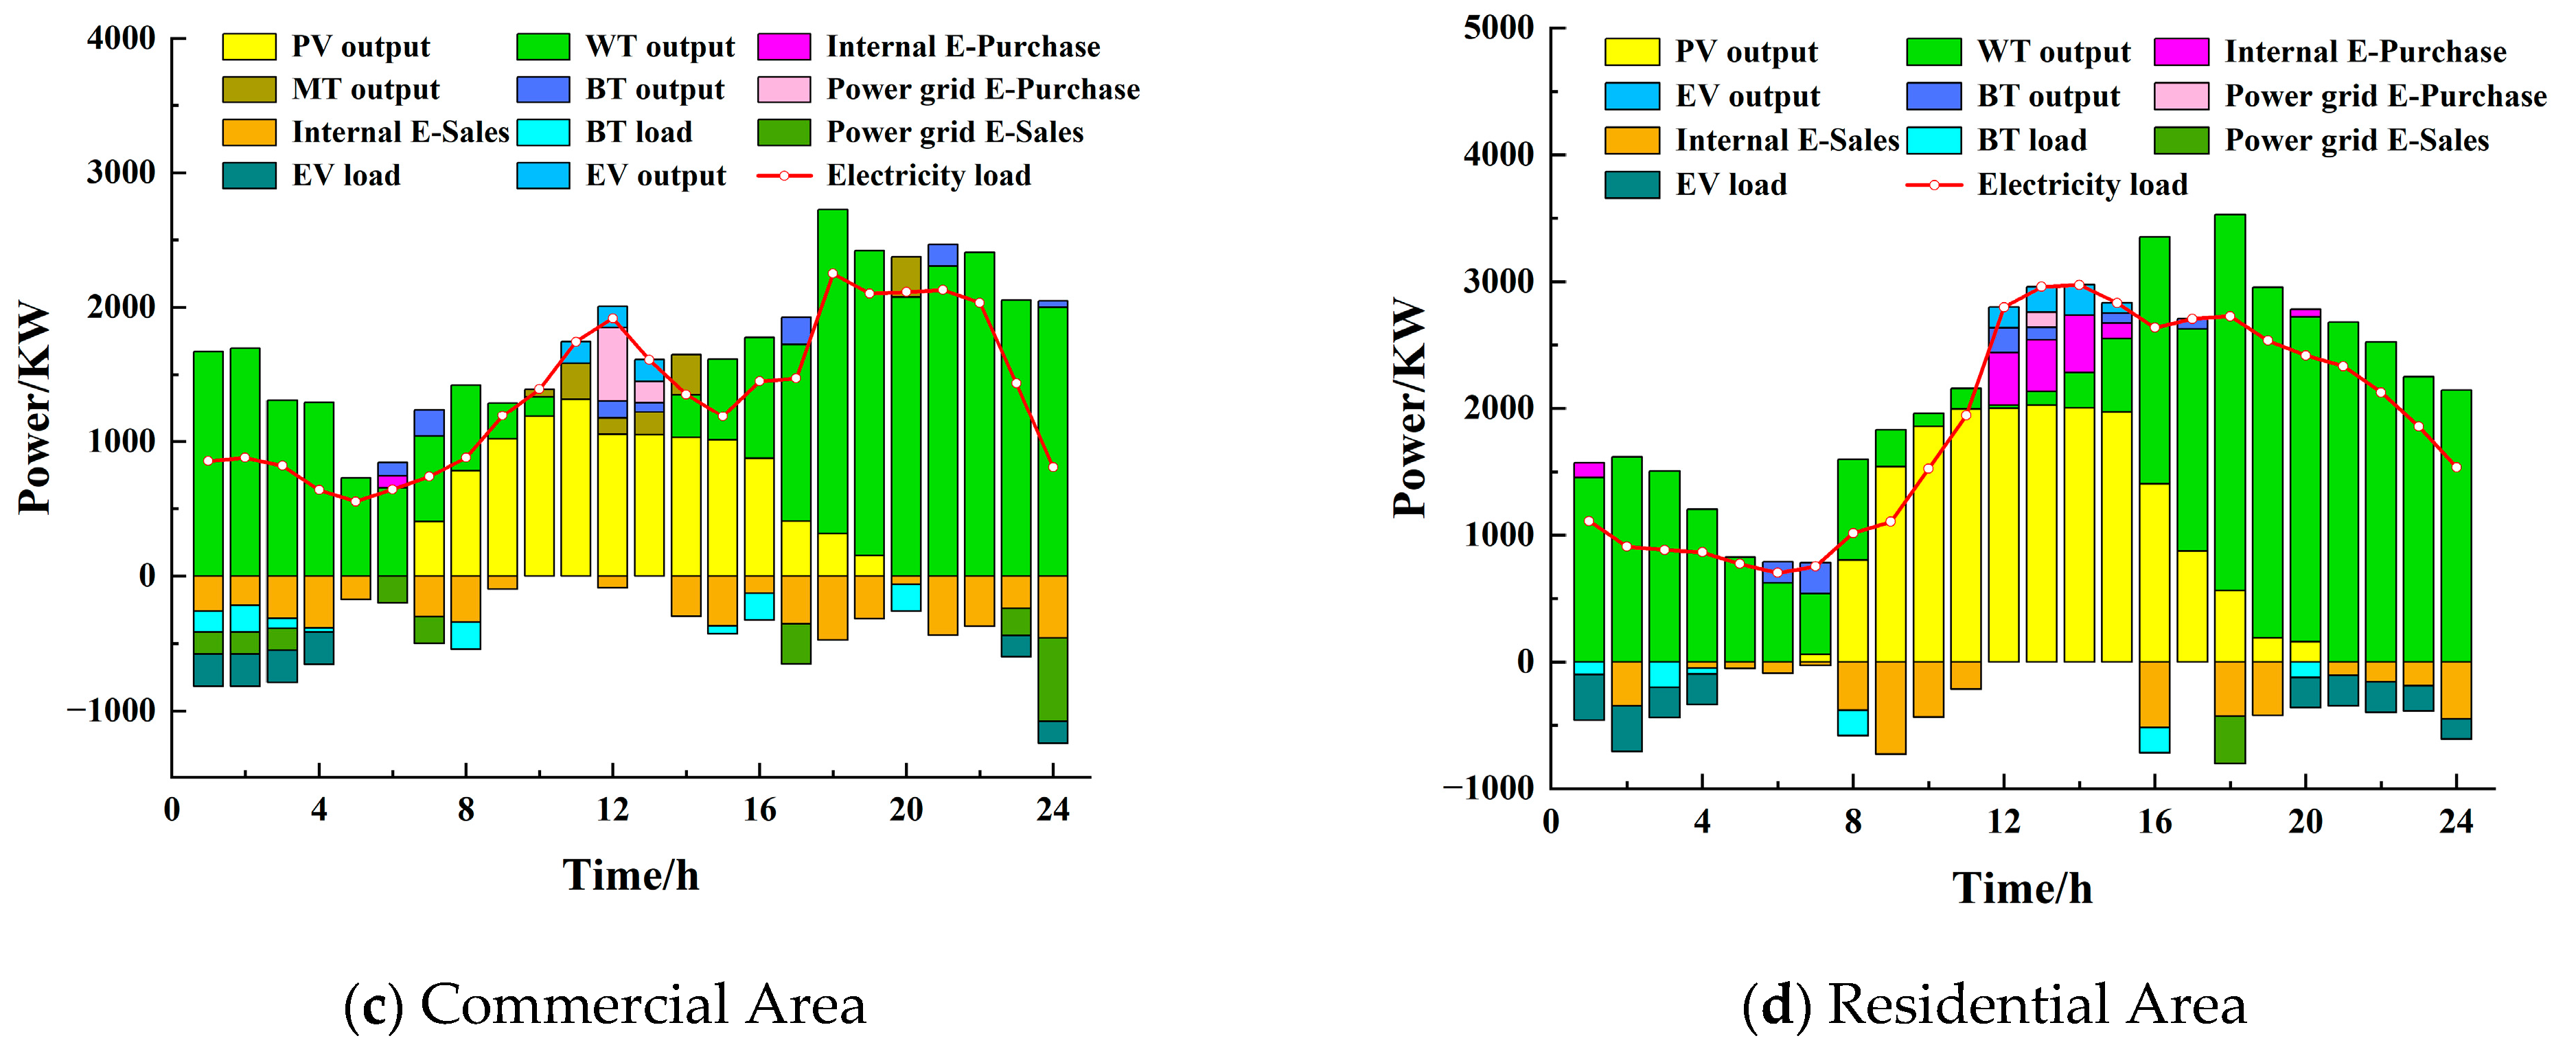
The dispatch power of the VPPA is shown in Figure 4. Taking the commercial area as an example, we conducted an analysis of the operation plan of the VPP. From 22:00 to 04:00, there is a large amount of surplus wind power, meaning the surplus electricity can be sold to other users in the alliance or part of the electricity can be sold to the distribution network to obtain benefits. From 08:00 to 13:00, due to the small photovoltaic configuration in the commercial area and the large load, it is necessary to rely on gas turbines for power supply and purchase electricity from the distribution network to meet the load demand. EVs increase the charging load from 23:00 to 04:00 under the premise of meeting the energy constraint conditions to store enough electricity for the travel period, supply electricity to the grid in reverse during the noon power shortage period, and meet the electricity balance constraint during the scheduling cycle.
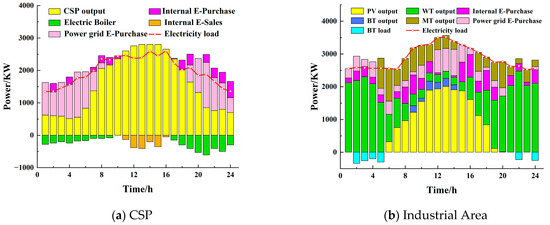
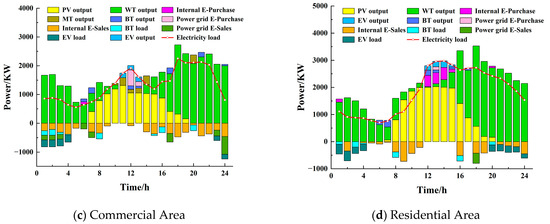
Figure 4.
Dispatch power of VPPA.
6.3. Analysis of Source–Load Interaction
The source–load interaction analysis diagram in Figure 5 shows a comparison of the results considering the source–load interaction. Through optimization, the electric and thermal load curves are significantly flattened, which exerts a beneficial influence on reducing the peak–valley load difference in the VPPA and yields numerous latent advantages to the system. Through source–load interaction, the load reduction and transfer are completed in an appropriate interval, reducing the energy consumption pressure of the VPPA and simultaneously reducing the energy consumption cost of users, achieving a win–win situation.
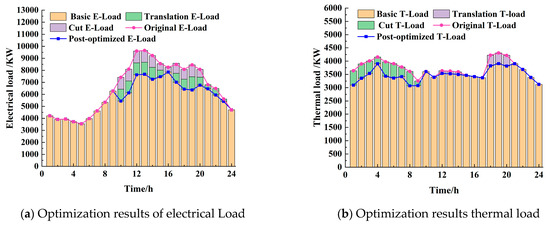
Figure 5.
Optimization results of source–load interaction.
6.4. Comparative Analysis of Different Schemes
This paper sets up four schemes to verify the effectiveness of the proposed strategy:
Scheme 1: Adopt the optimization scheduling strategy proposed in this paper, which is the scheduling strategy of the VPPA based on dynamic electricity and carbon pricing, using the Master–Slave game.
Scheme 2: Consider the VPPA Master–Slave game optimization scheduling strategy based on the dynamic electricity price under the condition of the fixed carbon price. The carbon price adopts the stepwise carbon price system.
Scheme 3: Do not consider the interaction among VPPs. Each VPP operates independently and can only purchase and sell electricity through the distribution network.
Scheme 4: Disregard the influence of the source–load interaction on the optimization scheduling results and only consider the impact of dynamic electricity and carbon prices and electricity energy interaction on the VPPA’s optimization scheduling.
Under the condition in which the other conditions are not changed, the same calculation method is used to optimize and solve them. The comparison of the four indicators of daily operation cost, carbon emissions, electric energy interaction amount, and total revenue of the alliance operator in the four schemes is shown in Table 2.
Table 2.
Comparison of different schemes.
Compared with Scheme 2, Scheme 1 adds a dynamic carbon pricing mechanism. The impact of carbon price on the alliance was analyzed above and will not be repeated. It can be observed from Table 2 that the daily operation cost of the VPPA in Scheme 1 is reduced by CNY 2527, the carbon emissions are reduced by 5543 kg, and the net profit is augmented by CNY 744, resulting in mutual benefits for both the alliance operator and each VPP user entity.
In Scheme 3, each VPP operates independently. Compared with the independent VPP, the key strength of the VPPA stems from its capacity to fully leverage the time- and space-related strengths of the VPP, complete complementarity through energy interaction, and fully absorb internal resources. As can be seen from Table 2, when considering electricity energy interaction, the daily operation cost of the alliance is reduced by 47.4%, the carbon emissions are reduced by 24.6%, and the total benefit is increased by 77.2%. It is apparent that the introduction of electricity energy interaction can greatly improve the economic and environmental protection performance of the alliance.
Compared with Scheme 4, Scheme 1 takes the source–load interaction mechanism into consideration. It can be seen that after the introduction of the source–load interaction, the interaction amount is increased by 3489 KW, which indicates that the source–load interaction mechanism makes the energy scheduling of the alliance more flexible. On the basis of introducing the advantages of carbon price and electricity energy interaction, the economic and environmental protection performance of the alliance will be greatly improved.
6.5. Analysis of VPPA Scheduling Results Based on IGDT
To study the impact of the opportunity model and the robustness model on the scheduling decision-making scheme of the VPPA, the weights of the WT, PV, electric load, and thermal load are set to 0.25 each, and the step length of the deviation factor / is increased from 0 to 0.1. The two scheduling strategies are solved. The relationship between the deviation factor β, the deviation coefficient α, and the total revenue is shown in Table 3 and Table 4.
Table 3.
Total profit and deviation coefficient trend of RM scheduling strategy.
Table 4.
Total profit and deviation coefficient trend of OM scheduling strategy.
As shown in Table 3, with the robustness deviation factor continuously escalating, the aggregate profit of the VPPA demonstrates a steady decline. This is because the decision-maker takes a conservative approach so that the output of conventional units increases, and the electricity purchase amount from the distribution network increases, leading to an increase in the actual operation cost and a decrease in profit.
As shown in Table 4, with the opportunity deviation factor continuously escalating, the aggregate profit of the VPPA exhibits a steady increase. This is because the decision-maker takes an aggressive approach and the system can reduce the output of conventional units and the electricity purchase amount from the distribution network, reducing the actual operation cost and increasing the profit. Taking = = 0.04 as an example, when the aggressive strategy, that is, the opportunity model, is selected, the corresponding deviation coefficient (uncertainty) is 0.062, and the daily profit is CNY 2961. That is, when the opportunity deviation coefficient fluctuates above 0.062, the daily profit of the VPPA is higher than CNY 2961. When the conservative strategy of the robustness model is selected, the corresponding deviation coefficient is 0.068, and the daily profit is CNY 2731. That is, when the robustness deviation factor fluctuates below 0.068, the daily profit of the VPPA is higher than CNY 2731.
The change in carbon emissions is used to further explore the impact of the two strategies on the scheduling results of the VPPA, and = = 0.05 is used as an example, and the scheduling results are shown in Figure 6. The carbon emissions under the RM are higher than those under the normal model, while the carbon emissions under the OM are lower than those under the normal model. This is because, compared with the conservative strategy, under the aggressive strategy, the new energy output can meet more loads, the output of conventional units is smaller, and carbon emissions are significantly reduced.
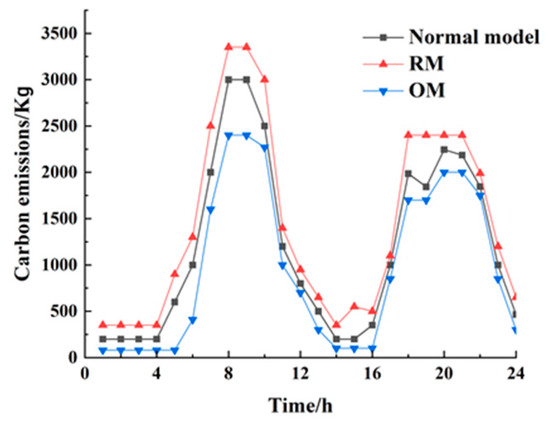
Figure 6.
Carbon emissions under different strategies.
7. Conclusions
For multiple VPP user entities affiliated with the same distribution network, this paper proposes a VPPA Master–Slave game scheduling strategy based on dynamic electricity and carbon pricing. The main conclusions are as follows:
- An optimal scheduling strategy for the VPPA based on the Master–Slave game considering electricity energy interaction and source–load interaction is proposed. It can increase the energy consumption cost of users, increase the amount of electricity energy interaction among VPPs by 67.04%, promote the absorption of distributed energy, and have a significant peak shaving and valley filling effect.
- The alliance operator guides the transactions of a VPP user entity by formulating dynamic electricity and carbon prices, which not only realizes energy interaction among VPPs and meets the load demand, but also increases the alliance operator’s revenue by 35.34% and reduces carbon emissions by 16.17%, with strong economic and environmental protection performance.
- The IGDT of the RM and OM is used to deal with the source–load uncertainty. The optimization scheduling results show that the RM strategy has higher carbon emissions and lower benefits but has a strong tolerance for uncertainty; the OM strategy makes full use of uncertainty to obtain benefits. Decision-makers can choose between the two strategies according to their own expectations.
Author Contributions
Conceptualization, Q.Z. and S.M.; methodology, Q.Z.; software, Q.Z.; validation, Q.Z., S.M. and F.J.; formal analysis, F.J.; investigation, Q.Z.; resources, S.M.; data curation, J.L.; writing—original draft preparation, Q.Z.; writing—review and editing, Q.Z. and F.J.; visualization, R.Z.; supervision, Q.Z. and F.J.; project administration, Q.Z. and S.M.; funding acquisition, F.J., Z.L. and X.R. All authors have read and agreed to the published version of the manuscript.
Funding
This work was supported in part by the Design and Research of the Integrated Photovoltaic-Energy Storage-Charging Micro-grid System (SGQHXNFSNYJS2400216).
Data Availability Statement
The data that support the findings of this study are available from the corresponding author, S.M., upon reasonable request.
Conflicts of Interest
Authors Zengyao Liang and Xuwei Ren were employed by the Xining Fangsheng Electric Power Design Co., Ltd. The remaining authors declare that the research was conducted in the absence of any commercial or financial relationships that could be construed as a potential conflict of interest. The Xining Fangsheng Electric Power Design Co., Ltd. had no role in the design of the study; in the collection, analyses, or interpretation of data; in the writing of the manuscript, or in the decision to publish the results.
Abbreviations
The following abbreviations are used in this manuscript:
| VPP | Virtual power plant |
| VPPA | Virtual power plant alliance |
| IGDT | Information gap decision theory |
| CSP | Concentrated solar power |
| V2G | Vehicle-to-grid |
| EES | Electrical energy storage |
| TES | Thermal energy storage |
| EV | Electric vehicle |
| WT | Wind turbine |
| PV | Photovoltaic |
| GT | Gas turbines |
| GB | Gas boilers |
| OM | Opportunity model |
| RM | Robustness model |
Appendix A
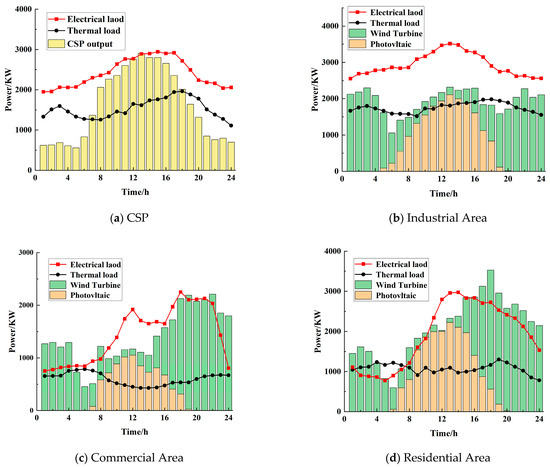
Figure A1.
Prediction curves of VPPA wind output and load.
Figure A1.
Prediction curves of VPPA wind output and load.
Appendix B
Table A1.
The parameters of the energy device.
Table A1.
The parameters of the energy device.
| Equipment | Parameter | Industrial Area | Commercial Area | Residential Area |
|---|---|---|---|---|
| PV | 0.02 | 0.02 | 0.02 | |
| WT | 0.02 | 0.02 | 0.02 | |
| EES (KW) | 1200 | 600 | 800 | |
| 400 | 200 | 200 | ||
| 200 | 200 | 300 | ||
| 350 | 200 | 200 | ||
| 350 | 200 | 200 | ||
| 0.95 | 0.95 | 0.95 | ||
| 0.95 | 0.95 | 0.95 | ||
| 0.001 | 0.001 | 0.001 | ||
| 0.02 | 0.02 | 0.02 | ||
| TES (KW) | 285 | 475 | 475 | |
| 120 | 200 | 200 | ||
| 120 | 200 | 200 | ||
| 150 | 250 | 250 | ||
| 0.95 | 0.95 | 0.95 | ||
| 0.95 | 0.95 | 0.95 | ||
| 0.001 | 0.001 | 0.001 | ||
| 285 | 475 | 475 | ||
| 0.02 | 0.02 | 0.02 | ||
| CSP | 0.4 | |||
| 0.4 | ||||
| 0.98 | ||||
| 0.98 | ||||
| 0.031 | ||||
References
- Cao, W.; Wang, S.; Xu, M. Optimal scheduling of virtual power plant based on Latin hypercube sampling and improved Clara clustering algorithm. Processes 2022, 10, 2414. [Google Scholar] [CrossRef]
- Peng, D.; Shui, J.; Wang, D.; Zhao, H. Review of virtual power plant under the background of “dual carbon”. Power Gener. Technol. 2023, 44, 602. [Google Scholar]
- Ruan, G.; Qiu, D.; Sivaranjani, S.; Awad, A.S.; Strbac, G. Data-driven energy management of virtual power plants: A review. Adv. Appl. Energy 2024, 14, 100170. [Google Scholar] [CrossRef]
- Sun, S.; Xing, J.; Cheng, Y.; Yu, P.; Wang, Y.; Yang, S.; Ai, Q. Optimal Scheduling of Integrated Energy System Based on Carbon Capture–Power to Gas Combined Low-Carbon Operation. Processes 2025, 13, 540. [Google Scholar] [CrossRef]
- Cao, J.; Yang, D.; Dehghanian, P. Cooperative operation for multiple virtual power plants considering energy-carbon trading: A Nash bargaining model. Energy 2024, 307, 132813. [Google Scholar] [CrossRef]
- Chen, Y.; He, S.; Wang, W.; Yuan, Z.; Cheng, J.; Cheng, Z.; Fan, X. Optimization strategy for shared energy storage operators-multiple microgrids with hybrid game-theoretic energy trading. Processes 2024, 12, 218. [Google Scholar] [CrossRef]
- Cao, J.; Zheng, Y.; Han, X.; Yang, D.; Yu, J.; Tomin, N.; Dehghanian, P. Two-stage optimization of a virtual power plant incorporating with demand response and energy complementation. Energy Rep. 2022, 8, 7374–7385. [Google Scholar] [CrossRef]
- Qi, L.; Gao, Y.; Ai, Q. Virtual Power Plant and Multi-prosumer Hybrid Game Strategy Based on Energy Sharing. Electr. Power Constr. 2025, 46, 1–13. [Google Scholar]
- Duan, M.; Cheng, H.; Fang, K.; Huang, Y.; Lu, S.; Chen, L. Research on Stackelberg game strategy for virtual power plant considering time-of-use electricity and carbon coupled price. Electr. Meas. Instrum. 2024, 61, 1–11. [Google Scholar]
- Yue, M.; Hong, L. Economic Optimization Scheduling Of Multi-Microgrid System Based On Master-Slave Game Under Multi-Agent Technology. Acta Energiae Solaris Sin. 2024, 45, 574–582. [Google Scholar]
- Wang, L.; Xu, Z.; Yang, C.; Yuan, G.; Tang, L.; Wang, X. Modeling and Solving Method of Electricity-Carbon Joint Optimization for Multi-Virtual Power Plants. Autom. Electr. Power Syst. 2024, 48, 29–40. [Google Scholar]
- Li, P.; Wu, D.; Li, Y.; Yin, Y.; Fang, Q.; Chen, B. Multi-objective Union Optimal Configuration Strategy for Multi-microgrid Integrated Energy System Considering Bargaining Games. Power Syst. Technol. 2020, 44, 3680–3690. [Google Scholar]
- Zhou, J.; Liang, C.; Shi, L.; Li, Y.; Yi, W. Optimal Scheduling of Integrated Energy System Considering The Ladder-type Carbon Trading Mechanism. Electr. Power 2025, 58, 77–87. [Google Scholar]
- Gao, Y.; Xu, Y.; Zhang, T.; Song, W.; Wang, P.; Xi, L.; Mi, L. Multi-microgrid system optimization scheduling including Electric vehicle coordinated charging and reward and punishment ladder carbon trading. Electr. Power Constr. 2025, 46, 174–188. [Google Scholar]
- Zhang, N.; Jia, J.; Li, B.; Shi, Z. Study on optimization of operation strategy of electric-gas coupling virtual power plant considering carbon trading. Electr. Meas. Instrum. 2024, 61, 20–28. [Google Scholar]
- Li, Y.; Yang, Y.; Zhang, F.; Li, Y. A Stackelberg game-based approach to load aggregator bidding strategies in electricity spot markets. J. Energy Storage 2024, 95, 112509. [Google Scholar] [CrossRef]
- Wang, Y.; Jin, Z.; Liang, J.; Li, Z.; Dinavahi, V.; Liang, J. Low-carbon optimal scheduling of park-integrated energy system based on bidirectional Stackelberg-Nash game theory. Energy 2024, 305, 132342. [Google Scholar] [CrossRef]
- Zhang, J.; Wang, G.; Yue, S.; Yao, X.; Song, Y.; Liu, J. Study on Master Slave Interaction Model Based on Stackelberg Game in Distributed Environment. Symmetry 2020, 12, 232. [Google Scholar] [CrossRef]
- Liu, X. Research on optimal dispatch method of virtual power plant considering various energy complementary and energy low carbonization. Int. J. Electr. Power Energy Syst. 2022, 136, 107670. [Google Scholar] [CrossRef]
- Yuan, G.; Zhong, F.; Zhang, R.; Zhou, T. Combined heat and power scheduling optimization for virtual power plants considering carbon capture and demand response. Power Syst. Technol. 2023, 47, 4458–4467. [Google Scholar]
- Li, X.; Ai, X.; Hu, J.; Zhou, B.; Lin, Z. Three-stage combined peak regulation strategy for nuclear-thermal-virtual power plant considering carbon trading mechanism. Power Syst. Technol. 2019, 43, 2460–2470. [Google Scholar]
- Zhang, L.; Dai, G.; Nie, Q.; Tong, Z. Economic dispatch model of virtual power plant considering electricity consumption under a carbon trading mechanism. Power Syst. Prot. Control 2020, 48, 154–163. [Google Scholar]
- Zhu, S.; Ji, J.; Huang, Q.; Li, S.; Ren, J.; He, D.; Yang, Y. Optimal scheduling and trading in joint electricity and carbon markets. Energy Strategy Rev. 2024, 54, 101426. [Google Scholar] [CrossRef]
- Ge, S.; Cheng, X.; Liu, H. Market design of P2P electricity carbon coupling transaction among multi-microgrids in the zone. High Volt. Eng. 2023, 49, 1341–1349. [Google Scholar]
- Qiu, D.; Xue, J.; Zhang, T.; Wang, J.; Sun, M. Federated reinforcement learning for smart building joint peer-to-peer energy and carbon allowance trading. Appl. Energy 2023, 333, 120526. [Google Scholar] [CrossRef]
- Shui, J.; Peng, D.; Zeng, H.; Song, Y.; Yu, Z.; Yuan, X.; Shen, C. Optimal scheduling of multiple entities in virtual power plant based on the Master-Slave game. Appl. Energy 2024, 376, 124286. [Google Scholar] [CrossRef]
- Xiao, B.; Zhang, Q.; Qin, W.; Qu, G.; Kong, Y.; Zhang, X. Source-Grid-Load-Storage Synergistic Planning Considering Electricity-Carbon Coupling and Flexible Supply-Demand Balance. Electr. Power Constr. 2025, 46, 116–127. [Google Scholar]
- Ding, Y.; Tan, Q.; Wei, Y.; Shan, Z. Collaborative Optimization of Wind—Photovoltaic—Thermal Power Operation Based on Low—Carbon Sustainable under the Coupling of Electricity—Carbon Market. Syst. Eng.-Theory Pract. 2025, 1–14. [Google Scholar]
- Dong, L.; Li, Y.; Chen, S.; Qian, J.; Pu, T. Multi-Microgrid Cooperative Game Optimization Scheduling Considering Multiple Uncertainties and Coupled Electri-ci-ty-Carbon Transactions. Trans. China Electrotech. Soc. 2024, 39, 2635–2651. [Google Scholar]
- Li, J.; Cheng, J.; Zhou, B.; Liu, J.; Mao, T.; Zhao, W.; Wang, T.; Huang, G.; Xu, Y. Stochastic Optimal of Integrated Energy System in Low-Carbon Parks Considering Carbon Capture Storage and Power to Hydrogen. Electr. Power 2024, 57, 149–156. [Google Scholar]
- Wei, B.; Qiao, S.; Meng, R.; Li, J. Two-stage Robust Optimization Scheduling of Microgrids Based on Data-driven Uncertain Sets. High Volt. Eng. 2025, 51, 852–863. [Google Scholar]
- Li, J.; Liu, Y.; Wang, X. Green Certificate Real-time Pricing Based on Information Gap Decision Theory. Power Syst. Prot. Control 2024, 52, 32–43. [Google Scholar]


Disclaimer/Publisher’s Note: The statements, opinions and data contained in all publications are solely those of the individual author(s) and contributor(s) and not of MDPI and/or the editor(s). MDPI and/or the editor(s) disclaim responsibility for any injury to people or property resulting from any ideas, methods, instructions or products referred to in the content. |
© 2025 by the authors. Licensee MDPI, Basel, Switzerland. This article is an open access article distributed under the terms and conditions of the Creative Commons Attribution (CC BY) license (https://creativecommons.org/licenses/by/4.0/).