Abstract
Recently, engineering companies have started to digitise documents in image form to analyse their meaning and extract important content. However, many engineering and contract documents contain different types of components such as texts, tables, and forms, which often hinder accurate interpretation by simple optical character recognition. Therefore, document object detection (DOD) has been studied as a preprocessing step for optical character recognition. Given the ease of acquiring image data, reducing annotation time and effort through transfer learning and active learning has emerged as a key research challenge. In this study, a cost-efficient active transfer learning (ATL) framework for DOD is presented to minimise the effort and cost of time-consuming image annotation for transfer learning. Specifically, three new sample evaluation measures are proposed to enhance the sampling performance of ATL. The proposed framework performed well in ATL experiments of DOD for invitation-to-bid documents. In the experiments, the DOD model was trained on only half of the labelled images, but, in terms of the F1-score, it achieved a similar performance as a DOD model trained on all labelled images. In particular, one of the proposed sampling measures, ambiguity, showed the best sampling performance compared to existing measures, such as entropy and uncertainty. The efficient sample evaluation measures proposed in this study are expected to reduce the time and effort required for ATL.
1. Introduction
Recently, many manufacturing companies have digitised their engineering documents for digital transformation [1,2,3]. However, when converting an image document into a digital document using optical character recognition (OCR), many characters are often interpreted inaccurately. Therefore, to improve the accuracy of character recognition, it is recommended that document objects such as forms, tables, and texts be detected in a document image before performing OCR [4,5,6]. This process is known as document object detection (DOD) [5]. Recent research on DOD has explored layout-aware models to effectively detect complex objects in engineering documents [7,8]. These approaches aim to capture both the visual structure and semantic context of documents, enabling more accurate and robust detection across varying layouts and formats.
In this study, we deal with the DOD of invitation-to-bid (ITB) documents, which are solicitation documents that provide specifications for plant engineering projects for prospective suppliers. ITB documents are issued by various client companies, and each company has a different ITB format. Therefore, a technique is required for extending a trained DOD model to documents from other companies in a cost-effective manner. Transfer learning is an effective technique for applying a machine learning model trained in a source domain to a new target domain [9,10]. Using transfer learning, pretrained machine learning models of a source domain can be reused and extended. Nonetheless, additional training is still required to improve the accuracy of the pretrained models for a new domain. This requires collecting new data and manually labelling them again, which is time-consuming and costly.
Active learning is another useful technique for evaluating and sampling unlabelled data using sample evaluation measures such as entropy and uncertainty, and it is expected to be more effective for model fine-tuning [11,12]. Entropy is a measure of the unpredictability of a probability distribution and is often used to quantify random uncertainty. However, uncertainty in active learning encompasses both random and epistemic factors, such as model confidence and knowledge gaps. Various uncertainty sampling methods, such as ensemble-based estimation and Hierarchical Uncertainty Aggregation (HUA), have been developed. In particular, HUA aggregates uncertainty at different levels by considering bounding box attributes such as size and proximity to other objects [13]. In diversity sampling, a hybrid approach combining cluster-based sampling and adaptive representative sampling was proposed [14], and fine-grained sampling at the bounding box level improved labelling efficiency by focusing on individual objects rather than image levels [15]. Expected Error Reduction (EER) selects samples to minimise prediction error by integrating uncertainty and density [16].
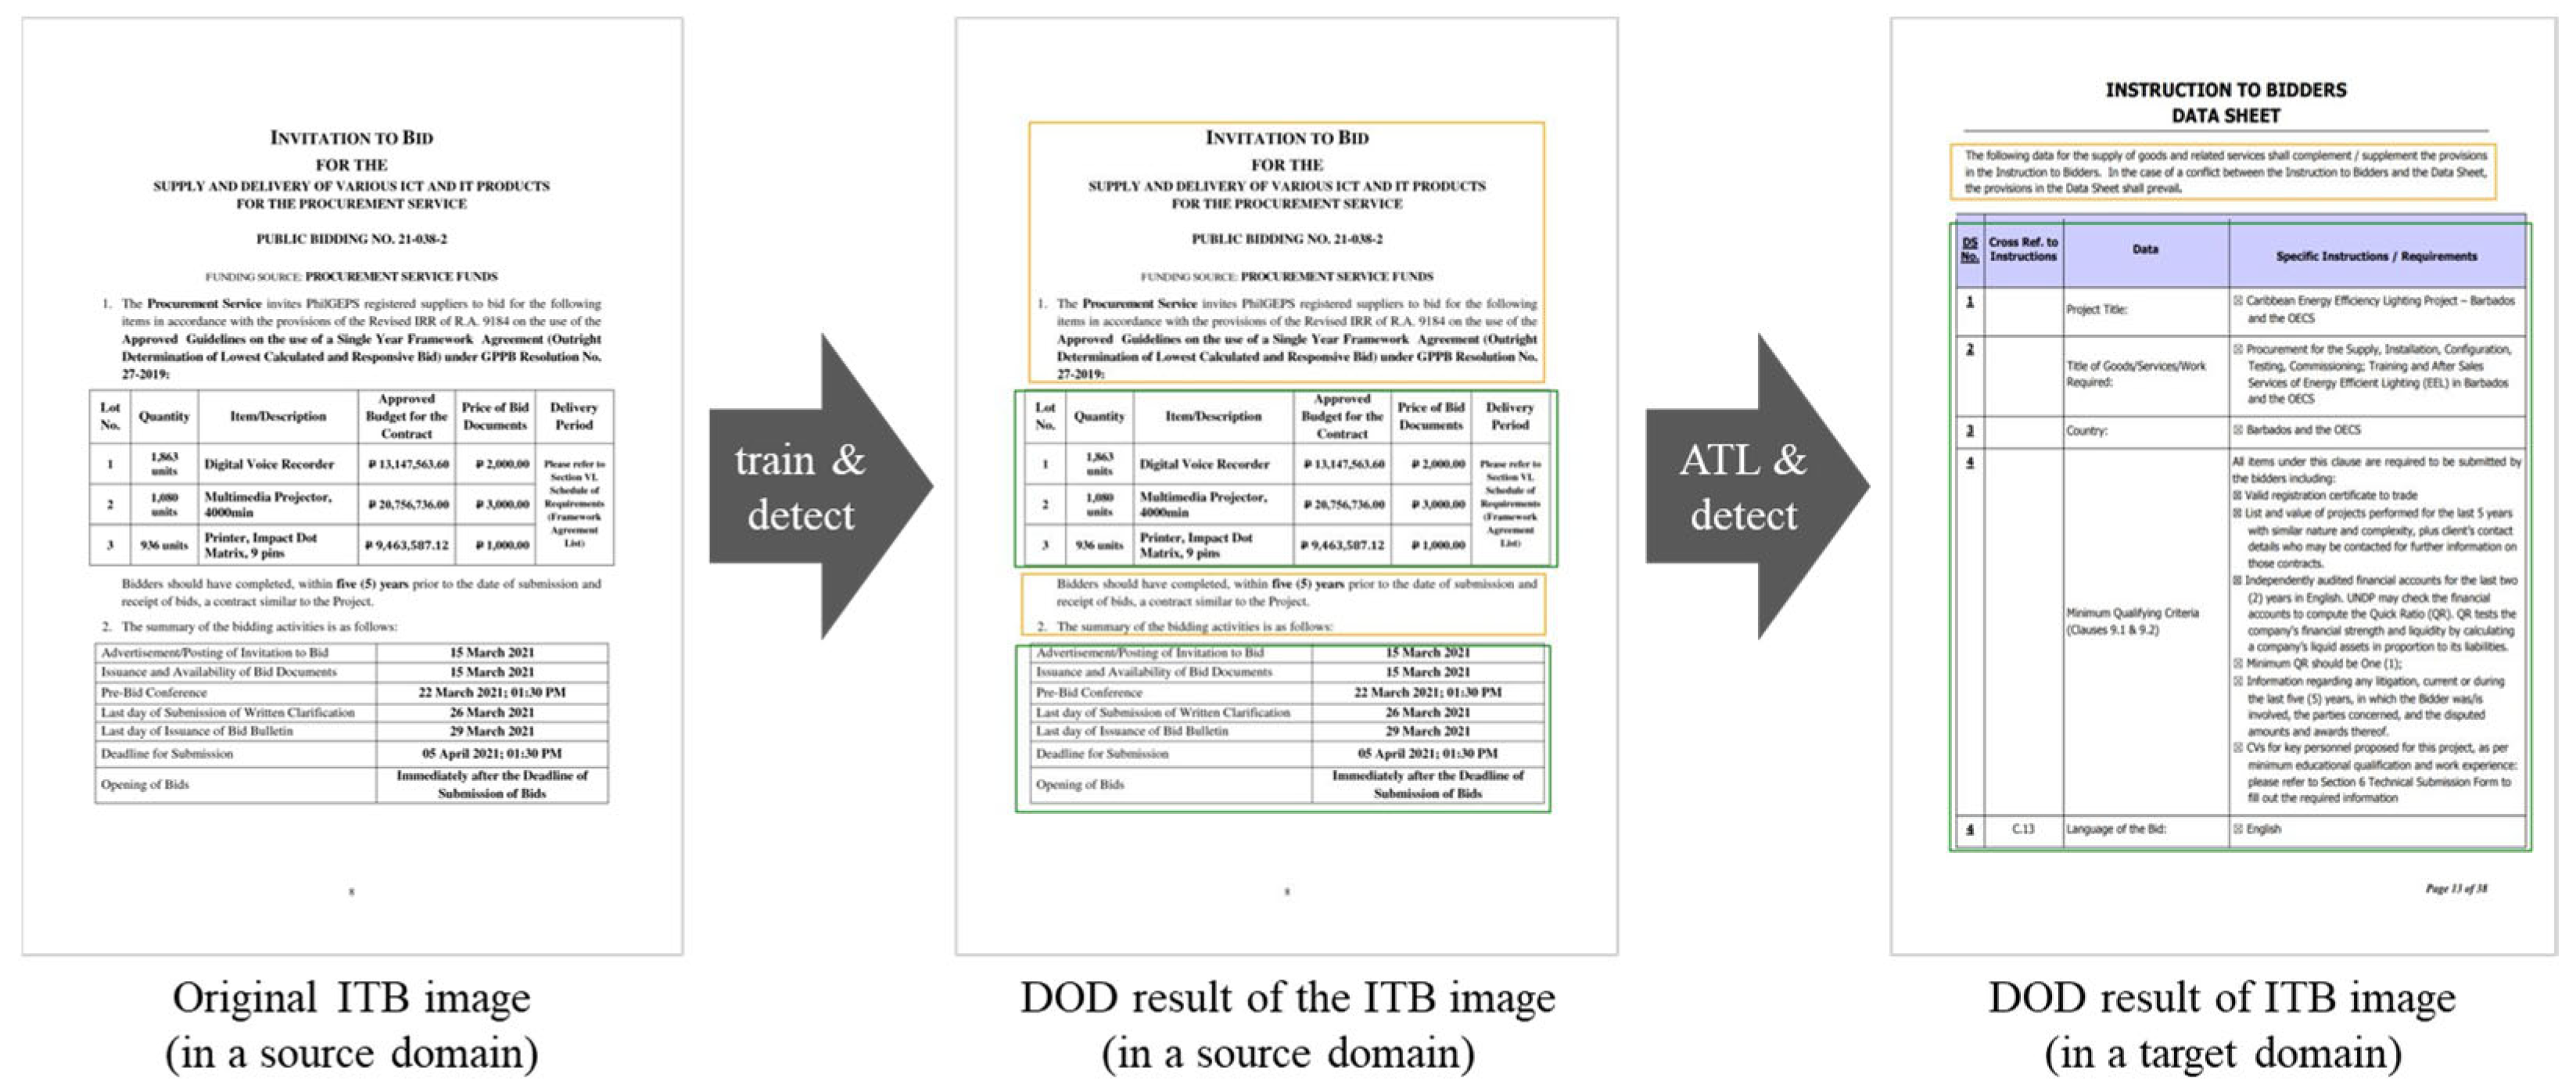
In this study, an active transfer learning (ATL) framework was introduced to effectively apply a pretrained DOD model to a new target domain, as shown in Figure 1. Three new sampling measures (difficulty, ambiguity, and sparsity) were proposed as sample evaluation measures for the ATL framework. In experiments, a DOD model pretrained on the ITB documents of a Korean company was fine-tuned for the ITB documents of the Philippine government.
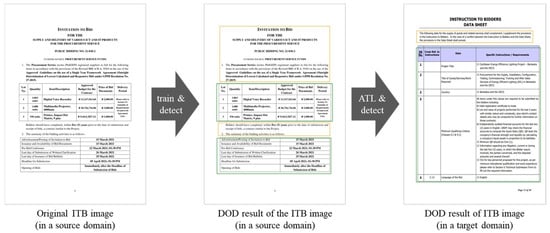
Figure 1.
DOD for ITB document images and its active transfer learning. Yellow and green boxes represent text and table areas, respectively.
The experiments showed that, in terms of the F1-score, the DOD model fine-tuned with only half of the labelled images could achieve performance comparable to that of the model fine-tuned with all labelled images. In particular, of the three proposed measures and two popular existing measures for active learning (entropy and uncertainty), the new measure ambiguity evaluated the degree of class confusion in an image and performed the best in evaluating document images in the ATL framework. These proposed sampling measures for ATL have been demonstrated to enable the training of accurate DOD models with fewer samples within a shorter time.
Although many advanced object detection algorithms have recently been developed, the availability of labelled data has become more critical than model performance due to the ease of collecting large-scale image data. Therefore, the efficient sample evaluation measures proposed in this study are expected to reduce the time and effort required for ATL.
The remainder of this paper is organised as follows. Section 2 introduces the framework of active transfer learning for DOD. In Section 3, the three new sampling measures for ATL are proposed in addition to the two existing popular measures. Experiments on ATL for DOD documents are designed and conducted in Section 4 and Section 5, respectively. Finally, Section 6 concludes the paper and discusses future research.
2. Active Transfer Learning Framework
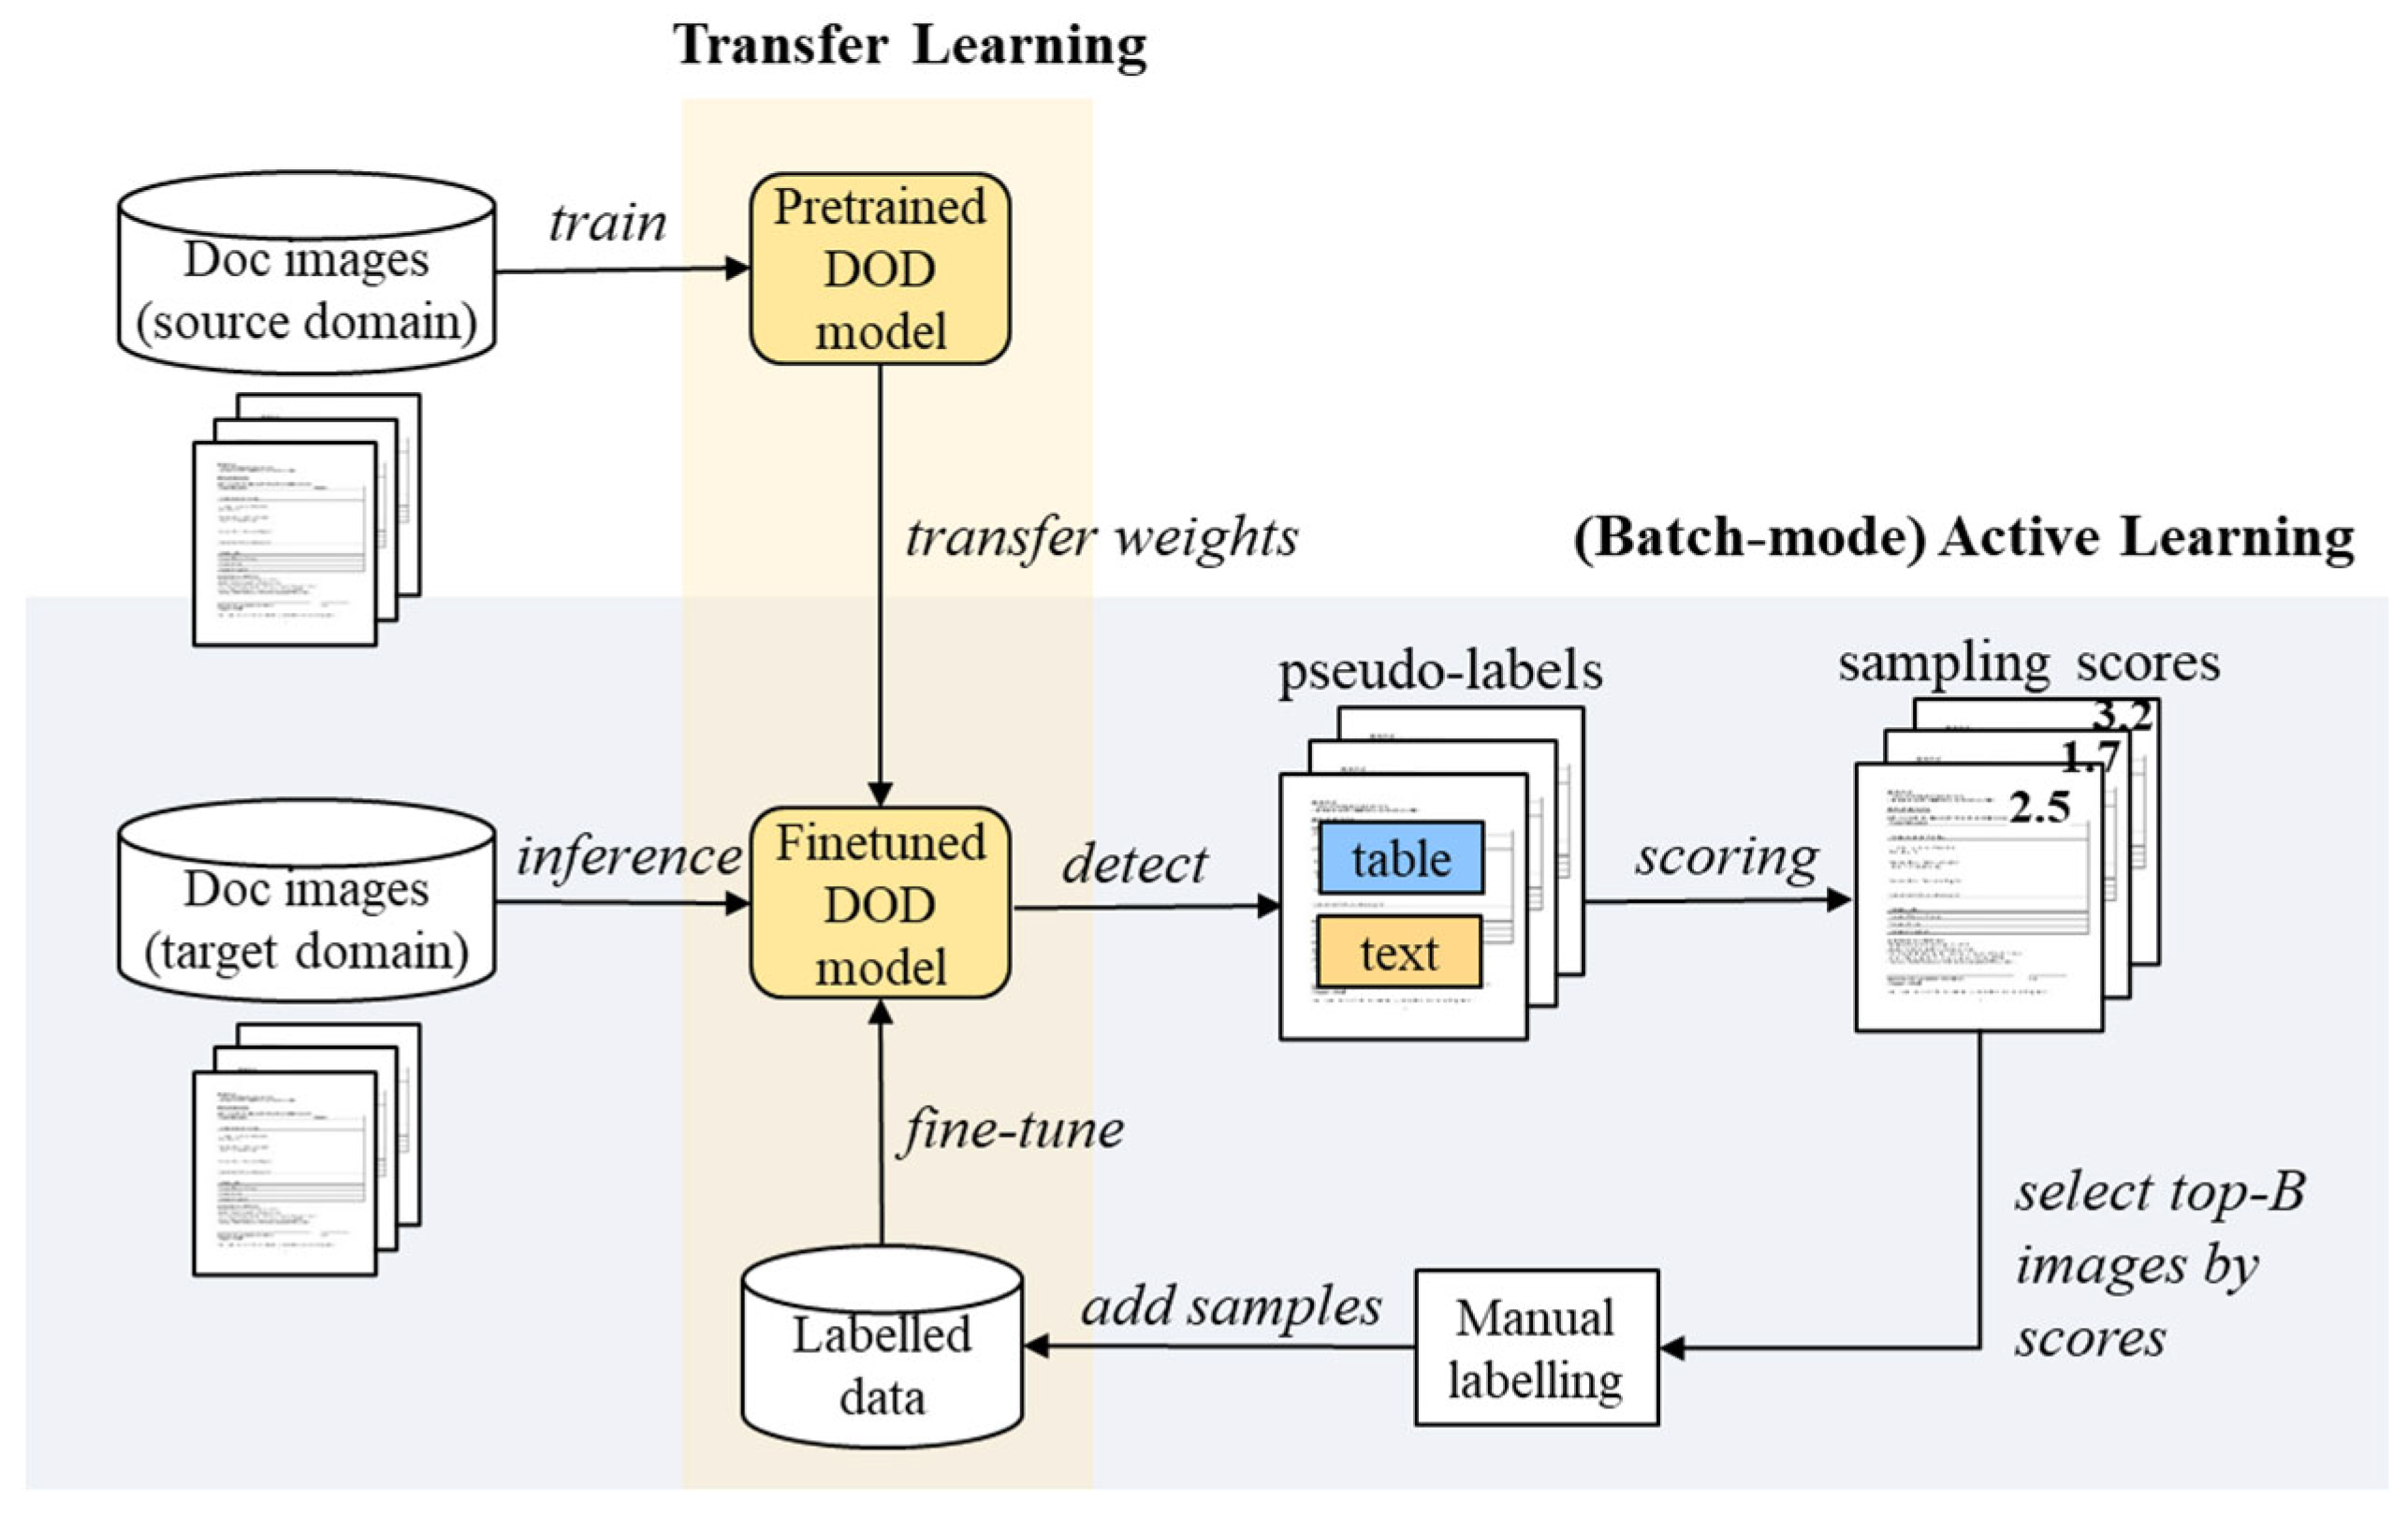
An ATL framework for a cost-effective DOD is shown in Figure 2. A DOD model learned using the document images in a source domain was fine-tuned for a new target domain. Potential bounding boxes and pseudo-classes, along with their confidences, were derived from the unlabelled images in the target domain using the pretrained DOD model. Using pseudo-labels, the unlabelled images were evaluated using sample evaluation measures. The batch-mode active learning strategy was used to select the top-B images with a high sampling score and label them manually to add them to the labelled set for fine-tuning the DOD model. The updated labelled data were used to fine-tune the DOD model for the target domain. The active learning process was repeated until the desired model accuracy was achieved or the maximum number of samples was reached.
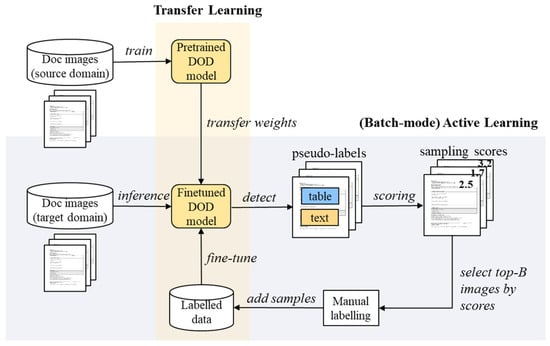
Figure 2.
ATL framework for DOD.
The overall procedure of batch-mode ATL for DOD is described in Algorithm 1. The algorithm starts with unlabelled target domain data (), and the DOD model is pretrained with source domain data (). The algorithm first transfers the weights of the pretrained DOD model () to a new model for a target domain () and then initialises the number of samplings and empty labelled data (lines 1 and 2). The batch-mode algorithm repeatedly selects B samples until the maximum number of samples (T) or satisfactory accuracy (A) is achieved. The algorithm pseudo-labels each image using and scores the unlabelled images in the target domain using one of the sampling measures (lines 5 and 6) introduced in Section 3. Top-B sample images with high scores are selected and manually labelled to be added to the training set for fine-tuning . After fine-tuning the training set again, the final DOD model tailored for the target domain is produced.
| Algorithm 1. Batch-mode Active Transfer Learning for Document Object Detection |
| input: unlabelled data (), pretrained DOD model in source domain (), batch size (), maximum number of sampling (), and satisfactory accuracy () output: DOD model for target domain () 1: Initialize with the weights of 2: Initialize the number of samplings and a labeled set. t = 0 and 3: while t < T and do 4: for each image in do 5: Detect objects with their pseudo-classes and confidences from using . 6: Calculate the score of using one of sampling measures. 7: end for 8: Select top-B samples with high score 9: 10: Fine-tune with and obtain the model accuracy 11: 12: t = t + B 13: end while 14: return DOD model |
3. Sampling Measures for Active Transfer Learning
By using sample evaluation measures, the priority of unlabelled data can be determined for the new labelling of ATL. Several sampling measures, such as entropy and uncertainty, have been used in active learning. In this study, three additional measures were proposed for the ATL of the DOD models.
Entropy [17] is a representative sampling measure used for active learning. It is used to calculate the amount of information based on the information theory. This is because samples with a greater uncertainty are more helpful for model learning. Equation (1) represents the sum of the entropy values of all objects that are detected in the i-th image, and the entropy of the k-th object in the image, denoted as , is calculated using Equation (2), both of which are shown as follows:
where is the i-th image (), and k is the index of the object detected in the image. is the confidence of the k-th object detected in image i by the model (). It is recommended that an image with high entropy be labelled first.
Uncertainty [18] refers to the average uncertainty of all objects detected in an image. In this study, the uncertainty of an object is calculated as one minus its confidence . Equation (3) represents the evaluation of the average uncertainty of the detected object in the i-th image and is shown as follows:
In this study, the following three new sampling measures are proposed: difficulty, ambiguity, and sparsity. Difficulty is the total uncertainty of all objects detected in the image; therefore, an image with a high total uncertainty is first sampled. Equation (4) measures the sum of the uncertainties of the objects in the i-th image, as follows:
Ambiguity measures the sum of the interaction over union (IoU) between two detections, where the model predicts the same object as different classes. If an object is predicted to be a bounding box with different classes, the model is confused in classifying the target object. It is recommended that an image with a high total ambiguity be labelled first. Equation (5) measures the total ambiguity of the i-th image, where is the IoU degree of the two bounding boxes that the model detects as different classes for the same object in the image and is shown as follows:
Finally, sparsity preferentially selects an unlabelled image that contains many objects classified as the fewest pseudo-classes in the unlabelled set. In Equation (6), is the number of objects classified into the fewest pseudo-classes in the image by the model. is the fewest pseudo-class with the smallest number of objects classified into class in the unlabelled set, as shown in the following Equation (7):
The three newly proposed measures differ from existing techniques as follows. The difficulty measure, unlike the uncertainty measure, focuses on the total amount of uncertainty that a sample has. In contrast, ambiguity, unlike other measures, evaluates the clarity of bounding boxes by measuring IoU, while sparsity evaluates samples by focusing on only one class that is the most difficult to identify. Although these measures fundamentally have the same goal of improving classification and detection, they show different performance experimentally because of different detailed goals and measurements.
In the experiments, all possible pairwise combinations of the five measures were considered sampling measures in the ATL framework. To combine the two measures, each was first standardised into a z-score, as shown in Equation (8). The z-score normalises a measure m using its mean value and standard deviation as shown in the following Equation (9):
4. Experimental Design
In this study, ITB document images from two domains were used to evaluate the proposed ATL framework and sampling measures. The DOD model was first trained using 1250 ITB document images from a Korean engineering company (in the source domain). The model was tested using the ATL framework to fine-tune 500 ITB document images from the Philippine government (in the target domain). Of the 500 documents in the target domain, 400 and 100 documents were used as training and test sets, respectively. The 400 images in the training set contained 196 forms, 263 tables, and 633 texts, whereas the 100 images in the test set contained 53 forms, 72 tables, and 156 texts. In the experiments, the training data were used for a five-fold cross validation.
The DOD model was developed using the Faster R-CNN algorithm [19] provided by the torchvision module in PyTorch 1.12.1, and ResNet50 was used as the backbone. The Adam optimiser was used, and the learning rate was set to 0.0001. The loss function was loss_rpn_box_reg, and the maximum number of epochs was 100. The patience number for early stopping was set as 10, and the sampling batch size was set as 50.
In addition, the active learning framework was implemented in Python 3.9 to conduct experiments. The framework includes single sample evaluation measures such as entropy, uncertainty, and ambiguity, as well as the joint measures of two measures.
This experiment was performed in a computing environment with an Intel Core i7-10700K CPU (3.80 GHz), a 32 GB RAM, and an NVIDIA GeForce RTX 3070 GPU.
5. Experimental Results
The performance of each sample measure was evaluated in terms of the F1-score with an increasing number of samples, as listed in Table 1. In this experiment, the three sampling measures for the ATL framework (ambiguity, entropy, and sparsity) exhibited good performance in terms of the F1-scores. In particular, the proposed ambiguity measure outperformed two existing sampling measures, namely entropy and uncertainty. Another proposed measure, sparsity, was also good, coming in third place.

Table 1.
Average F1-scores by individual sampling measures with an increasing number of samples. Bold indicates the best measure in each experiment.
The performance of the sampling measures on the ATL framework was evaluated using the average F1-score for the test set, as the number of additional labelled training samples increased from 50 to 200 (half of the training set), as shown in Table 1. In each experiment, the average F1-score of the model was measured over five repetitions, and the F1-score was calculated using IoU = 0.5.
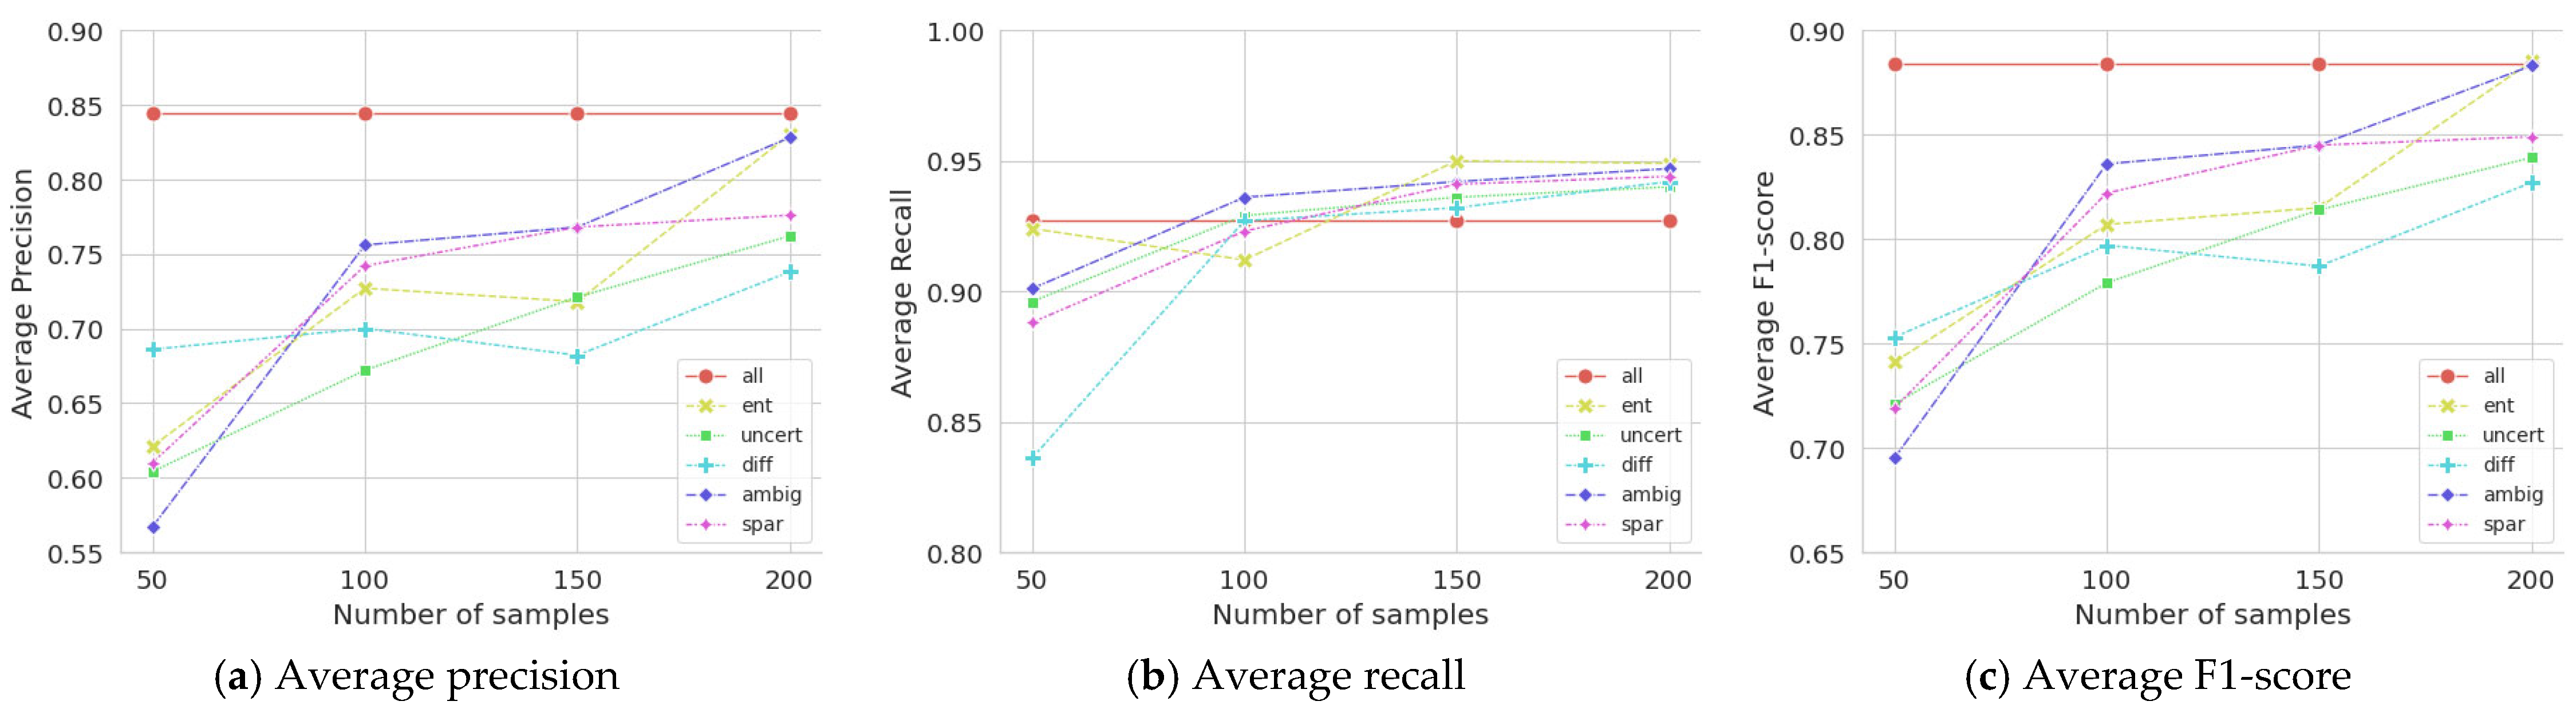
Among the five single-sampling measures, the ambiguity measure, which evaluates the class confusion in an image, performed the best (F1 = 0.815) in terms of the average F1-score, followed by sparsity (F1 = 0.812) and entropy (F1 = 0.809), as shown in Table 1. Specifically, the DOD models of the ATL using ambiguity (F1 = 0.883) or entropy (F1 = 0.885) achieved the same performance, using only 200 labelled samples, as the DOD model trained with all 400 labelled samples without active learning (F1 = 0.884). This implies that cost and time can be saved by labelling only half of the unlabelled images in the ATL framework. Their average F1-scores are shown in Figure 3.
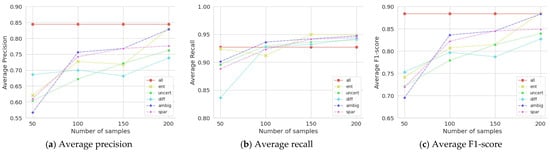
Figure 3.
Performances of single sampling measures with an increasing number of samplings.
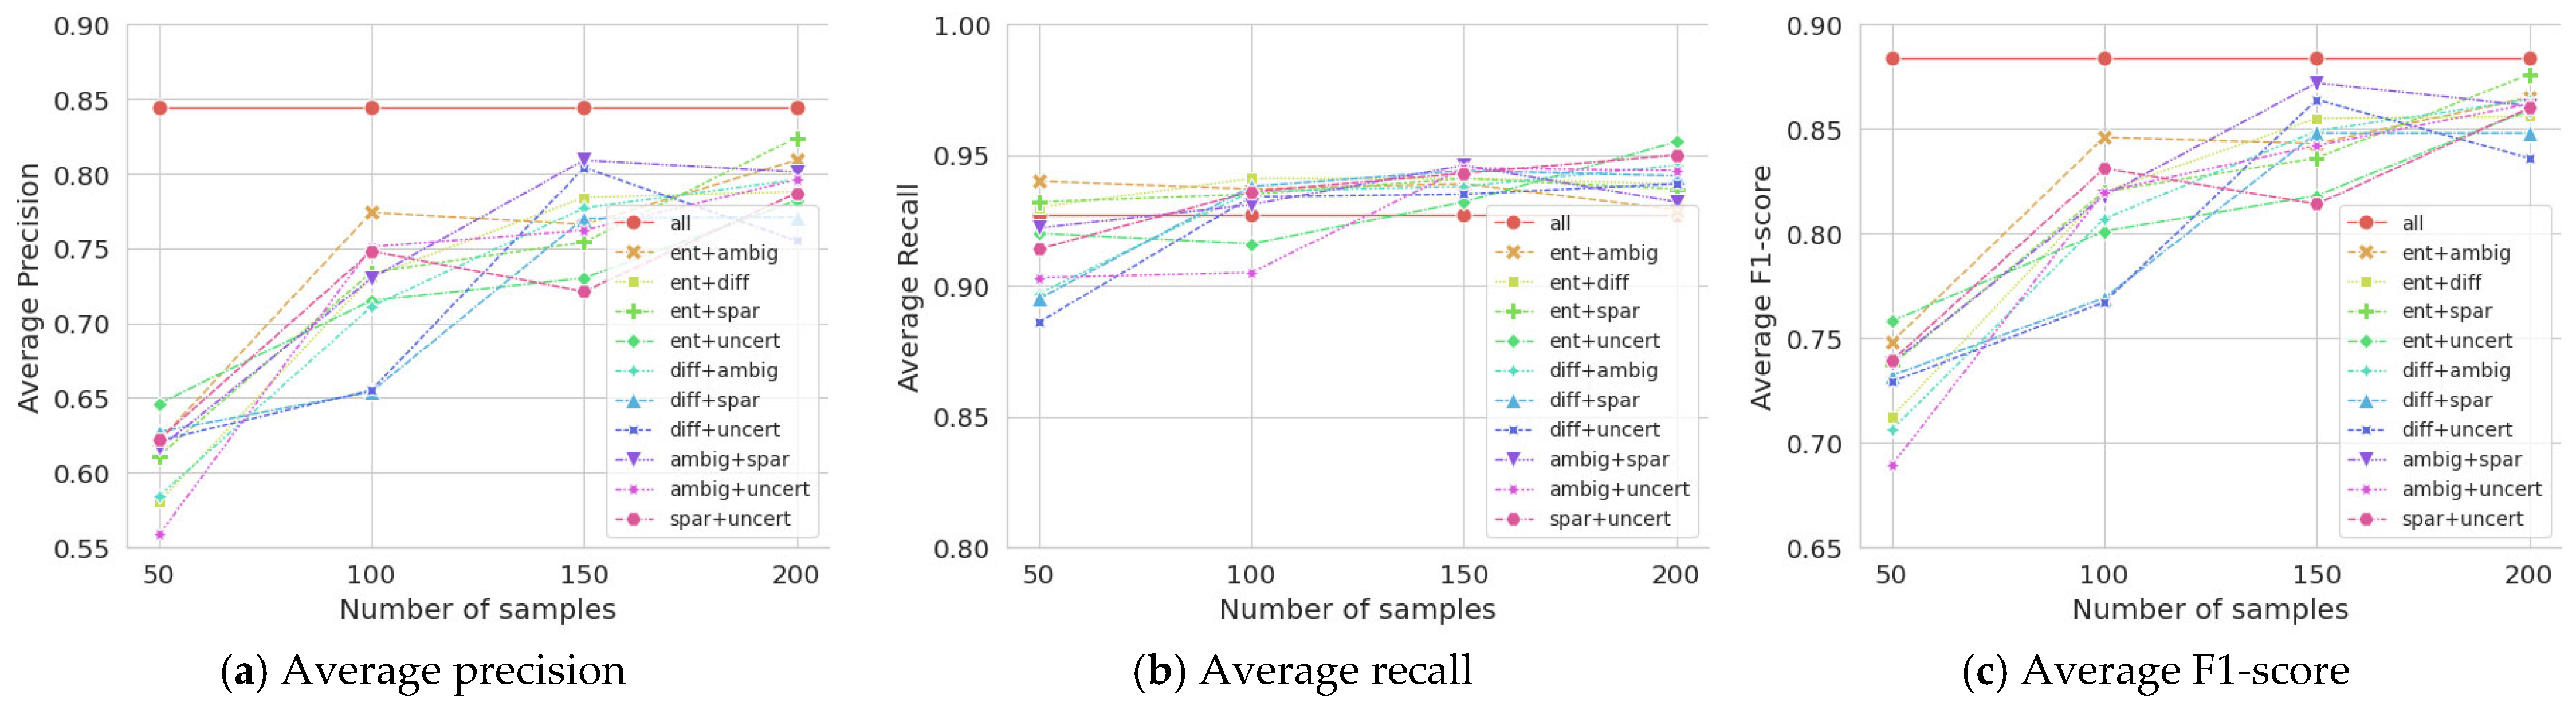
Table 2 presents the results of the ATL experiments using all combinations of the two sampling measures. When the number of samplings was increased to 200, the best average performance was achieved using a combination of entropy and ambiguity (ent + ambi), which are the two best measures among the individual measures. Their average F1-scores are shown in Figure 4.
Table 2.
Average F1-scores by combined sampling measures with an increasing number of samples. Bold indicates the best measure in each experiment.
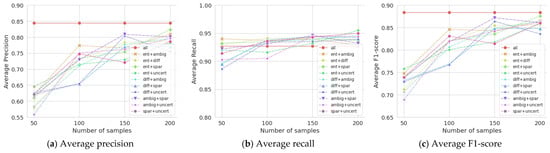
Figure 4.
Performances of combined sampling measures with an increasing number of samplings.
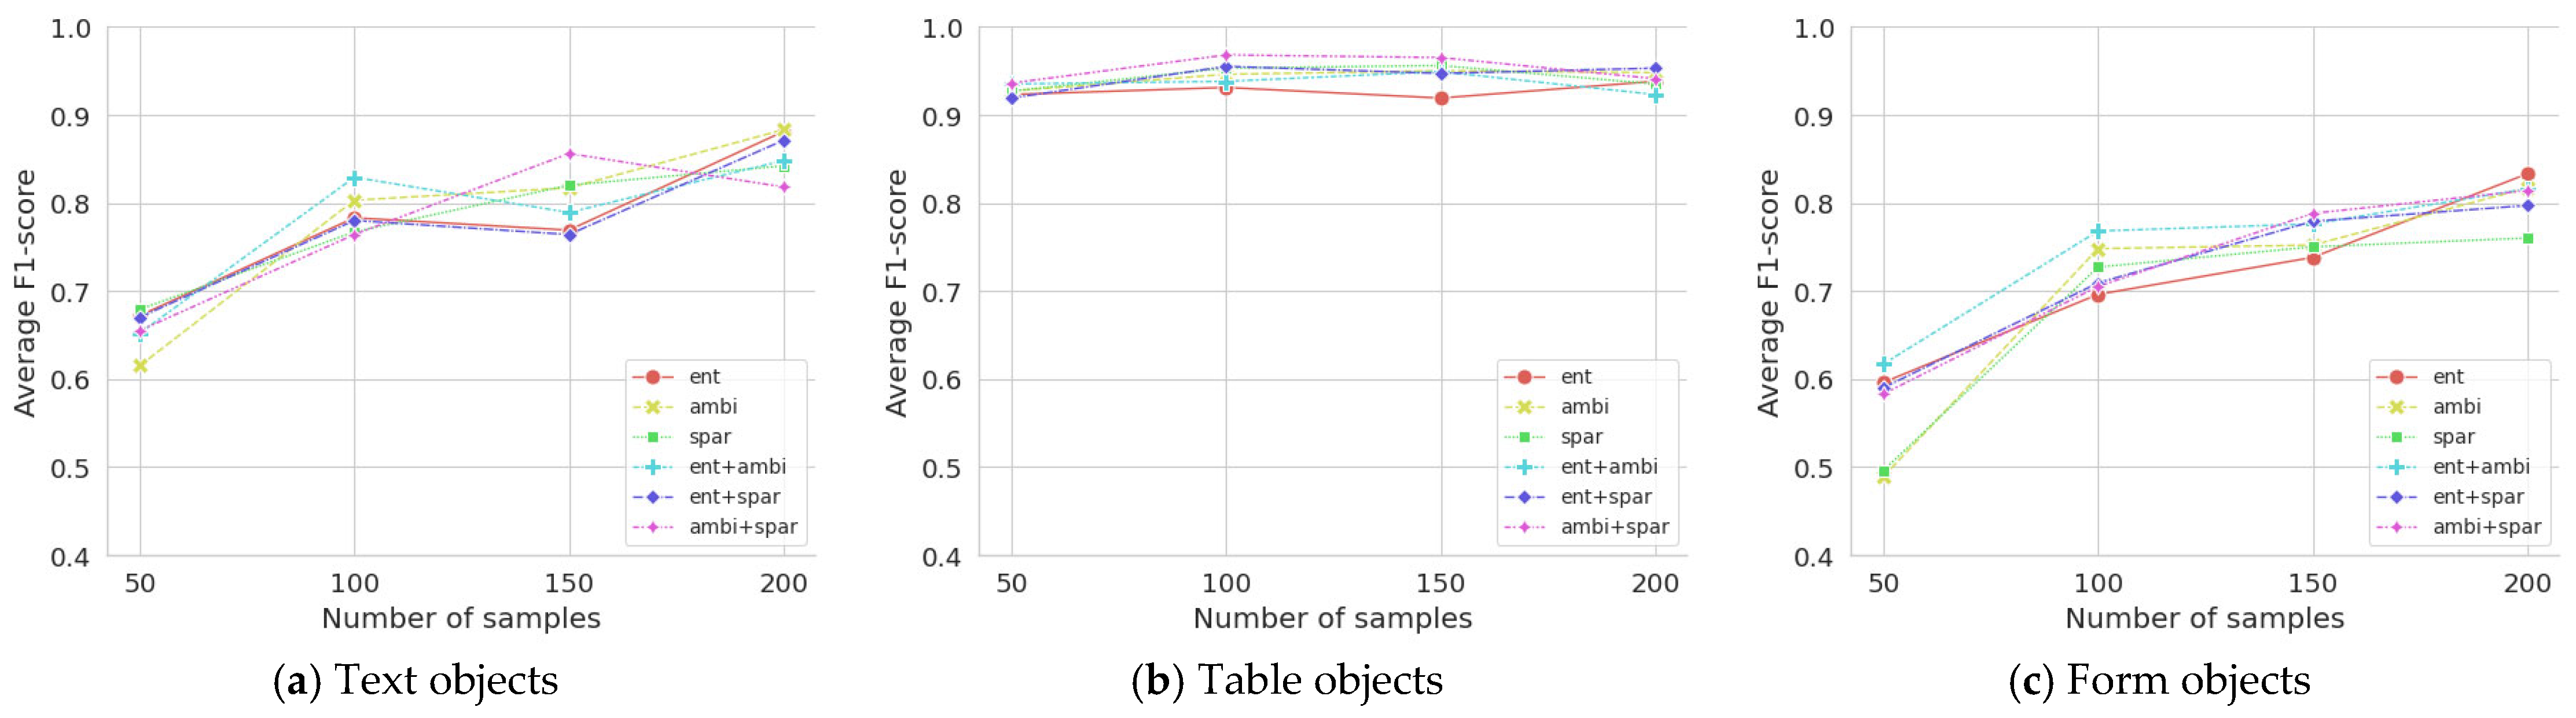
In addition, average F1-scores are presented in Table 3 and graphed in Figure 5 to compare the performance of object detection by document components such as texts, tables, and forms. Table objects showed high F1 scores from the beginning because they were easy to detect due to the lines they contained, but for text and form objects, rapid performance improvement was found as the number of samples increased.
Table 3.
Average F1-scores for three document components with an increasing number of samples. Bold indicates the best measure in each experiment.
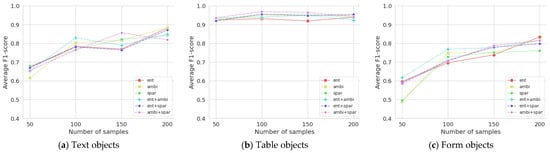
Figure 5.
Average F1-scores for three document components with an increasing number of samplings.
6. Conclusions and Future Work
In this study, a cost-effective ATL framework was presented to fine-tune a pretrained DOD model with new images in another domain. To this end, three new sampling measures for active learning were proposed to efficiently sample unlabelled images, thereby reducing the time and effort required for image labelling.
In the experiments, the pretrained DOD model for the ITB documents of a Korean company (source domain) was transferred to the DOD model for the ITB documents of the Philippine government (target domain). The experimental results showed that the proposed ATL framework was cost-efficient because it could achieve good performance by labelling only half of the training samples instead of using all the labelled images.
In particular, the newly proposed sampling measure ambiguity performed better in terms of the F1-score on the ATL framework. This measure evaluates the degree of class confusion in an image when a pretrained DOD model detects document objects in a document image. In addition, the combination of two sampling measures, namely ambiguity and entropy, can improve the sampling performance of the ATL framework.
Transfer learning is widely used in image processing, but it still requires too much time and effort to annotate all unlabelled data for transfer learning. Therefore, the cost-effective ATL method proposed in this study is expected to save time and cost. Additionally, this study proposes new measures that surpass existing sampling measures for active learning.
This study evaluated the performance of the proposed sampling measures on ATL for detecting three types of objects, text, form, and table, using the Faster R-CNN algorithm for ITB documents stored as images. In addition to Faster R-CNN, this study requires comparative experiments on various detection algorithms, such as Sparse R-CNN [20], ViTDet [21], and YOLOv12 [22], in future studies. In addition to ITB documents, it is necessary to verify the performance of the proposed sampling measures such as HUA and EER on other types of engineering documents. Furthermore, this study focused on only three components, text, form, and table, because the purpose was to extract structured text for OCR. However, in the future, more experimental research is needed on the detection and additional processing of image components from engineering documents.
Author Contributions
Conceptualization, Y.-R.H. and J.-Y.J.; methodology, Y.-R.H. and D.P.; software, Y.-R.H.; validation, Y.-R.H. and Y.-S.H.; data curation, Y.-R.H. and D.P.; writing—original draft preparation, Y.-R.H. and D.P.; writing—review and editing, Y.-S.H., and J.-Y.J.; visualization, Y.-R.H. and Y.-S.H.; supervision, J.-Y.J.; project administration, J.-Y.J.; and funding acquisition, J.-Y.J. All authors have read and agreed to the published version of the manuscript.
Funding
This work was supported by the Korea Evaluation Institute of Industrial Technology (KEIT) grant funded by the Korean government (MOTIE) (Electronics Technology Development Project, No. RS-2024-00442354) and was partly supported by the Institute of Information and Communications Technology Planning and Evaluation (IITP) grant funded by the Korean government (MSIT) (No. RS-2022-00155911, Artificial Intelligence Convergence Innovation Human Resources Development (Kyung Hee University)).
Data Availability Statement
Data derived from public domain resources [https://www.ppa.com.ph/ppa_itbpage] accessed on 15 March 2025.
Conflicts of Interest
The authors declare no conflicts of interest.
References
- Xie, L.; Lu, Y.; Furuhata, T.; Yamakawa, S.; Zhang, W.; Regmi, A.; Kara, L.; Shimada, K. Graph neural network-enabled manufacturing method classification from engineering drawings. Comput. Ind. 2022, 142, 103697. [Google Scholar] [CrossRef]
- Xia, T.; Dai, Z.; Huang, Z.; Liu, L.; Luo, M.; Wang, F.; Zhang, W.; Zhou, D.; Zhou, J. Establishment of Technical Standard Database for Surface Engineering Construction of Oil and Gas Field. Processes 2023, 11, 2831. [Google Scholar] [CrossRef]
- Xia, T.; Dai, Z.; Zhang, Y.; Wang, F.; Zhang, W.; Xu, L.; Zhou, D.; Zhou, J. Construction Method and Practical Application of Oil and Gas Field Surface Engineering Case Database Based on Knowledge Graph. Processes 2024, 12, 1088. [Google Scholar] [CrossRef]
- Fateh, A.; Fateh, M.; Abolghasemi, V. Enhancing optical character recognition: Efficient techniques for document layout analysis and text line detection. Eng. Rep. 2024, 6, e12832. [Google Scholar] [CrossRef]
- Li, K.; Wigington, C.; Tensmeyer, C.; Zhao, H.; Barmpalios, N.; Morariu, V.I.; Manjunatha, V.; Sun, T.; Fu, Y. Cross-domain document object detection: Benchmark suite and method. In Proceedings of the IEEE/CVF Conference on Computer Vision and Pattern Recognition 2020, Seattle, WA, USA, 13–19 June 2020; pp. 12915–12924. [Google Scholar]
- Cheng, H.; Zhang, P.; Wu, S.; Zhang, J.; Zhu, Q.; Xie, Z.; Li, J.; Ding, K.; Jin, L. M6Doc: A large-scale multi-format, multi-type, multi-layout, multi-language, multi-annotation category dataset for modern document layout analysis. In Proceedings of the IEEE/CVF Conference on Computer Vision and Pattern Recognition 2023, Vancouver, BC, Canada, 17–24 June 2023; pp. 15138–15147. [Google Scholar]
- Rausch, J.; Martinez, O.; Bissig, F.; Zhang, C.; Feuerriegel, S. DocParser: Hierarchical document structure parsing from renderings. In Proceedings of the AAAI Conference on Artificial Intelligence 2021, Online, 2–9 February 2021; Volume 35, pp. 4328–4338. [Google Scholar]
- Appalaraju, S.; Jasani, B.; Kota, B.U.; Xie, Y.; Manmatha, R. DocFormer: End-to-end transformer for document understanding. In Proceedings of the IEEE/CVF International Conference on Computer Vision 2021, Montreal, BC, Canada, 11–17 October 2021; pp. 993–1003. [Google Scholar]
- Zamir, A.R.; Sax, R.; Shen, W.; Guibas, L.J.; Malik, J.; Savarese, S. Taskonomy: Disentangling task transfer learning. In Proceedings of the IEEE/CVF Conference on Computer Vision and Pattern Recognition 2018, Salt Lake City, UT, USA, 18–23 June 2018; pp. 3712–3722. [Google Scholar]
- Papacharalampopoulos, A.; Alexopoulos, K.; Catti, P.; Stavropoulos, P.; Chryssolouris, G. Learning More with Less Data in Manufacturing: The Case of Turning Tool Wear Assessment through Active and Transfer Learning. Processes 2024, 12, 1262. [Google Scholar] [CrossRef]
- Peng, Z.; Zhang, W.; Han, N.; Fang, X.; Kang, P.; Teng, L. Active transfer learning. IEEE Trans. Circuits Syst. Video Technol. 2019, 30, 1022–1036. [Google Scholar] [CrossRef]
- Kolor, E.; Usman, M.; Boonyubol, S.; Mikami, K.; Cross, J.S. Advances in Palladium-Based Membrane Research: High-Throughput Techniques and Machine Learning Perspectives. Processes 2024, 12, 2855. [Google Scholar] [CrossRef]
- Park, Y.; Choi, W.; Kim, S.; Han, D.J.; Moon, J. Active learning for object detection with evidential deep learning and hierarchical uncertainty aggregation. In Proceedings of the Eleventh International Conference on Learning Representations 2023, Kigali, Rwanda, 1–5 May 2023. [Google Scholar]
- Yang, C.; Huang, L.; Crowley, E.J. Plug and play active learning for object detection. In Proceedings of the IEEE/CVF Conference on Computer Vision and Pattern Recognition 2024, Seattle, WA, USA, 16–22 June 2024; pp. 17784–17793. [Google Scholar]
- Desai, S.V.; Balasubramanian, V.N. Towards fine-grained sampling for active learning in object detection. In Proceedings of the IEEE/CVF Conference on Computer Vision and Pattern Recognition Workshops 2020, Seattle, WA, USA, 14–19 June 2020; pp. 924–925. [Google Scholar]
- Zhao, G.; Dougherty, E.; Yoon, B.J.; Alexander, F.; Qian, X. Efficient active learning for Gaussian process classification by error reduction. Adv. Neural Inf. Process. Syst. 2021, 34, 9734–9746. [Google Scholar]
- Wu, J.; Chen, J.; Huang, D. Entropy-based Active Learning for Object Detection with Progressive Diversity Constraint. In Proceedings of the IEEE/CVF Conference on Computer Vision and Pattern Recognition 2022, New Orleans, LA, USA, 18–24 June 2022; pp. 9397–9406. [Google Scholar]
- Wang, Z.; Li, Y.; Guo, Y.; Fang, L.; Wang, S. Data-uncertainty guided multi-phase learning for semi-supervised object detection. In Proceedings of the IEEE/CVF Conference on Computer Vision and Pattern Recognition 2021, Nashville, TN, USA, 20–25 June 2021; pp. 4568–4577. [Google Scholar]
- Ren, S.; He, K.; Girshick, R.; Sun, J. Faster r-cnn: Towards real-time object detection with region proposal networks. In Proceedings of the Advances in Neural Information Processing Systems 28 (NIPS 2015), Montreal, QU, Canada, 7–12 December 2015; Volume 28. [Google Scholar]
- Sun, P.; Zhang, R.; Jiang, Y.; Kong, T.; Xu, C.; Zhan, W.; Tomizuka, M.; Yuan, Z.; Luo, P. Sparse R-CNN: An end-to-end framework for object detection. IEEE Trans. Pattern Anal. Mach. Intell. 2023, 45, 15650–15664. [Google Scholar] [CrossRef] [PubMed]
- Li, Y.; Mao, H.; Girshick, R.; He, K. Exploring plain vision transformer backbones for object detection. arXiv 2022, arXiv:2203.16527. [Google Scholar]
- Tian, Y.; Ye, Q.; Doermann, D. YOLOv12: Attention-centric real-time object detectors. arXiv 2025, arXiv:2502.12524. [Google Scholar]
Disclaimer/Publisher’s Note: The statements, opinions and data contained in all publications are solely those of the individual author(s) and contributor(s) and not of MDPI and/or the editor(s). MDPI and/or the editor(s) disclaim responsibility for any injury to people or property resulting from any ideas, methods, instructions or products referred to in the content. |
© 2025 by the authors. Licensee MDPI, Basel, Switzerland. This article is an open access article distributed under the terms and conditions of the Creative Commons Attribution (CC BY) license (https://creativecommons.org/licenses/by/4.0/).